Study of Hexane Adsorption on Activated Carbons with Differences in Their Surface Chemistry


1
Departamento de Química, Facultad de Ciencias, Universidad Nacional de Colombia, Sede Bogotá, Carrera 30 No 45-03, Bogotá 111321, Colombia
2
Departamento de Química, Facultad de Ciencias, Universidad Nacional de Colombia, Sede Bogotá, Carrera 30 No 45-03, Bogotá 111321, Colombia
3
Departamento de Química, Facultad de Ciencias, Universidad de los Andes, Carrera 1 este No 18A-10, Bogotá 111321, Colombia
*
Author to whom correspondence should be addressed.
Molecules 2018, 23(2), 476; https://doi.org/10.3390/molecules23020476
Submission received: 4 December 2017
/
Revised: 9 February 2018
/
Accepted: 12 February 2018
/
Published: 22 February 2018
(This article belongs to the Section Physical Chemistry)
Abstract
:The study of aliphatic compounds adsorption on activated carbon can be carried out from the energetic change involved in the interaction; the energy values can be determined from isotherms or by the immersion enthalpy. Vapor phase adsorption isotherms of hexane at 263 K on five activated carbons with different content of oxygenated groups and the immersion enthalpy of the activated carbons in hexane and water were determined in order to characterize the interactions in the solid–liquid system, and for calculating the hydrophobic factor of the activated carbons. The micropore volume and characteristic energy from adsorption isotherms of hexane, the BET (Brunauer–Emmett–Teller) surface area from the adsorption isotherms of N2, and the area accessible to the hexane from the immersion enthalpy were calculated. The activated carbon with the lowest content of oxygenated groups (0.30 µmolg−1) and the highest surface area (996 m2g−1) had the highest hexane adsorption value: 0.27 mmol g−1; the values for Eo were between 5650 and 6920 Jmol−1 and for ΔHim were between −66.1 and −16.4 Jg−1. These determinations allow us to correlate energetic parameters with the surface area and the chemical modifications that were made to the solids, where the surface hydrophobic character of the activated carbon favors the interaction.
1. Introduction
Activated carbons are adsorbent solids that can develop different degrees of hydrophobicity, according to the oxygenated group content on the surface; this property favors the adsorption of organic compounds (aliphatic) of low molecular weight that may be present in the atmosphere increasing its levels of contamination [1]. In recent years, such compounds have been called volatile organic compounds (VOCs) and show high vapor pressure at room temperature, which allows them to easily reach the gas phase, in case of spills or leaks. VOCs are toxic and lethal to humans and cause environmental degradation [2].
As porous material, activated carbon has a high surface area and pore volume, which makes it a good adsorbent in both gas and liquid phase processes; another advantage is its versatility in fabrication, i.e., the possibility of modifying its porous structure and surface chemistry based on the requirements established in a specific application [3].
Due to the inert nature of the activated carbon surface, the affinity for low molecular weight molecules such as nitrogen or oxygen at room temperature or polar molecules such as water is very low. This very nature affords it a high affinity for non-polar molecules of a certain volume and molecular weight (e.g., hydrocarbons). This difference in affinity entails that activated carbon is a suitable adsorbent when gas phase separation or purification is performed [4].
There is much research reported in the literature about the adsorption of VOCs on activated carbons [5,6,7,8,9,10,11,12,13,14]. Among these compounds is hexane (C6H14), which is a non-polar compound of a linear aliphatic chain and establishes an interaction of a dispersive type with the adsorbent. Hexane partly constitutes gasoline and is used in the extraction of edible seed products and vegetable crops (e.g., soy, peanuts, and corn), as a cleaning agent (degreaser) in the printing industry, as a solvent in polymerization reactions, and in the development of certain adhesive products, lacquers, varnishes, inks, cements, and paints. It is also used as an alcohol denaturant and in thermometers for low temperatures, instead of mercury. Finally, in the laboratory, it is used as a solvent and as a raw material in synthesis.
However, its removal is relevant since acute and short-term exposure (by inhalation) affects the central nervous system (CNS) with such afflictions as dizziness, vertigo, nausea, headache, numbness of the feet and hands, and muscle weakness in the legs and feet. Continuous or chronic exposure is associated with dyschromatopsia, polyneuropathy in humans (sensitivity, muscular strength, and mobility affection), in turn, can cause paralysis of the arms and legs with numbness in the extremities, muscle weakness, blurred vision, headache, and fatigue [15,16,17,18,19].
The study of the adsorption of aliphatic compounds (such as hexane) on activated carbon can be carried out from the point of view of energetic change. This change involves interaction between the adsorbent and the adsorbate; the energy values can be determined by the gas phase isotherms or by the energy released when the compound in liquid phase contacts the solid [20].
The enthalpy of immersion allows one to determine, depending on the thermodynamic conditions of the system, the energy transfer that occurs when a solid and a liquid are brought into contact with each other. The thermal effects resulting from submerging a solid in a solvent, generally of a non-polar type, with which the solid does not present chemical interactions, are related to the surface area of the considered solid through the models developed by Dubinin and Stoeckli [21].
For an activated carbon with a micropore volume, Wo, a characteristic energy, Eo, and an adsorbate in liquid phase with molar volume, Vm, Stoeckli and Kraehenbüehl [22] proposed the equation
![Molecules 23 00476 i001]()

The relationship between the enthalpy of immersion and the micropore volume, which indicates that enthalpy corresponds to the micropore filling process and to the wetting of open or non-porous surfaces, is shown.
The experimental enthalpy of immersion, ΔHexp, of an activated carbon contains two types of contributions: one due to the interaction of the adsorbate with micropores and the other to the wetting of the external surface, Sext, as described by Stoeckli, Bansal, and Donnet [23]. This can be expressed by
![Molecules 23 00476 i002]() where hi represents the specific enthalpy, which is determined with different immersion liquids for solids that do not have porosity [24].
where hi represents the specific enthalpy, which is determined with different immersion liquids for solids that do not have porosity [24].

From the above equation, the external surface can be calculated once the specific enthalpy, hi, is known:
![Molecules 23 00476 i003]()

This equation shows that the determination of the enthalpy of immersion of an activated carbon in a non-polar liquid solvent allows one to calculate the total area of the solid; when the activated carbon has no external surface or development of meso- and macropores, the experimental enthalpy, ΔHexp, is similar to the enthalpy, ΔHim, calculated with the Stoeckli–Kraehenbüehl equation.
Thus, it is interesting to quantify not only how the adsorbed amount of hexane is affected by differences in the surface of a series of activated carbons, but also what change in the solid–adsorbate interaction energy determines its adsorption. Other authors have studied hexane adsorption in porous materials, such as activated carbons, activated carbon cloths, and activated carbon fiber cloths, using solids with different precursors and different preparation and modification methods and generating diverse chemical and textural properties, and found areas between 502 and 1565 m2g−1 and adsorption capacities between 1.030 and 5.730 mmolg−1.
These adsorption capacities have higher values than those reported in this work, possibly due to the fact that the samples used in the previously reported investigations are highly microporous; in addition, the adsorption occurred at higher temperatures, increasing the value of the saturation pressure, which is proportional to the number of moles injected from the gas phase, increasing the amount of adsorption [25,26,27,28,29,30,31,32].
With regard to immersion enthalpy values, the values shown in this work (between −16.4 and −66.1 Jg−1) are consistent with previously reported values, these are between −25.23 and −127.8 Jg−1 for highly microporous activated carbons, with areas between 752 and 1208 m2g−1 [33,34].
In this work, the hexane adsorption isotherms on activated carbons with different surface physicochemical properties are determined, and the enthalpies of the immersion of the solids in hexane and water are calculated. This is done to establish the difference between the micropore volume and surface area values obtained by the isotherms of the adsorption of both N2 and hexane, and to establish the relationships between the enthalpy of immersion, the surface area of the activated carbon, and the characteristic energy of adsorption obtained from the adsorption isotherms of hexane and the immersion calorimetries of the modified solids in hexane.
2. Results and Discussion
2.1. Relationship between the Physicochemical Characteristics of Activated Carbons and Gas Phase Adsorption Isotherms of Hexane
Table 1 presents physicochemical characteristics of the activated carbons of this study, including the surface area obtained by the BET (Brunauer–Emmett–Teller) model, the micropore volume calculated by the DR (Dubinin-Radushkevich) model, the average size pore determined by the QSDFT (Quenched Solid State Functional Theory model, based on the adsorption isotherms of N2 and the total oxygenated functional group content on the surface [35]. It can be seen that the apparent surface area values increase proportionally with the thermal treatment carried out on the samples; however, the micropore volume values are quite similar, which may be due to two processes, oxidation and subsequent thermal treatment: The first is the decrease in microporosity due to oxidation and the subsequent increase due to the increase in temperature, generating opposite effects; if this occurs, microporosity values similar to the starting sample will be obtained. The second is the widening of supermicropores, which would give rise to greater mesoporosity; this would increase the surface area but would not significantly increase the volume of micropore. Besides, a higher mesoporosity can be due to a greater amount of oxygen functional groups that generates more active adsorption sites [36].
On the other hand, when the content of oxygenated groups is obtained by Boehm titrations, the groups determined correspond to lactonic, carboxylic, and phenolic groups present in the samples. When the heat treatment was performed, a decrease in the amount of oxygenated groups was evidenced as the activation temperature increased because carboxylic groups decompose between 523 and 673 K, lactones between 673 and 923 K, and phenols between 873 and 1073 K, and the quinone and pyrone groups decompose at temperatures above 1173 K [37,38]. From there, activated carbon at 1173 K shows the lowest amount of carboxylic, lactone and phenol groups. In the modification with nitric acid, an increase in the presence of evaluated oxygenated groups was observed, which was due to the oxidation produced by the HNO3, which leads to the formation of acidic groups on the activated carbon surface, favoring mainly the formation of carboxylic groups [39].
Figure 1 shows the adsorption isotherms of hexane at 263 K for the five activated carbons of this study. The highest values of millimoles of hexane adsorbed were the ones of the activated carbons exposed to thermal activation, and these quantities increased when the temperature of activation increased. The adsorption data have an uncertainty of 1 × 10⁻⁴ on the scale of mmolg−1, which allows one to distinguish between adsorption values in the same isotherm and shows differences in the adsorption of the activated carbons that are studied; for example, for CAG and CAON for relative pressures greater than 0.7, the adsorption values of each point are different, although those are low values.
Later, the isotherms were fitted to the Langmuir and Freundlich models. Langmuir model parameters were determined, such as the monolayer adsorption capacity (nm), the Langmuir constant (b), and the correlation coefficient of the plots. According to the Freundlich model, the constant value, the 1/n parameter, and the correlation coefficient were calculated. The data are shown in Table 2.
The adsorption isotherms are adjusted to the two models. Regarding the parameter 1/n, there are heterogeneous structure for all samples (all values are less than 1), and the intensity of interactions between the solid and the hexane increases proportionally with the temperature of the heat treatment. On the other hand, Kf and nm are related to adsorption capacity. The results corroborate the influence of thermal changes on the adsorption process, since these changes increase the adsorption capacity of hexane even in the samples that were oxidized [40,41]. Concerning the Langmuir model, CAG1173 showed the highest adsorption capacity (0.27 mmolg−1), evidencing a fivefold increase with respect to the adsorption of the starting activated carbon CAG (0.05 mmolg−1), followed by the solid CAON1023 (0.19 mmolg−1) and finally by the activated carbon CAON723 being treated at a lower temperature (0.09 mmolg−1).
In the adsorption of hexane for the activated carbon treated with a nitric acid solution, a decrease and the lowest value for the series of the five solids was evidenced. The heat treatment at temperatures between 723 and 1173 K favored the area available for the adsorption of hexane molecules on the solid. The chemical modification restricted the path of the molecules to the porous network.
The increase in the temperature caused the removal of surface groups. At temperatures near 723 K, carboxylic groups of the surface were removed, and, at 1023 K, some anhydrides and lactones were decomposed. At 1173 K, the groups mentioned above were removed, as were carbonyls, phenolics, ethereal groups, and some quinones. Treatment with the HNO3 solution generated a greater amount of oxygenated surface groups, such as carboxylic, lactonic, and phenolic groups, which made the entrance of the hexane to the porous network difficult and even generated inaccessibility to certain regions of the solid in the edges of the graphene layers [42,43,44,45].
2.2. Relationship between the Physicochemical Characteristics of Activated Carbons and the Enthalpy of Immersion
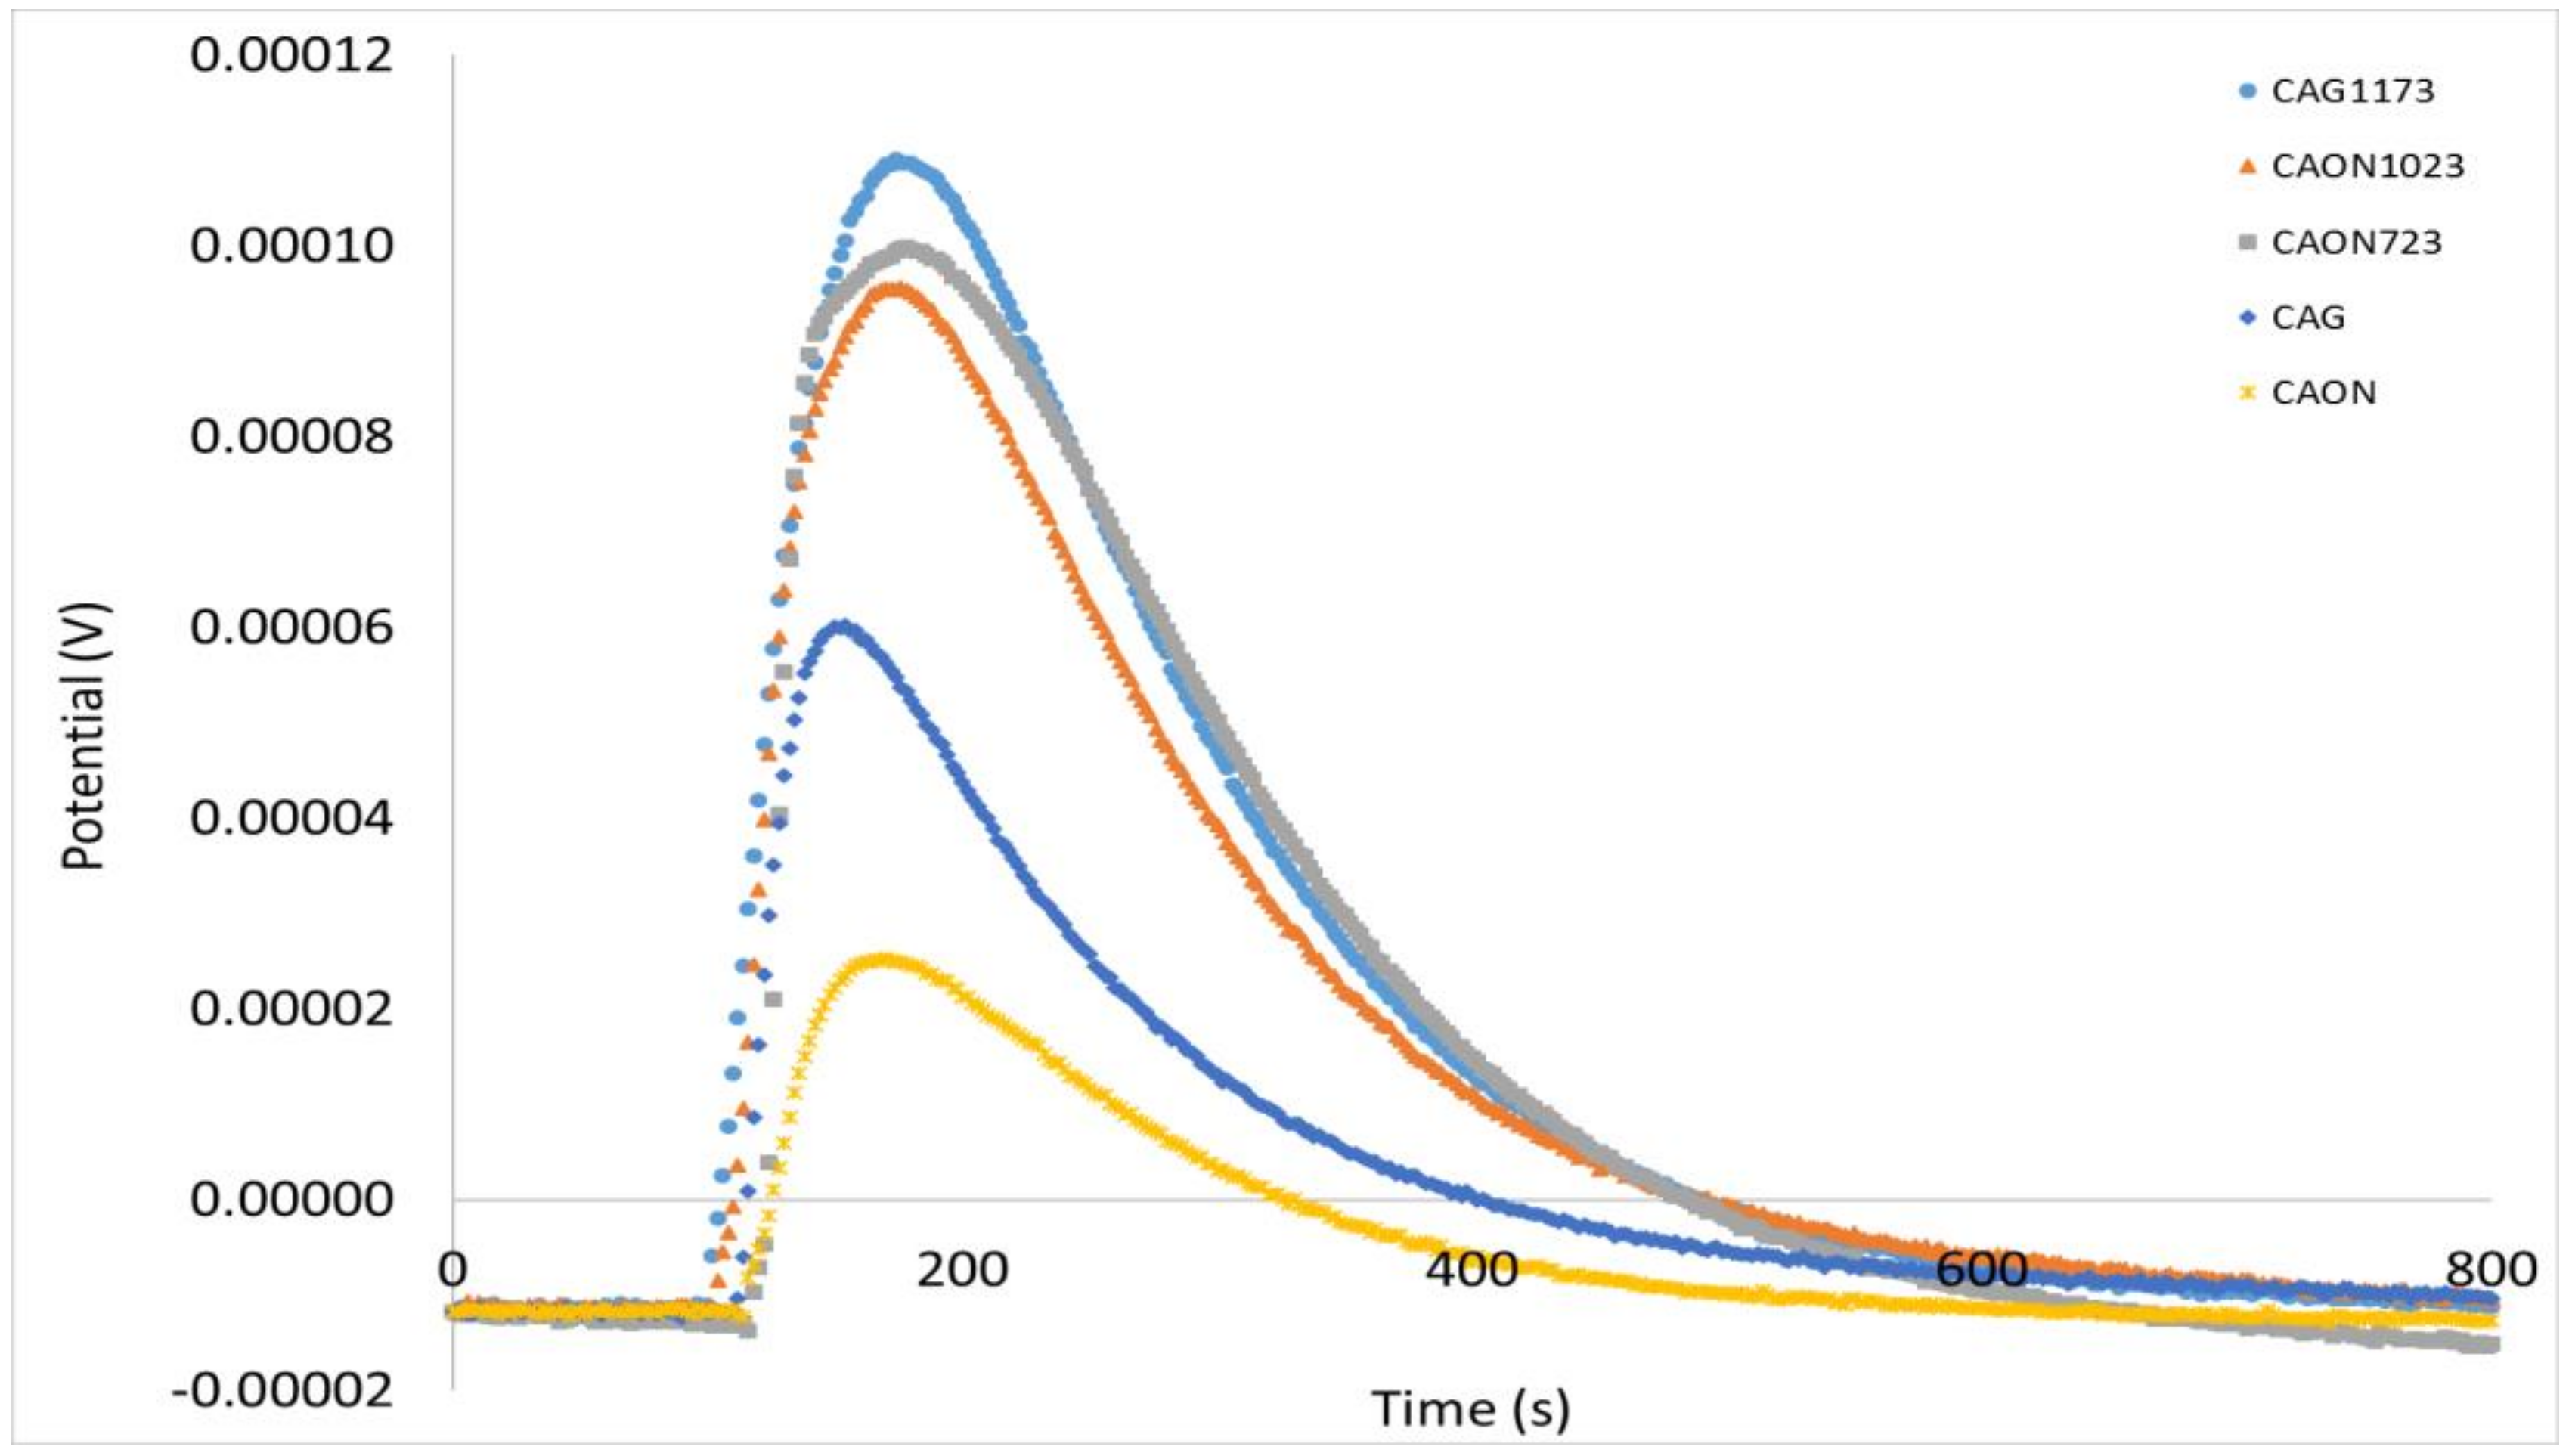
Figure 2 shows the plot of electrical potential as a function of time, obtained for the immersion of the activated carbons into hexane. These data allows one to calculate the enthalpy of immersion. The immersion of solids was also performed in water. The values derived from calorimetric determinations were performed in triplicateand the standard deviation isbetween 0.33 and 2.65 Jg−1. Based on the enthalpy of immersion in hexane and water, the hydrophobic factor of the solids was calculated with respect to hexane [46]. The enthalpy of immersion of hexane and water, as well as the hydrophobic factor are shown in Table 3.
The area of the peak under the potential curve as a function of time is proportional to the amount of heat generated in the solid–liquid contact. It was observed that the activated carbon with the highest peak in the hexane immersion is the one that was heat-treated at 1173 K and had the lowest oxygenated group content at the surface, showing that the decrease of oxygenated groups on the surface increased the enthalpy of immersion of the solid in the aliphatic solvent [46]. The effect that the immersion produces increases the potential of the thermal sensor, indicating that the process is exothermic and involves interactions between the components of the solid–liquid system being studied.
The values of the enthalpy of immersion of the activated carbons in water were also exothermic, but of a smaller magnitude for the solids that were heat-treated; for the CAG and CAON, the values of the enthalpy of immersion in water are higher than those in hexane.
A relationship between the enthalpy of immersion of the activated carbon in hexane and the micropore volume calculated by the Dubinin–Radushkevich model was established for both N2 and hexane isotherms. The results are presented in Figure 3. In Table 4, the area accessible to hexane, the characteristic energy of adsorption (Eo), and the micropore volume (Vo) calculated by the DR model from the adsorption isotherms of C6H14 are shown.
The values for the micropore volume were lower when they were calculated from the hexane isotherms compared with when they were determined for the N2 isotherms, because the hydrocarbon molecule has a larger size than nitrogen; therefore, the capacity to occupy the pores that are classified in the range of micropores is smaller.
It was observed in both cases that, as the volume of micropores increased, the value of the enthalpy of immersion increased too, which reflects the interaction of hexane with the surface of the solid [22].
As is known, the enthalpy of immersion of a solid into a liquid that produces dispersive interactions (solid–liquid contact) is proportional to the surface area of the solid [21]. The relationship between the surface area of the activated carbon and the enthalpy of immersion in hexane is presented in Figure 4.
The proportionality between the two parameters exists because there is a larger space available for the entrance of the molecules and this generates a greater interaction between the adsorbate and the porous structure.
An activated carbon with a higher specific surface area and a greater interaction was CAG1173, which presented a higher surface area due to the selective removal of oxygenated groups and produced higher values of enthalpy of immersion because of the affinity between the adsorbate and the carbonaceous structure.
The activated carbon CAON had the lowest surface area value and the lowest enthalpic interaction because the surface oxygenated groups decreased the available space of the activated carbon for the hexane entry and generated less interaction with the molecules because of its polar character.
2.3. Relationship between the Energetic Characterization (Characteristic Energy and Enthalpy of Immersion) and Physicochemical Characteristics of Activated Carbons
The characteristic energy of adsorption, Eo, for the activated carbons from the hexane adsorption isotherms was calculated (Table 4). This is an energy parameter typical of each adsorbate–adsorbent system. Figure 5 shows the relationship between the enthalpy of immersion of the activated carbon in hexane and the characteristic energy of hexane adsorption on the solids, which are the two energetic characteristics that are calculated in this study.
Figure 5 shows the energetic property, ΔHim, determined in liquid phase, and another energetic property, Eo, determined in vapor phase. Increasing the characteristic energy of adsorption decreased the enthalpy of immersion, so the hexane adsorption process in the set of activated carbons was favored when the enthalpy of immersion values were higher and the characteristic energy of adsorption was lower.
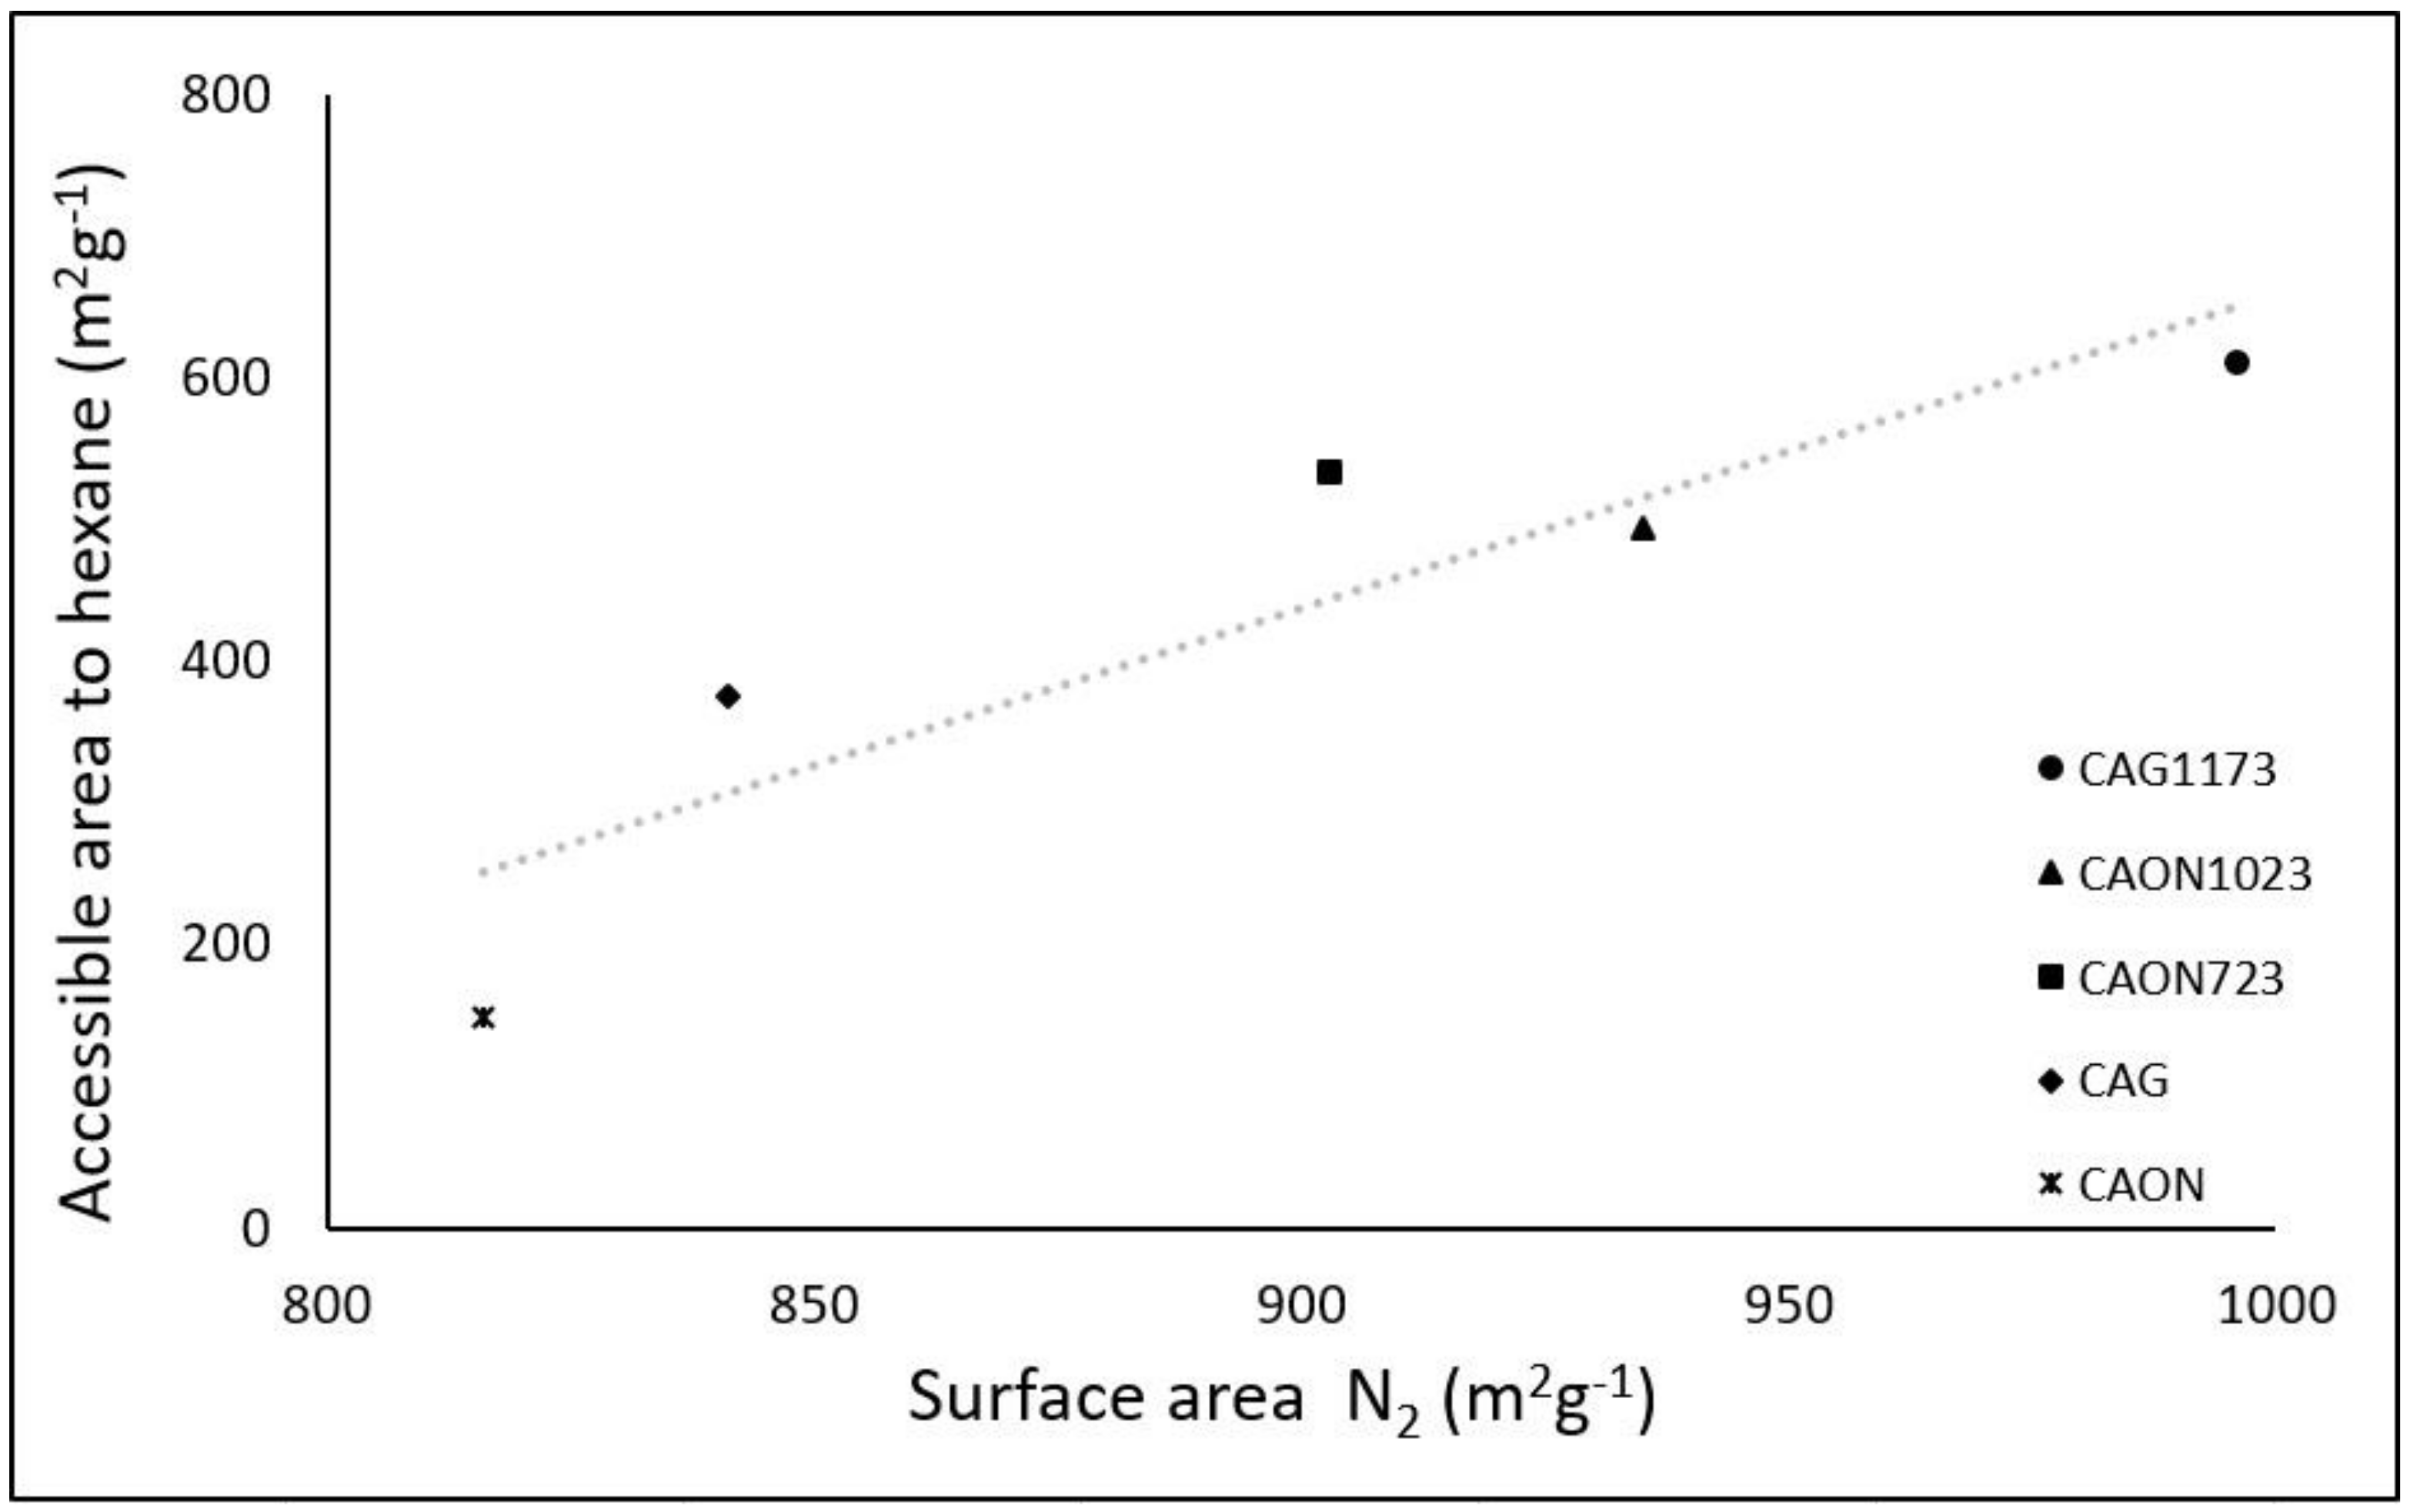
As mentioned in the introduction, based on the enthalpy of immersion of the activated carbon in hexane, the area accessible to hexane can be calculated by knowing the surface enthalpy value [47], which for hexane is −0.108 Jm2. If the surface area calculated from the N2 adsorption isotherm via the BET model and the area accessible to hexane are known, a relationship can be established, as shown in Figure 6.
The values of the BET surface area were higher than those obtained for the area accessible to hexane due to the difference in the size of the two molecules, but a direct proportional relationship between the two values was observed. This result confirms that the molecule of each adsorbate occupies a certain space on the surface of the solid. Depending on the molecular size, there will be sites of the solid that larger molecules cannot access. This is consistent with values found for the average pore width, which is between 0.753 and 0.785 nm according to the QSDFT model (Table 1), showing that the nitrogen molecule with a molecular size of 0.29 nm can enter the porous structure more easily compared to the hexane molecule, whose molecular size is 0.67 nm, quite close to the average pore width value determined for the samples.
Finally, the hydrophobic factor of the activated carbons with respect to the hexane was calculated. The hydrophobic factor, hf, is a relationship between the enthalpy of immersion of the activated carbons in hexane and the enthalpy of immersion in water and allows one to establish a scale of hydrophobicity of the surface of the solid [48].
The hydrophobic factor was related to the surface area and the enthalpy of immersion of the activated carbons in hexane, and the results are presented in Figure 7.
It was observed that, as the hydrophobic factor increased, both the BET surface area and the enthalpy of immersion in hexane increased. Thus, the interaction of hexane with the surface of the solids increased when the content of surface groups diminished and thus predominated the hydrophobic character on the surface such that the interaction with hexane was greater. The BET surface area and the enthalpy of immersion are directly proportional properties and they are affected by the content of oxygenated groups on the surface.
3. Materials and Methods
3.1. Activated Carbon
The modification of a starting activated carbon prepared from coconut shell by physical activation (CAG) was carried out. It was sieved to a particle size of 1 mm and was washed with distilled water, then dried for 24 h at 363 K and stored in containers under a nitrogen atmosphere.
Two types of treatment were carried out on CAG: a chemical modification of oxidation with HNO3 6 M solution for the development of oxygenated surface groups (CAON) and a thermal treatment in an inert atmosphere (N2), allowing for the selective decomposition of superficial groups, giving rise to five samples. The denomination of the activated carbons and the chemical and thermal treatments to which the activated carbons were subjected are shown in Table 5.
3.2. Nitrogen Adsorption Isotherms
The nitrogen adsorption isotherms were performed at 77 K in an Autosorb 3B, Quantachrome equipment to determine the apparent surface area and the micropore volume using the BET and Dubinin–Radushkevich models, respectively.
3.3. Boehm Titrations
Boehm titrations are used to determine the oxygenated group content (lactonic, phenolic, and carboxylic surface groups) of activated carbons: 0.5 g of activated carbon were weighed and mixed with 50 mL of NaOH, Na2CO3, NaHCO3, and HCl 0.1 M solutions. Subsequently, they were kept under stirring and at a constant temperature of 293 K for five days. Finally, an aliquot of 10 mL of each of the solutions in contact with the solid was taken and titrated with previously standardized HCl (NaOH, Na2CO3, NaHCO3) or NaOH (HCl) [49,50]. The titrations were carried out using a CG 840B Schott potentiometer.
3.4. Hexane Adsorption Isotherms
The gas-phase adsorption isotherms of hexane (Merck-brand analytical reagent) on the activated carbons were determined in a sortometer assembled in the laboratory. The equipment has a cell for the adsorptive with a capacity of 5.0 mL. The hexane moves through a stainless steel pipe and is stored in a tank. The temperature is regulated to 343 K to reach the gas phase, after which it is displaced to a glass cell where the activated carbon is located with a fixed isotherm temperature (263 K). The adsorption process is controlled by five valves that regulate the pressure of the system, which is measured by means of a digital sensor. The system has a Pfeiffer vacuum pump and an Edwards diffuser pump, which allows for a minimum pressure of approximately 3 × 10⁻² mbar. The temperature of the system is also controlled by a Cole Parmer thermostat (263 K). Data collection is carried out through a digital multimeter and Extech software that captures the change in electric potential as a function of time. The electric potential is converted to pressure to obtain one point of the isotherm.
3.5. Enthalpy of Immersion of Activated Carbon in Solvents
Activated carbons were immersed in hexane and water to determine the enthalpy of immersion and to quantify the hydrophobic/hydrophilic character of the solids. To determine the enthalpy of immersion, 10 mL of the solvent were placed in a stainless steel cell assembled to the main heat reservoir of the calorimeter at 298 K; then, 100 mg of each activated carbon were weighed and placed in a glass vial fitted to the calorimeter cell designed for this purpose. Next, the system was left to sit for approximately 1 h, until the temperature of the calorimetric assembly stabilized or or the time required for stabilization of the calorimeter; later, the immersion of the sample into the liquid was performed, and the resulting thermal changes were recorded until the baseline was attained again. Finally, a post-period of 20 min was recorded and the experience of the electric calibration was executed [51].
4. Conclusions
The determination of the hexane adsorption isotherm on a series of activated carbons and the enthalpy of immersion of these in hexane allowed us to determine two energetic parameters—the characteristic energy of adsorption, Eo, and the enthalpy of immersion, ΔHim—that characterize the activated carbon–hexane system, with values for Eo between 5650 and 6920 Jmol−1 and for ΔHim between −66.1 and −16.4 Jg−1.
The micropore volume values for N2 and hexane adsorption were calculated. The values of the micropore volume for the hexane adsorption are lower because it has a larger molecular size.
It was observed that the hydrophobic character of the surface of the activated carbon favors the interaction with the hexane.
Acknowledgments
The authors thank the Framework Agreement between the Universidad de los Andes and the Universidad Nacional de Colombia and the act of agreement established between the Chemistry Departments of the two universities. The authors also appreciate the grant for the funding of research programs for Associate Professors, Full Professors, and Emeritus Professors, announced by the Faculty of Sciences of the Universidad de los Andes (Colombia), 11-28-2017, 2018–2019, according to the project "Thermodynamic Characterization of the Adsorption of Contaminants on Porous Adsorbents". To the Colciencias Scolarship “Doctorados Nacionales 2016” Convocation 727.
Author Contributions
D. Hernández-Monje, L. Giraldo and J.C. Moreno-Piraján conceived and designed the experiments; D. Hernández-Monje performed the experiments; D. Hernández-Monje, L. Giraldo and J.C. Moreno-Piraján analyzed the data; L. Giraldo and J.C. Moreno-Piraján contributed reagents, materials and analysis tools; D. Hernández-Monje, L. Giraldo and J.C. Moreno-Piraján wrote the paper.
Conflicts of Interest
The authors declare no conflict of interest. The founding sponsors had no role in the design of the study; in the collection, analyses, or interpretation of data; in the writing of the manuscript; or in the decision to publish the results.
References
- Li, L.; Liu, S.; Liu, J. Surface modification of coconut shell based activated carbon for the improvement of hydrophobic VOC removal. J. Hazard. Mater. 2011, 192, 683–690. [Google Scholar] [CrossRef] [PubMed]
- Li, M.; Wu, S.C.; Peng, Y.; Shih, Y. Adsorption of volatile organic vapors by activated carbon derived from rice husk under various humidity conditions and its statistical evaluation by linear solvation energy relationships. Sep. Purif. Technol. 2016, 170, 102–108. [Google Scholar] [CrossRef]
- Bansal, R.; Goyal, M. Activated Carbon and Its Surface Structure. In Activated Carbon Adsorption; Bansal, R., Ed.; CRC Press: Boca Ratón, FL, USA, 2010; pp. 1–65. [Google Scholar]
- Tham, Y.J.; Latif, P.A.; Abdullah, A.M.; Shamala-Devi, A.; Taufiq-Yap, Y.H. Performances of toluene removal by activated carbon derived from durian shell. Bioresour. Technol. 2011, 102, 724–728. [Google Scholar] [CrossRef] [PubMed]
- Yao, X.; Liu, J.; Gong, G.; Jiang, Y.; Xie, Q. Preparation and modification of activated carbon for benzene adsorption by steam activation in the presence of KOH. Int. J. Min. Sci. Technol. 2013, 23, 395–401. [Google Scholar] [CrossRef]
- Pak, S.; Jeon, M.; Jeon, Y. Study of sulfuric acid treatment of activated carbon used to enhance mixed VOC removal. Int. Biodeterior. Biodegrad. 2016, 113, 195–200. [Google Scholar] [CrossRef]
- Mazlan, M.; Uemura, Y.; Yusup, S.; Elhassan, F.; Uddin, A.; Hiwada, A.; Demiya, M. activated carbon from rubber wood sawdust by carbon dioxide activation. Procedia Eng. 2016, 148, 530–537. [Google Scholar] [CrossRef]
- Liu, H.; Yang, B.; Xue, N. Enhanced adsorption of benzene vapor on granular activated carbon under humid conditions due to shifts in hydrophobicity and total micropore volume. J. Hazard. Mater. 2016, 318, 425–432. [Google Scholar] [CrossRef] [PubMed]
- Da Costa Lopes, A.; De Carvalho, S.; Do Socorro Barros, D.; De Alcântara Mendes, R.; Lima, M. Surface modification of commercial activated carbon (CAG) for the adsorption of benzene and toluene. Am. J. Anal. Chem. 2015, 6, 528–538. [Google Scholar] [CrossRef]
- Yang, X.; Yi, H.; Tang, X.; Zhao, S.; Yang, Z.; Ma, Y.; Feng, T.; Cui, X. Behaviors and kinetics of toluene adsorption -desorption on activated carbons with varying pore structure. J. Environ. Sci. 2017, (in press). [Google Scholar] [CrossRef]
- Martínez de Yuso, A.; Izquierdo, M.; Valenciano, R.; Rubio, B. Toluene and n-hexane adsorption and recovery behavior on activated carbons derived from almond shell wastes. Fuel Process. Technol. 2013, 110, 1–7. [Google Scholar] [CrossRef] [Green Version]
- Pei, J.; Zhang, J. Determination of adsorption isotherm and diffusion coefficient of toluene on activated carbon at low concentrations. Build. Sci. 2012, 48, 66–76. [Google Scholar] [CrossRef]
- Tham, Y.; Latif, P.; Abdullah, A.; Shamala-Devi, A.; Taufiq-Yap, Y. Performances of toluene removal by activated carbon derived from durian shell. Bioresour. Technol. 2011, 102, 724–728. [Google Scholar] [CrossRef] [PubMed]
- Tazibet, S.; Boucheffa, Y.; Lodewyckx, P. Heat treatment effect on the textural, hydrophobic and adsorptive properties of activated carbons obtained from olive waste. Microporous Mesoporous Mater. 2013, 170, 293–298. [Google Scholar] [CrossRef]
- Betancur-Sánchez, A.; Vásquez-Trespalacios, E.; Sardi-Correa, C. Impaired colour vision in workers exposed to organic solvents: A systematic review. Arch. Soc. Esp. Oftalmol. (Engl. Ed.) 2017, 92, 12–18. [Google Scholar] [CrossRef]
- Park, H.; Park, H.; Jang, J. Exposure characteristics of construction painters to organic solvents. Saf. Health Work 2016, 7, 63–71. [Google Scholar] [CrossRef] [PubMed]
- US Department of Health and Human Services. Toxicological profile for n-hexane. Available online: http://www.atsdr.cdc.gov/toxprofiles/tp113.pdf/ (accessed on 21 January 2018).
- Environmental Protection Agency. Hexane. Available online: https://www.epa.gov/sites/production/files/2016-9/documents/hexane. pdf/ (accessed on 21 January 2018).
- Bates, M.; Reed, B.; Liu, E.; Eisen, M.; Hammond, S. Solvent exposure and cognitive function in automotive technicians. NeuroToxicology 2016, 57, 22–30. [Google Scholar] [CrossRef] [PubMed]
- Rodríguez, P.; Giraldo, L.; Moreno-Piraján, J.C. Modified surface chemistry of activated carbons. Correlation with immersion enthalpy. J. Therm. Anal. Calorim. 2013, 114, 245–251. [Google Scholar] [CrossRef]
- Stoeckli, F.; Centeno, T.A. On the characterization of microporous carbons by immersion calorimetry alone. Carbon. 1997, 35, 1097–1100. [Google Scholar] [CrossRef]
- Moreno-Piraján, J.C.; Giraldo, L. .; García-Cuello, V., Vargas-Delgadillo, D., Rodríguez-Estupiñán, P., Murillo-Acevedo, Y., Cantillo, M. Thermodynamic of the interactions between gas-solid and solid-liquid on carbonaceous materials. In Thermodynamics/Book 1, Moreno-Piraján, J.C., Eds.; INTECH: Rijeka, Croatia, 2011; pp. 164–195. [Google Scholar]
- Stoeckli, H.F.; Kraehenbuehl, F.; Ballerini, L.; De Bernardini, S. Recent developments in the Dubinin equation. Carbon 1989, 27, 125–128. [Google Scholar] [CrossRef]
- Moreno, J.C.; Giraldo, L. Determination of the immersion enthalpy of activated carbon by microcalorimetry of the heat conduction. Inst. Sci. Technol. 2000, 28, 171–178. [Google Scholar]
- Li, M.; Wu, S.; Peng, Y.; Shih, Y. Adsorption of volatile organic vapors by activated carbon derived from rice husk under various humidity conditions and its statistical evaluation by linear solvation energy relationships. Sep. Purif. Technol. 2016, 170, 102–108. [Google Scholar] [CrossRef]
- Shim, W.G.; Lee, J.W.; Moon, H. Equilibrium and fixed-bed adsorption of n-hexane on activated carbon. Sep. Sci. Technol. 2003, 38, 3905–3926. [Google Scholar] [CrossRef]
- Singh, K.; Mohan, D.; Tandon, G.S.; Gupta, G.S.D. Vapor-phase adsorption of hexane and benzene on activated carbon fabric cloth: Equilibria and rate studies. Ind. Eng. Chem. Res. 2002, 41, 2480–2486. [Google Scholar] [CrossRef]
- Parvulescu, O.; Ion, V.; Dobre, T.; Niu, S.G. The effect of process factors on n-hexane adsorption onto copper impregnated activated carbon. UPB Sci. Bull. Series B 2016, 78, 121–130. [Google Scholar]
- Izquierdo, M.; Martínez de Yuso, A.; Valenciano, R.; Rubio, B.; Pino, M. Influence of activated carbon characteristics on toluene and hexane adsorption: Application of surface response methodology. Appl. Surf. Sci. 2013, 264, 335–343. [Google Scholar] [CrossRef] [Green Version]
- Ramos, M.E.; Bonelli, P.R.; Cukierman, A.L.; Ribeiro Carrott, M.M.L.; Carrott, P.J.M. Adsorption of volatile organic compounds onto activated carbon cloths derived from a novel regenerated cellulosic precursor. J. Hazard. Mater. 2010, 177, 175–182. [Google Scholar] [CrossRef] [PubMed]
- Kim, D.J.; Shim, W.G.; Moon, H. Adsorption equilibrium of solvent vapors on activated carbons. Korean J. Chem. Eng. 2001, 18, 518–524. [Google Scholar] [CrossRef]
- Ryu, Y.; Kim, K.; Lee, C. Adsorption and desorption of n-hexane, methyl ethyl ketone, and toluene on an activated carbon fiber from supercritical carbon dioxide. Ind. Eng. Chem. Res. 2000, 39, 2510–2518. [Google Scholar] [CrossRef]
- Murillo, Y.S.; Giraldo, L.; Moreno-Piraján, J.C. Contribution enthalpic in the interaction of activated carbon with polar and apolar solvents. Arab. J. Chem. 2013, 6, 347–351. [Google Scholar] [CrossRef]
- Almazán-Almazán, M.C.; Domingo-García, M.; Fernández-Morales, I.; López-Garzón, F.J.; Rodríguez-Ramos, I.; Guerrero-Ruiz, A.; Martínez-Alonso, A. Adsorption and microcalorimetric measurements on activated carbons prepared from Polyethylene Terephtalate. Stud. Surf. Sci. Catal. 2007, 160, 185–192. [Google Scholar]
- Hernández-Monje, D.; Giraldo, L.; Moreno-Piraján, J.C. Estudio entálpico de la inmersión de carbones activados granulares modificados en benceno, hexano y ciclohexano. Afinidad Revista de Química Teórica y Aplicada 2016, 74, 291–298. [Google Scholar]
- Li, K.; Jiang, Y.; Wang, X.; Bai, D.; Li, H.; Zheng, Z. Effect of nitric acid modification on the lead(II) adsorption of mesoporous biochars with different mesopore size distributions. Clean Techn. Environ. Policy 2016, 18, 797–805. [Google Scholar] [CrossRef]
- Figueiredo, J.L.; Pereira, M.F.R.; Freitas, M.M.A.; Òrfão, J.J.M. Modification of the surface chemistry of activated carbons. Carbon 1999, 37, 1379–1389. [Google Scholar] [CrossRef]
- Jaramillo, J.; Álvarez, P.; Gómez-Serrano, V. Preparation and ozone-surface modification of activated carbon. Thermal stability of oxygen surface groups. Appl. Surf. Sci. 2010, 256, 5232–5236. [Google Scholar] [CrossRef]
- Jaramillo, J.; Modesto, P.; Gómez, V. Oxidation activated carbon by dry and wet methods. Surface chemistry and textural modifications. Fuel Process. Technol. 2010, 91, 1768–1775. [Google Scholar] [CrossRef]
- Foo, K.; Hameed, B. Insights into the modeling of adsorption isotherm systems. Chem Eng J. 2010, 156, 2–10. [Google Scholar] [CrossRef]
- Chen, X. Modeling of experimental adsorption isotherm data. Information 2015, 6, 14–22. [Google Scholar] [CrossRef]
- Marsh, H.; Rodrìguez-Reinoso, F. Applicability of Activated Carbon. In Activated Carbon; Rodrìguez-Reinoso, F., Ed.; Taylor & Francis Group: San Diego, CA, USA, 2016; pp. 383–453. [Google Scholar]
- Echeverría, J.; Juncal, E.; Barbería, V.; Musgo, J.; Garrido, J. Synthesis and characterization of ultramicroporous silica xerogels. J. Non-Cryst. Solids 2010, 356, 378–382. [Google Scholar] [CrossRef]
- Villar-Rodil, S.; Navarrete, R.; Denoyel, R.; Albiniak, A.; Paredes, J.; Martínez-Alonso, A.; Tascón, J. Carbon molecular sieve cloths prepared by chemical vapour deposition of methane for separation of gas mixtures. Micropor. Mesopor. Mat. 2005, 77, 109–118. [Google Scholar] [CrossRef]
- Stoeckli, F.; Slasli, A.; Hugi-Cleary, D.; Guillot, A. The characterization of microporosity in carbons with molecular sieve effects. Micropor. Mesopor. Mat. 2002, 51, 197–202. [Google Scholar] [CrossRef]
- Gómez, F.; Giraldo, L.; Moreno-Piraján, J.C. Granular activated carbons characterization by CO2 adsorption isotherms and immersion enthalpy. J. Therm. Anal. Calorim. 2015, 120, 1657–1664. [Google Scholar] [CrossRef]
- Vargas, D.P.; Giraldo, L.; Moreno-Piraján, J.C. Accessible area and hydrophobicity of activated carbons obtained from the enthalpy characterization. Adsorption 2016, 22, 3–11. [Google Scholar] [CrossRef]
- Radovic, L.R.; Moreno-Castilla, C.; Rivera-Utrilla, J. Carbon Materials as Adsorbents in Aqueous Solutions. In Chemistry and Physics of Carbon. A Serie of Advances; Walker, P., Ed.; Marcel Dekker: New York, NY, USA, 2000; pp. 293–297. [Google Scholar]
- Boehm, H.P. Some aspects of the surface chemistry of carbon blacks and other carbons. Carbon 1994, 32, 759–769. [Google Scholar] [CrossRef]
- Kim, Y.; Park, C. Titration Method for the Identification of Surface Functional Groups. In Materials Science and Engineering of Carbon Characterization; Inagaki, M., Kang, F., Eds.; Tsinghua University Press Limited: Hamamatsu, Japan, 2016; pp. 273–286. [Google Scholar]
- Vargas, D.P.; Giraldo, L.; Moreno-Piraján, J.C. Enthalpic characterisation of activated carbon monoliths obtained from lignocellulosic materials. J. Therm. Anal. Cal. 2013, 111, 1067–1072. [Google Scholar] [CrossRef]
Sample Availability: Samples are available from the authors. |
Figure 1.
Adsorption isotherms of hexane on the five activated carbons at 263 K.
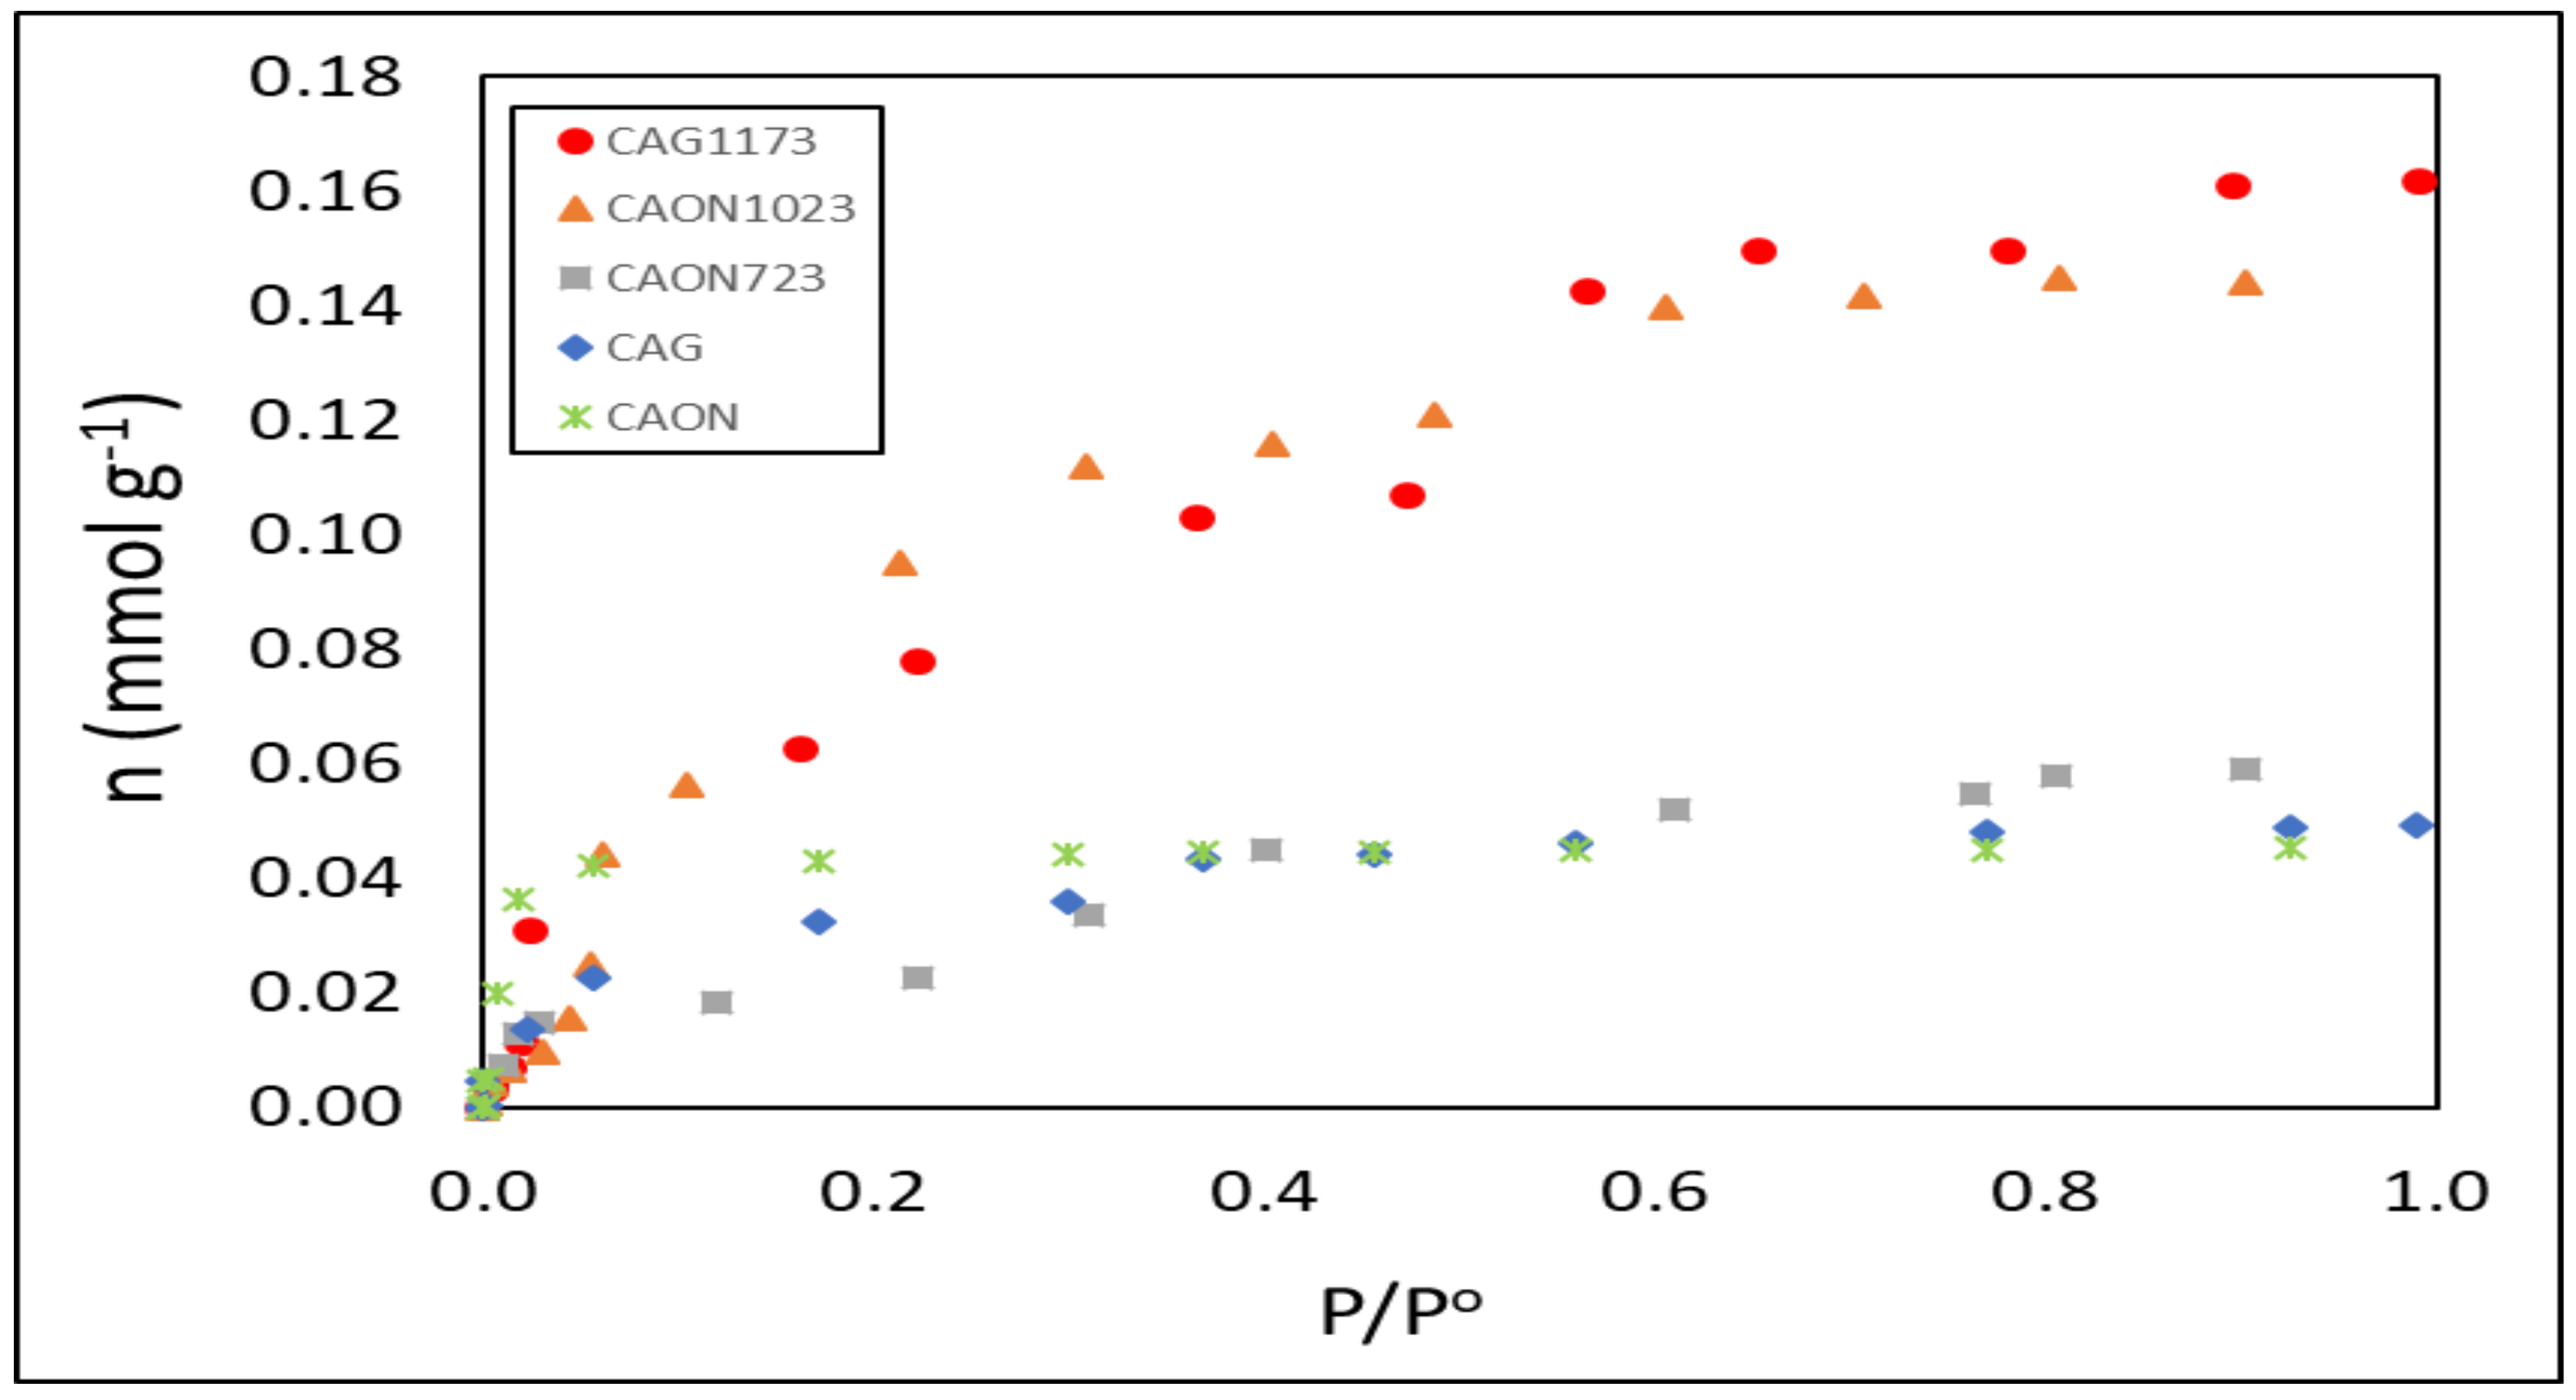
Figure 2.
Calorimetry curves of the immersion of the activated carbon into hexane.

Figure 3.
Immersion enthalpy of the activated carbons in hexane as a function of the micropore volume.
Figure 3.
Immersion enthalpy of the activated carbons in hexane as a function of the micropore volume.
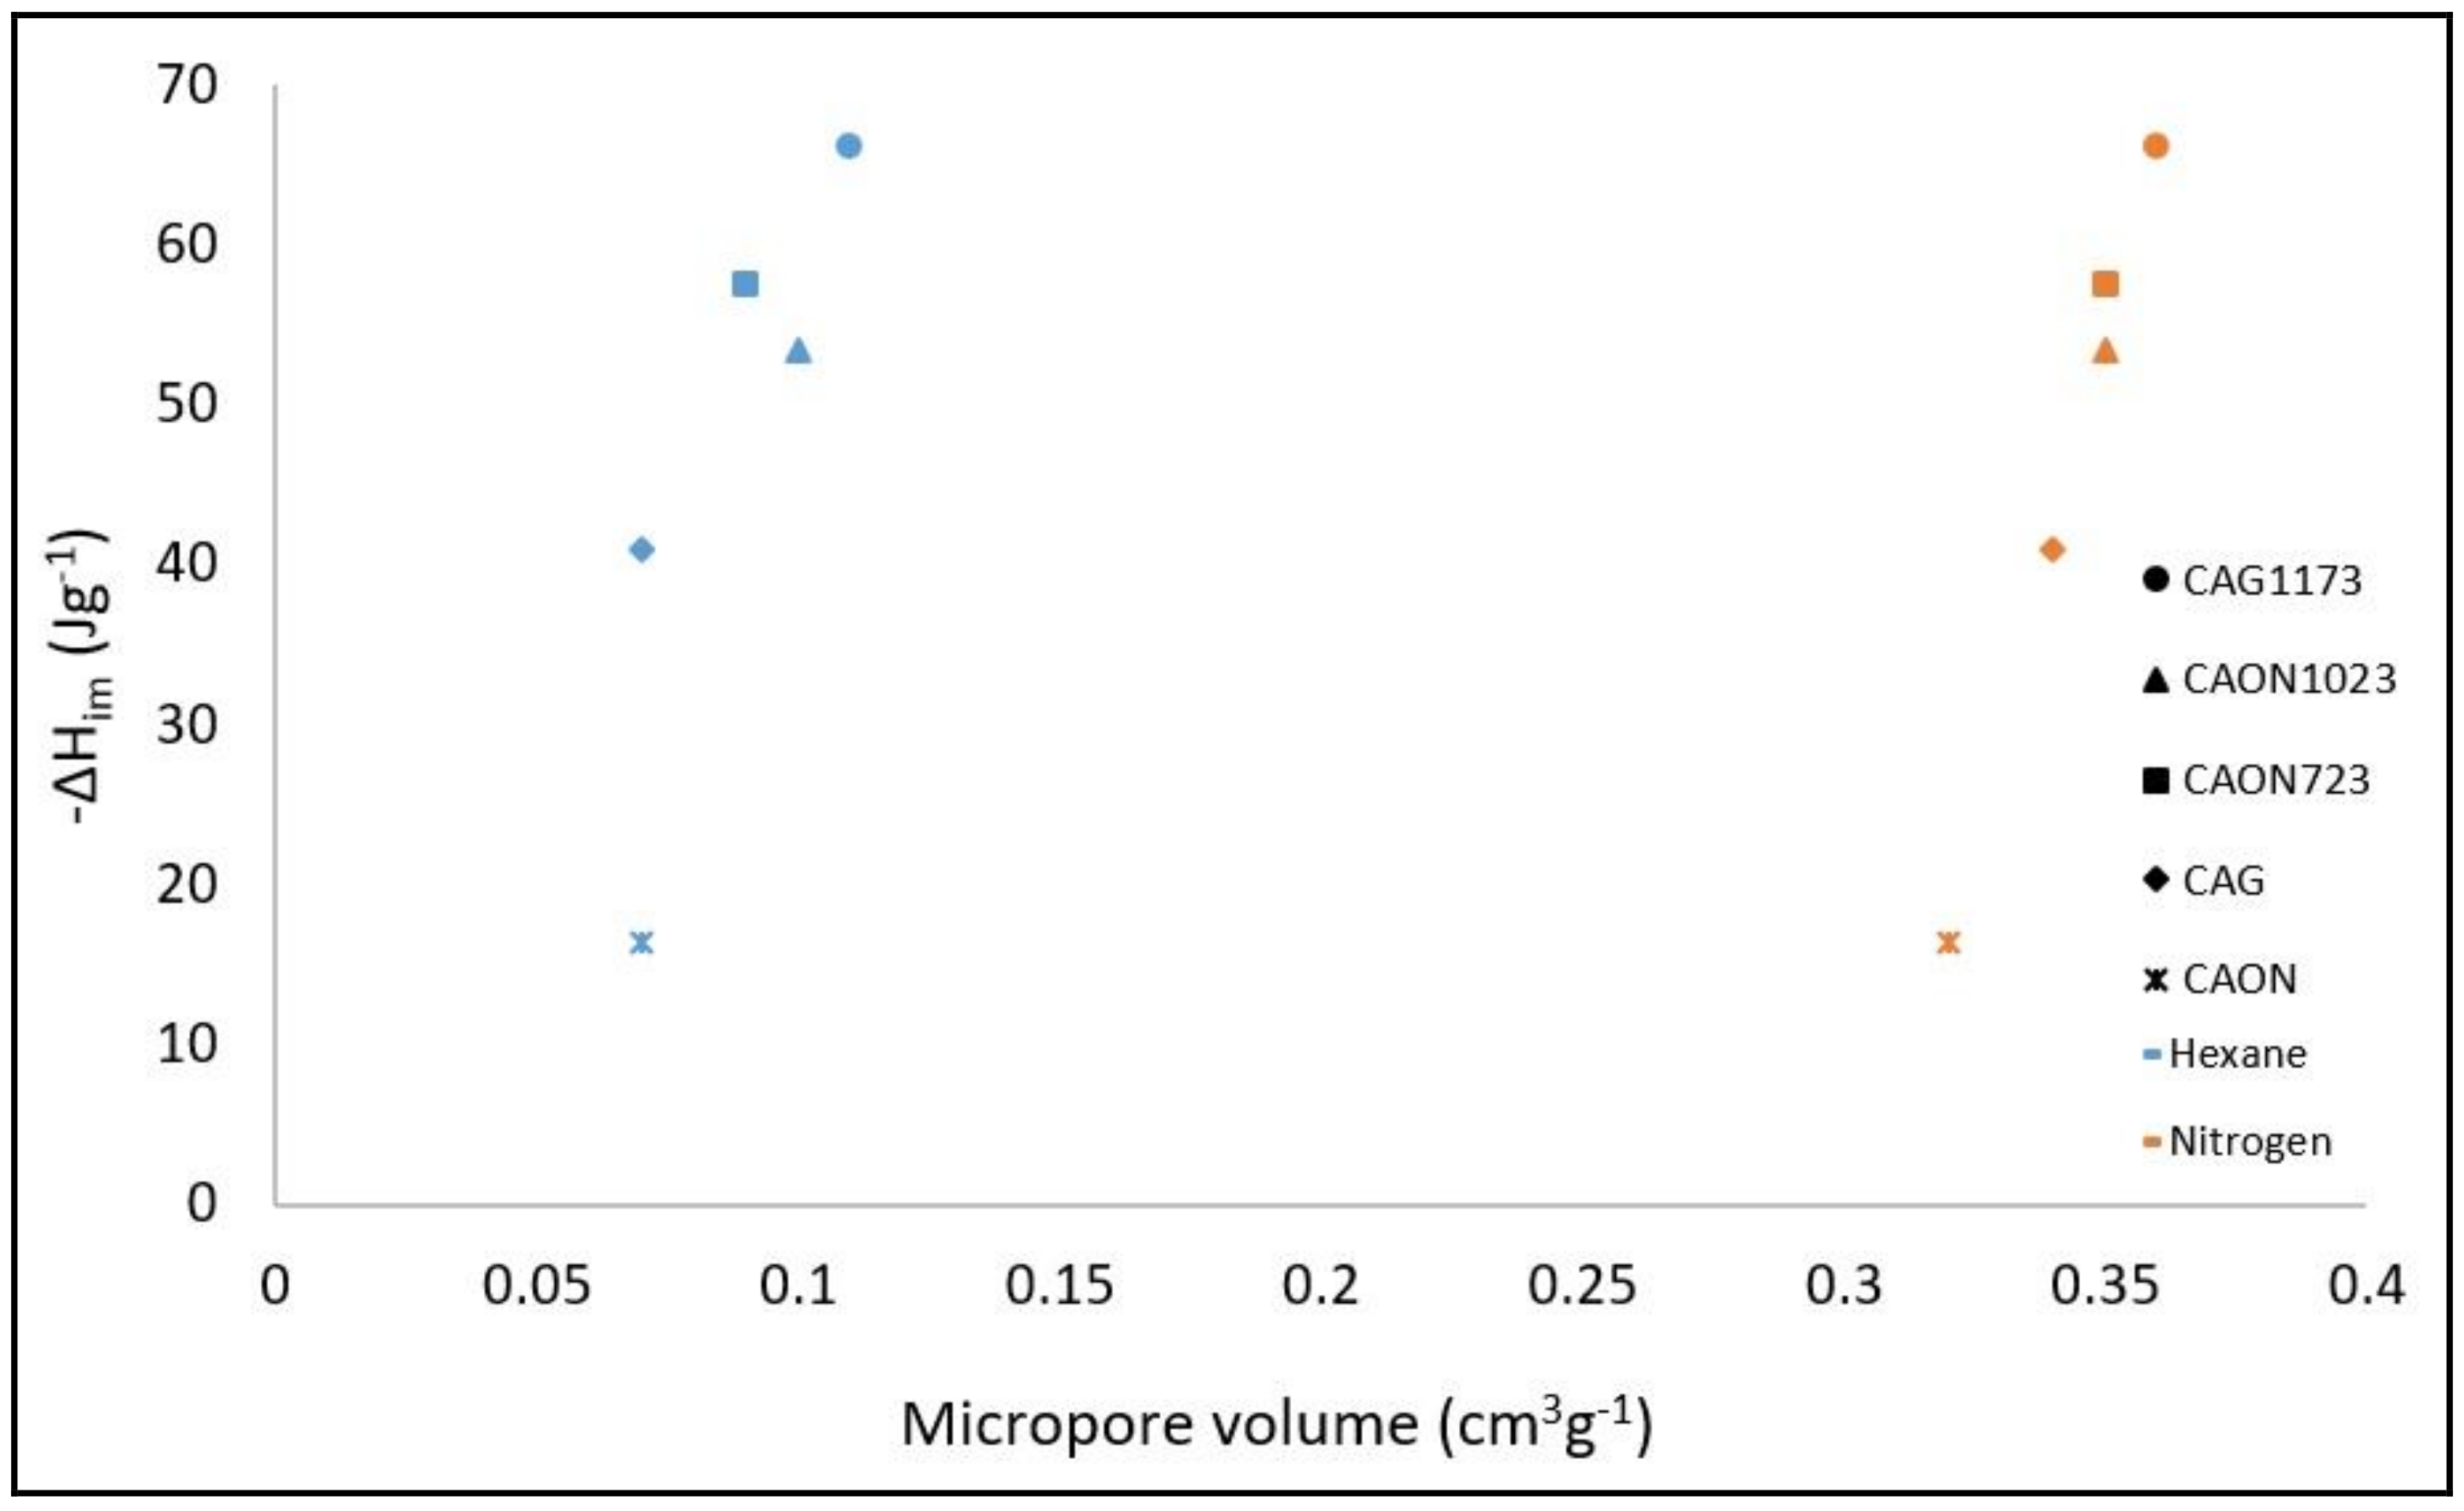
Figure 4.
Immersion enthalpy of activated carbons in hexane as a function of the surface area.
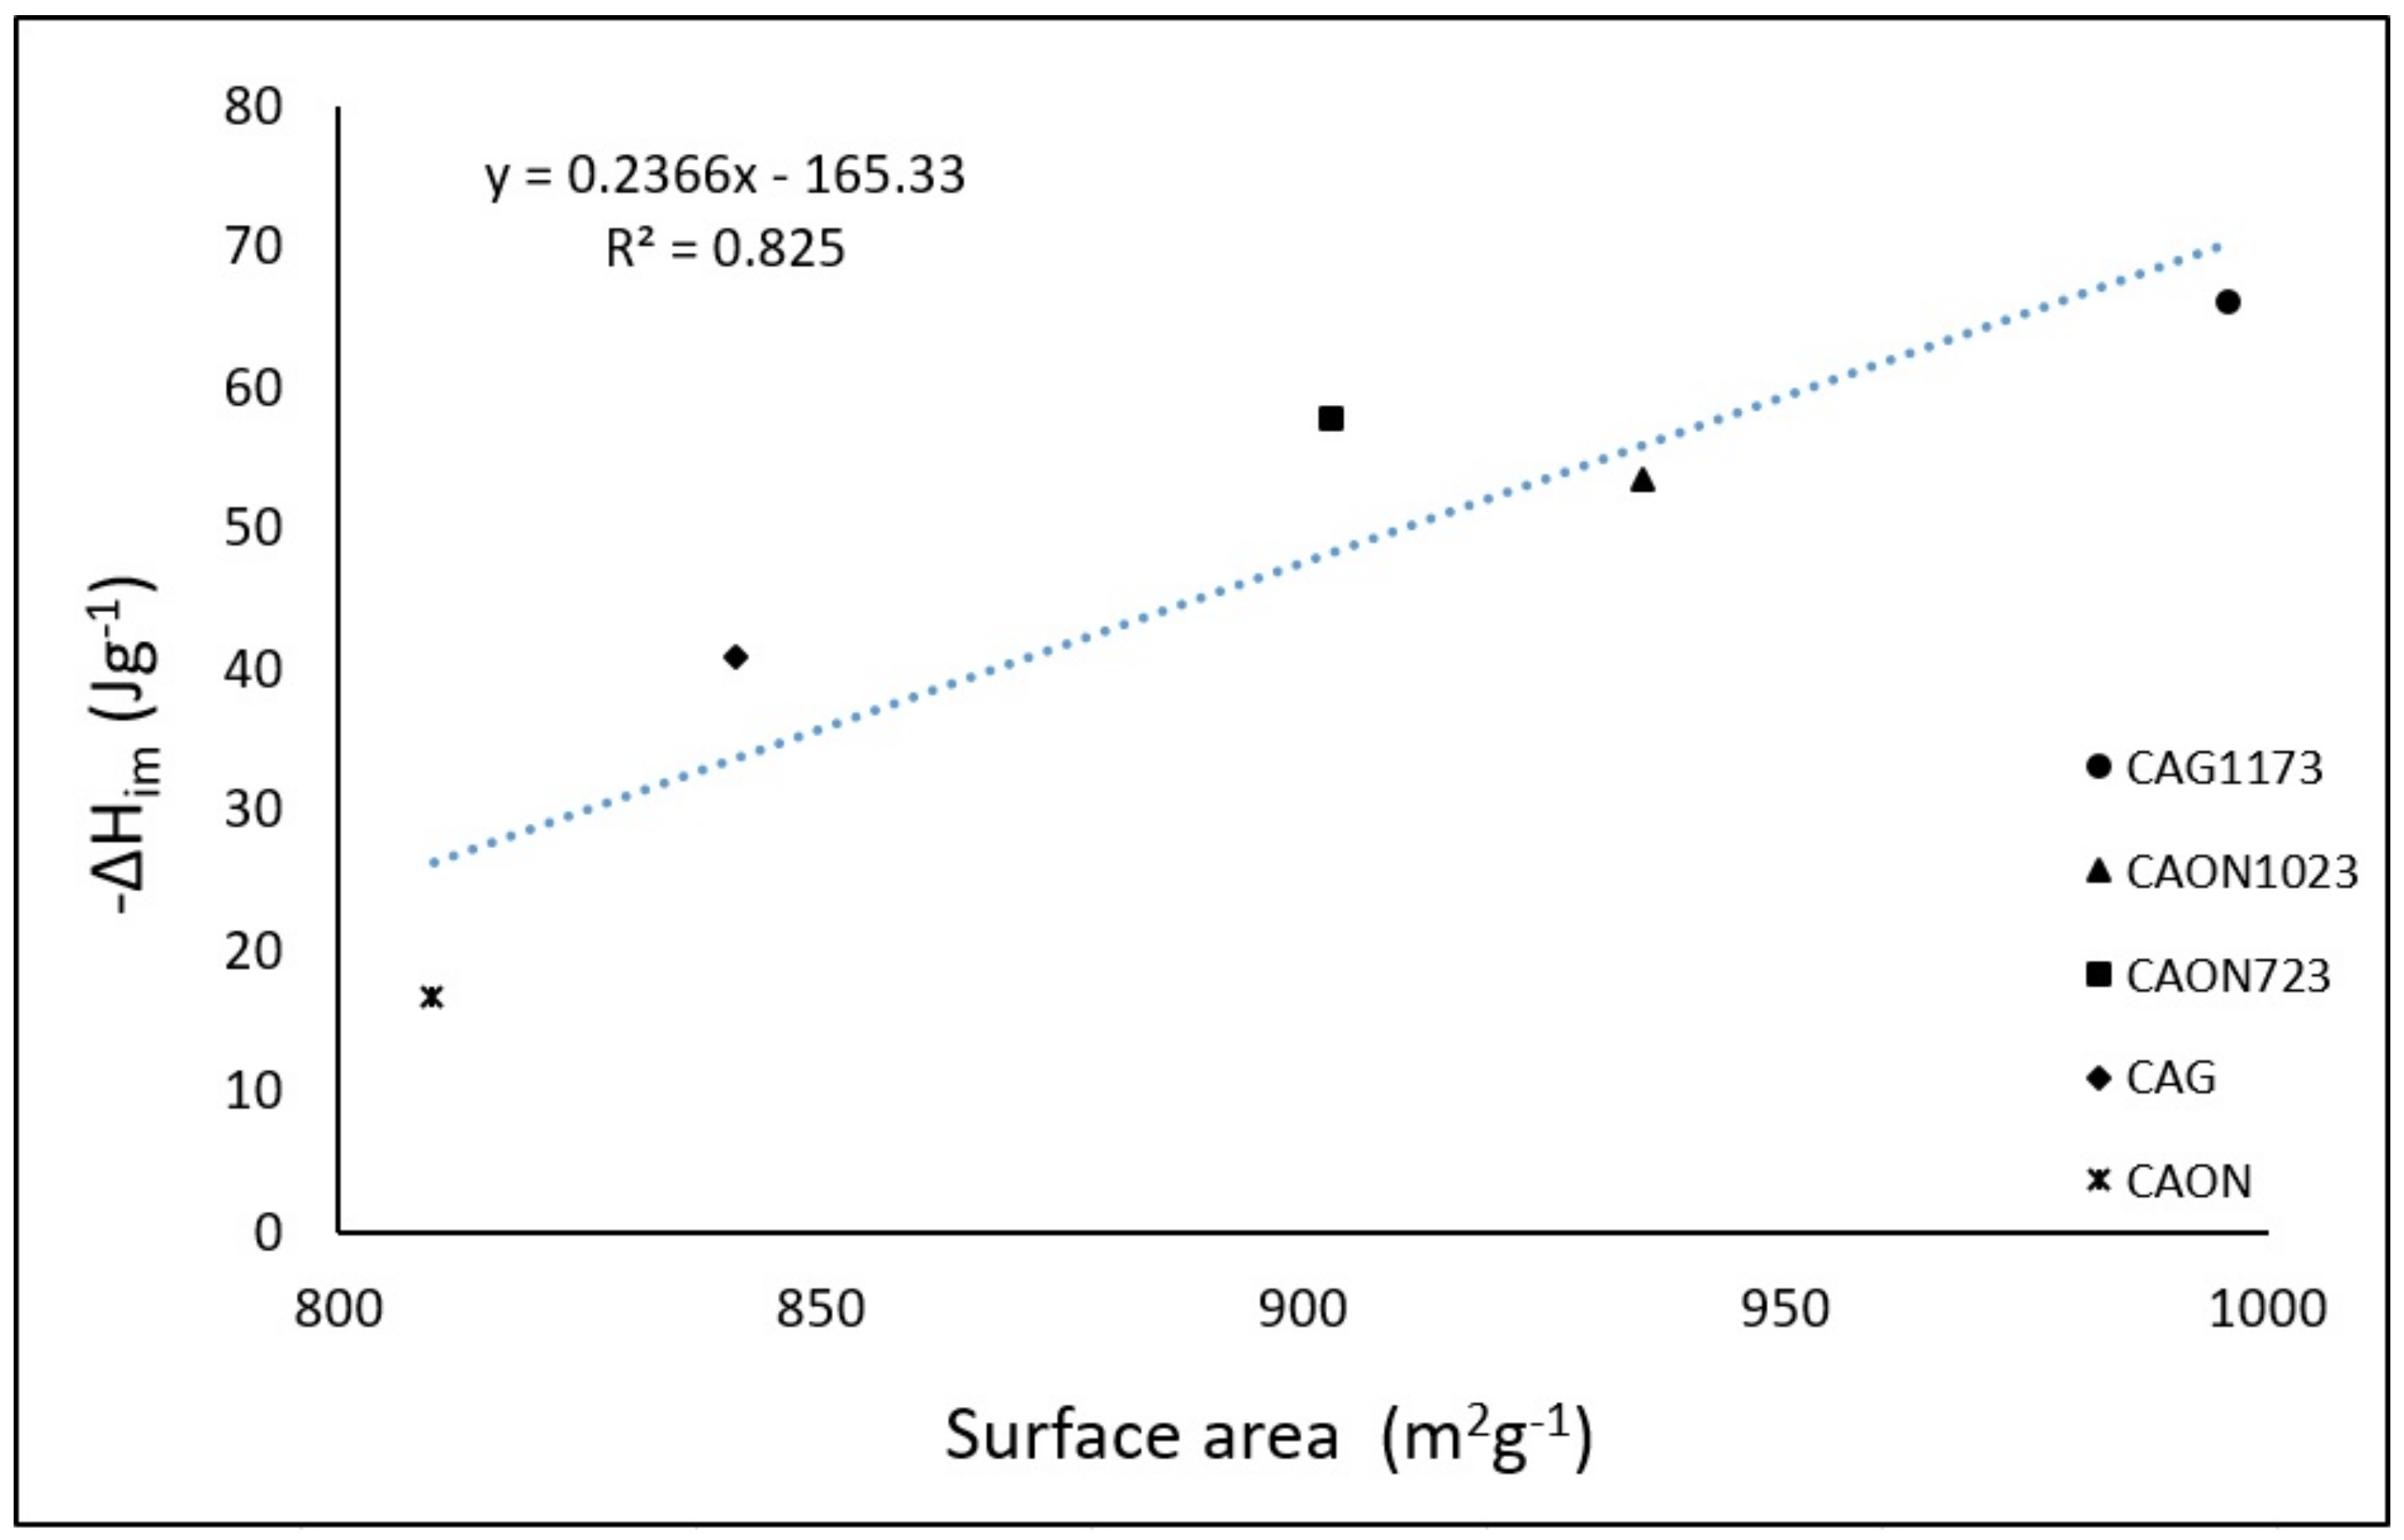
Figure 5.
Enthalpy of immersion enthalpy of the activated carbons in hexane, ΔHim, as a function of the characteristic energy of adsorption, Eo.
Figure 5.
Enthalpy of immersion enthalpy of the activated carbons in hexane, ΔHim, as a function of the characteristic energy of adsorption, Eo.

Figure 6.
Area accessible to hexane as a function of BET surface area.

Figure 7.
Relationship between the hydrophobic factor, the BET surface area, and the enthalpy of immersion of the activated carbons in hexane.
Figure 7.
Relationship between the hydrophobic factor, the BET surface area, and the enthalpy of immersion of the activated carbons in hexane.


Table 1.
Physicochemical characteristics of activated carbons.
| Activated Carbon | BET Surface Area (m2g−1) | Vo(N2) (cm3g−1) | Average Pore Size (N2-QSDFT) (nm) | Oxygenated Group Content (µmolg−1) |
|---|---|---|---|---|
| CAG | 840 | 0.34 | 0.785 | 0.33 |
| CAON | 816 | 0.32 | 0.753 | 0.54 |
| CAON723 | 903 | 0.35 | 0.785 | 0.43 |
| CAON1023 | 935 | 0.35 | 0.785 | 0.34 |
| CAG1173 | 996 | 0.36 | 0.785 | 0.30 |
Table 2.
Parameters obtained from the fit to the Langmuir and Freundlich models for the hexane isotherms on the modified activated carbons.
Table 2.
Parameters obtained from the fit to the Langmuir and Freundlich models for the hexane isotherms on the modified activated carbons.
| Activated Carbon | Langmuir | Freundlich | ||||
|---|---|---|---|---|---|---|
| b (mbar−1) | nm (mmolg−1) | R2 | Kf (mmolg−1mbar−1) | 1/n | R2 | |
| CAG | 0.087 | 0.052 | 0.986 | 0.053 | 0.309 | 0.974 |
| CAON | 0.010 | 0.046 | 0.972 | 0.052 | 0.194 | 0.843 |
| CAON723 | 0.463 | 0.090 | 0.948 | 0.064 | 0.503 | 0.973 |
| CAON1023 | 0.261 | 0.193 | 0.989 | 0.171 | 0.520 | 0.959 |
| CAG1173 | 0.627 | 0.269 | 0.983 | 0.172 | 0.589 | 0.984 |
Table 3.
Parameters determined from the interaction between hexane and water with the activated carbon by immersion calorimetry.
Table 3.
Parameters determined from the interaction between hexane and water with the activated carbon by immersion calorimetry.
| Activated Carbon | −∆Him(C6H14) (Jg−1) | −∆Him(H2O) (Jg−1) | Hydrophobic Factor |
|---|---|---|---|
| CAG | 40.9 | 49.6 | 0.07 |
| CAON | 16.4 | 66.6 | 0.07 |
| CAON723 | 57.6 | 53.3 | 0.09 |
| CAON1023 | 53.4 | 37.4 | 0.10 |
| CAG1173 | 66.1 | 32.4 | 0.11 |
Table 4.
Parameters determined from the adsorption isotherms of hexane (C6H14) by the DR (Dubinin-Radushkevich) model.
Table 4.
Parameters determined from the adsorption isotherms of hexane (C6H14) by the DR (Dubinin-Radushkevich) model.
| Activated Carbon | Area Accessible to Hexane (m2g−1) | Eo(C6H14) (Jmol-1) | Vo(C6H14) (cm3g−1) |
|---|---|---|---|
| CAG | 379 | 6881 | 0.07 |
| CAON | 152 | 6922 | 0.07 |
| CAON723 | 533 | 6149 | 0.09 |
| CAON1023 | 494 | 5792 | 0.10 |
| CAG1173 | 612 | 5656 | 0.11 |
Table 5.
Activated carbons used in hexane adsorption.
| Activated Carbon | Treatment |
|---|---|
| CAG | Starting carbon |
| CAON | CAG exposed to oxidation with a solution of HNO3 |
| CAON723 | CAON exposed to heat treatment at 723 K for 2 h under N2 atmosphere |
| CAON1023 | CAON exposed to heat treatment at 1023 K for 2 h under N2 atmosphere |
| CAG1173 | CAG exposed to heat treatment at 1173 K for 2 h under N2 atmosphere |
© 2018 by the authors. Licensee MDPI, Basel, Switzerland. This article is an open access article distributed under the terms and conditions of the Creative Commons Attribution (CC BY) license (http://creativecommons.org/licenses/by/4.0/).
Share and Cite
MDPI and ACS Style
Hernández-Monje, D.; Giraldo, L.; Moreno-Piraján, J.C. Study of Hexane Adsorption on Activated Carbons with Differences in Their Surface Chemistry. Molecules 2018, 23, 476. https://doi.org/10.3390/molecules23020476
AMA Style
Hernández-Monje D, Giraldo L, Moreno-Piraján JC. Study of Hexane Adsorption on Activated Carbons with Differences in Their Surface Chemistry. Molecules. 2018; 23(2):476. https://doi.org/10.3390/molecules23020476
Chicago/Turabian StyleHernández-Monje, Diana, Liliana Giraldo, and Juan Carlos Moreno-Piraján. 2018. "Study of Hexane Adsorption on Activated Carbons with Differences in Their Surface Chemistry" Molecules 23, no. 2: 476. https://doi.org/10.3390/molecules23020476