Complete Chloroplast Genome Sequence and Phylogenetic Analysis of Paeonia ostii
by
Shuai Guo
1,2,†, 
Lili Guo
1,†,
Wei Zhao
1,†,
Jiang Xu
2,
Yuying Li
1,
Xiaoyan Zhang
2,3,
Xiaofeng Shen
2,
Mingli Wu
2,4 and
Xiaogai Hou
1,* 1
College of Agricultural (College of Tree Peony), Henan University of Science and Technology, Luoyang 471023, Henan, China
2
Institute of Chinese Materia Medical, China Academy of Chinese Medical Sciences, Beijing 100700, China
3
College of Life Science, Huaibei Normal University, Huaibei 235000, Anhui, China
4
College of Pharmacy, Hubei University of Chinese Medicine, Wuhan 430065, Hubei China
*
Author to whom correspondence should be addressed.
†
These authors contributed equally to this work.
Molecules 2018, 23(2), 246; https://doi.org/10.3390/molecules23020246
Submission received: 22 December 2017
/
Revised: 20 January 2018
/
Accepted: 24 January 2018
/
Published: 26 January 2018
Abstract
:Paeonia ostii, a common oil-tree peony, is important ornamentally and medicinally. However, there are few studies on the chloroplast genome of Paeonia ostii. We sequenced and analyzed the complete chloroplast genome of P. ostii. The size of the P. ostii chloroplast genome is 152,153 bp, including a large single-copy region (85,373 bp), a small single-copy region (17,054 bp), and a pair of inverted repeats regions (24,863 bp). The P. ostii chloroplast genome encodes 111 genes, including 77 protein-coding genes, four ribosomal RNA genes, and 30 transfer RNA genes. The genome contains forward repeats (22), palindromic repeats (28), and tandem repeats (24). The presence of rich simple-sequence repeat loci in the genome provides opportunities for future population genetics work for breeding new varieties. A phylogenetic analysis showed that P. ostii is more closely related to Paeonia delavayi and Paeonia ludlowii than to Paeonia obovata and Paeonia veitchii. The results of this study provide an assembly of the whole chloroplast genome of P. ostii, which may be useful for future breeding and further biological discoveries. It will provide a theoretical basis for the improvement of peony yield and the determination of phylogenetic status.
1. Introduction
The tree peony (Paeonia suffruticosa Andrews), a woody shrub, belongs to the section Moutan in the genus Paeonia, family Paeoniaceae [1]. Tree peony has been grown for approximately 1400 years and is an important ornamental and medicinal plant aboriginal to China [2,3,4]. In recent years, with advances in research on tree peony, a number of studies have been conducted on the fatty acids in tree peony seed oil [5,6,7,8,9,10,11].
Oil peony is among the new woody oil crops and can be used to produce seeds for processing into edible peony oil. Through years of research, experimentation and exploration, experts have found two oil-producing varieties in the existing peony population, namely Paeonia rockii and Paeonia ostii. These two varieties of seed-oil peony significantly outnumber the other varieties, and the value of their oil is well known. Because peony oil contains large concentrations of alpha-linolenic acid and unsaturated fatty acids, it has a certain preventive effect on cardiovascular disease [12,13,14]. In 2011, the Ministry of Health of the People’s Republic of China issued a notice to consider peony seed oil as a new food resource. In 2014, the China Food and Drug Administration listed peony seed oil on the list of available cosmetics, indicating that peony seed oil could be formally entered into the edible oil and cosmetics markets. However, due to limited planting area, the total output of peony seed oil is not high, resulting in peony seed oil processing and production costs being relatively high. Therefore, it would be desirable to improve grain yield by increasing plant photosynthetic capacity [15].
Chloroplasts, the descendants of ancient bacterial endosymbionts, are significant, active organelles in plant cells responsible for photosynthesis and myriad other aspects of metabolism [16]. The DNA of chloroplasts (cpDNA) is independent of the nuclear genome, showing semi-autonomous genetic characteristics. Chloroplast genome size differences are large; for example, microtubule plant chloroplast DNA is generally 120–160 kb, and the size of the phytoplankton chloroplast genome is about 120 kb [17]. The structure of the chloroplast genome is a typical four-segment, double-stranded, cyclic molecular structure, with one large single-copy (LSC) region, one small single-copy (SSC) region and two inverse repeats (IRs) regions with substantially the same length [18]. Plant chloroplast genomes generally have 110 to 130 genes that are highly conserved in their composition and arrangement within the genome, including photosynthetic genes, chloroplast transcriptional expression-related genes, and some other protein-coding genes [19]. As the center of photosynthesis, the study of the chloroplast genome is of great significance to reveal the mechanisms and metabolic regulation of plant photosynthesis. Using the differences of light systems of plants, we can improve the efficiency of light absorption and transformation, and further improve plant yield [20]. At the same time, the characteristics of maternally inherited genes and highly conserved genes of the chloroplast genome provide favorable conditions for studying the phylogenetic status of plants.
Studies of the genome of the peony chloroplast currently remain limited to phylogenetic analysis using some chloroplast genes [4,21,22,23,24,25], and no peony chloroplast whole-genome information has been reported. Here we describe the whole chloroplast genome sequence of P. ostii, together with the characterization of long repeats and simple sequence repeats (SSRs). We compared and analyzed the chloroplast genome of P. ostii and the chloroplast genome of other members of the genus Paeonia. It is expected that the results will provide a theoretical basis for the improvement of peony yield and the determination of phylogenetic status.
2. Results and Discussion
2.1. Features of P. ostii cpDNA
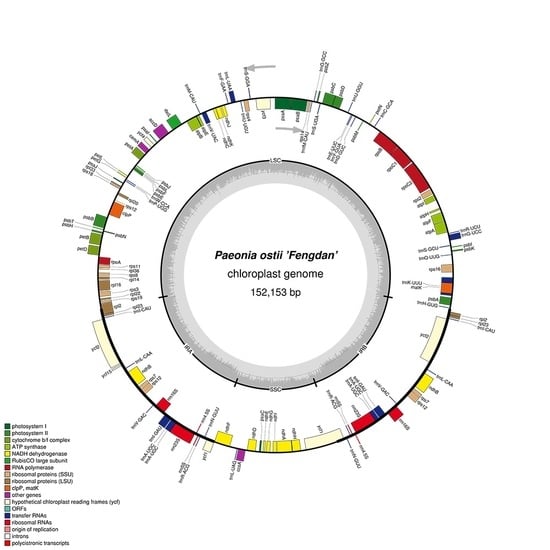
More than 50 million paired-end reads were produced by the Illumina Hiseq X Ten sequencing platform for P. ostii. After reference-guided assembly, the complete chloroplast genome sequence of P. ostii was obtained and submitted to the NCBI database with the GenBank accession number MG585274. The chloroplast genome size is 152,153 bp. The structure of the P. ostii chloroplast genome is similar to those from the other Paeonia species [26], including an LSC region (85,373 bp; covering 56.1%), an SSC region (17,054 bp; covering 11.2%), and a pair of inverted repeats (IRA/IRB, 24,863 bp; covering 16.3%) (Table 1). The DNA G+C content of the LSC, SSC and IR regions, and the whole genome, is 36.7, 32.7, 43.1 and 38.4 mol %, respectively, which is also similar to the chloroplast genomes of other Paeonia species. The DNA G+C content is a very important indicator to judge species affinity, and P. ostii has a similar cpDNA G+C content to other Paeonia species [27,28,29]. The DNA G+C content of the IR regions is higher than that of other regions (LSC, SSC); this phenomenon is very common in other plants [18,27]. The relatively high DNA G+C content of the IR regions was mostly attributable to the rRNA genes and tRNA genes [18,30].
In the P. ostii chloroplast genome, 111 functional genes were predicted, including four rRNA genes, 30 tRNA genes, and 77 protein-coding genes (Table 2). In addition, 18 genes—seven tRNA, all four rRNA and seven protein-coding genes—are duplicated in the IR regions (Figure 1). The LSC region includes 58 protein-coding and 22 tRNA genes, while the SSC region includes one tRNA gene and 11 protein-coding genes.
The sequences of the tRNA and protein-coding genes were analyzed, and the frequency of codon usage was deduced for the P. ostii chloroplast genome and summarized. A total of 33,967 codons represent the coding capacity of 77 protein-coding and tRNA genes in P. ostii (Table 3). Among these codons, 3728 (10.98%) encode for leucine and 626 (1.83%) for tryptophan, which are the most and least prevalent amino acids in the P. ostii chloroplast genome, respectively. A- and U-ending codons were common [18,31].
There are, altogether, 18 intron-containing genes, including 12 protein-coding genes and six tRNA genes (Table 4). Fifteen genes (nine protein-coding and six tRNA genes) contain one intron, and two genes (ycf3 and clpP) contain two introns (Table 4). The intron of the trnK-UUU gene contains the matK gene, and the size of the intron is 2452 bp. The rps12 gene is a trans-spliced gene, with the 5’ end located in the LSC region and the duplicated 3’ ends in the IR regions. Previous studies have reported that ycf3 is required for the stable accumulation of the photosystem I complex [32,33]. We therefore speculate that the intron gain in ycf3 of P. ostii may be useful for further studies of the mechanism of photosynthesis evolution.
Advances in phylogenetic research have shown that chloroplast genome evolution includes structural changes and nucleotide substitutions [34,35]. A few examples of these changes, including intron or gene losses, have been found in chloroplast genomes [36,37,38,39,40,41]. The introns are significant in the regulation of gene expression [42]. They can improve gene expression level, on the special position and in the specific time [43,44]. Studies of intron regulation mechanisms have appeared in other species [45,46]. However, no studies analyzing associations between intron loss and gene expression, using transcriptome data from P. ostii, have been published. More experimental work is required to study the introns in P. ostii, in order to establish a theoretical foundation for improving the production of oil.
2.2. Long-Repeat and SSR Analysis
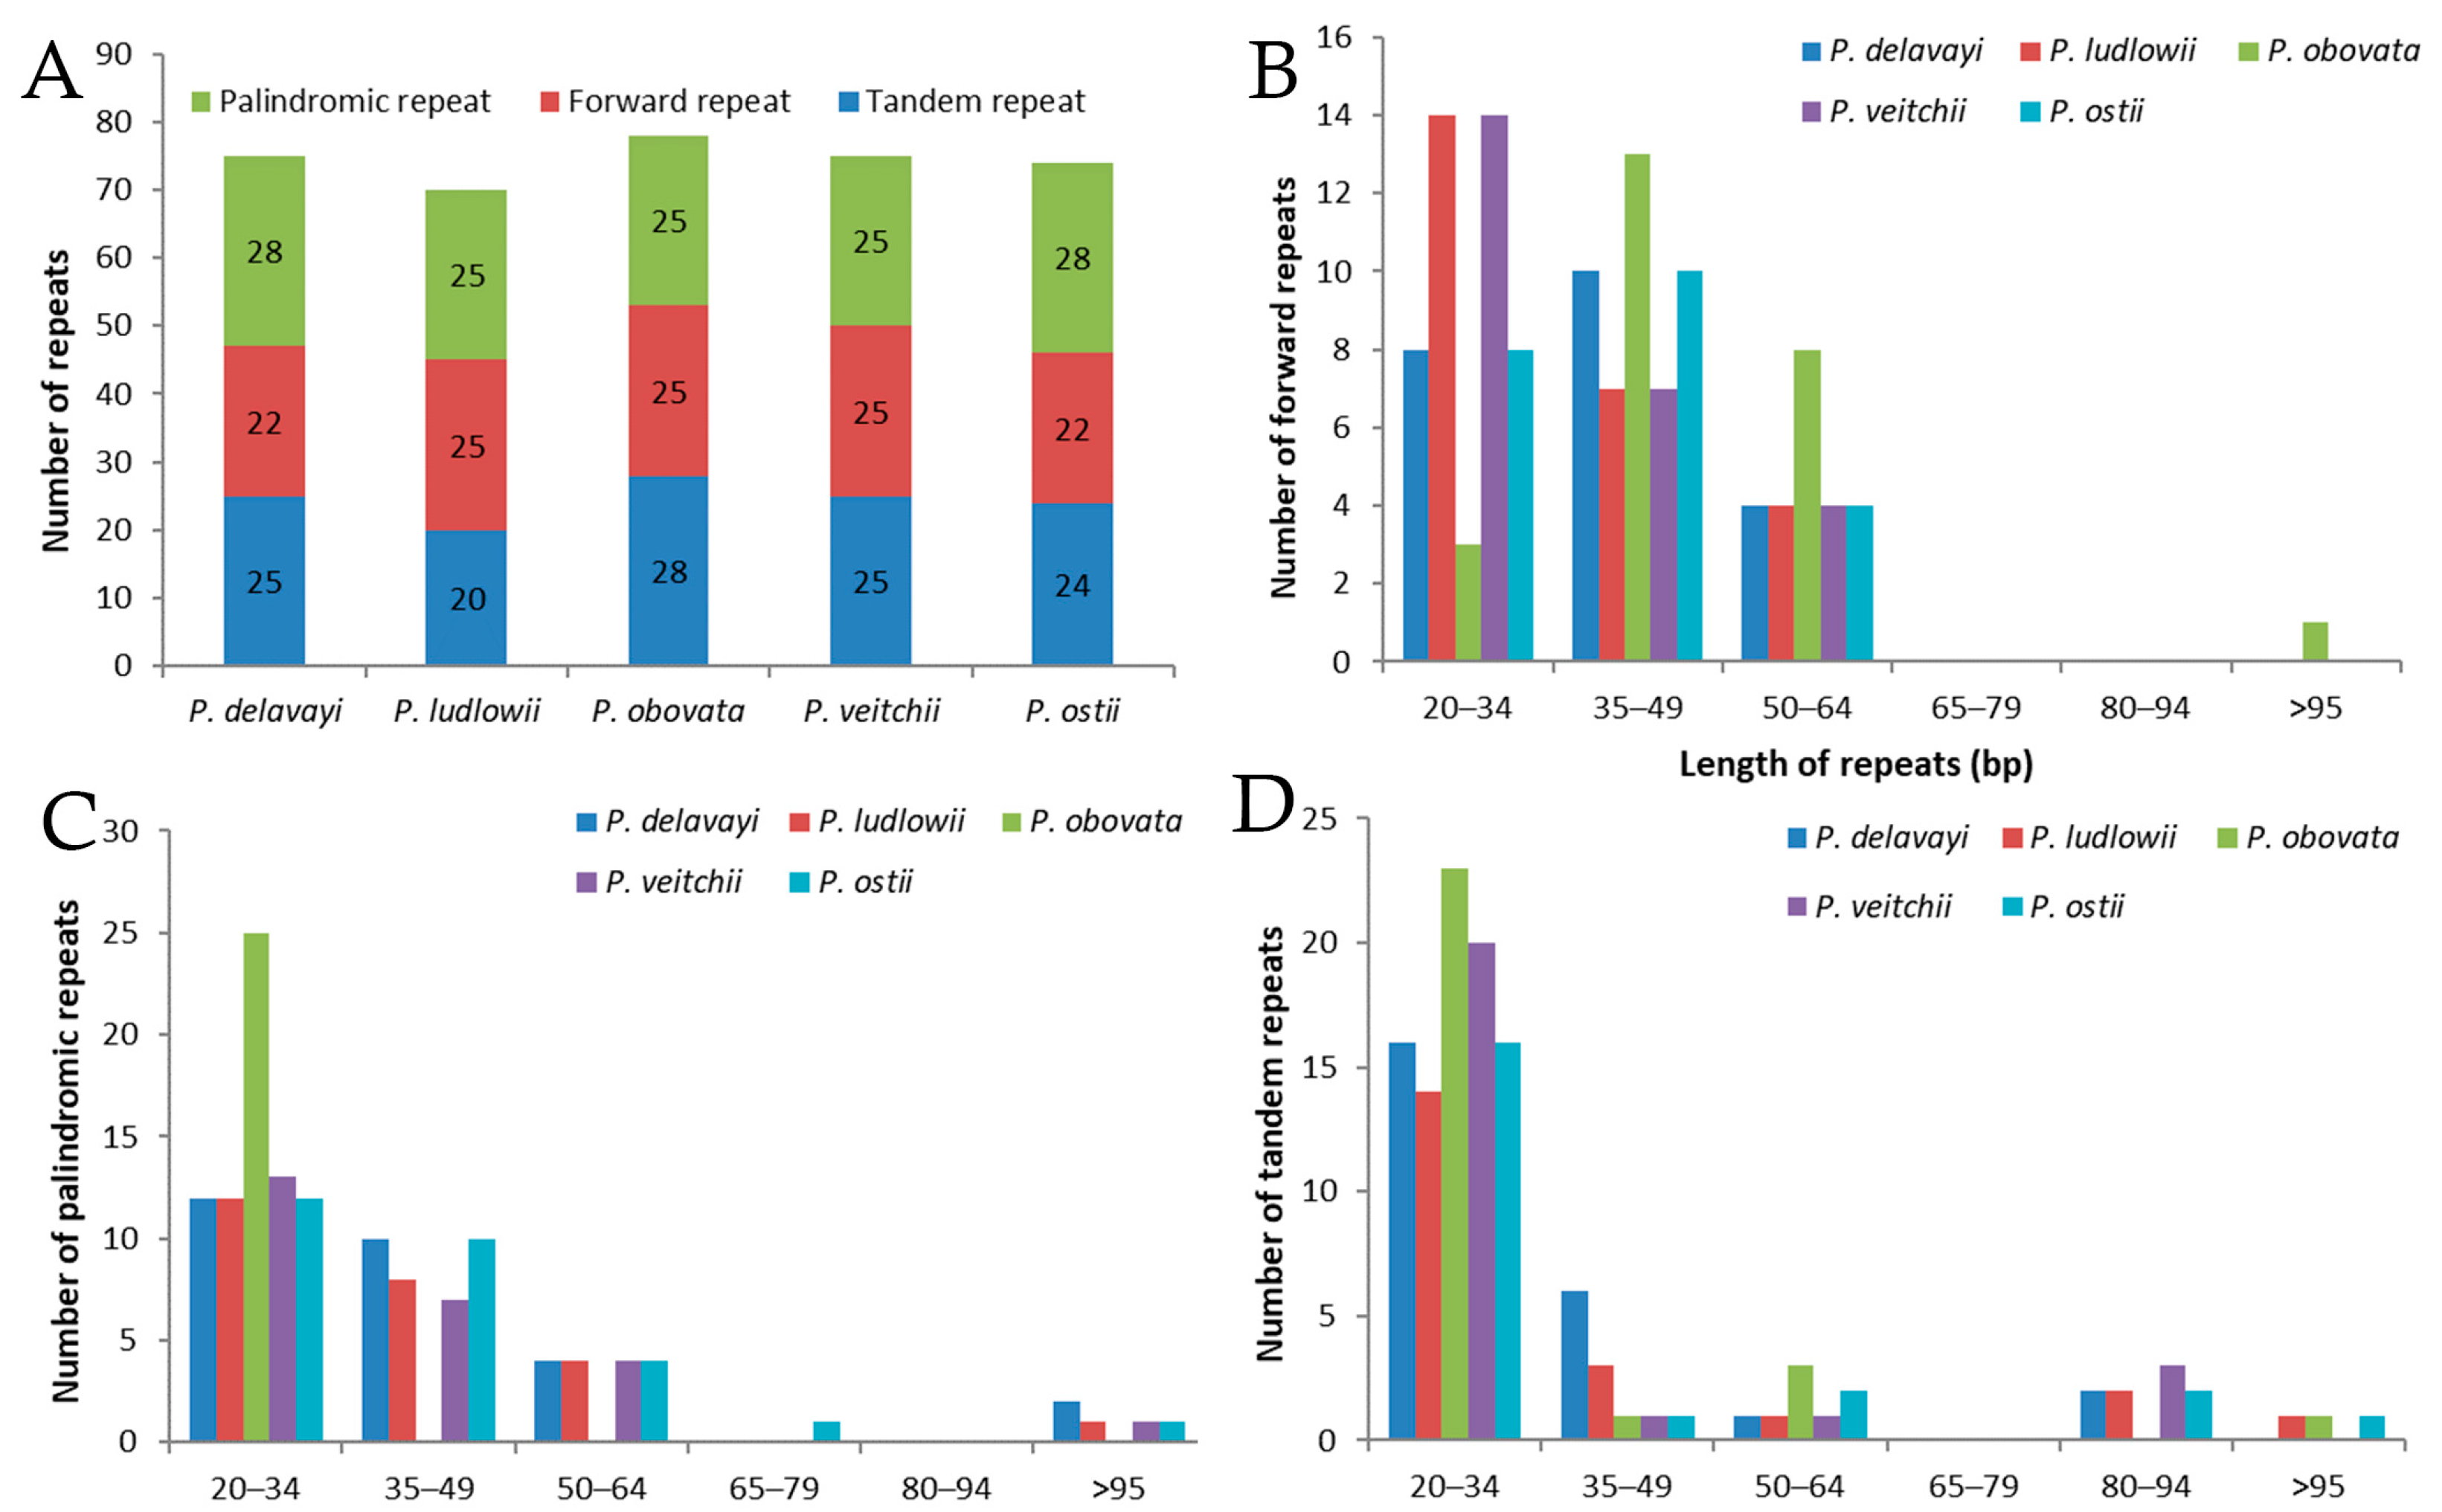
A total of 74 repeats were detected in the P. ostii chloroplast genome, including 22 forward repeats, 28 palindromic repeats, and 24 tandem repeats (Figure 2). Among these, most of the forward repeats are 20–64 bp in length, and 19 tandem repeats and 26 palindromic repeats are of similar length (Figure 2B–D). Similarly, 75, 70, 78 and 75 repeat pairs were found in the previously reported P. delavayi, P. ludlowii, P. obovata and P. veitchii chloroplast genomes, respectively. This suggests that P. ostii is more similar to P. delavayi with respect to number of repeats.
SSRs of 10 bp or longer are inclined to undergo slipped-strand mispairing, which is identified as the main mutational mechanism of SSR polymorphisms [27]. SSRs in the chloroplast genome can be highly variable at the intraspecific level and are therefore often used as genetic markers in population genetics and evolutionary studies [47,48,49,50]. In this study, we found SSRs in the chloroplast genome of P. ostii together with those of four other Paeonia species (Figure 3). The numbers of SSRs are 52, 51, 55, 53 and 47, respectively, in P. delavayi, P. ludlowii, P. obovata, P. veitchii and P. ostii. The mononucleotide repeat content is the largest (P. delavayi, 42.30%; P. ludlowii, 49.02%; P obovata, 36.36%; P. veitchii, 50.94%; P. ostii, 51.06%) in all the above species. However, dinucleotides are the least frequent repeat type in the five species (P. delavayi, 1.92%; P. ludlowii, 0%; P. obovata, 5.54%; P. veitchii, 0%; P. ostii, 0%) (Figure 3). These results will afford chloroplast SSR markers that can be used to study genetic diversity and related species in P. ostii; this also provides an effective method to select germplasm for high-yield oil.
2.3. Comparative Chloroplast Genomic Analysis
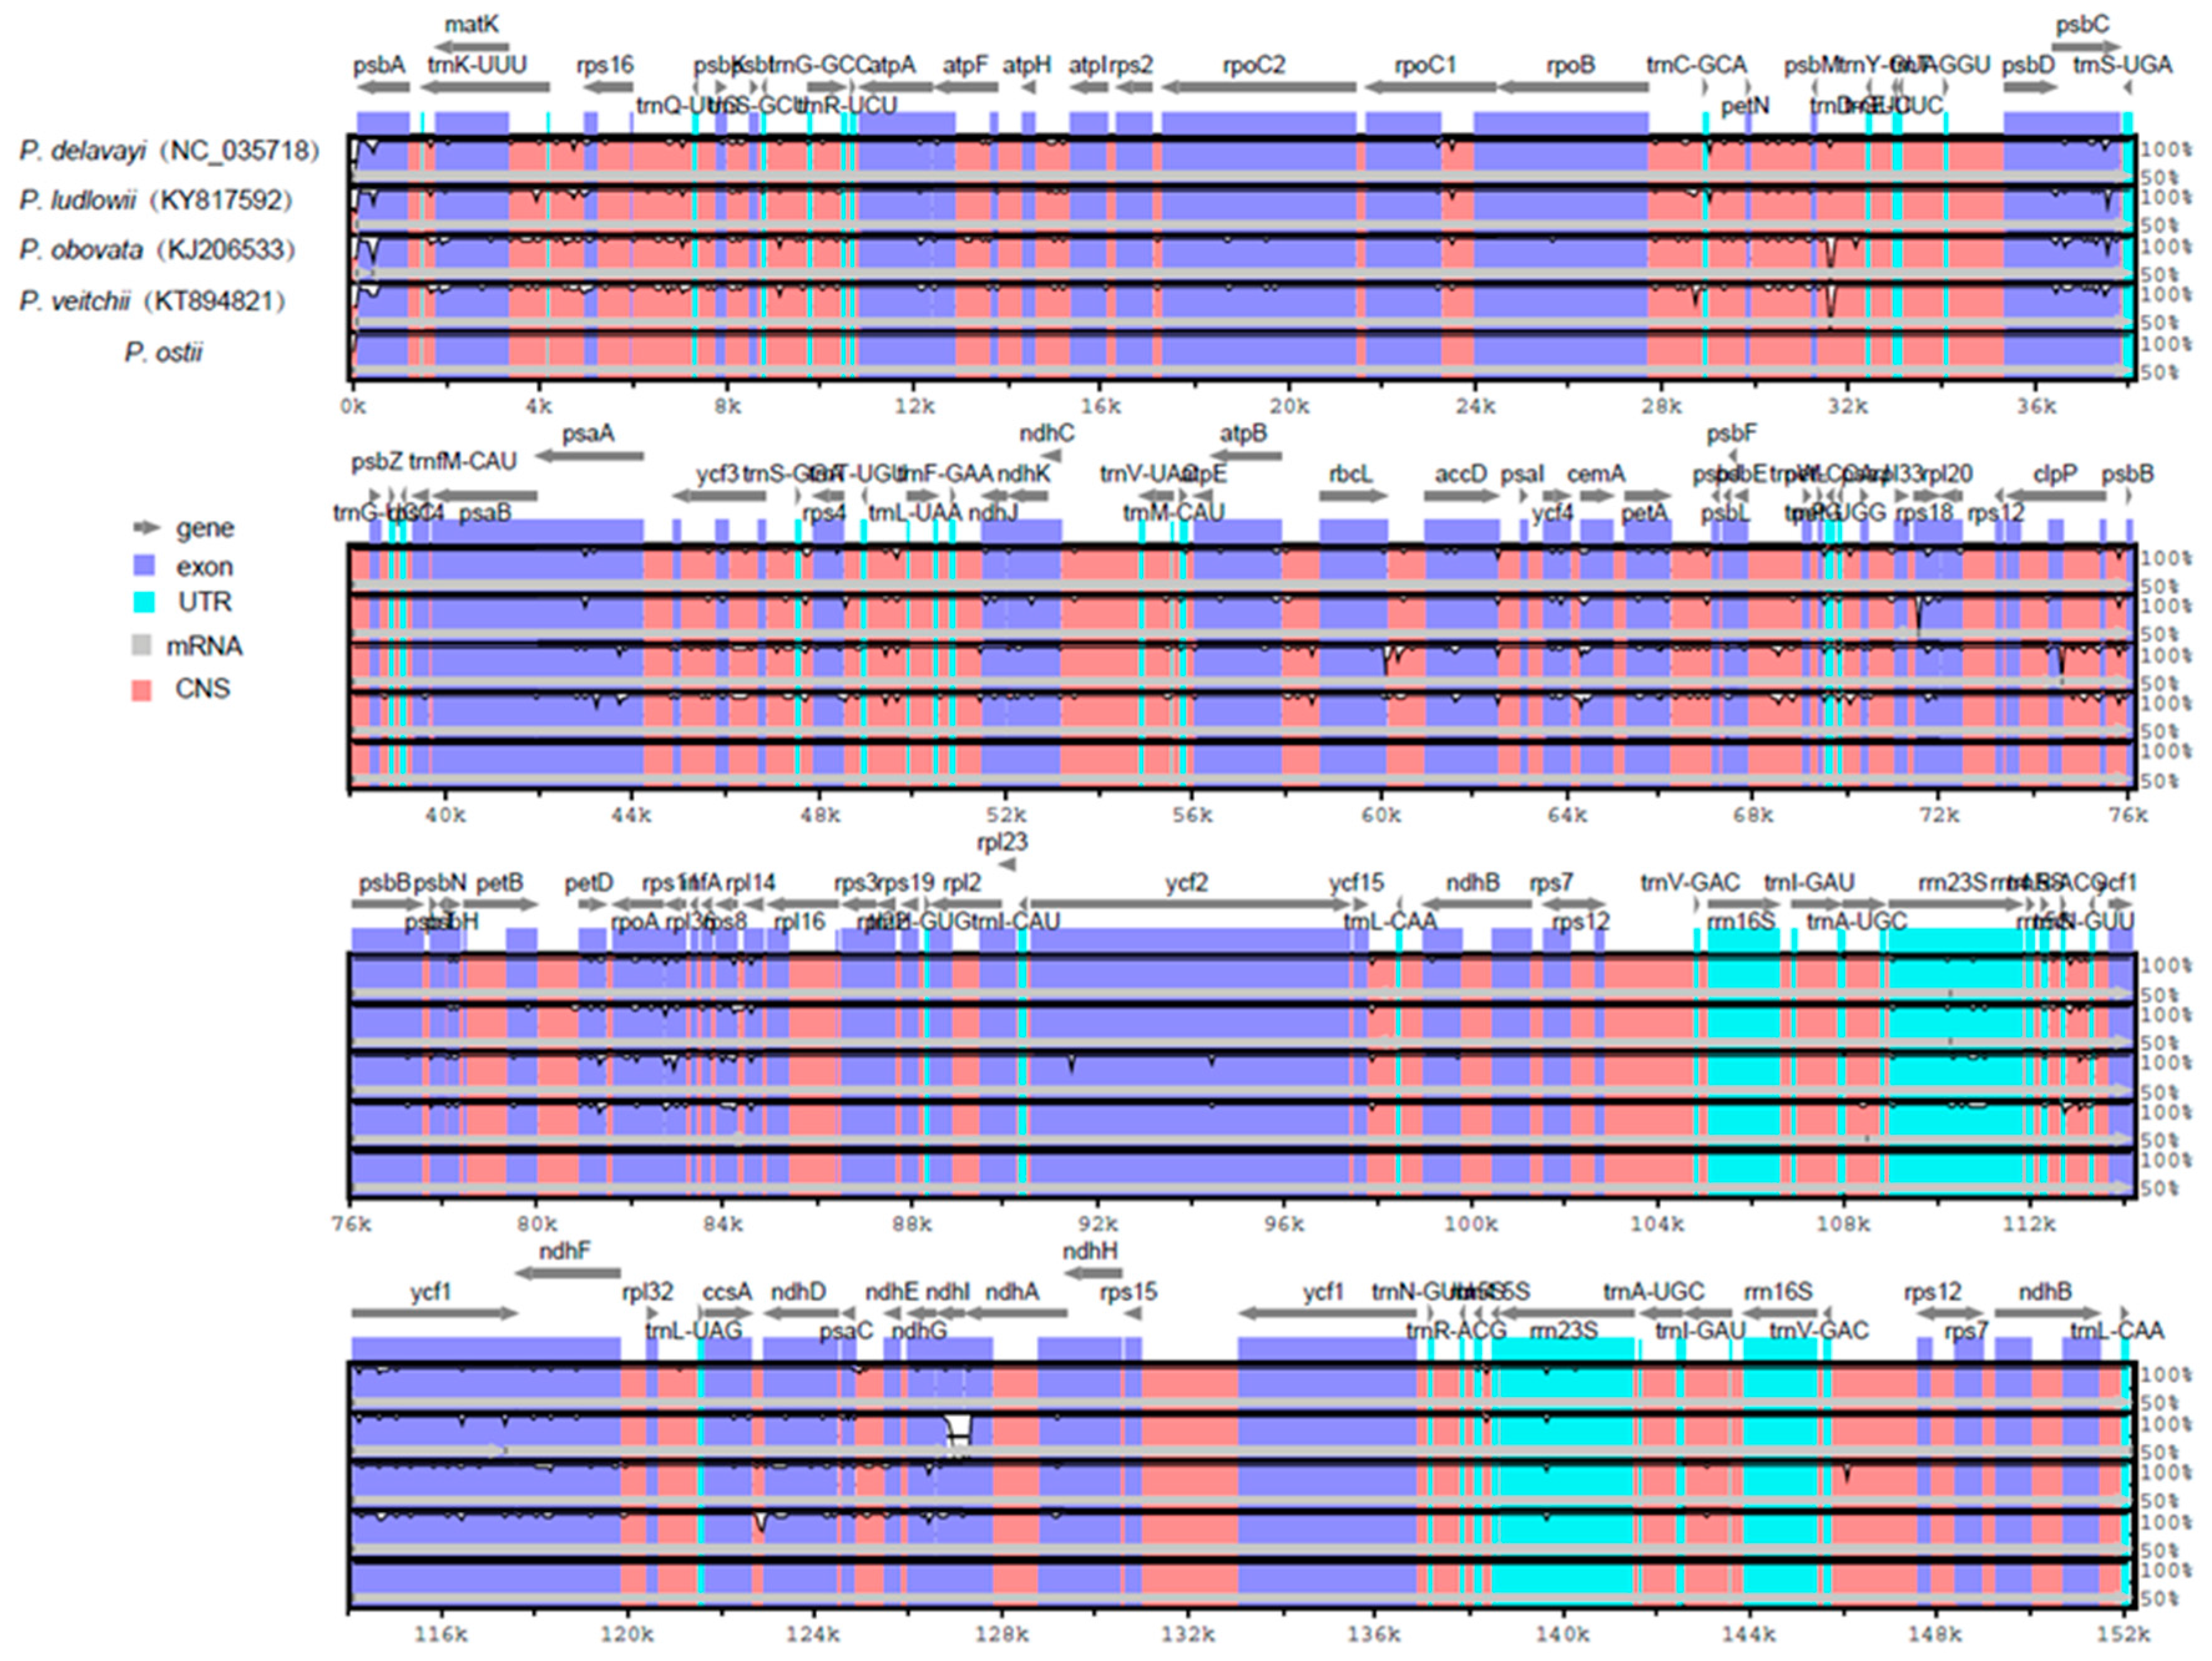
Comparative analysis of chloroplast genomes is an extremely important step in genomics [51,52]. Comparing the structural differences between Paeonia chloroplast genomes revealed that the chloroplast genome size of P. ostii is the smallest among the five completed Paeonia chloroplast genomes (Table 1). P. ostii has the smallest IR regions (24,863 bp) among these sequenced Paeonia chloroplast genomes. We surmised that the different length of the IR regions is the main reason for the change in sequence length. To explain the level of genome divergence, sequence identity among Paeonia chloroplast DNAs was calculated using the program mVISTA with P. ostii as a reference (Figure 4). The results of this comparison revealed that the IR (A/B) regions are less divergent than the LSC and SSC regions. Furthermore, the noncoding regions are more variable than the coding regions, and the highly divergent regions among the five chloroplast genomes occur in the intergenic spacers [53].
2.4. IR Contraction and Expansion in the P. ostii Chloroplast Genome
Contractions and expansions of the IR regions at the borders are common evolutionary events and represent the main reasons for the size variation of chloroplast genomes; they play an important role in evolution [54,55,56]. A detailed comparison of four junctions, LSC/IRA (JLA), LSC/IRB (JLB), SSC/IRA (JSA) and SSC/IRB (JSB), between the two IRs (IRA and IRB) and the two single–copy regions (LSC and SSC), was completed among P. delavayi, P. ludlowii, P. obovata, P. veitchii, and P. ostii (Figure 5). The SSC/IRA junction is located in the ycf1 region in all Paeonia species chloroplast genomes and extends a different length (P. delavayi, 4357 bp; P. ludlowii, 4340 bp; P. obovata, 4326 bp; P. veitchii, 4327 bp; P. ostii, 4352 bp) into the SSC region in all genomes; the IRB region includes 1075, 1078, 1077, 1076 and 1078 bp of the ycf1 gene, respectively. Recently, it was reported that ycf1 is necessary for plant viability and encodes Tic214, an important component of the Arabidopsis TIC complex [57,58]. Similarly, the trnH gene is located in the LSC region, 1535, 0, 1, 3 and 79 bp away from the IRA/LSC border in the five Paeonia chloroplast genomes, respectively. The JLA junction in P. ostii is crossed by rpl2, which is different from the other four Paeonia species. The ndhF gene is across the JSB junction in P. delavayi, P. ludlowii, P. obovata and P. ostii, while it was found to be 16 bp away from the IRB/SSC border in P. veitchii.
Although the gene order in chloroplasts is usually conserved in terrestrial plants, it has been reported that many sequences are rearranged in chloroplast genomes from a wide variety of different plant species, including inversions in the LSC region, IR contraction or expansions with inversions, and re-inversion in the SSC region [59,60,61,62,63]. Sequence rearrangements that change chloroplast genome structure in connected species may also deliver genetic diversity information that can be used for molecular classification and evolution studies.
2.5. Phylogenetic Analysis
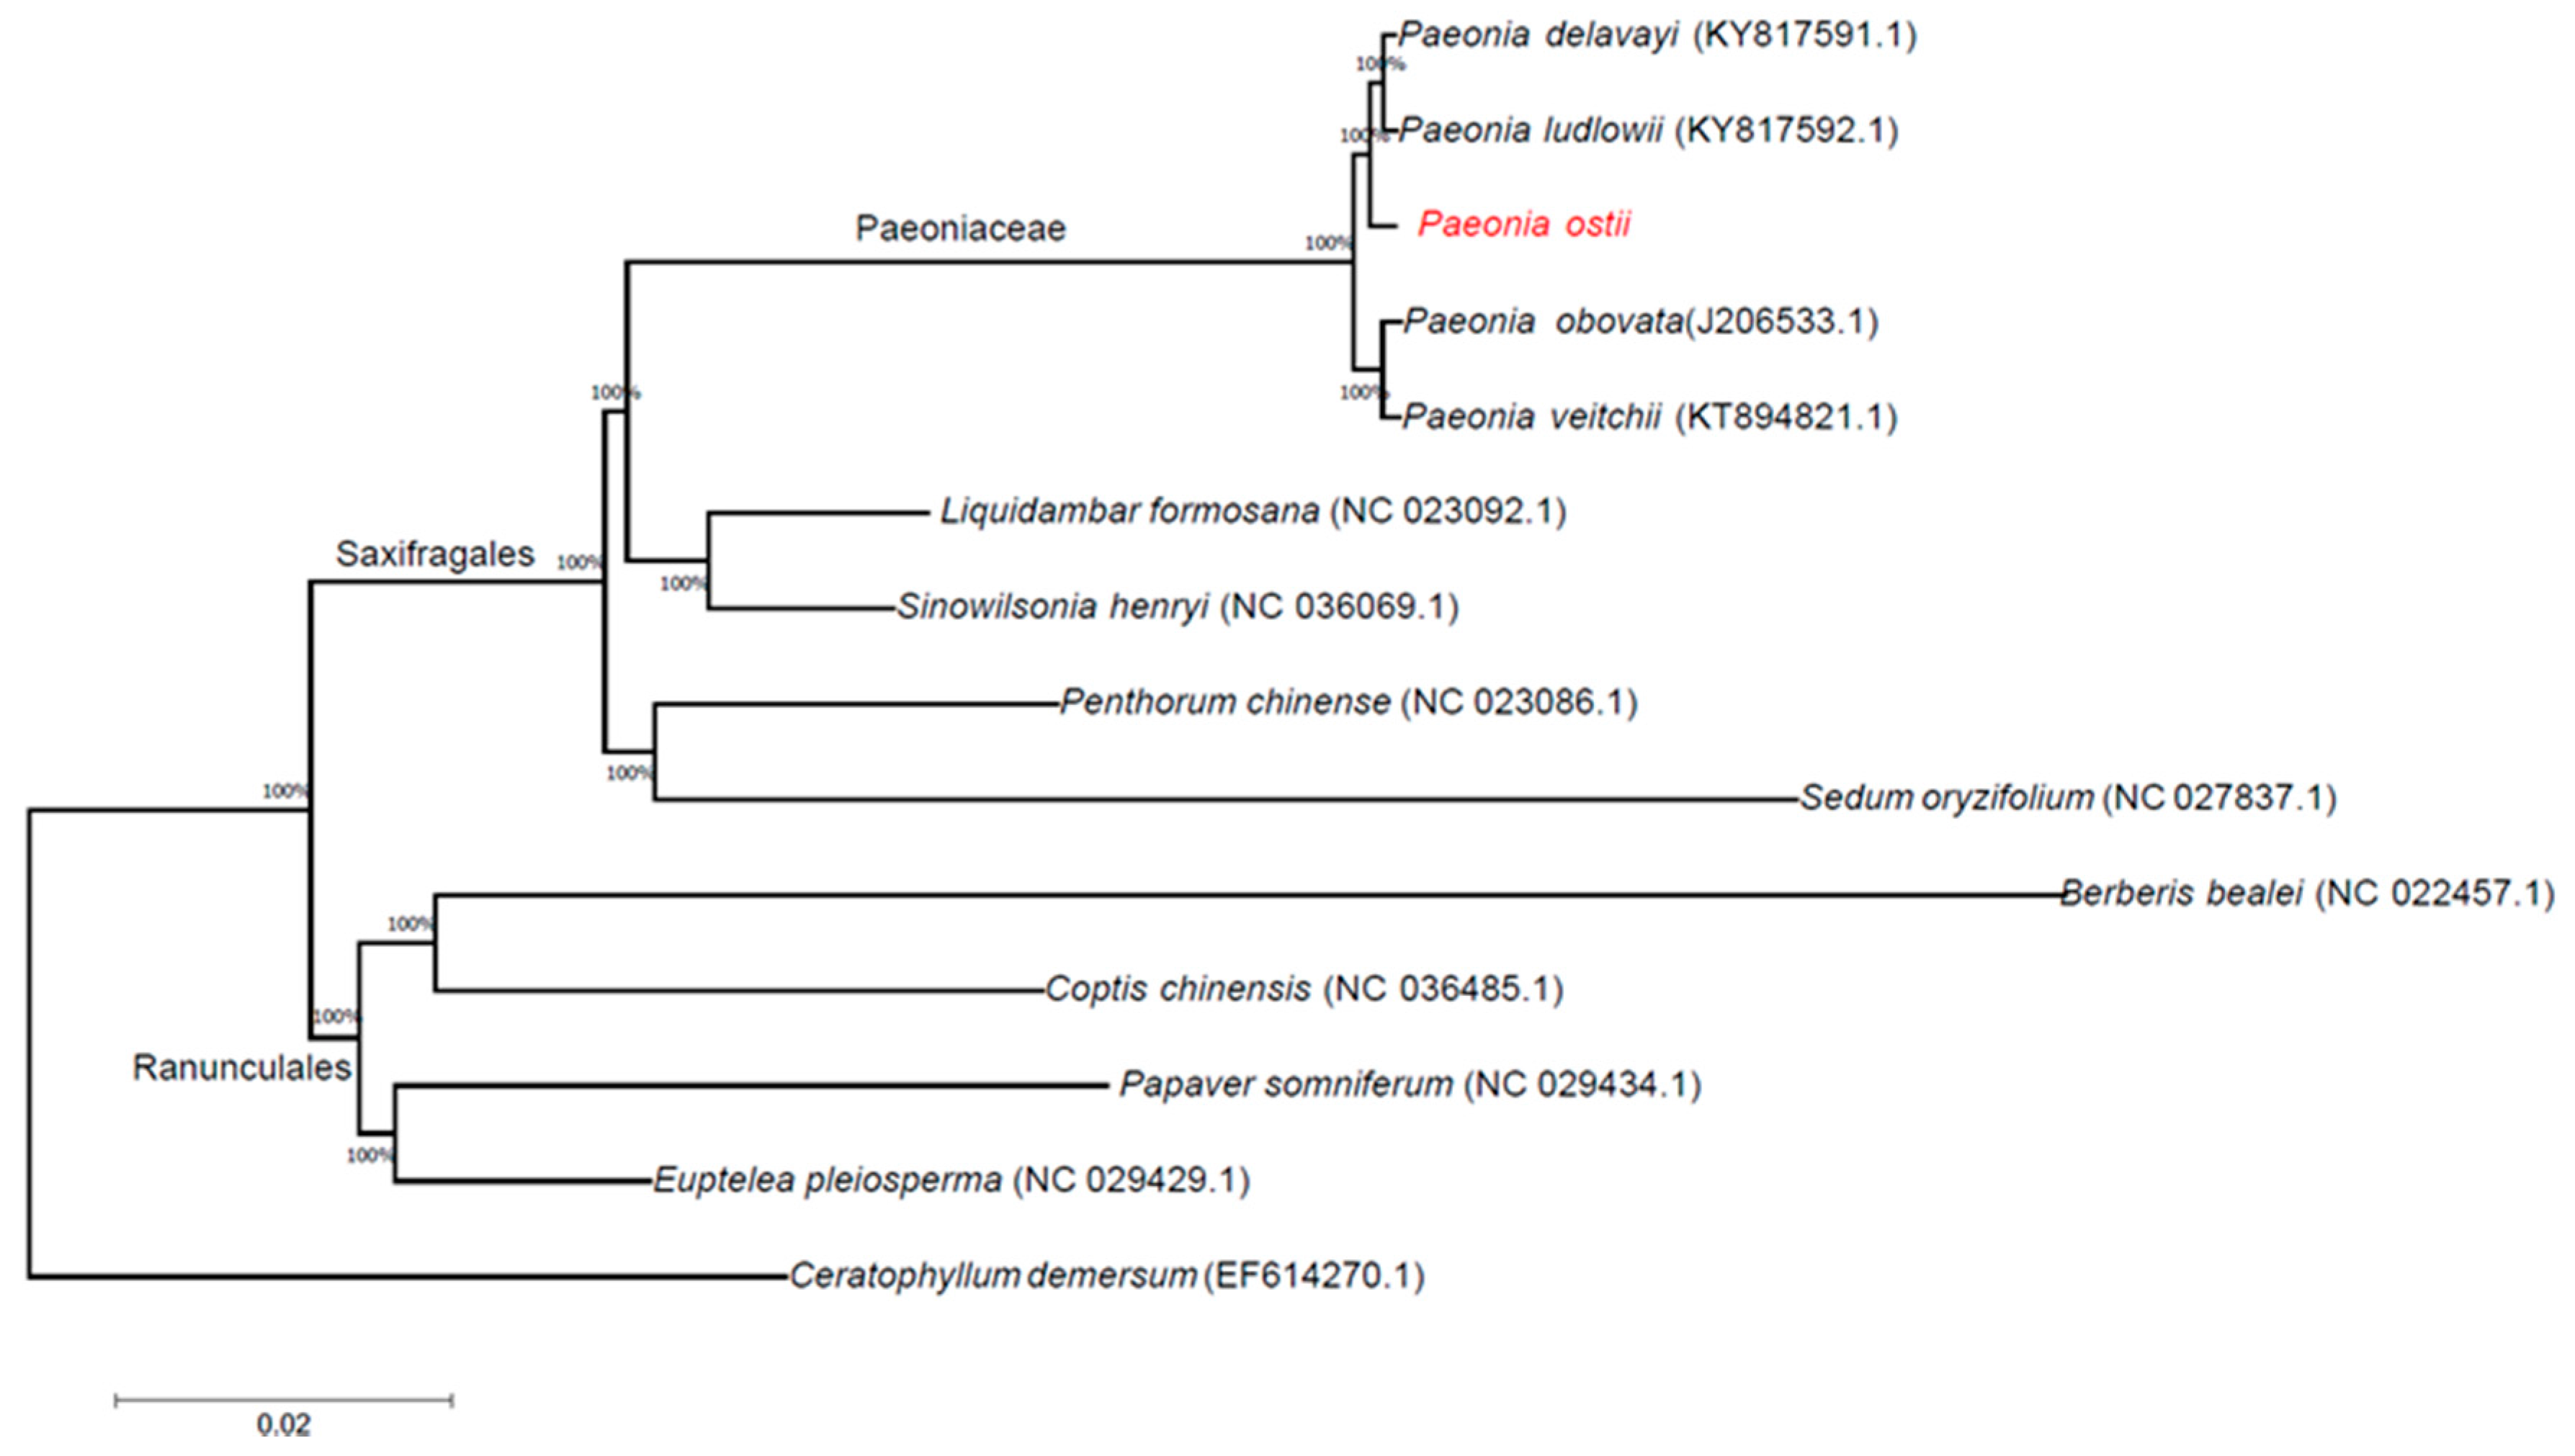
Phylogenetic analyses were completed on an alignment of concatenated nucleotide sequences of all chloroplast genomes from 14 angiosperm species. We used the method of maximum likelihood (ML) to build a phylogenetic tree based on these chloroplast genome data, and Ceratophyllum demersum was used as the outgroup (Figure 6). The ML phylogenetic results powerfully supported the hypothesis that all Paeonia species form a subgroup. P. delavayi and P. ludlowii are sister species; P. ostii is closer to P. delavayi and P. ludlowii than to P. obovata and P. veitchii. According to the phylogenetic analysis of chloroplast genomes, the Paeoniaceae family belongs to the Saxifragales rather than the Ranunculales.
3. Materials and Methods
3.1. DNA Sequencing, Chloroplast Genome Assembly, and Validation
The oil-tree peony used was P. ostii, planted in the experimental field of Henan University of Science and Technology in Luoyang, China (N 34°44′, E 112°27′). Fresh P. ostii leaves were collected and wrapped with tin foil, frozen by liquid nitrogen, and stored in a −80 °C preservation reserve. A modified cetyltrimethylammonium bromide (CTAB) method was used to extract the whole genomic DNA of P. ostii [64]. The concentration of DNA was checked by using a ND-2000 spectrometer (Nanodrop Technologies, Wilmington, DE, USA). The library type was a 250 bp shotgun library according to the manufacturer’s instructions (Vazyme Biotech Co. Ltd., Nanjing, China). The library was sequenced by the Illumina Hiseq X Ten platform double terminal sequencing method. The amount of data from the sample was 7.5 G; the total number of raw reads was 50 million (SRA accession: SRP129874).
The raw data was filtered by Skewer-0.2.2 [65]. BLAST searches were used to extract chloroplast-like reads from clean reads in comparison with reference sequences (P. ludlowii) [66]. Finally, we used the chloroplast-like reads to assemble sequences by using SOAPdenovo-2.04 [67]. SSPACE-3.0 and GapCloser-1.12 were used to extend sequences and fill gaps [68,69]. PCR amplification and Sanger sequencing were used to check the four junction regions between the IR regions and LSC/SSC to confirm the assembly (Table S1).
3.2. Gene Annotation and Sequence Analyses
CpGAVAS was used to annotate the sequences; DOGMA (http://dogma.ccbb.utexas.edu/) and BLAST were used to check the results of annotation [70,71]. tRNAscanSEv1.21 (http://lowelab.ucsc.edu/tRNAscan-SE/), with default settings, was used to identify all tRNA genes [70]. OGDRAWv1.2 (http://ogdraw.mpimp-golm.mpg.de/) was used to illustrate the structural features of chloroplast genomes [72]. Relative synonymous codon usage (RSCU) values were determined by MEGA5.2 (Department of Biological Sciences, Tokyo, Japan) [73].
3.3. Genome Comparison
The program mVISTA (Shuffle-LAGAN mode) was used to compare the whole chloroplast genome of P. ostii with the whole chloroplast genomes of P. delavayi, P. ludlowii, P. obovata and P. veitchii (KY817591, KY817592, KJ206533, KT894821) with the annotation of P. ostii as the reference [74,75]. The SSRs and forward (inverted) repeats were detected by Tandem Repeats Finder (Department of Biomathematical Sciences, New York, NY, USA) and REPuter individually (https://tandem.bu.edu/trf/trf.html) [76,77]. Phobos version 3.3.12 [78] was used to detect (SSRs) within the cp genome, with the search parameters set at ≥10 repeat units for mononucleotides, ≥8 repeat units for dinucleotides, ≥4 repeat units for trinucleotides and tetranucleotides, and ≥3 repeat units for pentanucleotide and hexanucleotide SSRs.
3.4. Phylogenetic Analysis
We downloaded 13 whole chloroplast genome sequences from the NCBI Organelle Genome and Nucleotide Resources database and used all genomes to analyze the phylogenetics. The software clustalw2 (The Conway Institute of Biomolecular and Biomedical Research, Dublin, Ireland) was used to align the genome [79]. MEGA5.2 (Department of Biological Sciences, Tokyo, Japan) [73] was used to analyze and plot the phylogenetic tree with ML (maximum likelihood). Bootstrap analysis was executed with 1000 replicates and TBR branch swapping. We used 1000 replicates and TBR branch exchange to complete the bootstrap analysis. Furthermore, Ceratophyllum demersum was set as the outgroup.
4. Conclusions
In summary, we present the first complete chloroplast genome of P. ostii, an important plant used for ornamental and medicinal purposes and for its oil. The genome sequencing, assembly, annotation and comparative analysis revealed that the chloroplast genome of P. ostii has a quadruple structure, gene order, DNA G+C content, and codon usage features similar to those of other Paeonia species’ chloroplast genomes. Compared with the chloroplast genomes of four related Paeonia species, the chloroplast genome size of P. ostii is the smallest, while the genome structure and composition are similar. Phylogenetic relationships among six Paeonia species revealed that P. ostii is more closely related to P. delavayi and P. ludlowii than to P. obovata and P. veitchii. The results of this study provide an assembly of a whole chloroplast genome of P. ostii, which may be useful for future breeding and further biological discoveries. It will provide a theoretical basis for the improvement of peony yield and the determination of phylogenetic status.
Supplementary Materials
Supplementary materials are available online. Table S1: Primers used for assembly validation.
Acknowledgments
This work was supported by the Natural Science Foundation of Henan Province, under Grant #162300410079; the National Natural Science Foundation of China, under Grant #31370697; the Plan for Scientific Innovation Talent of Henan Province, under Grant #164200510013; and the Major Project of “Research on modernization of traditional Chinese medicine”, under Grant #2017YFC1702100.
Author Contributions
The research structure was conceived and designed by W.Z., X.H. and J.X.; Y.L. prepared the sample; S.G. performed the experiments and wrote the paper and analyzed the data; L.G., X.S., X.Z., and M.W. made revisions to the final manuscript. The final manuscript was read and corrected by all authors.
Conflicts of Interest
The authors declare no conflict of interest.
References
- Wang, Y.; Dong, C.; Xue, Z.; Jin, Q.; Xu, Y. De novo transcriptome sequencing and discovery of genes related to copper tolerance in Paeonia ostii. Gene 2016, 576, 126–135. [Google Scholar] [CrossRef] [PubMed]
- Gai, S.; Zhang, Y.; Liu, C.G.S.; Zhang, Y.; Liu, C.; Zhang, Y. Transcript profiling of Paoenia ostii during artificial chilling induced dormancy release identifies activation of GA pathway and carbohydrate metabolism. PLoS ONE 2013, 8, e55297. [Google Scholar] [CrossRef] [PubMed]
- Han, J.; Song, Y.; Liu, Z.; Hu, Y. Culturable bacterial community analysis in the root domains of two varieties of tree peony (Paeonia ostii). FEMS Microbiol. Lett. 2011, 322, 15–24. [Google Scholar] [CrossRef] [PubMed]
- Yuan, J.H.; Cheng, F.Y.; Zhou, S.L. The phylogeographic structure and conservation genetics of the endangered tree peony, Paeonia rockii (Paeoniaceae), inferred from chloroplast gene sequences. Conserv. Genet. 2011, 12, 1539–1549. [Google Scholar] [CrossRef]
- Deng, R.X.; Liu, Z.; Qin, L.L.; Wang, L.; Liu, X.Q.; Liu, P. Optimization of supercritical CO2 extraction and analysis of chemical composition of peony seed oil. Food Sci. 2010, 10, 142–145. [Google Scholar]
- Han, X.Y.; Zhang, Y.L.; Niu, L.X.; Luo, J.R.; Amp, N.A.; University, F. Fatty acid composition of ‘Fengdan‘ peony seed oils from different growing regions. Food Sci. 2014, 22, 181–184. [Google Scholar]
- Qi, J.C.; Zhou, H.M.; Ma, J.Q.; Pu, L. Analysis of the chemical constituents in peony seed oil by GC-MS. J. Cereals Oils 2005, 11, 22–23. [Google Scholar]
- Sevim, D.; Senol, F.S.; Gulpinar, A.R.; Orhan, I.E.; Kaya, E.; Kartal, M.; Sener, B. Discovery of potent in vitro neuroprotective effect of the seed extracts from seven Paeonia L. (peony) taxa and their fatty acid composition. Ind. Crops Prod. 2013, 49, 240–246. [Google Scholar] [CrossRef]
- Yi, J.P.; Zhu, W.X.; Ma, H.L.; Wang, Y.F. Optimization on ultrasonic-assisted extraction technology of oil from Paeonia suffruticosa Andr. seeds with response surface analysis. Trans. Chin. Soc. Agric. Mach. 2009, 40, 103–110. [Google Scholar]
- Zhang, X.; Zhang, Y.; Niu, L.; Sun, J.; Li, L.; Zhang, J.; Li, J. Chemometric classification of different tree peony species native to China based on the assessment of major fatty acids of seed oil and phenotypic characteristics of the seeds. Chem. Biodives. 2017, 14, 1612–1880. [Google Scholar] [CrossRef] [PubMed]
- Zhou, H.M.; Ma, J.Q.; Miao, C.Y.; Hu, J.L.; Yang, Z.Y.; Li, P.; Zheng, M.L. Physicochemical indexes and fatty acid composition of peony seed oil. China Oils Fats 2009, 34, 72–74. [Google Scholar]
- Barceló-Coblijn, G.; Murphy, E.J. Alpha-linolenic acid and its conversion to longer chain n−3 fatty acids: Benefits for human health and a role in maintaining tissue n−3 fatty acid levels. Prog. Lipid Res. 2009, 48, 355–374. [Google Scholar] [CrossRef] [PubMed]
- Carlson, S.J.; Fallon, E.M.; Kalish, B.T.; Gura, K.M.; Puder, M. The role of the ω-3 fatty acid DHA in the human life cycle. JPEN J. Parenter. Enteral Nutr. 2013, 37, 15–22. [Google Scholar] [CrossRef] [PubMed]
- Stark, A.H.; Crawford, M.A.; Reifen, R. Update on alpha-linolenic acid. Nutr. Rev. 2008, 66, 326–332. [Google Scholar] [CrossRef] [PubMed]
- Lessard-Therrien, M.; Davies, T.J.; Bolmgren, K. A phylogenetic comparative study of flowering phenology along an elevational gradient in the Canadian subarctic. Int. J. Biometeorol. 2014, 58, 455–462. [Google Scholar] [CrossRef] [PubMed]
- Brunkard, J.O.; Runkel, A.M.; Zambryski, P.C. Chloroplasts extend stromules independently and in response to internal redox signals. Proc. Natl. Acad. Sci. USA 2015, 112, 10044–10049. [Google Scholar] [CrossRef] [PubMed]
- Daniell, H.; Chase, C. Molecular Biology and Biotechnology of Plant Organelles; Springer: Dordrecht, The Netherlands, 2004. [Google Scholar]
- Shen, X.; Wu, M.; Liao, B.; Liu, Z.; Bai, R.; Xiao, S.; Li, X.; Zhang, B.; Xu, J.; Chen, S. Complete chloroplast genome sequence and phylogenetic analysis of the medicinal plant Artemisia annua. Molecules 2017, 22, 1330. [Google Scholar] [CrossRef] [PubMed]
- Jansen, R.K.; Raubeson, L.A.; Boore, J.L.; Depamphilis, C.W.; Chumley, T.W.; Haberle, R.C.; Wyman, S.K.; Alverson, A.J.; Peery, R.; Herman, S.J. Methods for obtaining and analyzing whole chloroplast genome sequences. Methods Enzymol. 2005, 395, 348–384. [Google Scholar] [PubMed]
- Chen, X.; Liu, C. Progress in Chloroplast Genome Analysis. Prog. Biochem. Biophys. 2008, 35, 21–28. [Google Scholar]
- Tao, S.; Crawford, D.J.; Stuessy, T.F. Chloroplast DNA phylogeny, reticulate evolution, and biogeography of Paeonia (Paeoniaceae). Am. J. Bot. 1997, 84, 1120–1136. [Google Scholar]
- Yuan, J.H.; Cheng, F.Y.; Zhou, S.L. Hybrid origin of Paeonia x Yananensis revealed by microsatellite markers, chloroplast gene sequences, and morphological characteristics. Int. J. Plant Sci. 2010, 171, 409–420. [Google Scholar] [CrossRef]
- Zhang, J.M.; Liu, J.; Sun, H.L.; Yu, J.; Wang, J.X.; Zhou, S.L. Nuclear and chloroplast SSR markers in Paeonia delavayi (Paeoniaceae) and cross-species amplification in P. ludlowii. Am. J. Bot. 2011, 98, 346–348. [Google Scholar] [CrossRef] [PubMed]
- Zhang, J.M.; Liu, J.; Sun, H.L.; Yu, J.; Wang, J.X.; Zhou, S.L. Phylogenetic analysis of Paeonia sect. Moutan (Paeoniaceae) based on multiple DNA fragments and morphological data. J. Syst. Evol. 2008, 46, 563–572. [Google Scholar]
- Zhou, S.L.; Zou, X.H.; Zhou, Z.Q.; Liu, J.; Xu, C.; Yu, J.; Wang, Q.; Zhang, D.M.; Wang, X.Q.; Ge, S. Multiple species of wild tree peonies gave rise to the ‘king of flowers’, Paeonia suffruticosa Andrews. Proc. Biol. Sci. 2014, 281, 1687. [Google Scholar] [CrossRef] [PubMed]
- Sidonie, B.; Natalie, C.; Luo, S.; Sun, G.; Shahin, Z.; Andreas, G.; Eva, T.; Renner, S.S. Assembled plastid and mitochondrial genomes, as well as nuclear genes, place the parasite family Cynomoriaceae in the Saxifragales. Genome Biol. Evol. 2016, 8, 2214–2230. [Google Scholar]
- Asaf, S.; Khan, A.L.; Khan, M.A.; Waqas, M.; Kang, S.M.; Yun, B.W.; Lee, I.J. Chloroplast genomes of Arabidopsis halleri ssp. gemmifera and Arabidopsis lyrata ssp. petraea: Structures and comparative analysis. Sci. Rep. 2017, 7, 7556. [Google Scholar] [PubMed]
- Ng, P.K.; Lin, S.M.; Lim, P.E.; Liu, L.C.; Chen, C.M.; Pai, T.W. Complete chloroplast genome of Gracilaria firma (Gracilariaceae, Rhodophyta), with discussion on the use of chloroplast phylogenomics in the subclass Rhodymeniophycidae. BMC Genom. 2017, 18, 40. [Google Scholar] [CrossRef] [PubMed]
- Xu, C.; Dong, W.; Li, W.; Lu, Y.; Xie, X.; Jin, X.; Shi, J.; He, K.; Suo, Z. Comparative analysis of six Lagerstroemia complete chloroplast genomes. Front. Plant Sci. 2017, 8, 15. [Google Scholar] [CrossRef] [PubMed]
- He, Y.; Xiao, H.; Deng, C.; Xiong, L.; Yang, J.; Peng, C. The complete chloroplast genome sequences of the medicinal plant Pogostemon cablin. Int. J. Mol. Sci. 2016, 17, 820. [Google Scholar] [CrossRef] [PubMed]
- Shetty, S.M.; Md Shah, M.U.; Makale, K.; Mohdyusuf, Y.; Khalid, N.; Othman, R.Y. Complete chloroplast genome sequence of Musa balbisiana corroborates structural heterogeneity of inverted repeats in wild progenitors of cultivated bananas and plantains. Plant Genome 2016, 9, 1940–3372. [Google Scholar] [CrossRef] [PubMed]
- Boudreau, E.; Takahashi, Y.; Lemieux, C.; Turmel, M.; Rochaix, J.D. The chloroplast ycf3 and ycf4 open reading frames of Chlamydomonas reinhardtii are required for the accumulation of the photosystem I complex. EMBO J. 1997, 16, 6095–6104. [Google Scholar] [CrossRef] [PubMed]
- Naver, H.; Boudreau, E.; Rochaix, J.D. Functional studies of Ycf3: Its role in assembly of photosystem I and interactions with some of its subunits. Plant Cell 2001, 13, 2731–2745. [Google Scholar] [CrossRef] [PubMed]
- Feng, Y.; Cui, L.; Depamphilis, C.W.; Moret, B.M.; Tang, J. Gene rearrangement analysis and ancestral order inference from chloroplast genomes with inverted repeat. BMC Genomics 2008, 9, S25. [Google Scholar]
- Haberle, R.C.; Fourcade, H.M.; Boore, J.L.; Jansen, R.K. Extensive rearrangements in the chloroplast genome of Trachelium caeruleum are associated with repeats and tRNA genes. J. Mol. Evol. 2008, 66, 350–361. [Google Scholar] [CrossRef] [PubMed]
- Downie, S.R.; Llanas, E.; Katz-Downie, D.S. Multiple independent losses of the rpoC1 intron in angiosperm chloroplast DNA’s. Syst. Bot. 1996, 21, 135–151. [Google Scholar] [CrossRef]
- Downie, S.R.; Olmstead, R.G.; Zurawski, G.; Soltis, D.E.; Soltis, P.S.; Watson, J.C.; Palmer, J.D. Six independent losses of the chloroplast DNA rpl2 intron in dicotyledons: Molecular and phylogenetic implications. Evolution 1991, 45, 1245–1259. [Google Scholar] [CrossRef] [PubMed]
- Graveley, B.R. Alternative splicing: Increasing diversity in the proteomic world. Trends Genet. 2001, 17, 100–107. [Google Scholar] [CrossRef]
- Guisinger, M.M.; Chumley, T.W.; Kuehl, J.V.; Boore, J.L.; Jansen, R.K. Implications of the plastid genome sequence of Typha (Typhaceae, Poales) for understanding genome evolution in Poaceae. J. Mol. Evol. 2010, 70, 149–166. [Google Scholar] [CrossRef] [PubMed]
- Jansen, R.K.; Cai, Z.; Raubeson, L.A.; Daniell, H.; Depamphilis, C.W.; Leebensmack, J.; Kai, F.M. Analysis of 81 genes from 64 plastid genomes resolves relationships in angiosperms and identifies genome-scale evolutionary patterns. Proc. Natl. Acad. Sci. USA 2007, 104, 19369–19374. [Google Scholar] [CrossRef] [PubMed]
- Ueda, M.; Fujimoto, M.; Arimura, S.; Murata, J.; Tsutsumi, N.; Kadowaki, K. Loss of the rpl32 gene from the chloroplast genome and subsequent acquisition of a preexisting transit peptide within the nuclear gene in Populus. Gene 2007, 402, 51–56. [Google Scholar] [CrossRef] [PubMed]
- Xu, J.; Chu, Y.; Liao, B.; Xiao, S.; Yin, Q.; Bai, R.; Su, H.; Dong, L.; Li, X.; Qian, J.; et al. Panax ginseng genome examination for ginsenoside biosynthesis. Gigascience 2017, 6, 1–15. [Google Scholar] [CrossRef] [PubMed]
- Niu, D.; Yang, Y. Why eukaryotic cells use introns to enhance gene expression: Splicing reduces transcription-associated mutagenesis by inhibiting topoisomerase I cutting activity. Biol. Direct 2011, 6, 24. [Google Scholar] [CrossRef] [PubMed]
- Le, H.; Nott, A.; Moore, M.J. How introns influence and enhance eukaryotic gene expression. Trends Biochem. Sci. 2003, 28, 215–220. [Google Scholar]
- Callis, J.; Fromm, M.; Walbot, V. Introns increase gene expression in cultured maize cells. Genes Dev. 1987, 1, 1183–1200. [Google Scholar] [CrossRef] [PubMed]
- Emami, S.; Arumainayagam, D.; Korf, I.; Rose, A.B. The effects of a stimulating intron on the expression of heterologous genes in Arabidopsis thaliana. Plant Biotechnol. J. 2013, 11, 555–563. [Google Scholar] [CrossRef] [PubMed]
- Dong, W.; Xu, C.; Cheng, T.; Lin, K.; Zhou, S. Sequencing angiosperm plastid genomes made easy: A complete set of universal primers and a case study on the phylogeny of saxifragales. Genome Biol. Evol. 2013, 5, 989–997. [Google Scholar] [CrossRef] [PubMed]
- Dong, W.; Xu, C.; Li, D.; Jin, X.; Li, R.; Lu, Q.; Suo, Z. Comparative analysis of the complete chloroplast genome sequences in psammophytic Haloxylon species (Amaranthaceae). Peer J. 2016, 4, e2699. [Google Scholar] [CrossRef] [PubMed]
- Suo, Z.; Li, W.Y.; Jin, X.B.; Zhang, H.J. A new nuclear DNA marker revealing both microsatellite variations and single nucleotide polymorphic loci: A case study on classification of cultivars in Lagerstroemia indica L. J. Microb. Biochem. Technol. 2016, 8, 266–271. [Google Scholar] [CrossRef]
- Yang, Y.; Zhou, T.; Duan, D.; Yang, J.; Feng, L.; Zhao, G. Comparative analysis of the complete chloroplast genomes of five Quercus species. Front. Plant Sci. 2016, 7, 959. [Google Scholar] [CrossRef] [PubMed]
- Huang, Z.H.; Xu, J.; Xiao, S.M.; Liao, B.S.; Gao, Y.; Zhai, C.C.; Qiu, X.H.; Xu, W.; Chen, S.L. Comparative optical genome analysis of two pangolin species: Manis pentadactyla and Manis javanica. Gigascience 2016, 5, 1–5. [Google Scholar]
- Chen, S.; Xu, J.; Liu, C.; Zhu, Y.; Nelson, D.R.; Zhou, S.; Li, C.; Wang, L.; Guo, X.; Sun, Y. Genome sequence of the model medicinal mushroom Ganoderma lucidum. Nat. Commun. 2012, 3, 913. [Google Scholar] [CrossRef] [PubMed]
- Ni, L.; Zhao, Z.; Xu, H.; Chen, S.; Dorje, G. The complete chloroplast genome of Gentiana straminea (Gentianaceae), an endemic species to the Sino-Himalayan subregion. Gene 2016, 577, 281–288. [Google Scholar] [CrossRef] [PubMed]
- Kode, V.; Mudd, E.A.; Iamtham, S.; Day, A. The tobacco plastid accD gene is essential and is required for leaf development. Plant J. 2005, 44, 237–244. [Google Scholar] [CrossRef] [PubMed]
- Raubeson, L.A.; Peery, R.; Chumley, T.W.; Dziubek, C.; Fourcade, H.M.; Boore, J.L.; Jansen, R.K. Comparative chloroplast genomics: Analyses including new sequences from the angiosperms Nuphar advena and Ranunculus macranthus. BMC Genom. 2007, 8, 174. [Google Scholar] [CrossRef] [PubMed]
- Yao, X.; Tang, P.; Li, Z.; Li, D.; Liu, Y.; Huang, H. The first complete chloroplast genome sequences in Actinidiaceae: Genome structure and comparative analysis. PLoS ONE 2015, 10, e0129347. [Google Scholar] [CrossRef] [PubMed]
- Dong, W.; Xu, C.; Li, C.; Sun, J.; Zuo, Y.; Shi, S.; Cheng, T.; Guo, J.; Zhou, S. ycf1, the most promising plastid DNA barcode of land plants. Sci. Rep. 2015, 5, 8348. [Google Scholar] [CrossRef] [PubMed]
- Kikuchi, S.; Bédard, J.; Hirano, M.; Hirabayashi, Y.; Oishi, M.; Imai, M.; Takase, M.; Ide, T.; Nakai, M. Uncovering the protein translocon at the chloroplast inner envelope membrane. Science 2013, 339, 571–574. [Google Scholar] [CrossRef] [PubMed]
- Doyle, J.J.; Davis, J.I.; Soreng, R.J.; Garvin, D.; Anderson, M.J. Chloroplast DNA inversions and the origin of the grass family (Poaceae). Proc. Natl. Acad. Sci. USA 1992, 89, 7722–7726. [Google Scholar] [CrossRef] [PubMed]
- Jansen, R.K.; Palmer, J.D. A chloroplast DNA inversion marks an ancient evolutionary split in the sunflower family (Asteraceae). Proc. Natl. Acad. Sci. USA 1987, 84, 5818–5822. [Google Scholar] [CrossRef] [PubMed]
- Kumar, S.; Hahn, F.M.; Mcmahan, C.M.; Cornish, K.; Whalen, M.C. Comparative analysis of the complete sequence of the plastid genome of Parthenium argentatum and identification of DNA barcodes to differentiate Parthenium species and lines. BMC Plant Biol. 2009, 9, 131. [Google Scholar] [CrossRef] [PubMed]
- Palmer, J.D.; Nugent, J.M.; Herbon, L.A. Unusual structure of geranium chloroplast DNA: A triple-sized inverted repeat, extensive gene duplications, multiple inversions, and two repeat families. Proc. Natl. Acad. Sci. USA 1987, 84, 769–773. [Google Scholar] [CrossRef] [PubMed]
- Raubeson, L.A.; Jansen, R.K. Chloroplast DNA evidence on the ancient evolutionary split in vascular land plants. Science 1992, 255, 1697–1699. [Google Scholar] [CrossRef] [PubMed]
- Shi, Q.H.; Yao, Z.P.; Zhang, H.; Xu, L.; Dai, P.H. Comparison of four methods of DNA extraction from chickpea. J. Xinjiang Agric. Univ. 2009, 1, 64–67. [Google Scholar]
- Jiang, H.; Rong, L.; Ding, S.W.; Zhu, S. Skewer: A fast and accurate adapter trimmer for next-generation sequencing paired-end reads. BMC Bioinform. 2014, 15, 182. [Google Scholar] [CrossRef] [PubMed]
- Deng, P.C.; Wang, L.; Cui, L.C.; Feng, K.W.; Liu, F.Y.; Du, X.D.; Tong, W.; Nie, X.J.; Ji, W.Q.; Weining, S. Global identification of microRNAs and their targets in barley under salinity stress. PLoS ONE 2015, 10, e0137990. [Google Scholar] [CrossRef] [PubMed]
- Gogniashvili, M.; Naskidashvili, P.; Bedoshvili, D.; Kotorashvili, A.; Kotaria, N.; Beridze, T. Complete chloroplast DNA sequences of Zanduri wheat ( Triticum spp.). Genet. Resour. Crop Evol. 2015, 62, 1269–1277. [Google Scholar] [CrossRef]
- Acemel, R.D.; Tena, J.J.; Irastorzaazcarate, I.; Marlétaz, F.; Gómezmarín, C.; Callemustienes, E.D.L.; Bertrand, S.; Diaz, S.G.; Aldea, D.; Aury, J.M. A single three-dimensional chromatin compartment in amphioxus indicates a stepwise evolution of vertebrate Hox bimodal regulation. Nat. Genet. 2016, 48, 336–341. [Google Scholar] [CrossRef] [PubMed]
- Boetzer, M.; Henkel, C.V.; Jansen, H.J.; Butler, D.; Pirovano, W. Scaffolding pre-assembled contigs using SSPACE. Bioinformatics 2011, 27, 578–579. [Google Scholar] [CrossRef] [PubMed]
- Chang, L.; Shi, L.; Zhu, Y.; Chen, H.; Zhang, J.; Lin, X.; Guan, X. CpGAVAS, an integrated web server for the annotation, visualization, analysis, and GenBank submission of completely sequenced chloroplast genome sequences. BMC Genom. 2012, 13, 715. [Google Scholar]
- Wyman, S.K.; Jansen, R.K.; Boore, J.L. Automatic annotation of organellar genomes with DOGMA. Bioinformatics 2004, 20, 3252–3255. [Google Scholar] [CrossRef] [PubMed]
- Lohse, M.; Drechsel, O.; Bock, R. OrganellarGenomeDRAW (OGDRAW): A tool for the easy generation of high-quality custom graphical maps of plastid and mitochondrial genomes. Curr. Genet. 2007, 52, 267–274. [Google Scholar] [CrossRef] [PubMed]
- Tamura, K.; Peterson, D.; Peterson, N.; Stecher, G.; Nei, M.; Kumar, S. MEGA5: Molecular evolutionary genetics analysis using maximum likelihood, evolutionary distance, and maximum parsimony methods. Mol. Biol. Evol. 2011, 28, 2731–2739. [Google Scholar] [CrossRef] [PubMed]
- Frazer, K.A.; Pachter, L.; Poliakov, A.; Rubin, E.M.; Dubchak, I. VISTA: Computational tools for comparative genomics. Nucleic Acids Res. 2004, 32, 273–279. [Google Scholar] [CrossRef] [PubMed]
- Mayor, C.; Brudno, M.; Schwartz, J.R.; Poliakov, A.; Rubin, E.M.; Frazer, K.A.; Pachter, L.S.; Dubchak, I. VISTA: Visualizing global DNA sequence alignments of arbitrary length. Bioinformatics 2000, 16, 1046–1047. [Google Scholar] [CrossRef] [PubMed]
- Kurtz, S.; Choudhuri, J.V.; Ohlebusch, E.; Schleiermacher, C.; Stoye, J.; Giegerich, R. REPuter: The manifold applications of repeat analysis on a genomic scale. Nucleic Acids Res. 2001, 29, 4633–4642. [Google Scholar] [CrossRef] [PubMed]
- Benson, G. Tandem repeats finder: A program to analyze DNA sequences. Nucleic Acids Res. 1999, 27, 573–580. [Google Scholar] [CrossRef] [PubMed]
- Kraemer, L.; Beszteri, B.; Gäbler-Schwarz, S.; Held, C.; Leese, F.; Mayer, C.; Pöhlmann, K.; Frickenhau, S. STAMP: Extensions to the STADEN sequence analysis package for high throughput interactive microsatellite marker design. BMC Bioinform. 2009, 10, 41. [Google Scholar] [CrossRef] [PubMed]
- Larkin, M.; Blackshields, G.; Brown, N.; Chenna, R.; Mcgettigan, P.; Mcwilliam, H.; Valentin, F.; Wallace, I.; Wilm, A.; Lopez, R.; et al. Clustal W and Clustal X v. 2.0. Bioinformatics 2007, 23, 2947–2948. [Google Scholar] [CrossRef] [PubMed]
Sample Availability: Sequence data of Paeonia ostii is available from the authors. |
Figure 1.
Gene map of the P. ostii chloroplast genome. Genes drawn inside the circle are transcribed clockwise, and those outsides are transcribed counterclockwise. Genes belonging to different functional groups are color-coded. The darker gray in the inner circle corresponds to DNA G+C content, while the lighter gray corresponds to A+T content. The gray arrowheads indicate the direction of the genes.
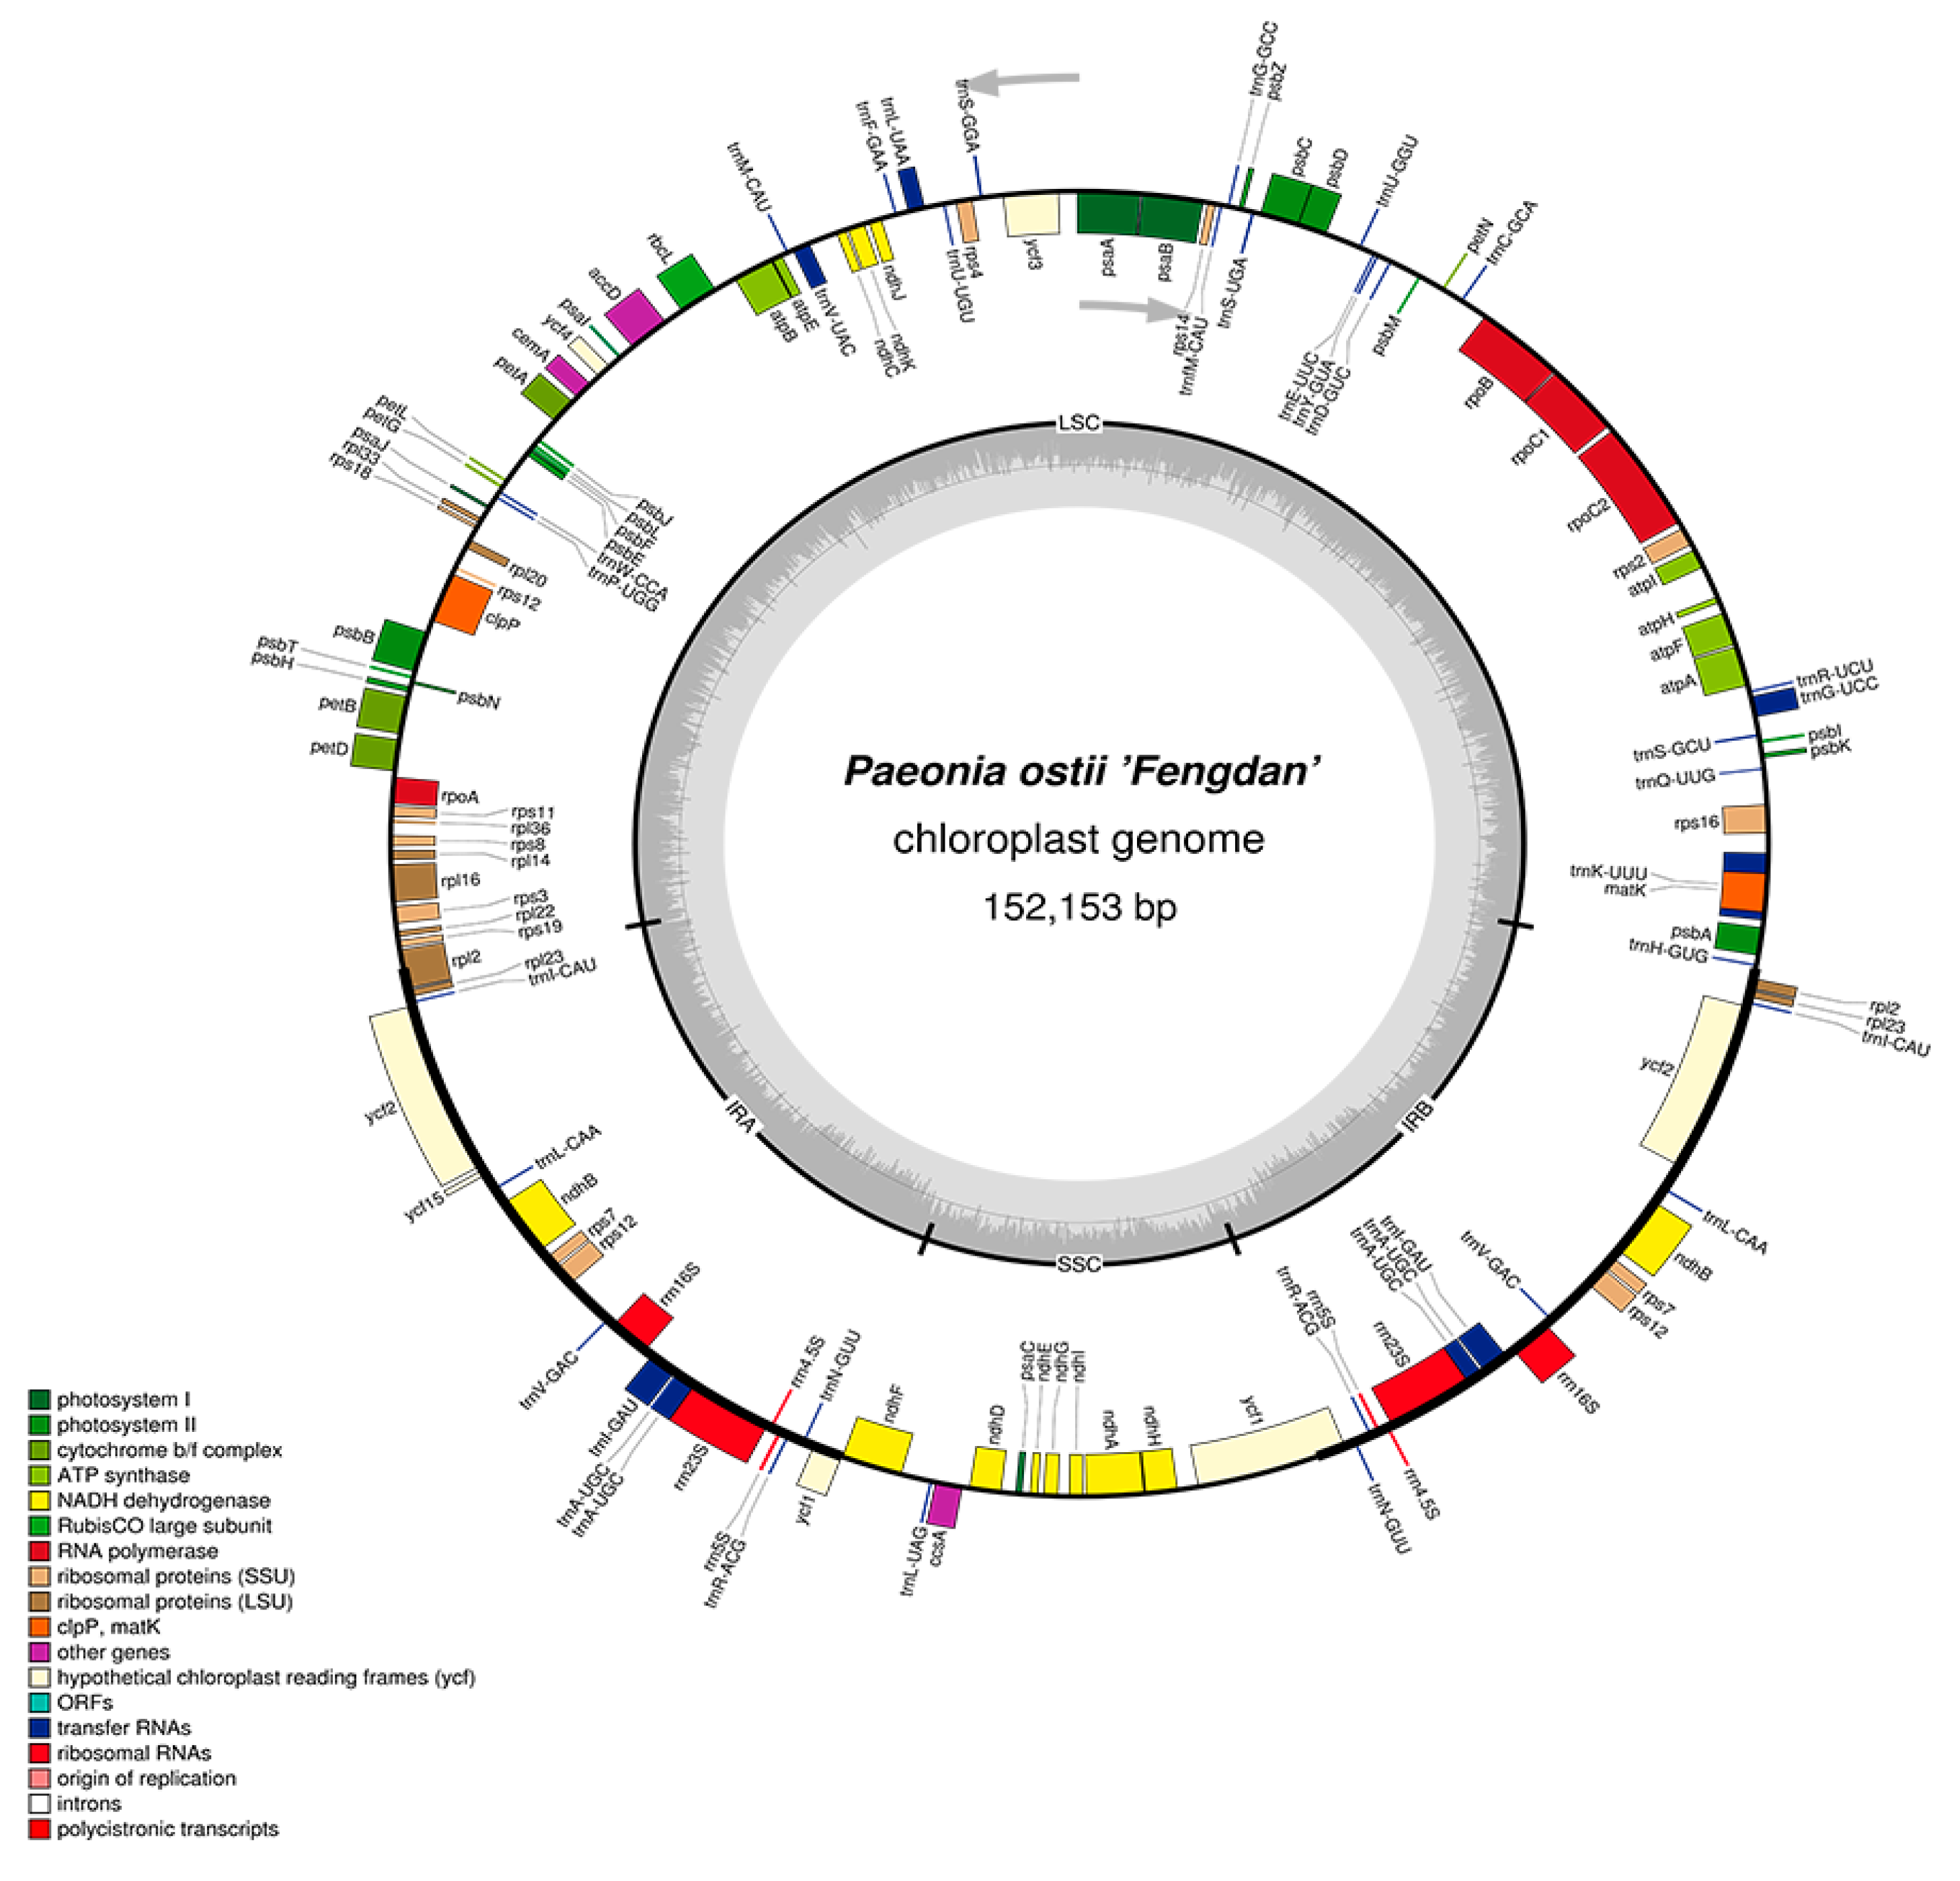
Figure 2.
Analysis of repeated sequences in five Paeonia chloroplast genomes. (A) Totals of three repeat types; (B) frequency of forward repeats by length; (C) frequency of palindromic repeats by length; (D) frequency of tandem repeats by length.
Figure 2.
Analysis of repeated sequences in five Paeonia chloroplast genomes. (A) Totals of three repeat types; (B) frequency of forward repeats by length; (C) frequency of palindromic repeats by length; (D) frequency of tandem repeats by length.

Figure 3.
Analysis of simple sequence repeats (SSRs) in the five Paeonia chloroplast genomes.
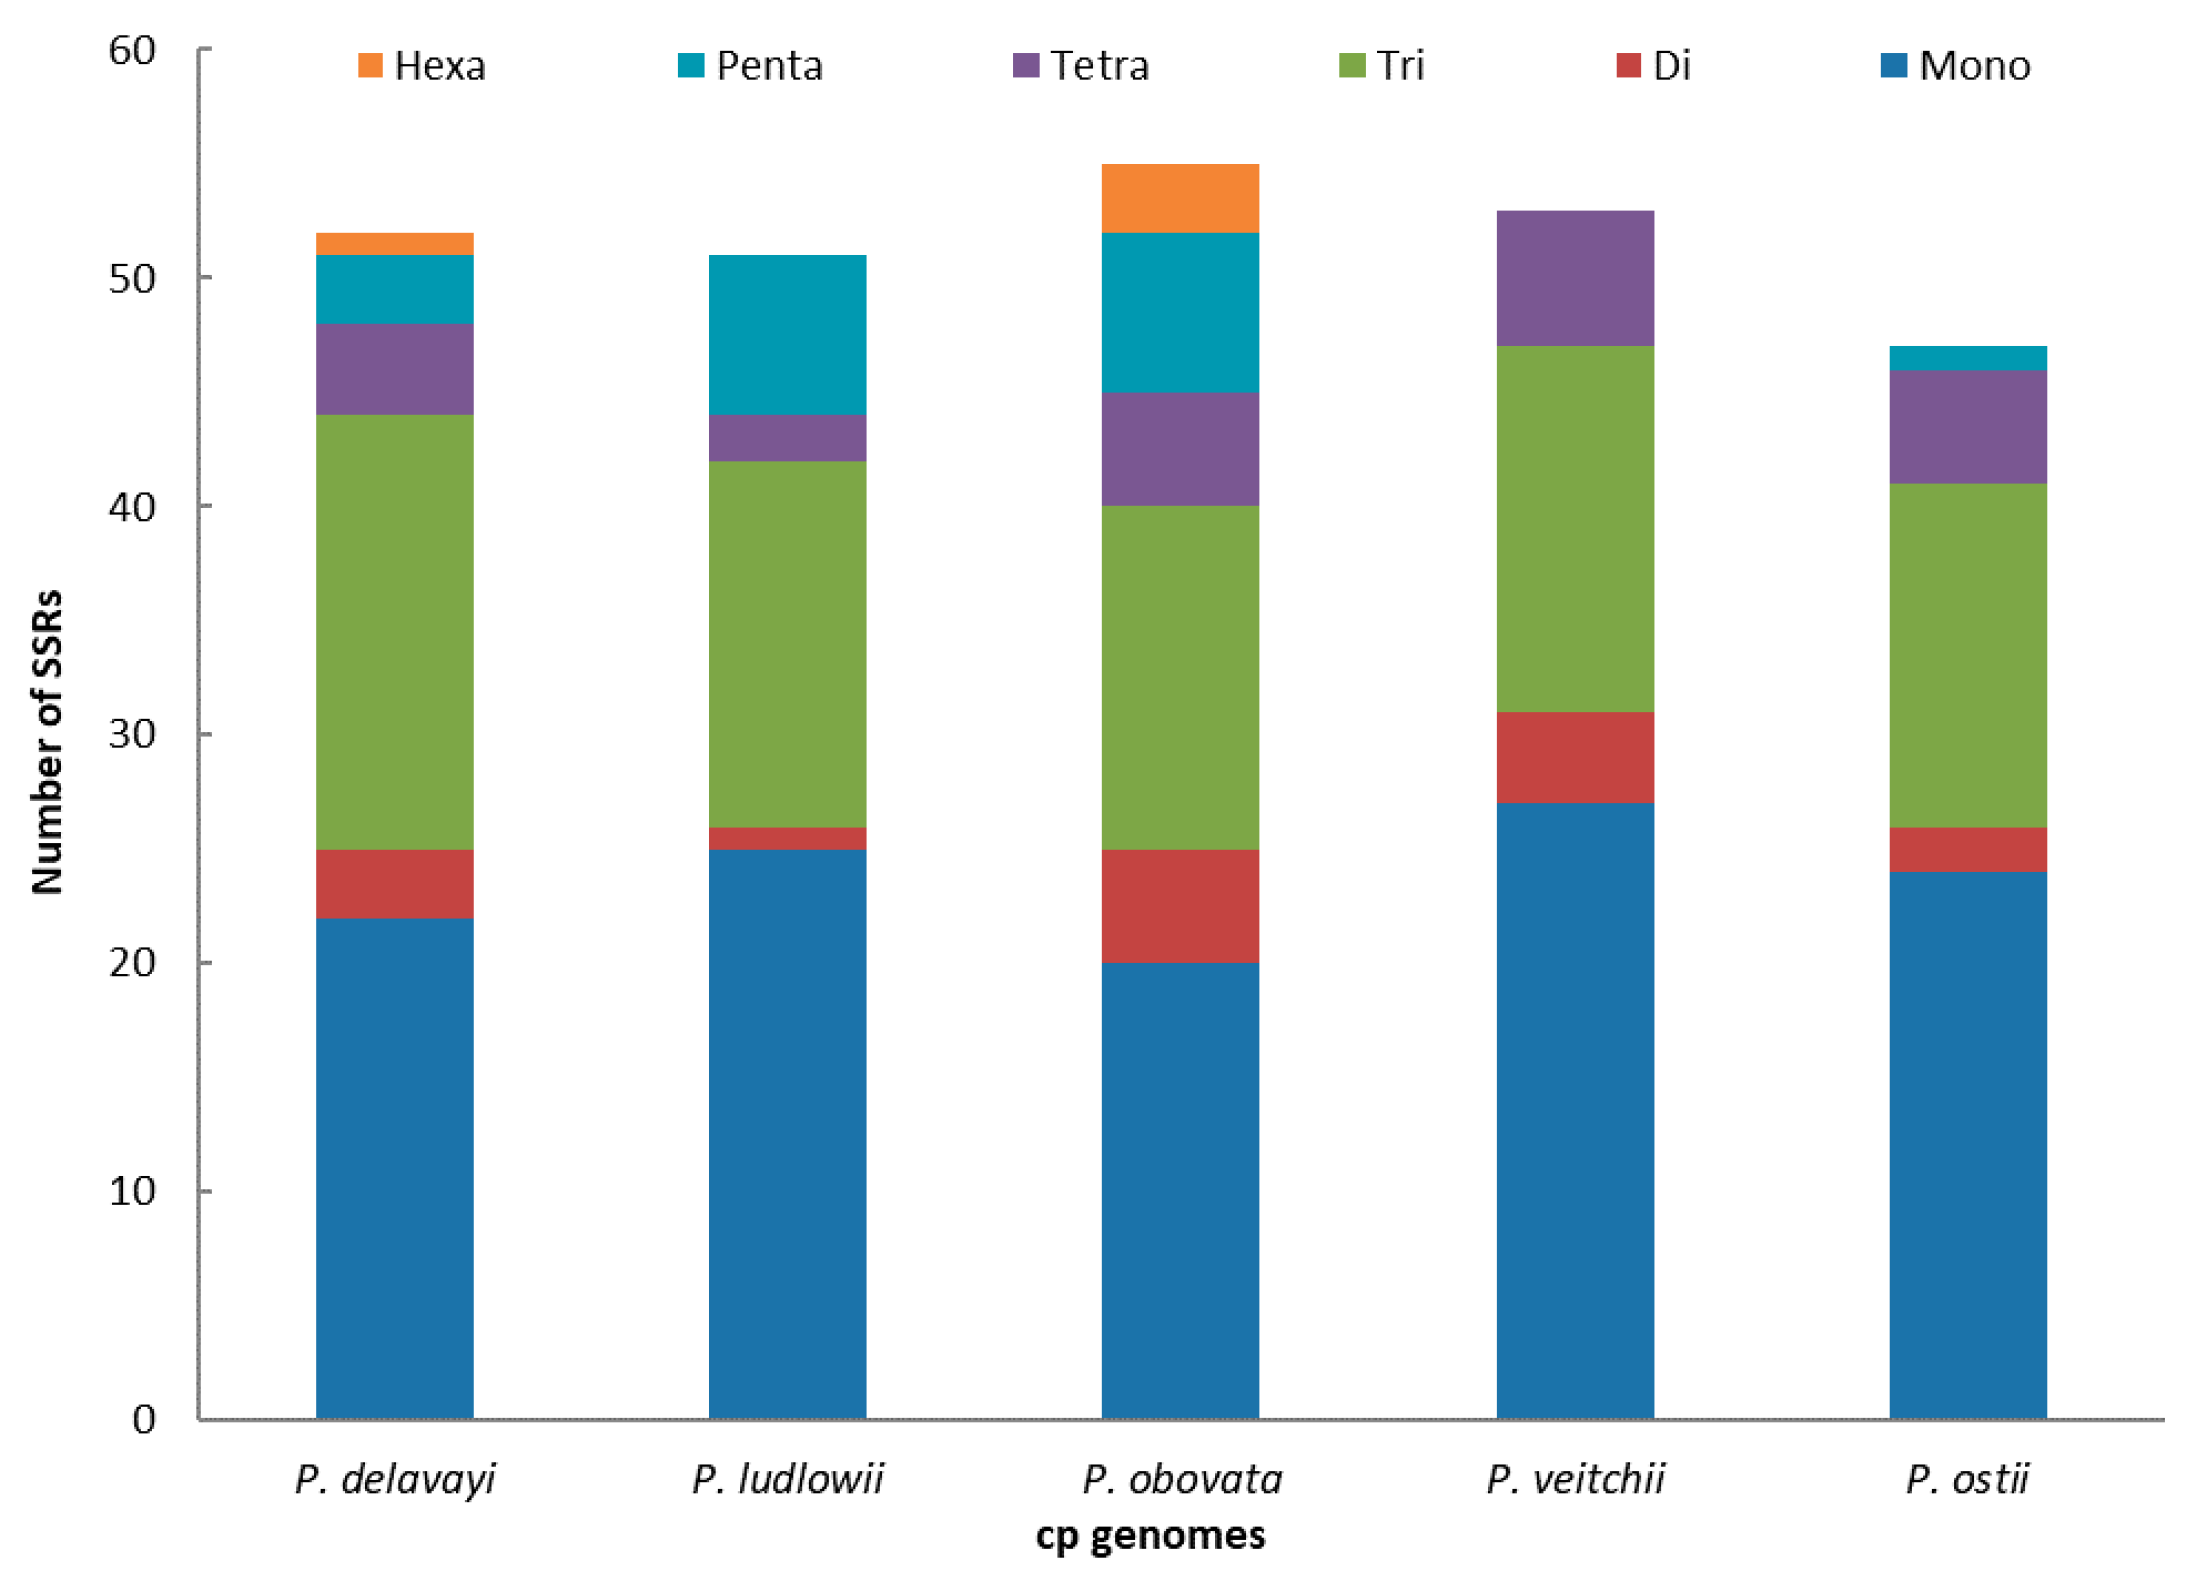
Figure 4.
Comparison of five chloroplast genomes using mVISTA. Gray arrows and thick black lines above the alignment indicate gene orientation. Purple bars represent exons, blue bars represent untranslated regions (UTRs), pink bars represent noncoding sequences (CNS), gray bars represent mRNA, and white peaks represent differences of genomics. The y-axis represents the percentage identity (shown: 50–100%).

Figure 5.
Comparison of border distance between adjacent genes and junctions of the LSC, SSC and two IR regions among the chloroplast genomes of five Paeonia species. Boxes above or below the main line indicate the adjacent border genes. The figure is not to scale with respect to sequence length, and only shows relative changes at or near the IR/SC borders.
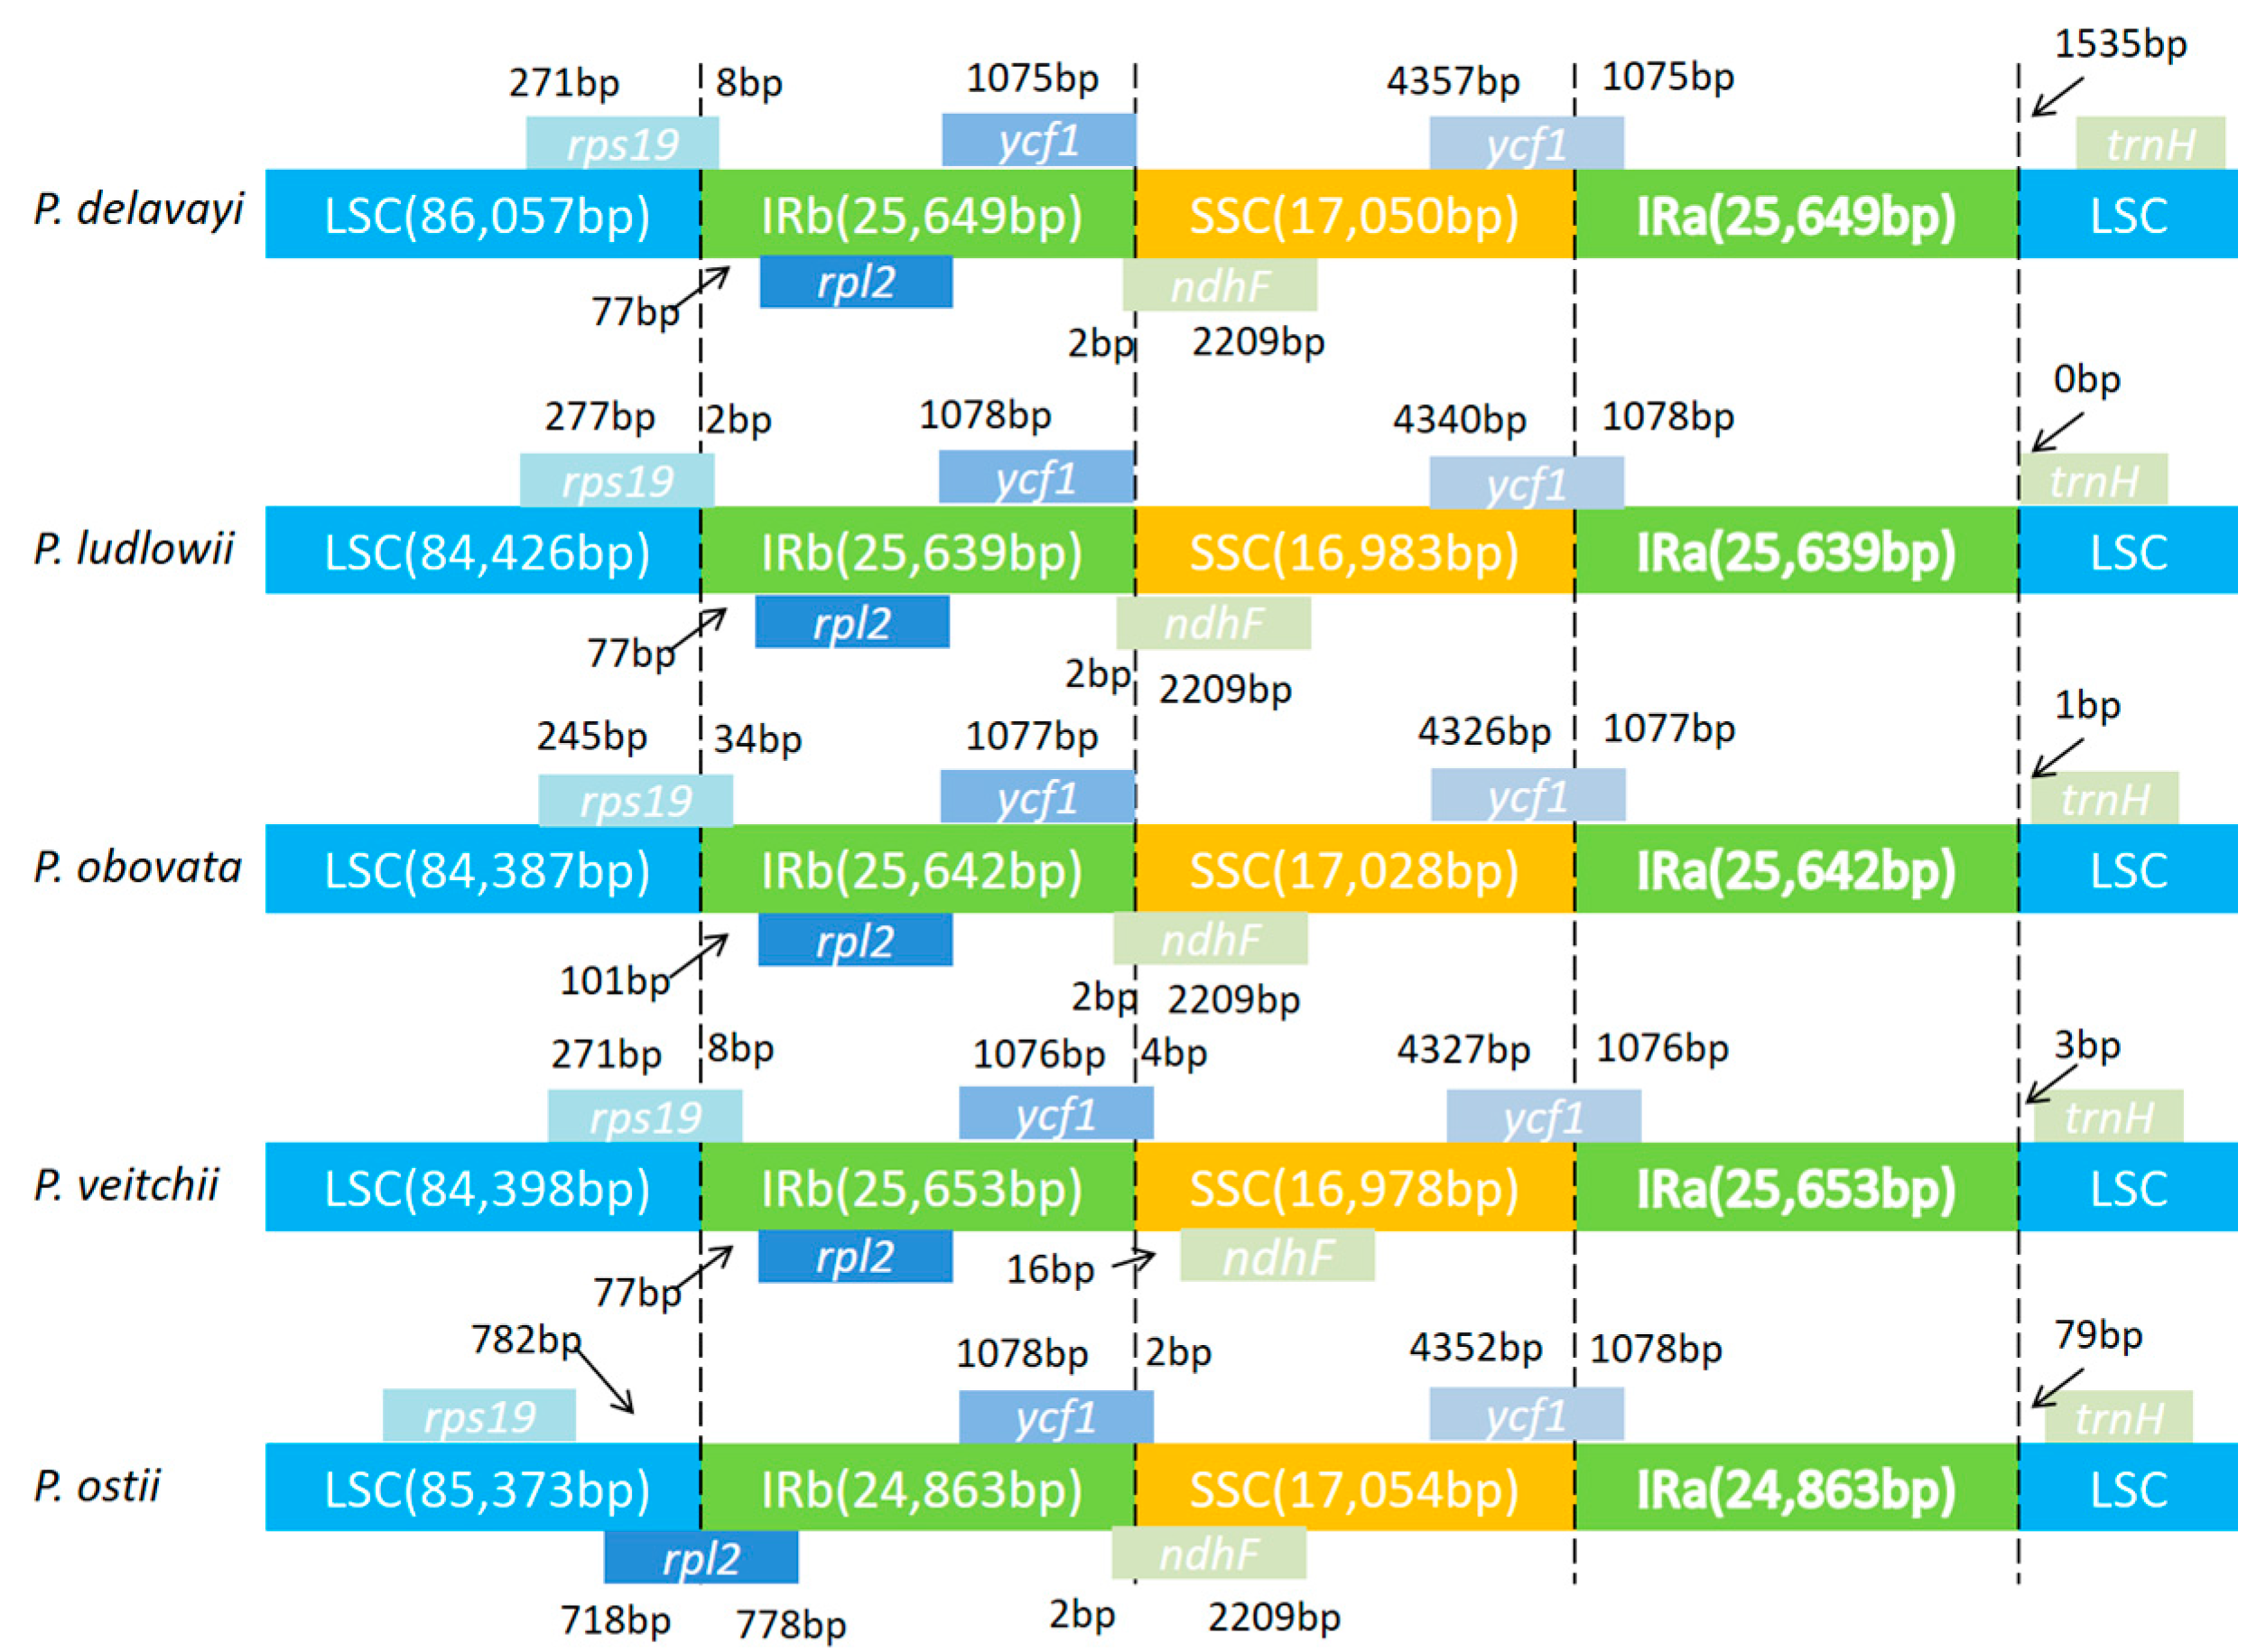
Figure 6.
ML phylogenetic tree reconstruction including 14 species based on all chloroplast genomes. The position of P. ostii is indicated in red font. Ceratophyllum demersum was used as the outgroup.
Figure 6.
ML phylogenetic tree reconstruction including 14 species based on all chloroplast genomes. The position of P. ostii is indicated in red font. Ceratophyllum demersum was used as the outgroup.

Table 1.
Summary of complete chloroplast genomes for five Paeonia species.
| Species | P. delavayi | P. ludlowii | P. obovata | P. veitchii | P. ostii |
|---|---|---|---|---|---|
| LSC (large single-copy) | |||||
| Length (bp) | 86,057 | 84,426 | 84,387 | 84,398 | 85,373 |
| G+C (%) | 36.7 | 36.7 | 36.7 | 36.7 | 36.7 |
| Length (%) | 56.4 | 55.3 | 55.3 | 55.3 | 56.1 |
| SSC (small single-copy) | |||||
| Length (bp) | 17,050 | 16,983 | 17,028 | 16,978 | 17,054 |
| G+C (%) | 32.7 | 32.7 | 32.7 | 32.7 | 32.7 |
| Length (%) | 11.2 | 11.1 | 11.2 | 11.1 | 11.2 |
| IR (inverse repeats) | |||||
| Length (bp) | 25,649 | 25,639 | 26,642 | 25,653 | 24,863 |
| G+C (%) | 43.1 | 43.1 | 43.1 | 43.1 | 43.1 |
| Length (%) | 16.8 | 16.8 | 17.4 | 16.8 | 16.3 |
| Total | |||||
| Length (bp) | 152,698 | 152,687 | 152,698 | 152,682 | 152,153 |
| G+C (%) | 38.4 | 38.4 | 38.4 | 38.4 | 38.4 |
Table 2.
List of genes in the P. ostii chloroplast genome.
| Category | Group of Genes | Name of Genes |
|---|---|---|
| Self-replication | Large subunit of ribosomal proteins | rpl2 *,a, 14, 16 *, 20, 22, 23 a, 33, 36 |
| Small subunit of ribosomal proteins | rps2, 3, 4, 7 a, 8, 11, 12 *,a, 14, 16 *, 18, 19 | |
| DNA-dependent RNA polymerase | rpoA, B, C1 *, C2 | |
| rRNA genes | rrn16S a, rrn23S a, rrn4.5S a, rrn5S a | |
| tRNA genes | trnA-UGC *,a, trnC-GCA, trnD-GUC, trnE-UUC, trnF-GAA, trnfM-CAU, trnG-UCC *, trnG-GCC, trnH-GUG, trnI-CAU, trnI-GAU *,a, trnK-UUU *, trnL-CAA, trnL-UAA *, trnL-UAG, trnM-CAU, trnN-GUU, trnP-UGG, trnQ-UUG, trnR-ACG, trnR-UCU, trnS-GCU, trnS-GGA, trnS-UGA, trnT-GGU, trnT-UGU, trnV-GAC, trnV-UAC *, trnW-CCA, trnY-GUA | |
| Photosynthesis | Photosystem I | psaA, B, C, I, J |
| Photosystem II | psbA, B, C, D, E, F, H, I, J, K, L, M, N, T, Z, | |
| NADH oxidoreductase | ndhA *, B *,a, C, D, E, F, G, H, I, J, K | |
| Cytochrome b6/f complex | petA, B *, D *, G, L, N | |
| ATP synthase | atpA, B, E, F *, H, I | |
| Rubisco | rbcL | |
| Other genes | Maturase | matK |
| Protease | clpP * | |
| Envelope membrane protein | cemA | |
| Subunit acetyl-CoA-carboxylase | accD | |
| c-Type cytochrome synthesis gene | ccsA | |
| Conserved open reading frames | ycf1, 2 a, 3 *, 4, 15 |
* Genes containing introns; a duplicated gene (genes present in the IR regions).
Table 3.
Codon–anticodon recognition patterns and codon usage of the P. ostii chloroplast genome.
| Amino Acid | Codon | No. | RSCU * | tRNA | Amino Acid | Codon | No. | RSCU * | tRNA |
|---|---|---|---|---|---|---|---|---|---|
| Phe | UUU | 1226 | 1.16 | Tyr | UAU | 937 | 1.36 | ||
| Phe | UUC | 885 | 0.84 | trnF-GAA | Tyr | UAC | 440 | 0.64 | trnY-GUA |
| Leu | UUA | 769 | 1.24 | trnL-UAA | Stop | UAA | 683 | 1.1 | |
| Leu | UUG | 831 | 1.34 | trnL-CAA | Stop | UAG | 604 | 0.97 | |
| Leu | CUU | 690 | 1.11 | His | CAU | 486 | 1.34 | ||
| Leu | CUC | 483 | 0.78 | His | CAC | 240 | 0.66 | trnH-GUG | |
| Leu | CUA | 563 | 0.91 | trnL-UAG | Gln | CAA | 703 | 1.27 | trnQ-UUG |
| Leu | CUG | 392 | 0.63 | Gln | CAG | 401 | 0.73 | ||
| Ile | AUU | 1055 | 1.19 | Asn | AAU | 1033 | 1.33 | ||
| Ile | AUC | 746 | 0.84 | trnI-GAU | Asn | AAC | 520 | 0.67 | trnN-GUU |
| Ile | AUA | 855 | 0.97 | trnI-UAU | Lys | AAA | 1334 | 1.24 | trnK-UUU |
| Met | AUG | 743 | 1 | trn(f)M-CAU | Lys | AAG | 817 | 0.76 | |
| Val | GUU | 564 | 1.27 | Asp | GAU | 705 | 1.46 | ||
| Val | GUC | 293 | 0.66 | trnV-GAC | Asp | GAC | 264 | 0.54 | trnD-GUC |
| Val | GUA | 548 | 1.24 | trnV-UAC | Glu | GAA | 923 | 1.27 | trnE-UUC |
| Val | GUG | 366 | 0.83 | Glu | GAG | 526 | 0.73 | ||
| Ser | UCU | 659 | 1.45 | Cys | UGU | 393 | 1.19 | ||
| Ser | UCC | 458 | 1.01 | trnS-GGA | Cys | UGC | 270 | 0.81 | trnC-GCA |
| Ser | UCA | 599 | 1.32 | trnS-UGA | Stop | UGA | 580 | 0.93 | |
| Ser | UCG | 388 | 0.85 | Trp | UGG | 626 | 1 | trnW-CCA | |
| Pro | CCU | 368 | 1.02 | Arg | CGU | 217 | 0.58 | trnR-ACG | |
| Pro | CCC | 309 | 0.86 | trnP-GGG | Arg | CGC | 182 | 0.49 | |
| Pro | CCA | 427 | 1.18 | trnP-UGG | Arg | CGA | 400 | 1.07 | |
| Pro | CCG | 341 | 0.94 | Arg | CGG | 372 | 1 | ||
| Thr | ACU | 382 | 1.15 | Arg | AGA | 330 | 0.73 | trnR-UCU | |
| Thr | ACC | 290 | 0.87 | trnT-GGU | Arg | AGG | 291 | 0.64 | |
| Thr | ACA | 407 | 1.23 | trnT-UGU | Ser | AGU | 632 | 1.69 | |
| Thr | ACG | 248 | 0.75 | Ser | AGC | 439 | 1.17 | trnS-GCU | |
| Ala | GCU | 294 | 1.19 | Gly | GGU | 394 | 0.9 | ||
| Ala | GCC | 227 | 0.92 | Gly | GGC | 261 | 0.6 | trnG-GCC | |
| Ala | GCA | 253 | 1.02 | trnA-UGC | Gly | GGA | 579 | 1.33 | trnG-UCC |
| Ala | GCG | 217 | 0.88 | Gly | GGG | 509 | 1.17 |
RSCU *: relative synonymous codon usage.
Table 4.
Length of exons and introns in genes with introns in the P. ostii chloroplast genome.
| Gene | Location | Exon I (bp) | Intron I (bp) | Exon II (bp) | Intron II (bp) | Exon III (bp) |
|---|---|---|---|---|---|---|
| trnK-UUU | LSC | 35 | 2452 | 38 | ||
| trnG-UCC | LSC | 23 | 709 | 49 | ||
| trnL-UAA | LSC | 37 | 522 | 51 | ||
| trnV-UAC | LSC | 38 | 576 | 39 | ||
| trnI-GAU | IR | 42 | 935 | 36 | ||
| trnA-UGC | IR | 37 | 42 | 29 | ||
| rps12 * | LSC | 26 | 543 | 227 | 114 | |
| rps16 | LSC | 234 | 820 | 40 | ||
| rpl16 | LSC | 402 | 1008 | 10 | ||
| rpl2 | IR | 435 | 670 | 394 | ||
| rpoC1 | LSC | 1617 | 709 | 436 | ||
| ndhA | SSC | 540 | 1013 | 544 | ||
| ndhB | IR | 756 | 684 | 778 | ||
| ycf3 | SSC | 153 | 765 | 229 | 721 | 126 |
| petB | LSC | 6 | 754 | 658 | ||
| atpF | LSC | 408 | 701 | 160 | ||
| clpP | LSC | 228 | 659 | 292 | 673 | 67 |
| petD | LSC | 9 | 645 | 526 |
* The rps12 gene is a trans-spliced gene with the 5’ end located in the LSC region and the duplicated 3’ ends in the IR regions.
© 2018 by the authors. Licensee MDPI, Basel, Switzerland. This article is an open access article distributed under the terms and conditions of the Creative Commons Attribution (CC BY) license (http://creativecommons.org/licenses/by/4.0/).
Share and Cite
MDPI and ACS Style
Guo, S.; Guo, L.; Zhao, W.; Xu, J.; Li, Y.; Zhang, X.; Shen, X.; Wu, M.; Hou, X. Complete Chloroplast Genome Sequence and Phylogenetic Analysis of Paeonia ostii. Molecules 2018, 23, 246. https://doi.org/10.3390/molecules23020246
AMA Style
Guo S, Guo L, Zhao W, Xu J, Li Y, Zhang X, Shen X, Wu M, Hou X. Complete Chloroplast Genome Sequence and Phylogenetic Analysis of Paeonia ostii. Molecules. 2018; 23(2):246. https://doi.org/10.3390/molecules23020246
Chicago/Turabian StyleGuo, Shuai, Lili Guo, Wei Zhao, Jiang Xu, Yuying Li, Xiaoyan Zhang, Xiaofeng Shen, Mingli Wu, and Xiaogai Hou. 2018. "Complete Chloroplast Genome Sequence and Phylogenetic Analysis of Paeonia ostii" Molecules 23, no. 2: 246. https://doi.org/10.3390/molecules23020246