Author Contributions
Conceptualization, S.X. and X.Q.; Methodology, S.X.; Software, Y.L. (Yuqiang Liu); Validation, X.L. and J.S.; Formal Analysis, Y.L. (Yuhan Liu); Investigation, Q.C.; Resources, Q.C.; Data Curation, Y.L. (Yuqiang Liu); Writing-Original Draft Preparation, S.X. and Y.L. (Yuhan Liu); Writing-Review & Editing, Y.L. (Yuhan Liu); Visualization, S.X.; Supervision, S.X.; Project Administration, Q.C.; Funding Acquisition, Q.C.
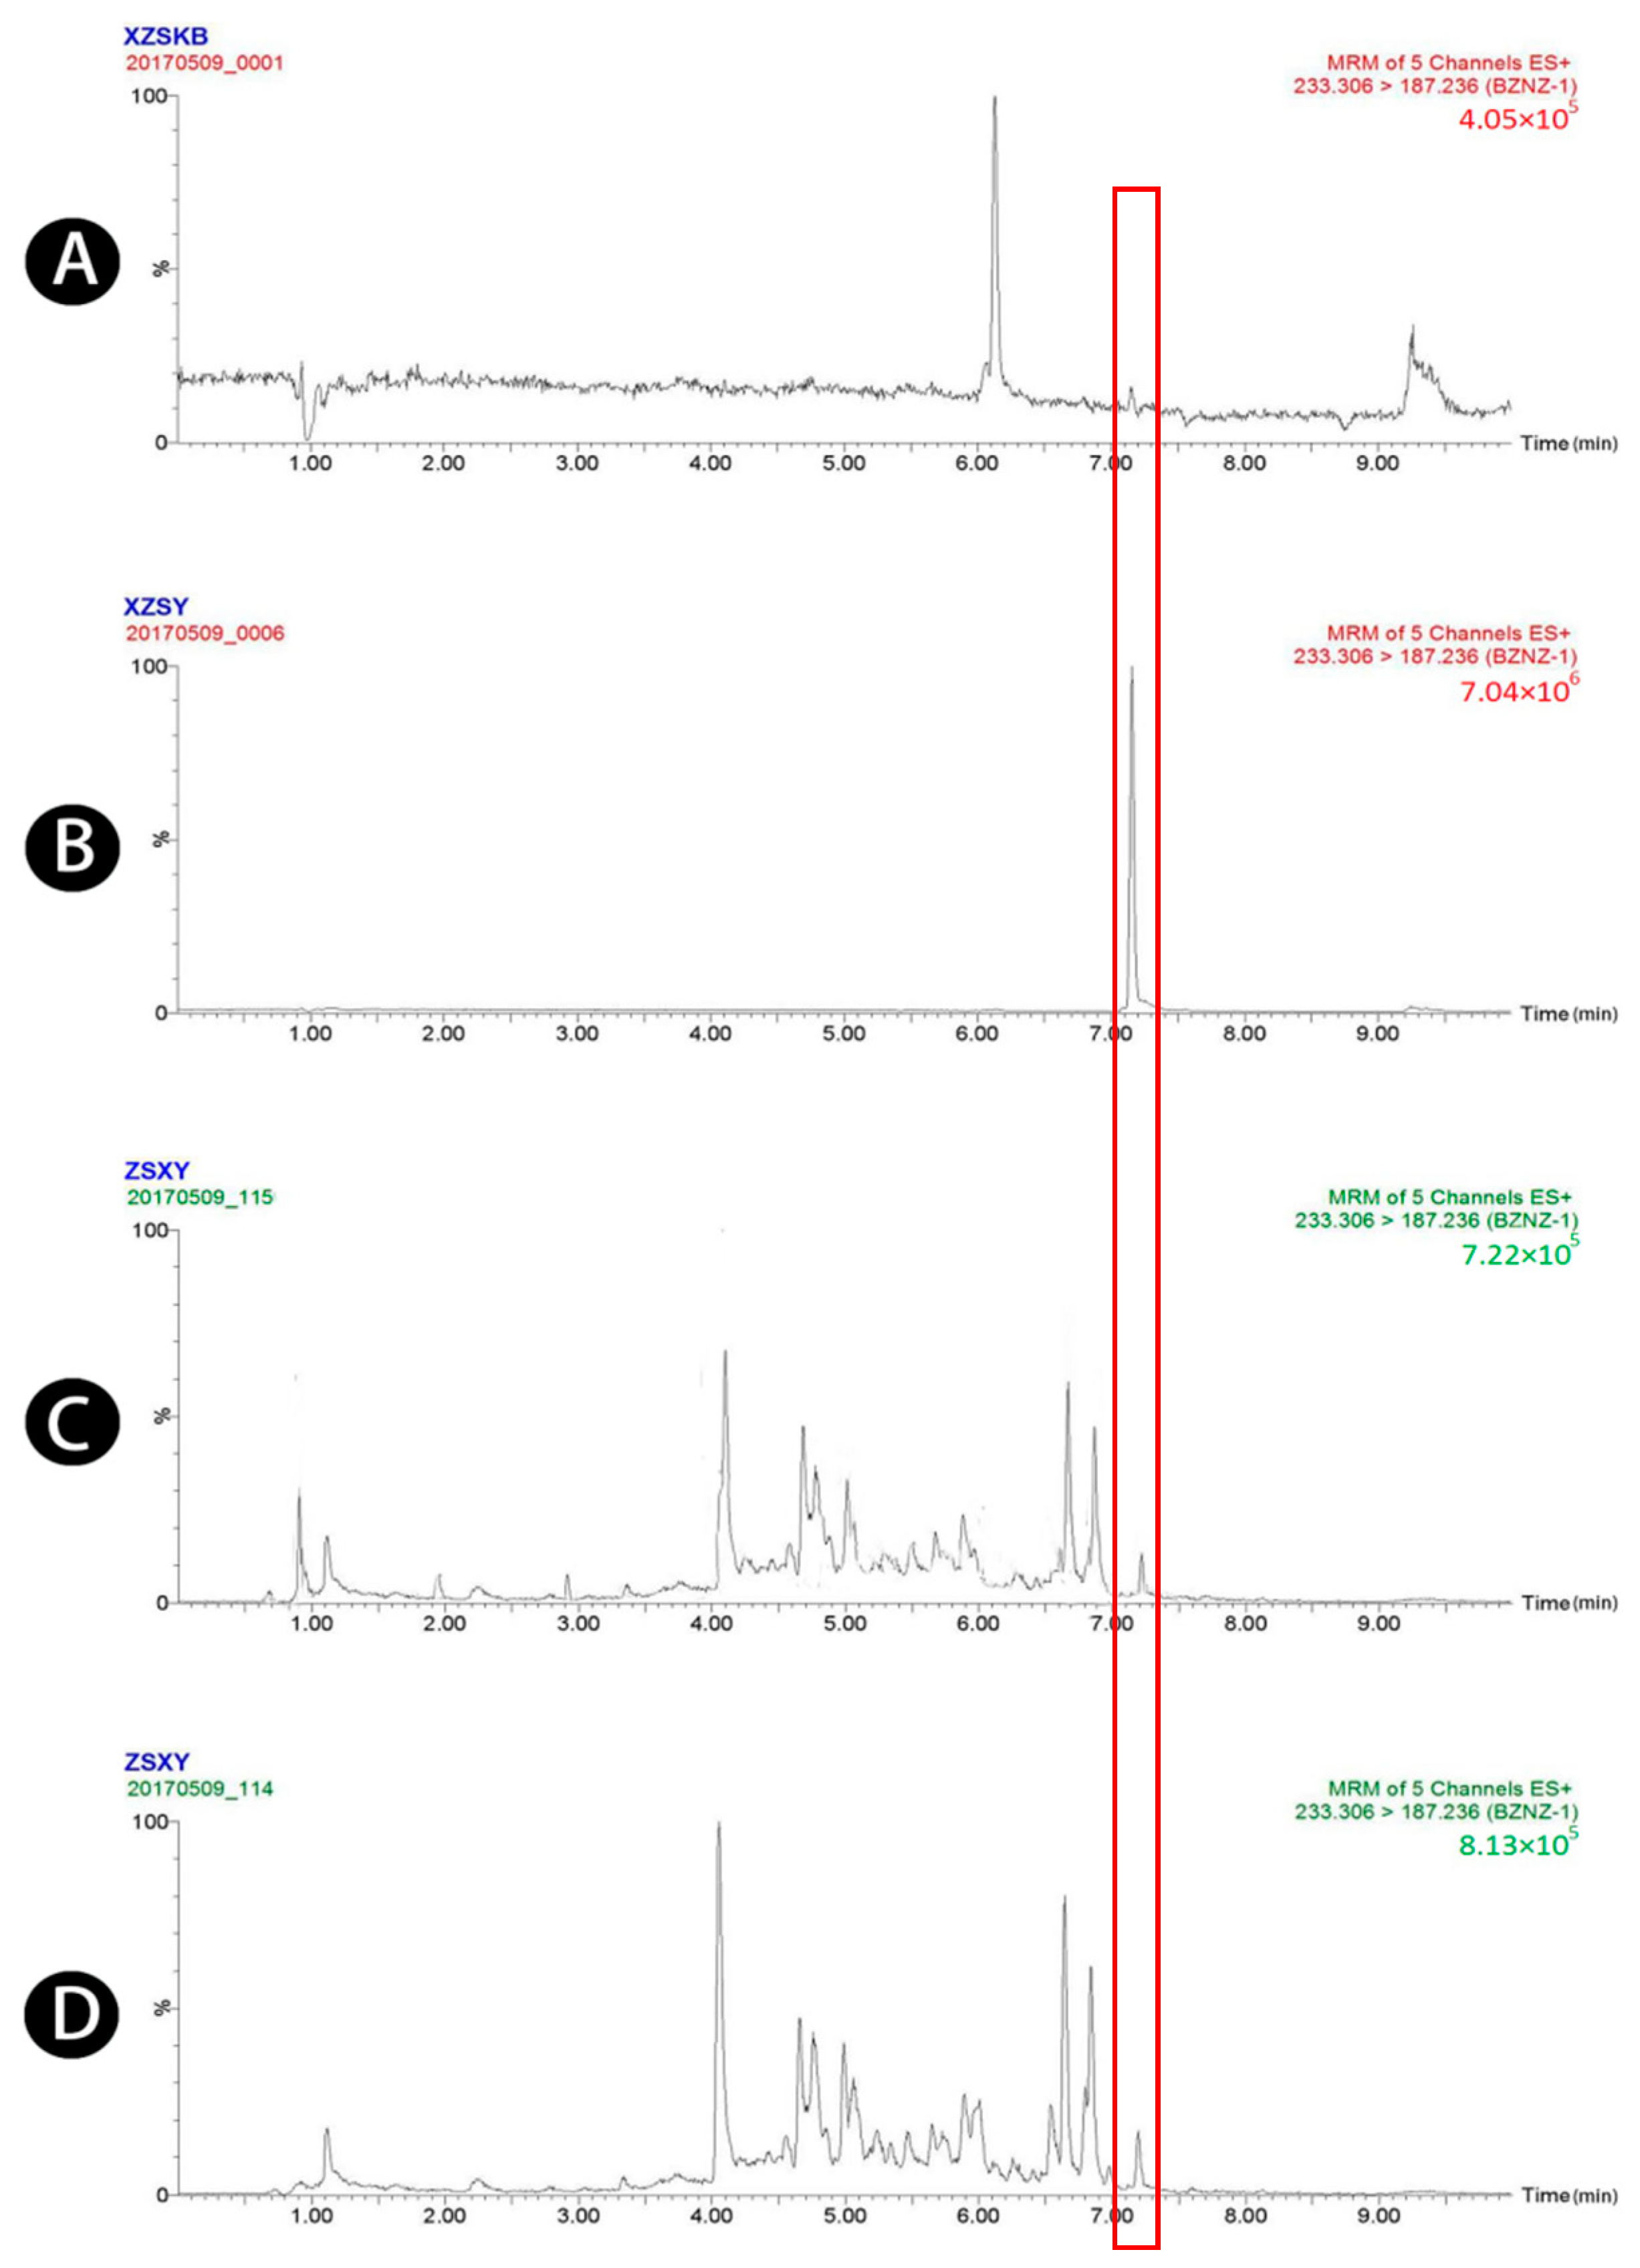
Figure 1.
UPLC-MS/MS chromatograms of atractylenolide I (peak 1). (A) Blank plasma, (B) blank plasma spiked with atractylenolide I at the LOQ of 3.2 ng/mL, (spiked with IS), (C) plasma sample 1.5 h after oral administration of raw Atractylodis Rhizoma at a dose of 3.75 g/kg, and (D) plasma sample 1.5 h after oral administration of wheat bran-processed Atractylodis Rhizoma at a dose of 3.75 g/kg.
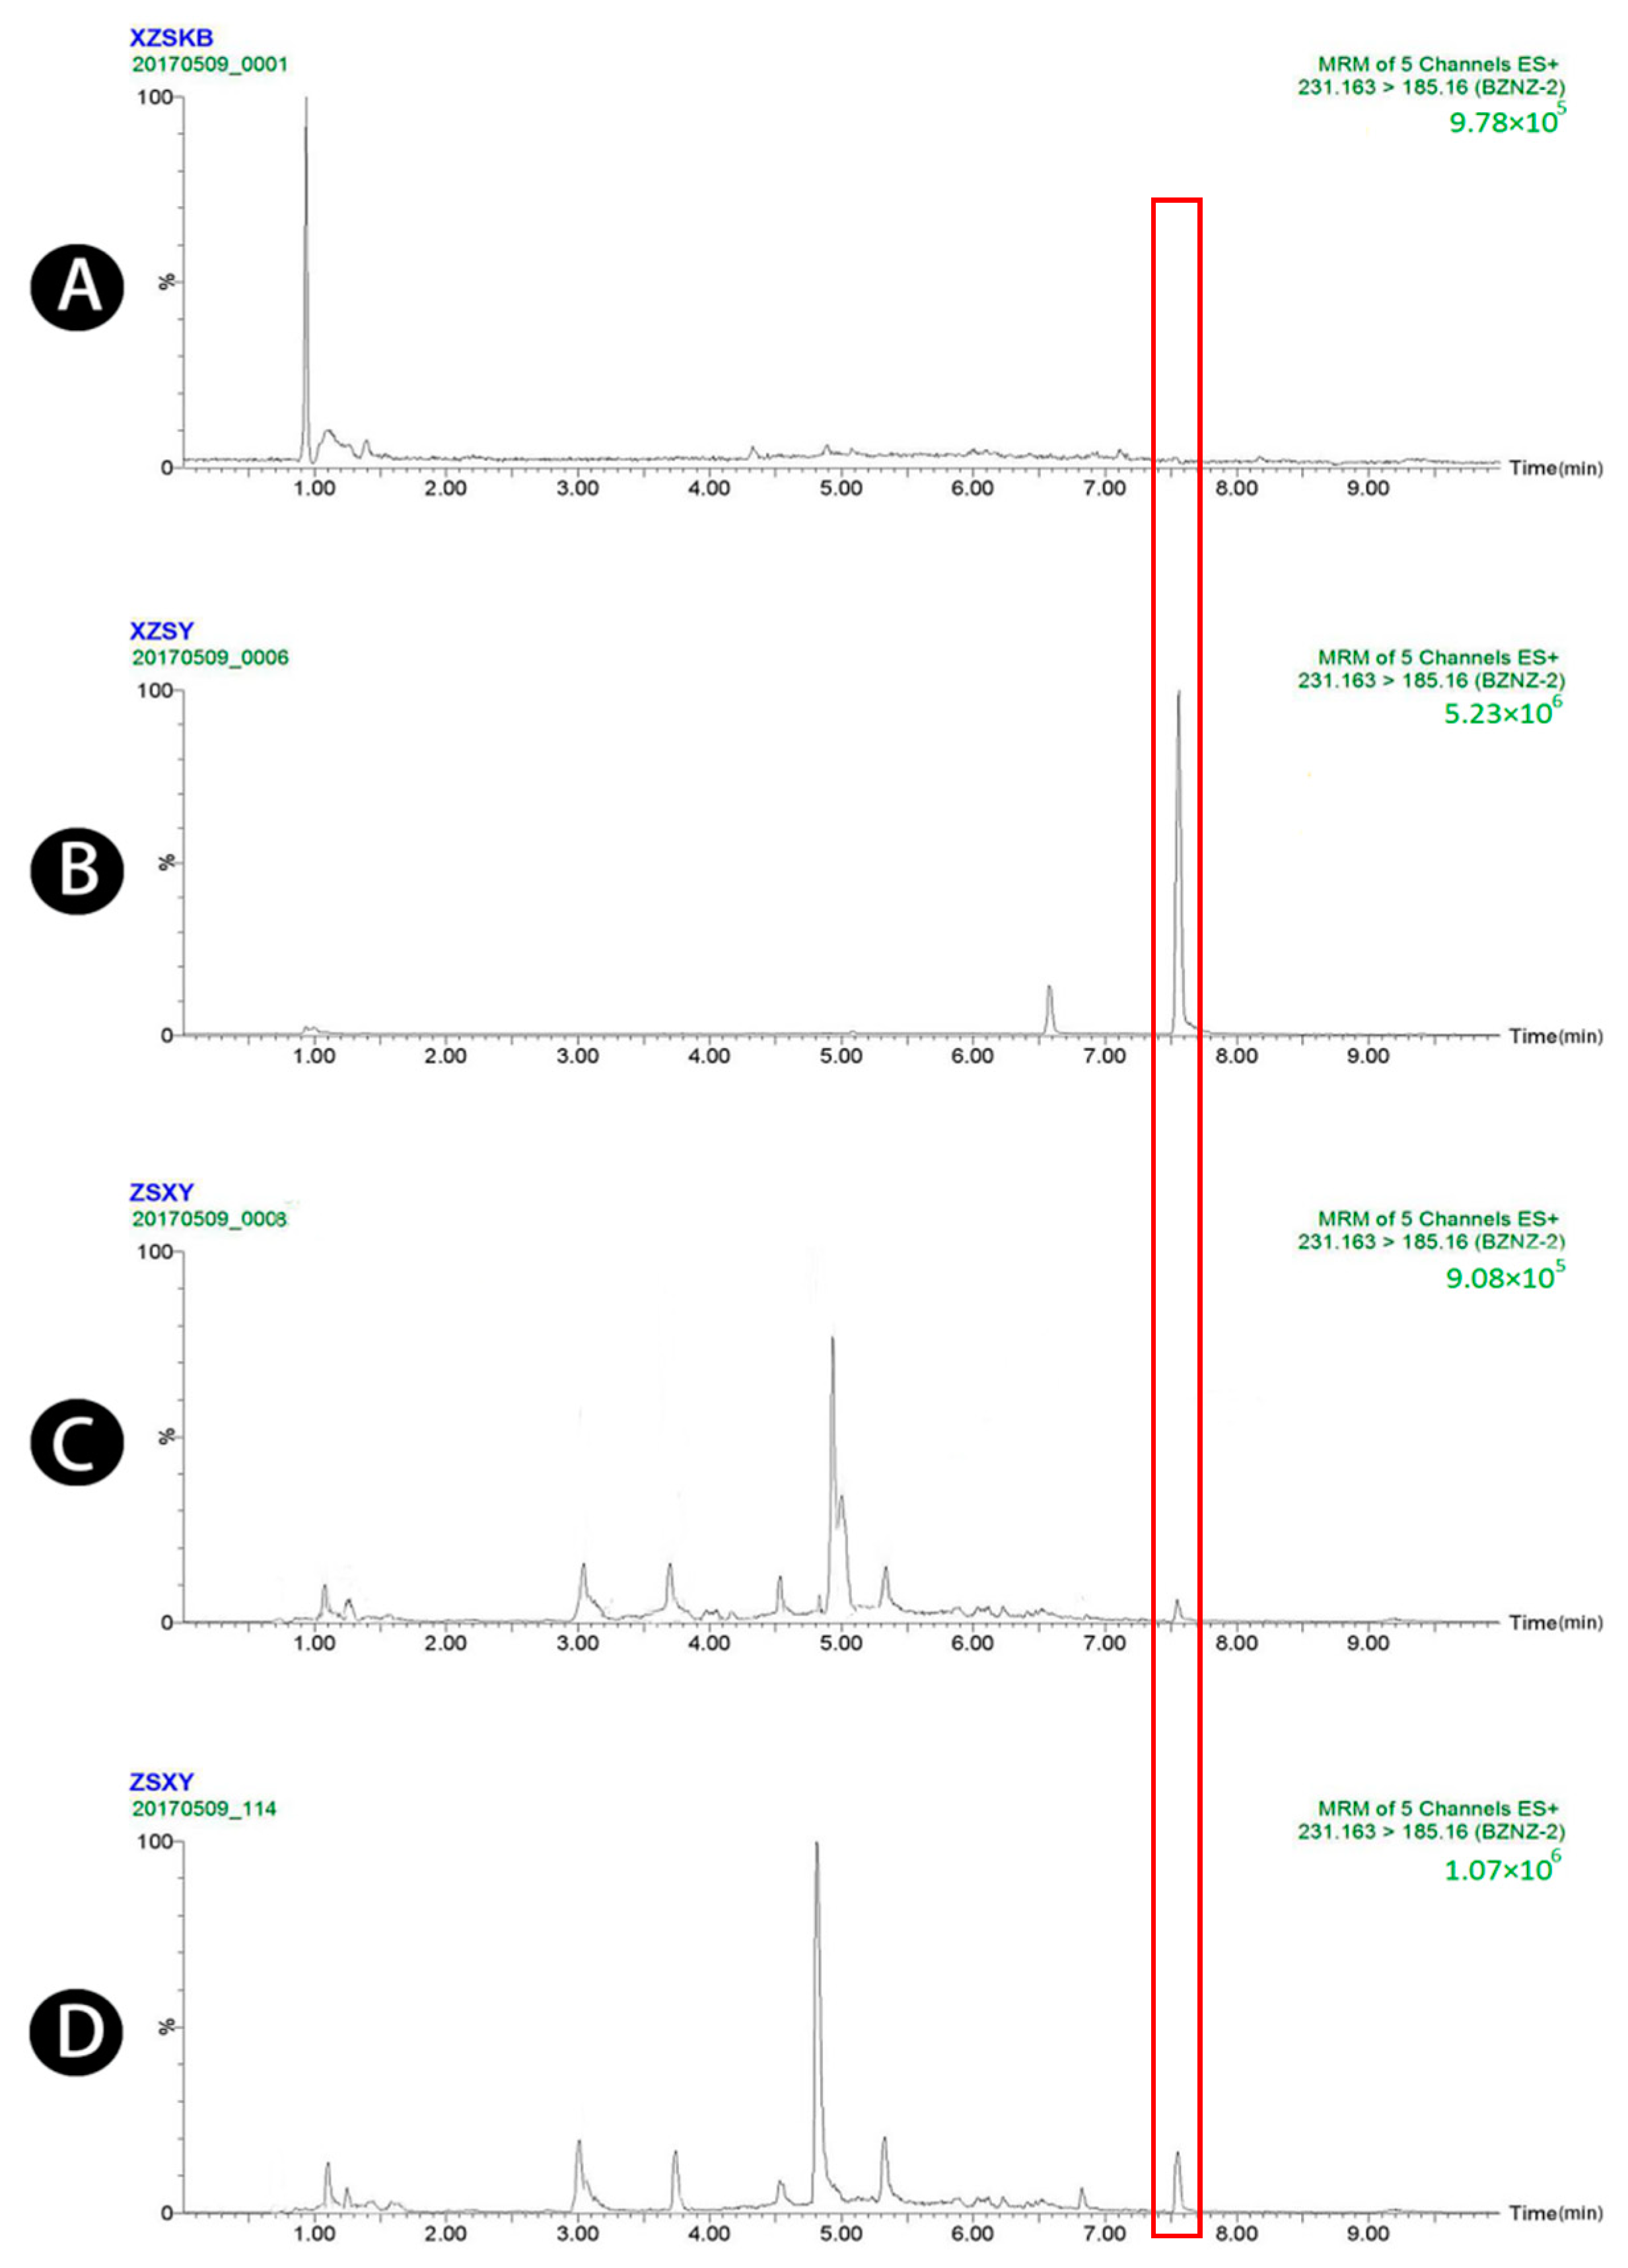
Figure 2.
UPLC-MS/MS chromatograms of atractylenolide II (peak 2). (A) Blank plasma, (B) blank plasma spiked with atractylenolide II at the LOQ of 4 ng/mL (spiked with IS), (C) plasma sample 1.5 h after oral administration of raw Atractylodis Rhizoma at a dose of 3.75 g/kg, and (D) plasma sample 1.5 h after oral administration of wheat bran-processed Atractylodis Rhizoma at a dose of 3.75 g/kg.
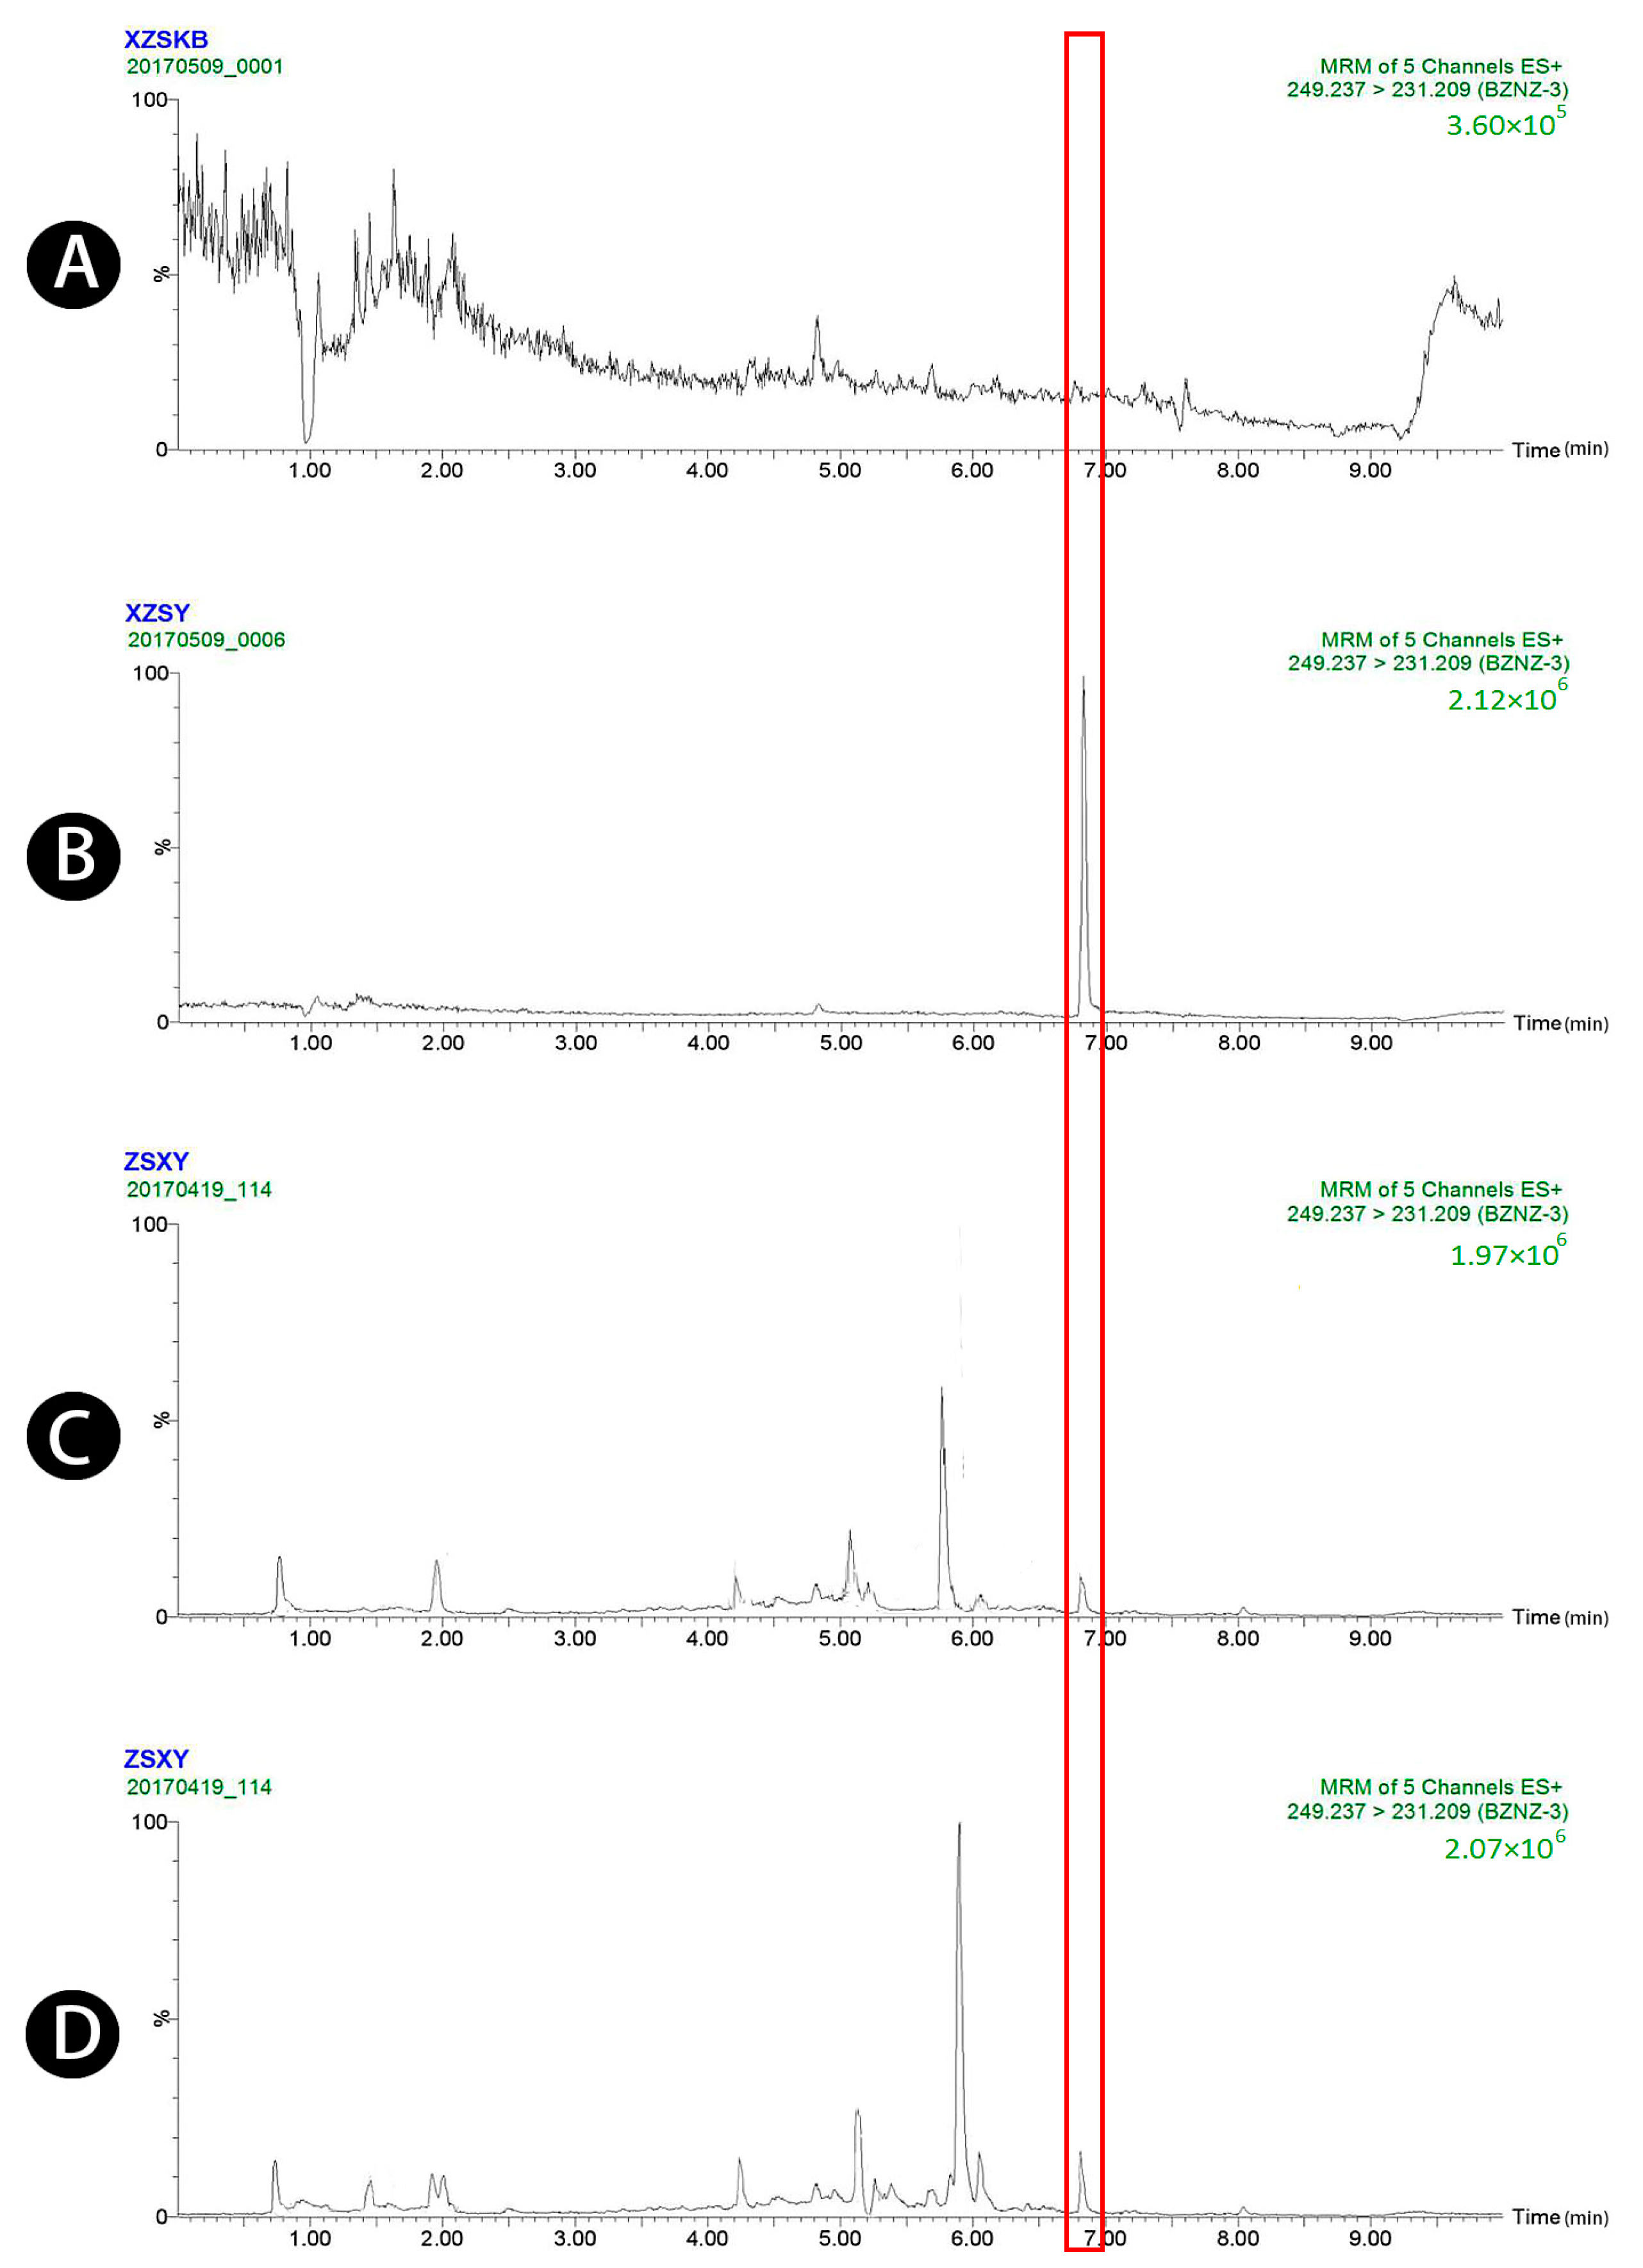
Figure 3.
UPLC-MS/MS chromatograms of atractylenolide III (peak 3). (A) Blank plasma, (B) blank plasma spiked with atractylenolide III at the LOQ of 4 ng/mL (spiked with IS), (C) plasma sample 1.5 h after oral administration of raw Atractylodis Rhizoma at a dose of 3.75 g/kg, and (D) plasma sample 1.5 h after oral administration of wheat bran-processed Atractylodis Rhizoma at a dose of 3.75 g/kg.
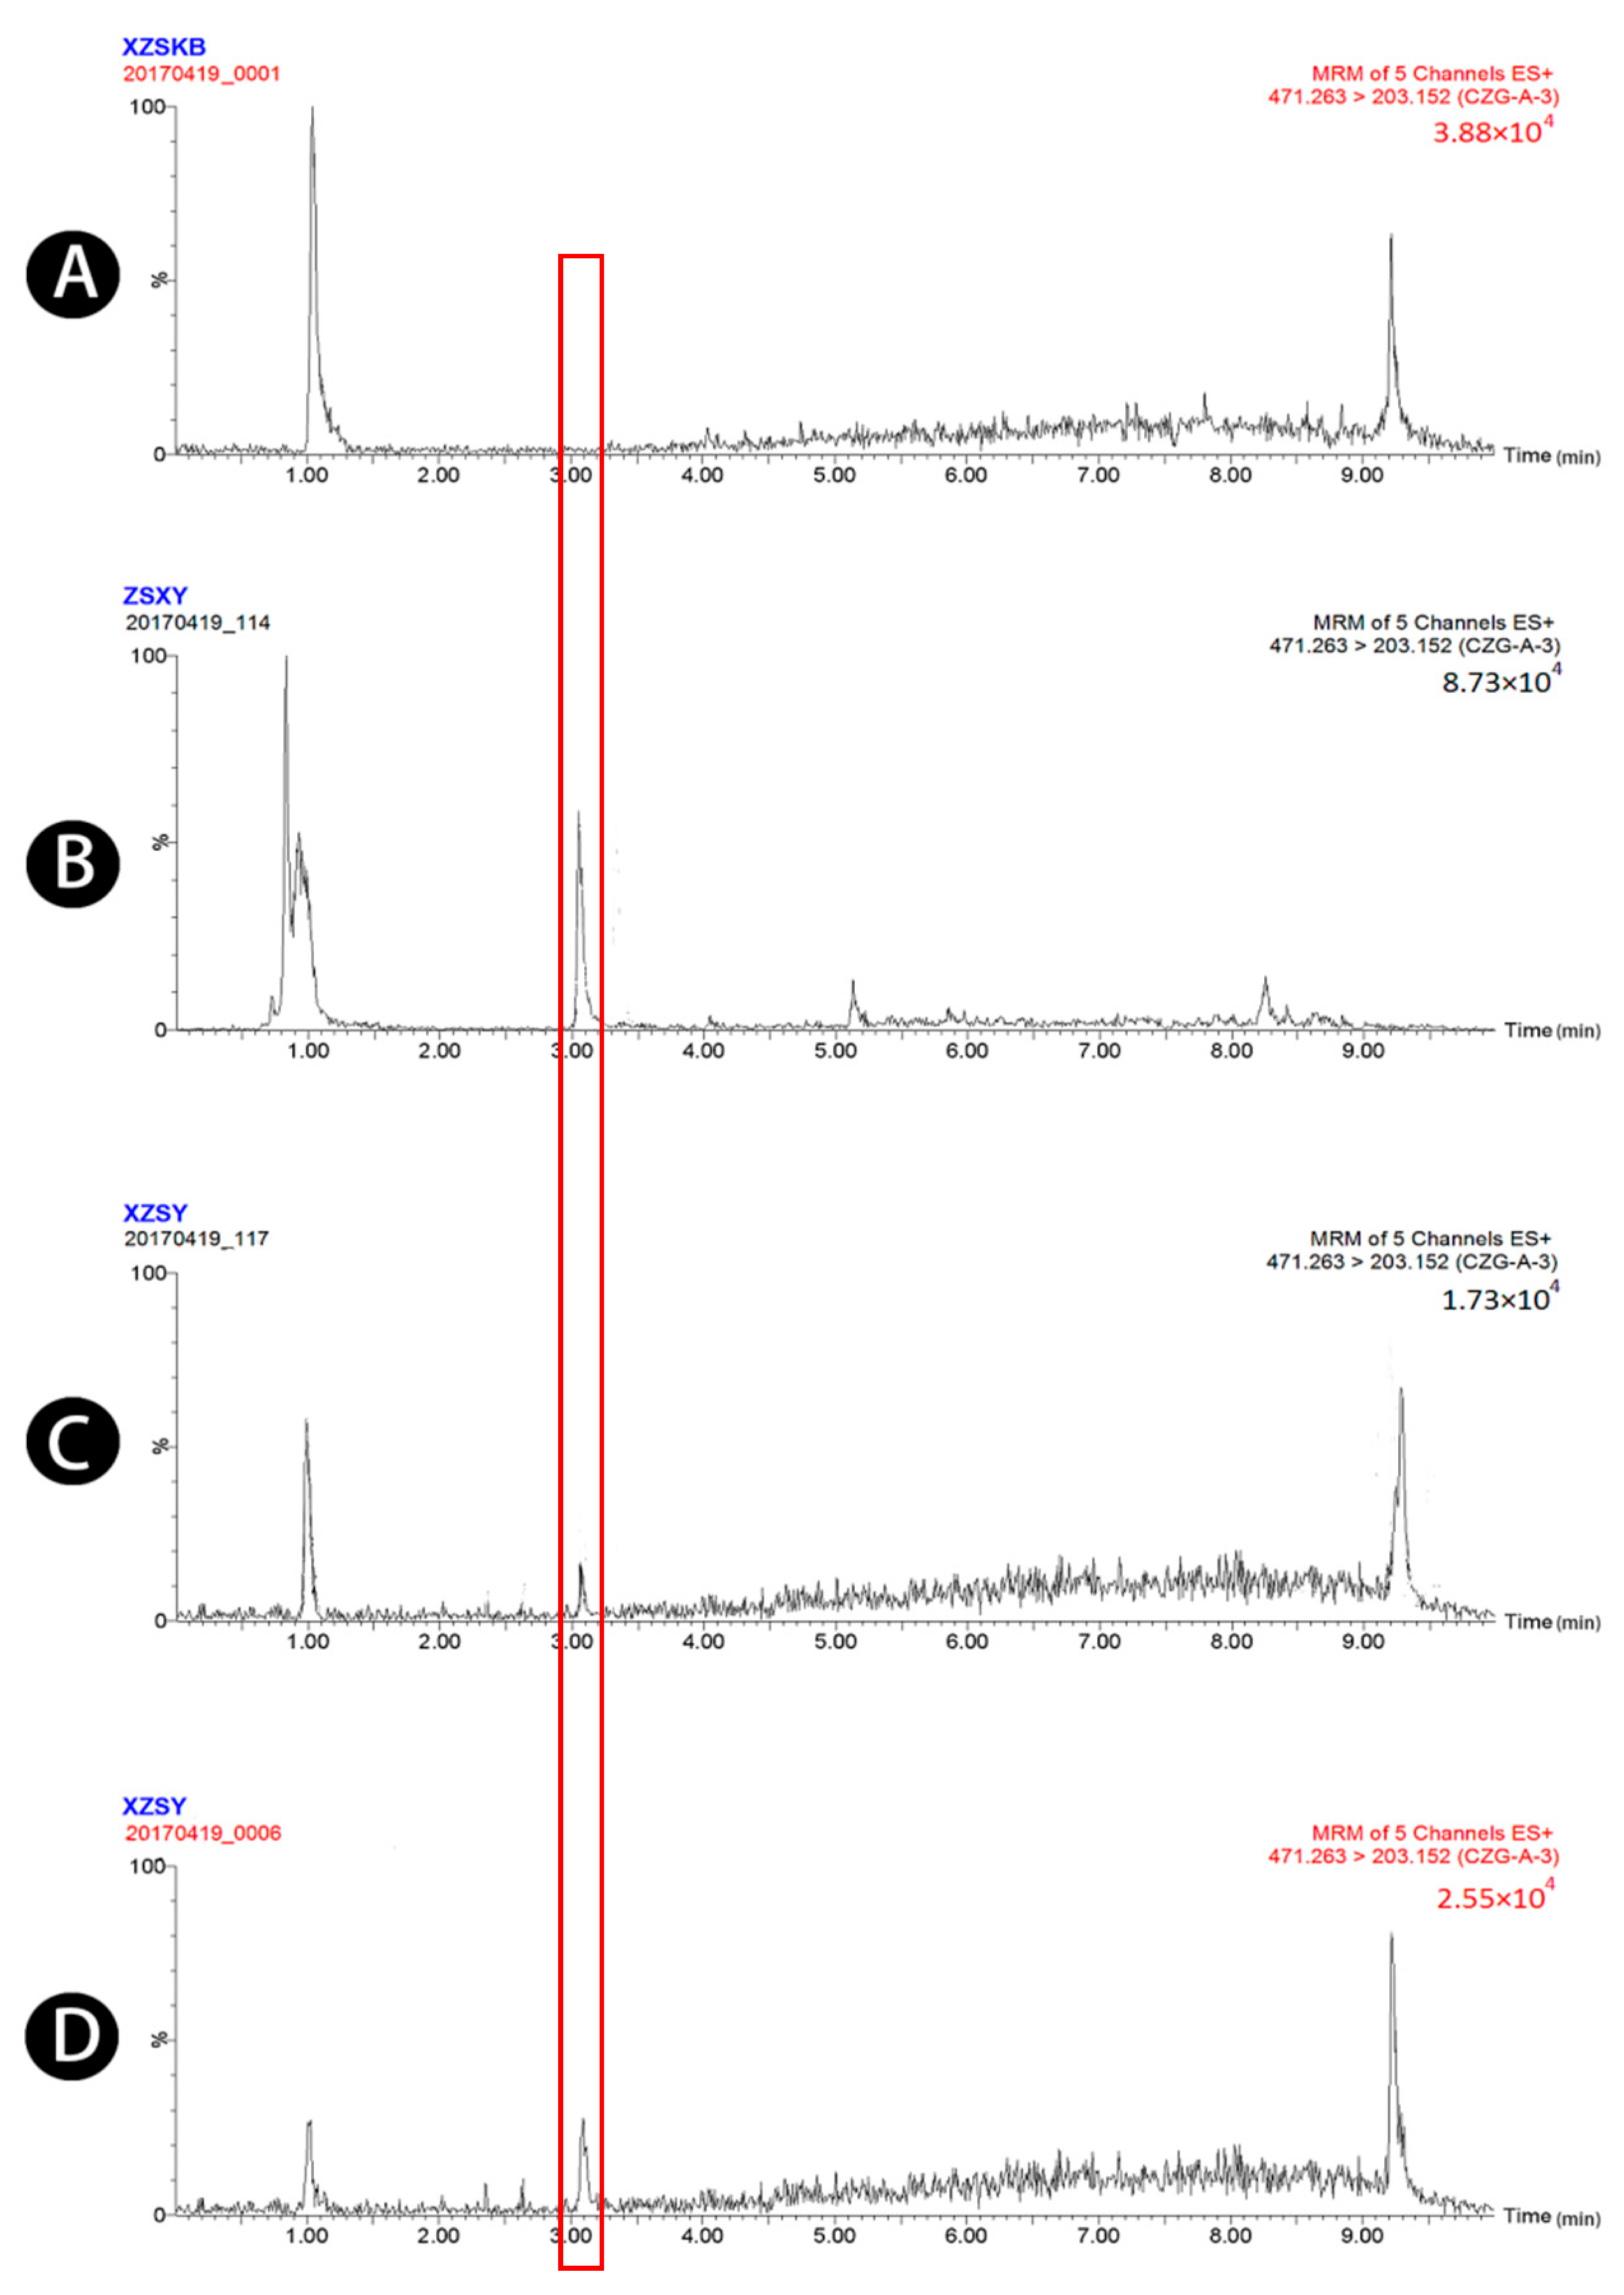
Figure 4.
UPLC-MS/MS chromatograms of atractyloside A (peak 4). (A) Blank plasma, (B) blank plasma spiked with atractyloside A at the LOQ of 3.44 ng/mL (spiked with IS), (C) plasma sample 1.5 h after oral administration of raw Atractylodis Rhizoma at a dose of 3.75 g/kg, and (D) plasma sample 1.5 h after oral administration of wheat bran-processed Atractylodis Rhizoma at a dose of 3.75 g/kg.
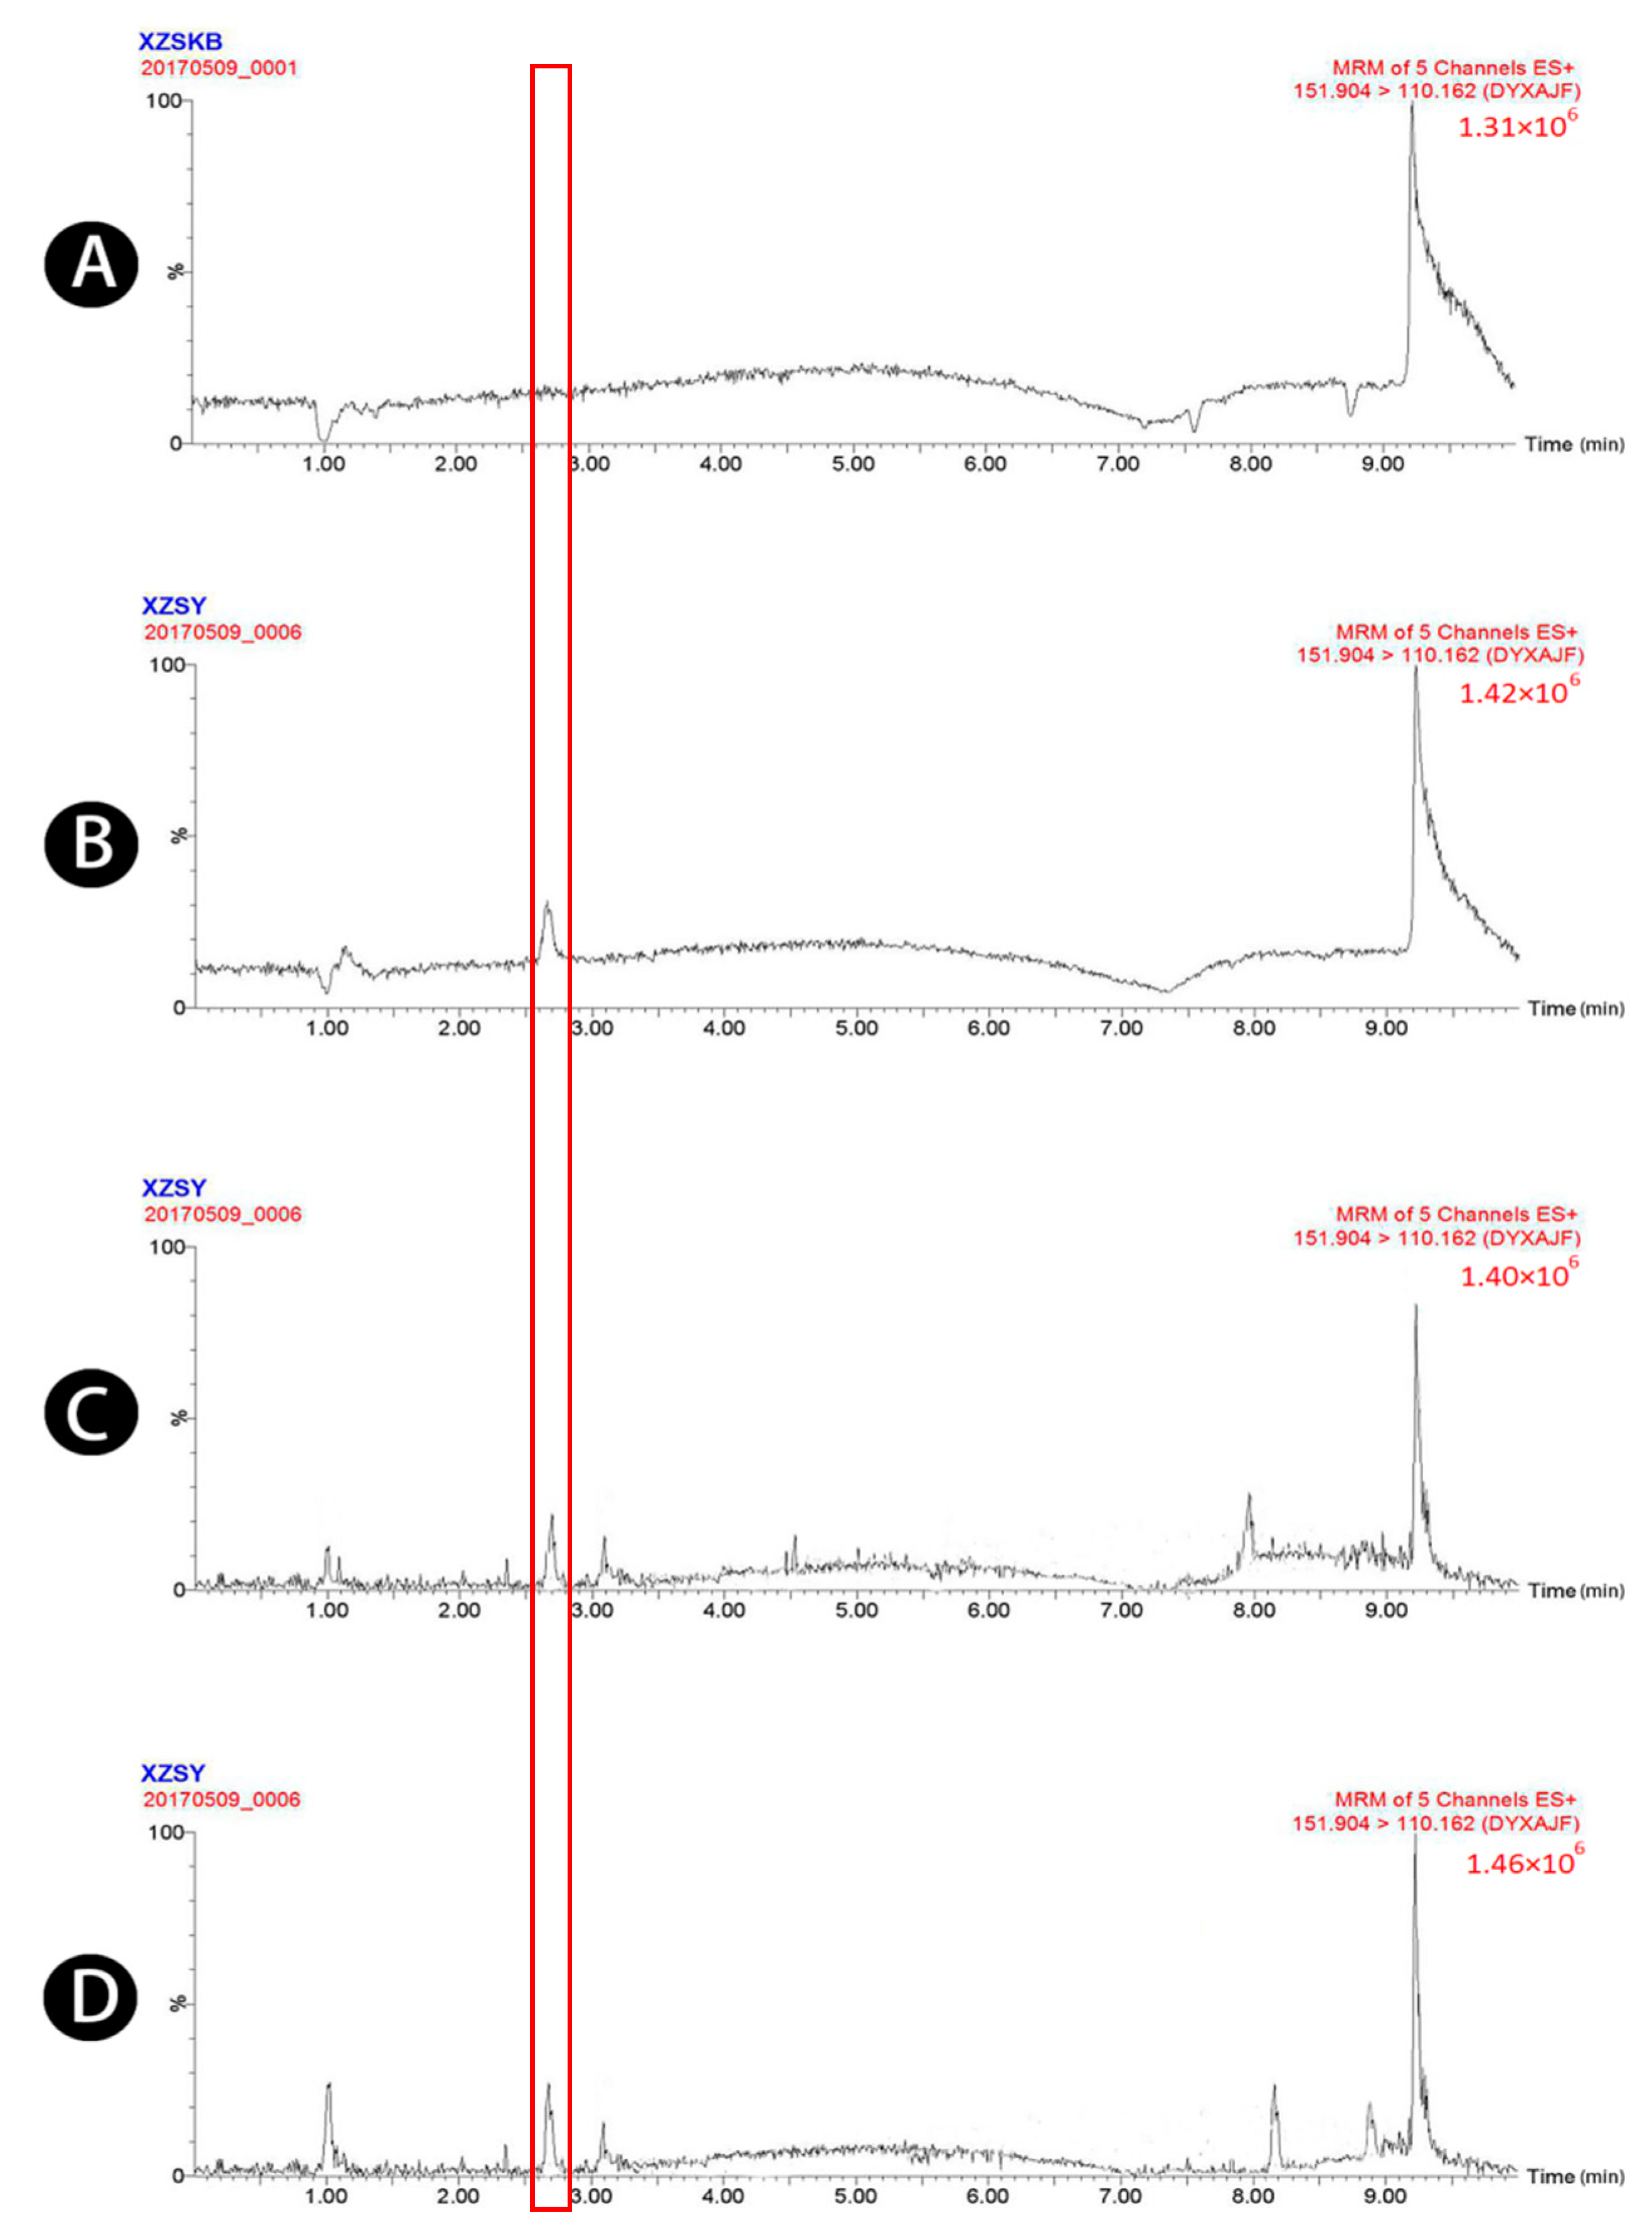
Figure 5.
UPLC-MS/MS chromatograms of 4-acetaminophen (peak 5). (A) Blank plasma, (B) blank plasma spiked with 4-acetaminophen (52 ng/mL), (C) plasma sample 1.5 h after oral administration of raw Atractylodis Rhizoma at a dose of 3.75 g/kg, and (D) plasma sample 1.5 h after oral administration of wheat bran-processed Atractylodis Rhizoma at a dose of 3.75 g/kg.
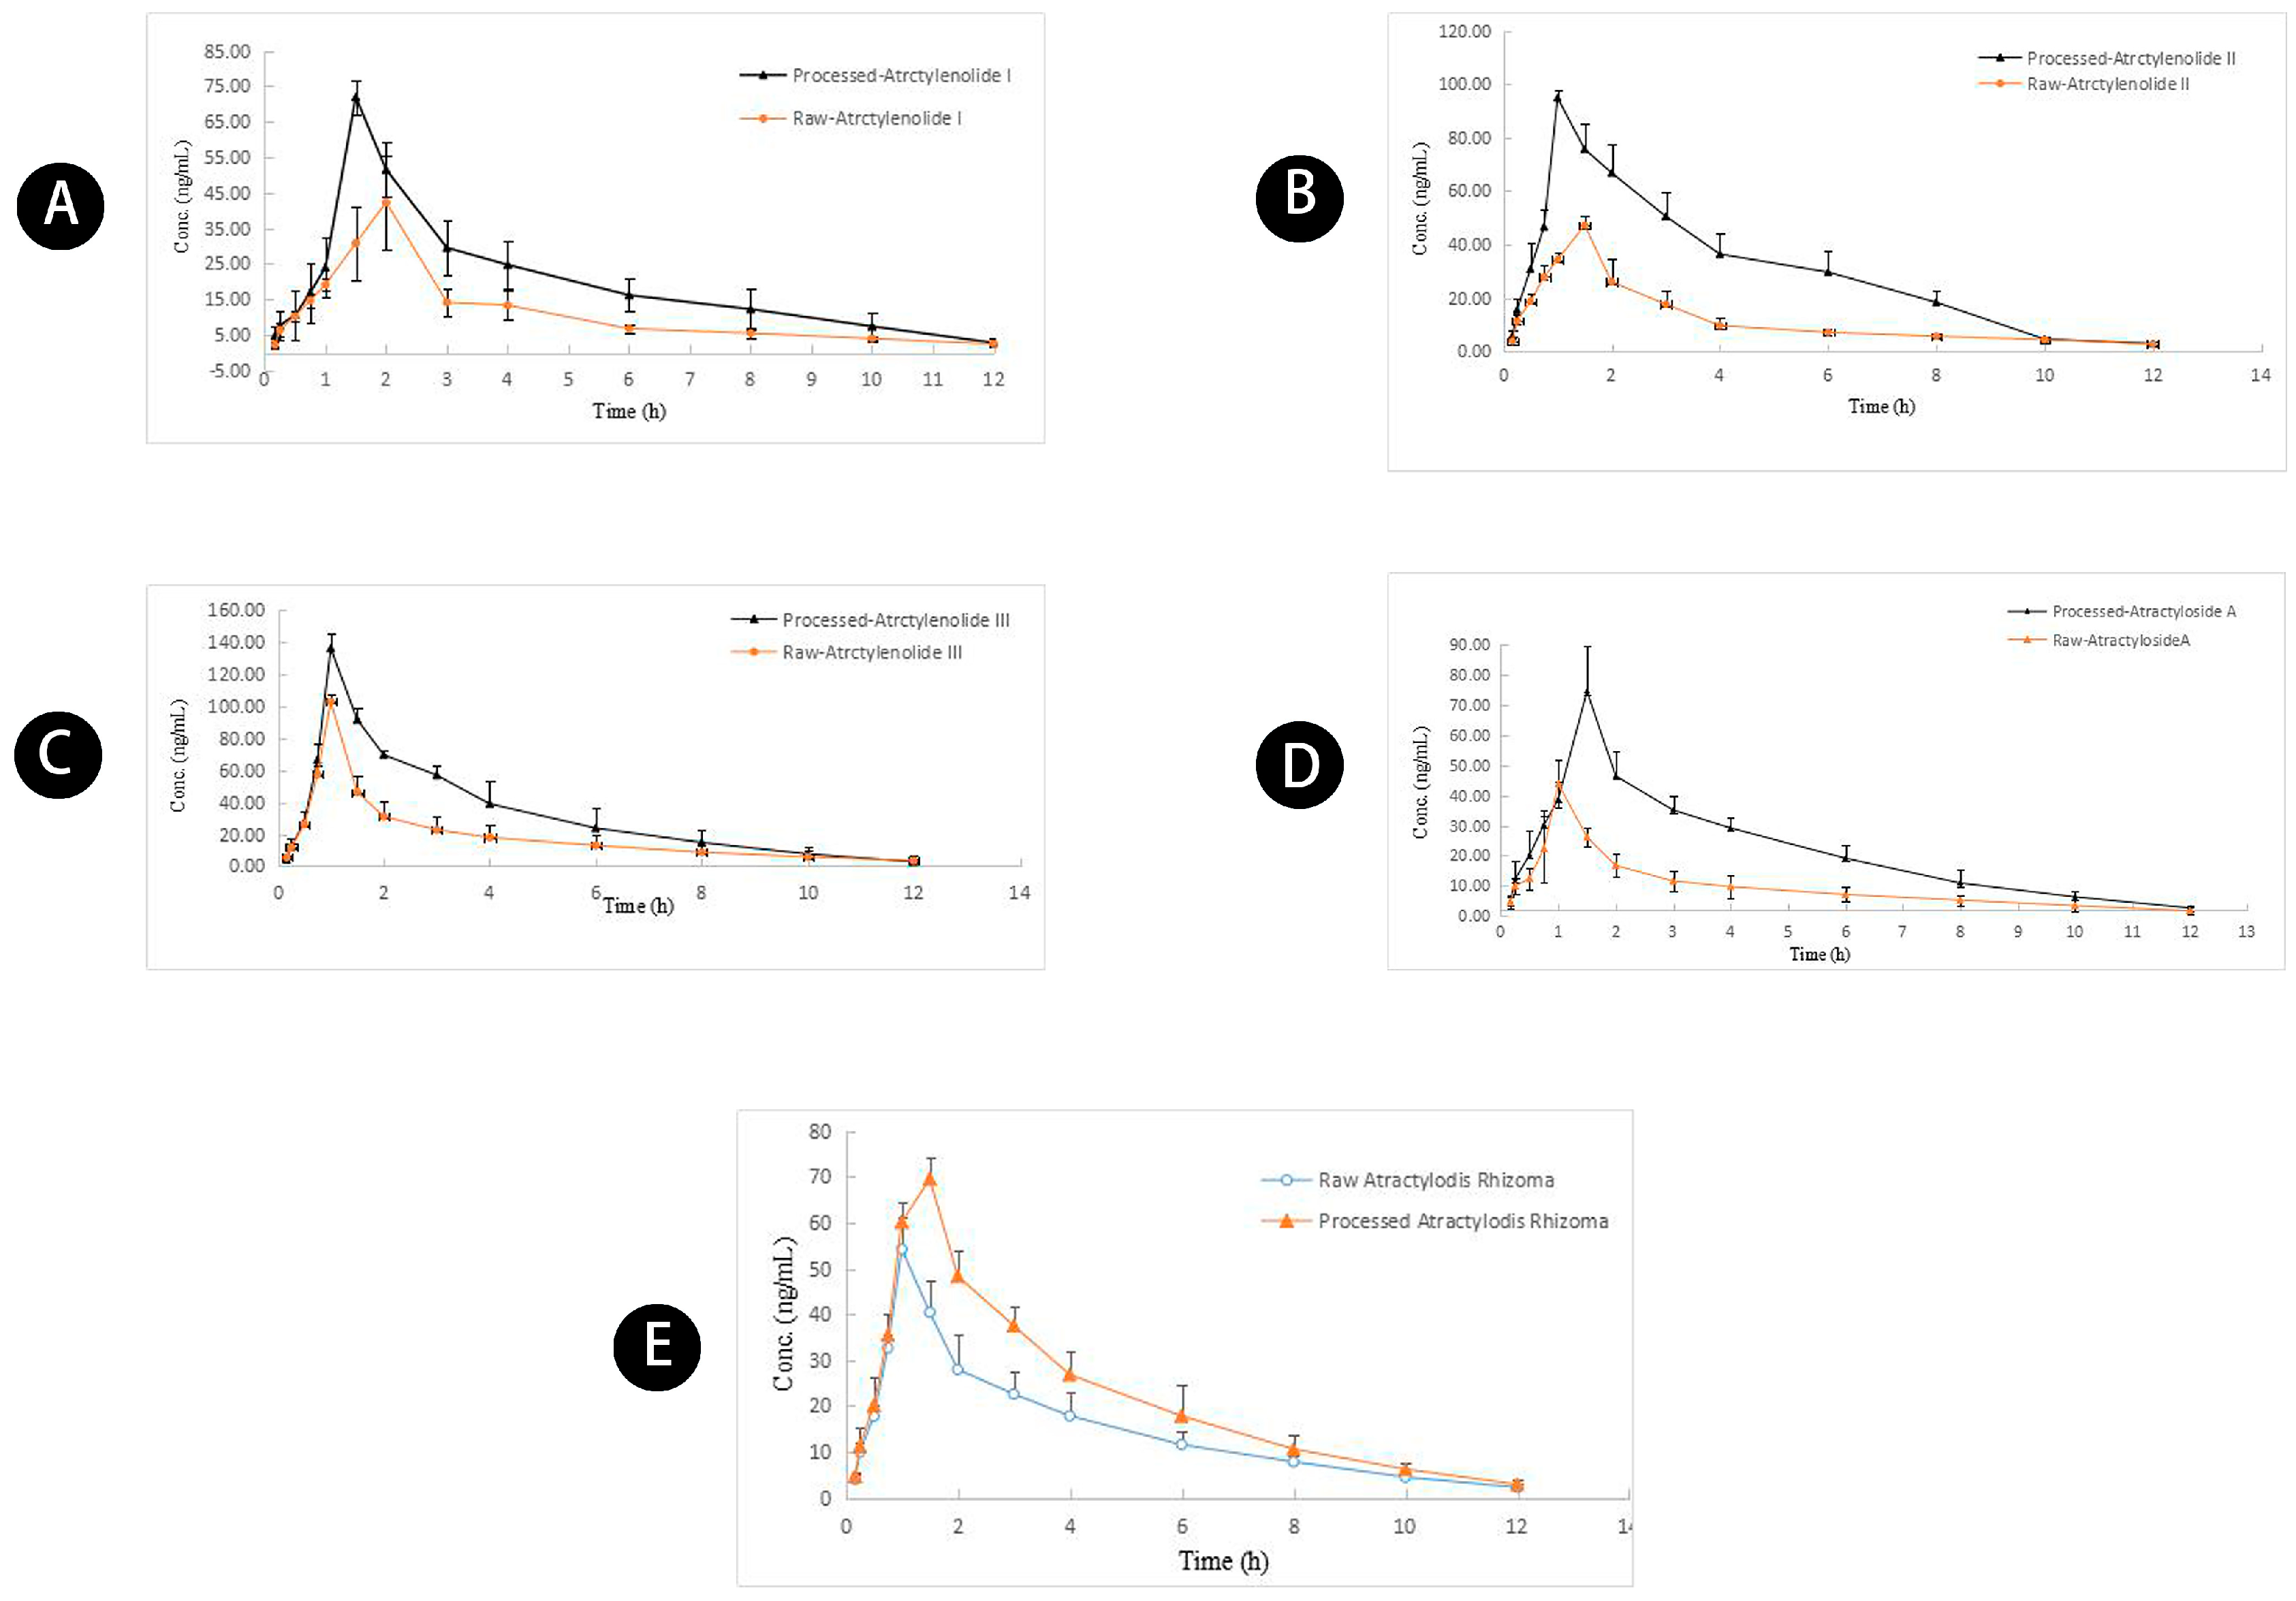
Figure 6.
Mean concentration-time profiles of (A) atractylenolide I, (B) atractylenolide II, (C) atractylenolide III, (D) atractyloside A, (E) AUC-based integrated concentration in rat plasma after oral administration of raw and wheat bran-processed Atractylodis Rhizoma.
Figure 6.
Mean concentration-time profiles of (A) atractylenolide I, (B) atractylenolide II, (C) atractylenolide III, (D) atractyloside A, (E) AUC-based integrated concentration in rat plasma after oral administration of raw and wheat bran-processed Atractylodis Rhizoma.
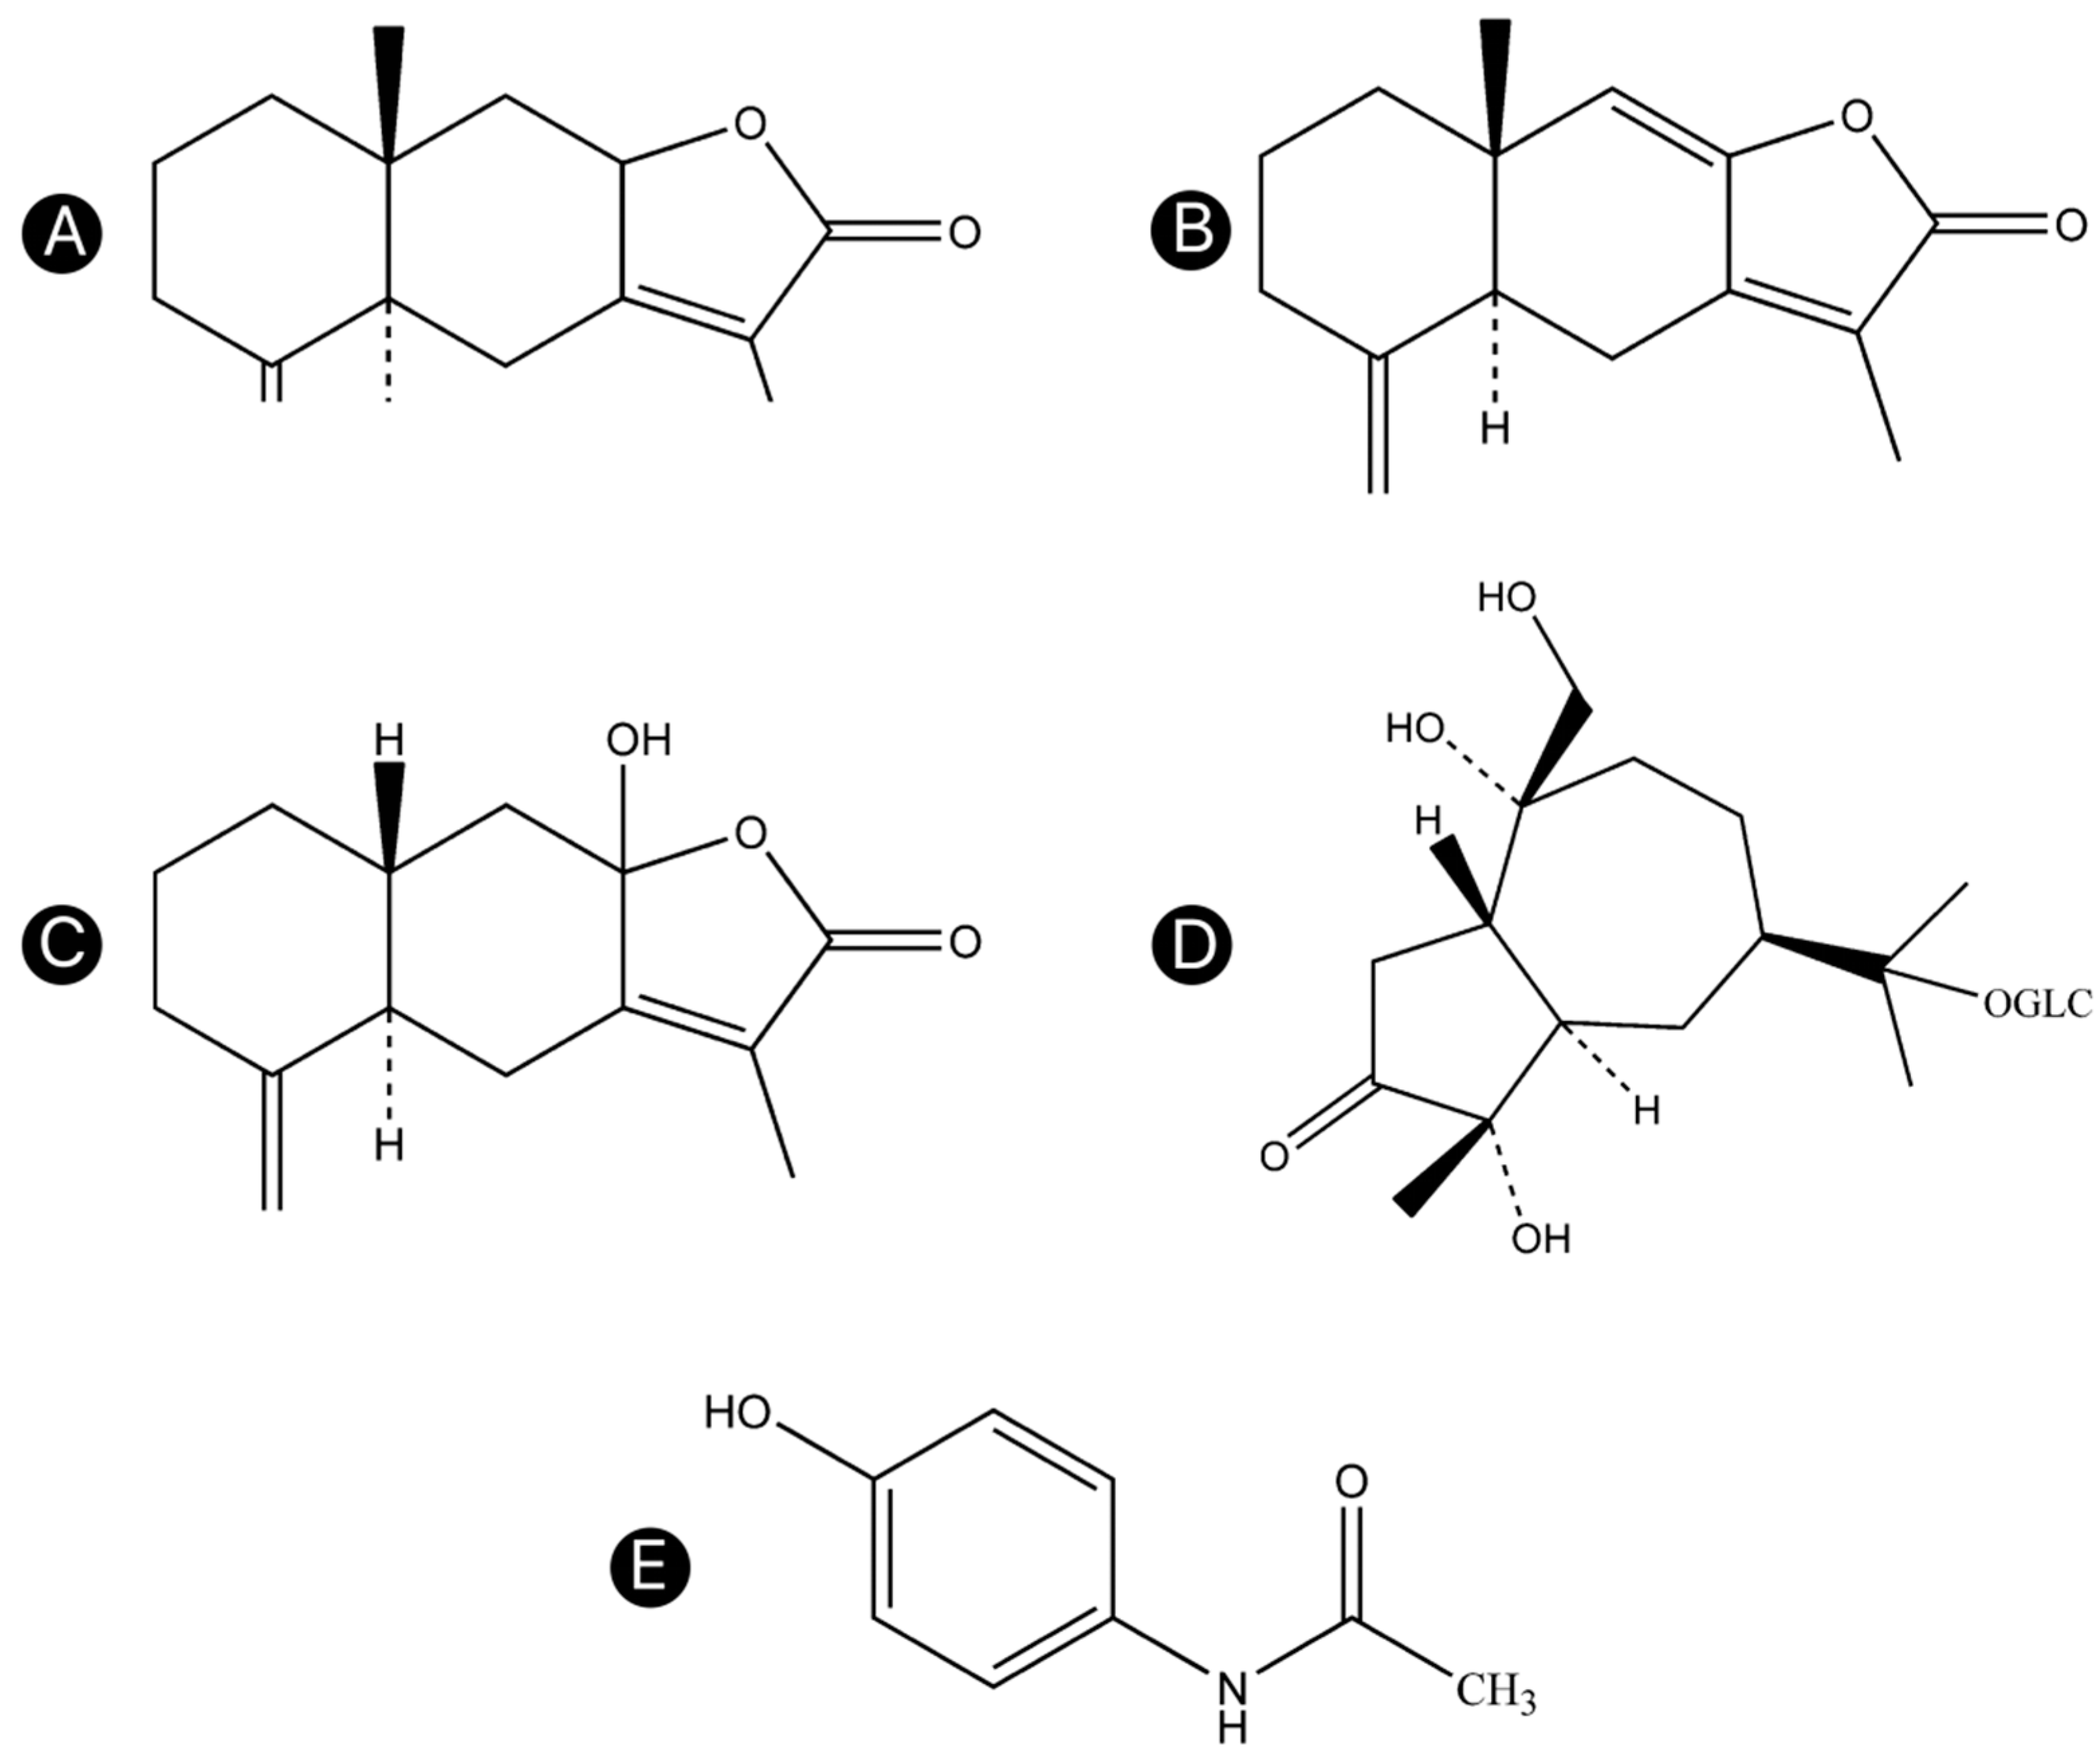
Figure 7.
Chemical structures of the four compounds in Atractylodis Rhizoma and the IS. (A) Atractylenolide I, (B) atractylenolide II, (C) atractylenolide III, (D) atractyloside A, and (E) acetaminophen.
Figure 7.
Chemical structures of the four compounds in Atractylodis Rhizoma and the IS. (A) Atractylenolide I, (B) atractylenolide II, (C) atractylenolide III, (D) atractyloside A, and (E) acetaminophen.
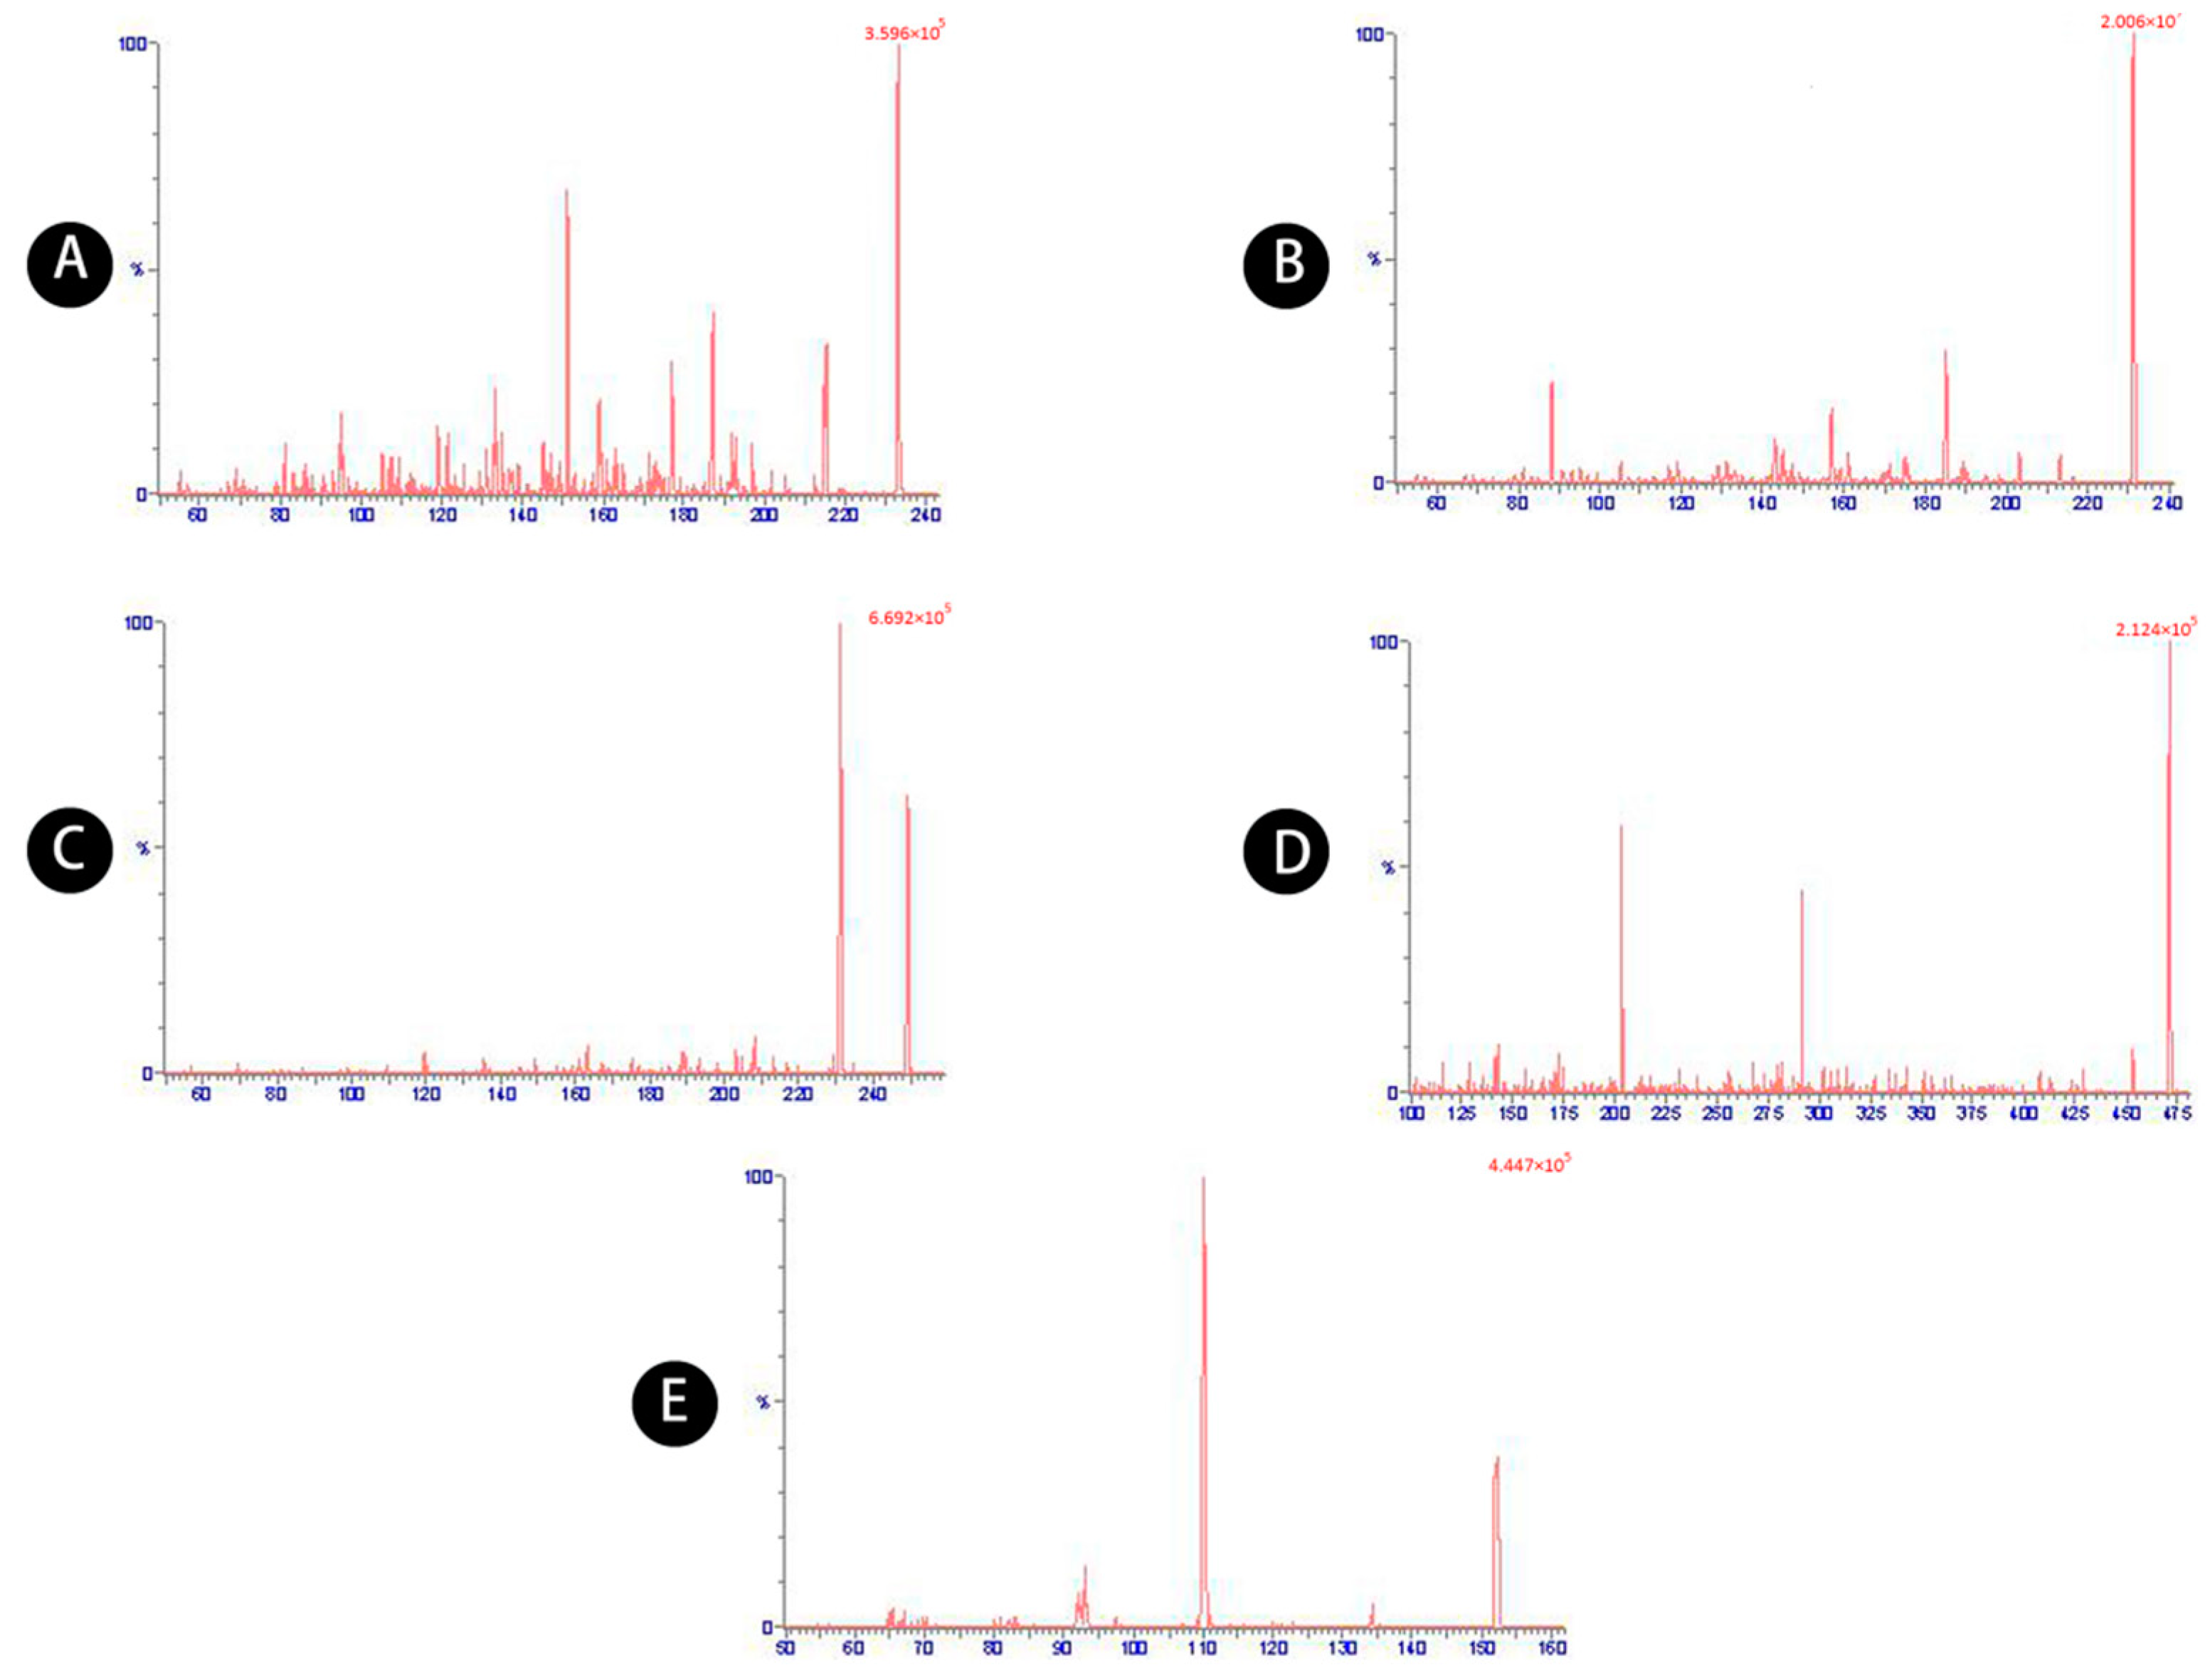
Figure 8.
MRM chromatograms of (A) atractylenolide I, (B) atractylenolide II, (C) atractylenolide III, (D) atractyloside A, (E) acetaminophen.
Figure 8.
MRM chromatograms of (A) atractylenolide I, (B) atractylenolide II, (C) atractylenolide III, (D) atractyloside A, (E) acetaminophen.
Table 1.
Regression, linear range, and lower LOQs of atractylenolides I, II, and III, and atractyloside A in rat plasma.
Table 1.
Regression, linear range, and lower LOQs of atractylenolides I, II, and III, and atractyloside A in rat plasma.
| Compounds | Range (ng/mL) | Calibration Curves | Correlation Coefficient (r) | LLOQ (ng/mL) |
|---|
| Atractylenolide I | 3.2–350 | y = 0.00563x + 0.00578 | r = 0.9919 | 3.2 |
| Atractylenolide II | 4–500 | y = 0.00194x + 0.00347 | r = 0.9927 | 4 |
| Atractylenolide III | 4–500 | y = 0.00288x + 0.00839 | r = 0.9977 | 4 |
| Atractyloside A | 3.44–430 | y = 0.00165x + 0.00587 | r = 0.9922 | 3.44 |
Table 2.
Precision and accuracy of atractylenolides I, II, and III, and atractyloside A in rat plasma.
Table 2.
Precision and accuracy of atractylenolides I, II, and III, and atractyloside A in rat plasma.
| Compounds | Added C (ng/mL) | Intra-Day (n = 6) | Inter-Day (n = 18) |
|---|
| Measured C (ng/mL) | RSD (%) | RE (%) | Measured C (ng/mL) | RSD (%) | RE (%) |
|---|
| Atractylenolide I | 5.6 | 5.62 ± 0.1 | 1.78 | 0.36 | 5.53 ± 0.15 | 2.71 | 1.25 |
| 28 | 28.07 ± 1.36 | 4.85 | 0.25 | 27.83 ± 1.67 | 6 | 0.61 |
| 140 | 141.53 ± 0.64 | 0.45 | 1.09 | 140.44 ± 0.82 | 0.58 | 0.31 |
| Atractylenolide II | 8 | 8.19 ± 0.08 | 0.98 | 2.38 | 8.09 ± 0.10 | 1.24 | 1.13 |
| 40 | 40.43 ± 0.95 | 2.35 | 1.08 | 39.77 ± 1.16 | 2.92 | 0.56 |
| 200 | 200.57 ± 1.12 | 0.56 | 0.29 | 199.32 ± 1.40 | 0.7 | 0.34 |
| Atractylenolide III | 8 | 8.22 ± 0.06 | 0.73 | 2.75 | 8.19 ± 0.1 | 1.22 | 2.38 |
| 40 | 40.67 ± 0.59 | 2.46 | 1.68 | 40.43 ± 0.88 | 2.18 | 1.08 |
| 200 | 200.53 ± 2.55 | 1.27 | 0.27 | 200.2 ± 3.96 | 1.98 | 0.1 |
| Atractyloside A | 6.88 | 6.48 ± 0.07 | 1.08 | −5.81 | 6.09 ± 0.15 | 2.46 | −5.81 |
| 17.2 | 17.23 ± 1.26 | 7.31 | −0.49 | 17.06 ± 1.57 | 9.2 | −0.49 |
| 172 | 172.63 ± 0.36 | 0.21 | 0.36 | 171.59 ± 0.60 | 0.35 | 0.36 |
Table 3.
Mean extraction recovery and matrix effects of atractylenolides I, II, and III, atractyloside A, and acetaminophen in rat plasma.
Table 3.
Mean extraction recovery and matrix effects of atractylenolides I, II, and III, atractyloside A, and acetaminophen in rat plasma.
| Compounds | Added C (ng/mL) | Extraction Recovery (%) | RSD (%) | Matrix Effects (%) | RSD (%) |
|---|
| Atractylenolide I | 5.6 | 87.81 ± 4.82 | 5.49 | 106.78 ± 0.85 | 0.80 |
| 28 | 91.79 ± 1.17 | 1.27 | 90.09 ± 12.27 | 13.62 |
| 140 | 82.04 ± 2.1 | 2.64 | 73.40 ± 1.07 | 1.45 |
| Atractylenolide II | 8 | 85.08 ± 5.30 | 6.23 | 99.48 ± 6.53 | 6.56 |
| 40 | 96.57 ± 6.99 | 7.24 | 86.80 ± 11 | 12.67 |
| 200 | 97.93 ± 1.90 | 1.94 | 84.96 ± 0.31 | 0.36 |
| Atractylenolide III | 8 | 85.76 ± 4.41 | 5.14 | 89.54 ± 9.79 | 10.93 |
| 40 | 92.79 ± 2.04 | 2.19 | 92.69 ± 9.39 | 10.13 |
| 200 | 80.26 ± 4.42 | 5.50 | 69.25 ± 4.72 | 6.82 |
| Atractyloside A | 6.88 | 82.47 ± 6.32 | 7.66 | 86.07 ± 6.49 | 7.54 |
| 17.2 | 86.17 ± 2.41 | 2.80 | 115.30 ± 2.67 | 2.31 |
| 172 | 71.90 ± 4.97 | 6.92 | 120.28 ± 7.29 | 6.06 |
| 4-Acetaminophen | 52 | 98.54 ± 6.81 | 6.91 | 112.39 ± 4.33 | 3.85 |
Table 4.
Stability of atractylenolides I, II, and III, and atractyloside A in rat plasma at room temperature.
Table 4.
Stability of atractylenolides I, II, and III, and atractyloside A in rat plasma at room temperature.
| Compounds | Added (ng/mL) | 0 h Measured C (ng/mL) | 4 h Measured C (ng/mL) | 6 h Measured C (ng/mL) | RE (%) |
|---|
| Atractylenolide I | 5.6 | 5.56 | 5.51 | 5.50 | −1.37 |
| 28 | 28.52 | 28.43 | 27.87 | 0.98 |
| 140 | 140.49 | 140.45 | 139.61 | 0.13 |
| Atractylenolide II | 8 | 8.32 | 8.54 | 8.21 | 4.08 |
| 40 | 40.88 | 40.06 | 40.49 | 1.19 |
| 200 | 200.27 | 200.22 | 200.24 | 0.12 |
| Atractylenolide III | 8 | 8.06 | 8.02 | 7.96 | 0.17 |
| 40 | 40.30 | 40.27 | 40.08 | 0.54 |
| 200 | 200.47 | 200.31 | 199.05 | −0.03 |
| Atractyloside A | 6.88 | 6.81 | 6.41 | 6.14 | −6.2 |
| 17.2 | 17.16 | 17.02 | 16.98 | −0.85 |
| 172 | 172.31 | 171.50 | 171.32 | −0.17 |
Table 5.
Freeze-thaw stability of atractylenolides I, II, and III, and atractyloside A in rat plasma.
Table 5.
Freeze-thaw stability of atractylenolides I, II, and III, and atractyloside A in rat plasma.
| Compounds | Added (ng/mL) | Zero Time Measured C (ng/mL) | One Time Measured C (ng/mL) | Two Time Measured C (ng/mL) | RE (%) |
|---|
| Atractylenolide I | 5.6 | 5.95 | 5.04 | 5.02 | −4.70 |
| 28 | 28.42 | 28.50 | 28.01 | 1.11 |
| 140 | 141.30 | 140.01 | 140.22 | 0.36 |
| Atractylenolide II | 8 | 8.78 | 8.46 | 8.28 | 6.33 |
| 40 | 41.37 | 40.88 | 40.43 | 2.23 |
| 200 | 201.26 | 200.04 | 200.63 | 0.32 |
| Atractylenolide III | 8 | 8.78 | 8.52 | 7.89 | 4.96 |
| 40 | 40.10 | 40.48 | 40.63 | 1.01 |
| 200 | 201.30 | 200.07 | 199.67 | 0.17 |
| Atractyloside A | 6.88 | 6.39 | 6.38 | 6.02 | −8.96 |
| 17.2 | 17.86 | 17.36 | 17.02 | 1.24 |
| 172 | 172.73 | 171.48 | 171.65 | −0.03 |
Table 6.
AUC0–∞ and self-defined weighting coefficients of atractylenolides I, II, and III, and atractyloside A in raw and wheat bran-processed Atractylodis Rhizoma in rat plasma.
Table 6.
AUC0–∞ and self-defined weighting coefficients of atractylenolides I, II, and III, and atractyloside A in raw and wheat bran-processed Atractylodis Rhizoma in rat plasma.
| Compounds | | Raw | Processed |
|---|
| Atractylenolide I | AUC0–∞ (μg·h/L) | 130.44 | 230.74 |
| Wj | 0.18 | 0.22 |
| Atractylenolide II | AUC0–∞ (μg·h/L) | 202.37 | 218.88 |
| Wj | 0.28 | 0.21 |
| Atractylenolide III | AUC0–∞ (μg·h/L) | 233.09 | 289.03 |
| Wj | 0.32 | 0.27 |
| Atractyloside A | AUC0-∞ (μg·h/L) | 167.48 | 325.24 |
| Wj | 0.23 | 0.31 |
Table 7.
Pharmacokinetic parameters of atractylenolides I, II, and III, and atractyloside A in rat plasma after oral administration of raw and wheat bran-processed Atractylodis Rhizoma.
Table 7.
Pharmacokinetic parameters of atractylenolides I, II, and III, and atractyloside A in rat plasma after oral administration of raw and wheat bran-processed Atractylodis Rhizoma.
| Compounds | Groups | Cmax (ng/mL) | Tmax (h) | t1/2 (h) | AUC0–t (h·μg/L) | AUC0–∞ (h·μg/L) | MRT0–∞ (h) |
|---|
| Atractylenolide I | Raw | 32.09 ± 2.05 | 1.5 ± 0 | 3.58 ± 1.69 | 116.75 ± 18.38 | 130.44 ± 27.37 | 5.28 ± 1.36 |
| Wheat-bran processed | 66.94 ± 10.89 * | 1.5 ± 0 | 2.29 ± 1.18 | 219.14 ± 46.65 * | 230.74 ± 44.79 | 4.86 ± 0.93 * |
| Atractylenolide II | Raw | 49.62 ± 7.69 | 1.5 ± 0 | 4.12 ± 4.12 | 181.21 ± 29.35 | 202.37 ± 21.14 | 5.93 ± 3.14 |
| Wheat-bran processed | 55.9 ± 13.58 * | 1 ± 0 | 4.02 ± 3.10 | 202.43 ± 68.52 * | 218.88 ± 61.97 | 5.03 ± 1.58 |
| Atractylenolide III | Raw | 87.04 ± 17.03 | 1 ± 0 | 1.56 ± 0.61 | 230.62 ± 76.76 | 233.09 ± 75.98 | 3.48 ± 0.29 |
| Wheat-bran processed | 113.10 ± 19.04 * | 1 ± 0 | 1.81 ± 0.79 * | 284.83 ± 32.94 * | 289.03 ± 32.52 | 3.07 ± 0.31 * |
| Atractyloside A | Raw | 57.80 ± 21.65 | 0.95 ± 0.11 | 3.95 ± 2.22 | 138.41 ± 60.13 | 167.48 ± 90.09 | 6.05 ± 2.58 |
| Wheat-bran processed | 69.38 ± 8.29 * | 1.5 ± 0 | 2.55 ± 0.98 | 306.91 ± 73.75 | 325.24 ± 72.07 | 4.87 ± 0.84 * |
| Integrated data | Raw | 54.17 ± 7.16 | 1 ± 0 | 2.473 ± 0.68 | 175.67 ± 28.09 | 184.54 ± 25.88 | 4.35 ± 0.33 |
| Wheat-bran processed | 70.02 ± 5.16 * | 1.5 ± 0 | 2.27 ± 0.36 * | 263.23 ± 40.15 * | 273.22 ± 39.99 | 4.14 ± 0.33 * |
Table 8.
MRM parameters of atractylenolides I, II, and III, atractyloside A, and acetaminophen.
Table 8.
MRM parameters of atractylenolides I, II, and III, atractyloside A, and acetaminophen.
| Compounds | Precursor Ion (m/z) | Product Ion (m/z) | Cone (V) | Collision (V) |
|---|
| Acetaminophen | 151.9 | 110.16 | 42 | 14 |
| Atractylenolide I | 233.3 | 187.2 | 30 | 16 |
| Atractylenolide II | 231.2 | 185.2 | 34 | 14 |
| Atractylenolide III | 249.2 | 231.2 | 4 | 8 |
| Atractyloside A | 471.3 | 203.2 | 48 | 26 |


