
Determination of Tryptophan and Its Major Metabolites in Fluid from the Anterior Chamber of the Eye in Diabetic Patients with Cataract by Liquid Chromotography Mass Spectrometry (LC-MS/MS)

 , , and
Abstract
:
1. Introduction
2. Results and Discussion
3. Materials and Methods
3.1. Sample Collection
3.2. Sample Preparation
3.3. LC-MS/MS
3.4. Validation
3.4.1. Calibration Solutions and Standards
3.4.2. LOD and LOQ
3.4.3. Precision
3.5. Statistical Analysis
4. Conclusions
Author Contributions
Funding
Conflicts of Interest
References
- Palego, L.; Betti, L.; Rossi, A.; Giannaccini, G. Tryptophan Biochemistry: Structural, Nutritional, Metabolic, and Medical Aspects in Humans. J. Amino Acids 2016, 8952520. [Google Scholar] [CrossRef] [PubMed]
- Badawy, A.A.-B. Kynurenine Pathway of Tryptophan Metabolism: Regulatory and Functional Aspects. Int. J. Tryptophan Res. 2017, 10, 1–12. [Google Scholar] [CrossRef] [PubMed]
- Chen, Y.; Guillemin, G.J. Kynurenine pathway metabolites in humans: Diseaseand healthy states. Int. J. Tryptophan Res. 2009, 2, 1–19. [Google Scholar] [CrossRef] [PubMed]
- Stone, T.W. Kynurenines in the CNS: From endogenous obscurity to therapeutic importance. Prog. Neurobiol. 2001, 64, 185–218. [Google Scholar] [CrossRef]
- Lesniak, W.G.; Jyoti, A.; Mishra, M.K.; Louissaint, N.; Romero, R.; Chugani, D.C.; Kannan, S.; Kannan, R.M. Concurrent quantification of tryptophan and its major metabolites. Anal. Biochem. 2013, 443, 222–231. [Google Scholar] [CrossRef] [PubMed] [Green Version]
- Vignau, J.; Jacquemont, M.C.; Lefort, A.; Imbenotte, M.; Lhermitte, M. Simultaneous determination of tryptophan and kynurenine in serum by HPLC with UV and fluorescence detection. Biomed. Chromatogr. 2004, 18, 872–874. [Google Scholar] [CrossRef] [PubMed]
- Bao, Y.; Luchetti, D.; Schaeffer, E.; Cutrone, J. Determination of kynurenic acid in rat cerebrospinal fluid by HPLC with fluorescence detection. Biomed. Chromatogr. 2016, 30, 62–67. [Google Scholar] [CrossRef] [PubMed]
- Żarnowski, T.; Rejdak, R.; Zielińska-Rzecka, E.; Zrenner, E.; Grieb, P.; Zagórski, Z.; Junemann, A.; Turski, W.A. Elevated concentrations of kynurenic acid, a tryptophan derivative in dense nuclear cataracts. Curr. Eye Res. 2007, 32, 27–32. [Google Scholar] [CrossRef] [PubMed]
- Buczko, P.; Stokowska, W.; Górska, M.; Kucharewicz, I.; Pawlak, D.; Buczko, W. Tryptophan metabolites via kynurenine pathway in saliva of diabetic patients. Dent. Med. Probl. 2006, 43, 21–25. [Google Scholar]
- Matysik-Woźniak, A.; Jünemann, A.; Turski, W.A.; Wnorowski, A.; Jóźwiak, K.; Paduch, R.; Okuno, E.; Moneta-Wielgoś, J.; Chorągiewicz, T.; Maciejewski, R.; et al. The presence of kynurenine aminotransferases in the human cornea: Evidence from bioinformatics analysis of gene expression and immunohistochemical staining. Mol. Vis. 2017, 23, 364–371. [Google Scholar] [PubMed]
- Rejdak, R.; Oleszczuk, A.; Rummelt, C.; Turski, W.A.; Choragiewicz, T.; Nowomiejska, K.; Ksiazek, K.; Thaler, S.; Zarnowski, T.; Okuno, E.; et al. Presence and distribution of l-kynurenine aminotransferases immunoreactivity in human cataractous lenses. Acta Ophtalmol. 2013, 91, e450–e455. [Google Scholar] [CrossRef] [PubMed] [Green Version]
- Wood, A.M.; Truscott, R.J.W. UV filters in human lenses: Tryptophan catabolism. Exp Eye Res. 1993, 56, 317–325. [Google Scholar] [CrossRef] [PubMed]
- Tsentalovich, Y.P.; Sherin, P.S.; Kopylova, L.V.; Cherepanov, I.V.; Grilj, J.; Vauthey, E. Photochemical properties of UV filter molecules of the human eye. Investig. Ophthalmol. Vis. Sci. 2011, 52, 7687–7696. [Google Scholar] [CrossRef] [PubMed]
- Mailankot, M.; Staniszewska, M.M.; Butler, H.; Caprara, M.H.; Howell, S.; Wang, B.; Doller, C.; Reneker, L.W.; Nagaraj, R.H. Indoleamine 2,3-dioxygenase overexpression causes kynurenine-modification of proteins, fiber cell apoptosis and cataract formation in themouse lens. Lab. Investig. 2009, 89, 498–512. [Google Scholar] [CrossRef] [PubMed]
- Mitsuhashi, S.; Fukushima, T.; Tomiya, M.; Santa, T.; Imai, K.; Toyo’oka, T. Determination of kynurenine levels in rat plasma by high-performance liquid chromatography with pre-column fluorescence derivatization. Anal. Chim. Acta 2007, 584, 315–321. [Google Scholar] [CrossRef] [PubMed]
- Xiao, L.D.; Luo, X.B.; Pi, L.G.; Tang, A.G. Simultaneous determination of kynurenine and kynurenic acid concentrations in human serum by with dual wavelengths fluorescence detection. Clin. Chim. Acta 2008, 395, 178–180. [Google Scholar] [CrossRef] [PubMed]
- Pi, L.G.; Tang, A.G.; Mo, X.M.; Luo, X.B.; Ao, X. More rapid and sensitive method for simultaneous determination of tryptophan and kynurenic acid by HPLC. Clin. Biochem. 2009, 42, 420–425. [Google Scholar] [PubMed]
- Zagajewski, J.; Drozdowicz, D.; Brzozowska, I.; Hubalewska-Mazgaj, M.; Stelmaszynska, T.; Laidler, P.M.; Brzozowski, T. Conversion L-tryptophan to melatonin in the gastrointestinal tract: The new high performance liquid chromatography method enabling simultaneous determination of six metabolites of L-tryptophan by native fluorescence and UV–VIS detection. J. Physiol. Pharmacol. 2012, 63, 613–621. [Google Scholar] [PubMed]
- Chen, G.-Y.; Zhong, W.; Zhou, Z.; Zhang, Q. Simultaneous determination of tryptophan and its 31 catabolites in mouse tissues by polarity switching UHPLC-SRM-MS. Anal. Chim. Acta 2018, 1037, 200–210. [Google Scholar] [CrossRef] [PubMed]
- De Jong, W.H.; Smit, R.; Bakker, S.J.; de Vries, E.G.; Kema, I.P. Plasma tryptophan, kynurenine and 3-hydroxykynurenine measurement using automated on-line solid-phase extraction HPLC-tandem mass spectrometry. J. Chromatogr. B Anal. Technol. Biomed. Life Sci. 2009, 877, 603–609. [Google Scholar] [CrossRef] [PubMed]
- Zhu, W.; Stevens, A.P.; Dettmer, K.; Gottfried, E.; Hoves, S.; Kreutz, M.; Holler, E.; Canelas, A.B.; Kema, I.; Oefner, P.J. Quantitative profiling of tryptophan metabolites in serum, urine, and cell culture supernatants by liquid chromatography-tandem mass spectrometry. Anal. Bioanal. Chem. 2011, 401, 3249–3261. [Google Scholar] [CrossRef] [PubMed]
- Moller, M.; Du Preez, J.L.; Harvey, B.H. Development and validation of a single analytical method for the determination of tryptophan, and its kynurenine metabolites in rat plasma. J. Chromatogr. B Anal. Technol. Biomed. Life Sci. 2012, 898, 121–129. [Google Scholar] [CrossRef] [PubMed]
- Huang, Y.; Louie, A.; Yang, Q.; Massenkoff, N.; Xu, C.; Hunt, P.W.; Gee, W. A simple LC-MS/MS method for determination of kynurenine and tryptophan concentrations in human plasma from HIV-infected patients. Bioanalysis 2013, 5, 1397–1407. [Google Scholar] [CrossRef] [PubMed]
- Choi, J.M.; Park, W.S.; Song, K.Y.; Lee, H.J.; Jung, B.H. Development of simultaneous analysis of tryptophan metabolites in serum and gastric juice—An investigation towards establishing a biomarker test for gastric cancer diagnosis. Biomed. Chromatogr. 2016, 30, 1963–1974. [Google Scholar] [CrossRef] [PubMed]
- Henykova, E.; Vranova, H.P.; Amakorova, P.; Pospisil, T.; Zukauskaite, A.; Vlckova, M.; Urbanek, L.; Novak, O.; Mares, J.; Kanovsky, P.; et al. Stable isotope dilution ultra-high performance liquid chromatography-tandem mass spectrometry quantitative profiling of tryptophan-related neuroactive substances in human serum and cerebrospinal fluid. J. Chromatogr. A 2016, 1437, 145–157. [Google Scholar] [CrossRef] [PubMed]
- Arias, J.L.O.; Schneider, A.; Andrade, J.A.B.; Vieira, A.A.; Gehrke, V.R.; Camargo, E.R.; Caldas, S.S.; Primel, E.G. Evaluation of dilute-and-shoot and solid-phase extraction methods for the determination of S-metolachlor and metolachlor-OA in runoff water samples by liquid chromatography tandem mass spectrometry. Anal. Methods 2017, 9, 5777–5783. [Google Scholar] [CrossRef]
- He, X.; Kozak, M. Simultaneous Quantitation of 43 Drugs in Human Urine with a “Dilute-and-Shoot” LC-MS/MS Method; Application Note 576; Thermo Fisher Scientific: San Jose, CA, USA, 2012. [Google Scholar]
- Bie, M.; Li, R.; Chai, T.; Dai, S.; Zhao, H.; Yang, S.; Qiu, J. Simultaneous Determination of Tetracycline Antibiotics in Beehives by Liquid Chromatography–Triple Quadrupole Mass Spectrometry. Adv. Appl. Sci. Res. 2012, 3, 462–468. [Google Scholar]
- Shah, J.V.; Shah, P.A.; Sanyal, M.; Shrivastav, P.S. Simultaneous quantification of amiloride and hydrochlorothiazide in human plasma by liquid chromatography–tandem mass spectrometry. J. Pharm. Anal. 2017, 7, 288–296. [Google Scholar] [CrossRef] [PubMed]
- ICH. Q2(R1) Validation of Analytical Procedures: Text and Methodology; International Conference on Harmonization: Geneva, Switzerland, 2005. [Google Scholar]
- Chan, C.C.; Lam, H.; Lee, Y.C.; Zhang, X.-M. Analytical Method Validation and Instrument Performance Verification; Wiley-Interscience: New York, NY, USA, 2004; ISBN 0-471-25953-5. [Google Scholar]
- Konieczka, P.; Namieśnik, J. Quality Assurance and Quality Control in the Analytical Chemical Laboratory: A Practical Approach, 1st ed.; Analytical Chemistry Series; CRC Press, Taylor and Francis Group: Milton Park/Abingdon, UK, 2018. [Google Scholar]
- Konieczka, P.; Namieśnik, J. Quality Assurance and Quality Control in the Analytical Chemical Laboratory: A Practical Approach, 2nd ed.; CRC Press: Boca Raton, FL, USA, 2018. [Google Scholar]
- Jaya, T.; Razia, K.; Divya, V. A validated HPLC-UV method and optimization of sample preparation technique for norepinephrine and serotonin in mouse brain. Pharm. Biol. 2015, 53, 1539–1544. [Google Scholar]
- Martínez-Ortega, A.; Herrera, A.; Salmerón-García, A.; Cabeza, J.; Cuadros-Rodríguez, L.; Navas, N. Study and ICH validation of a reverse-phase liquid chromatographic method for the quantification of the intact monoclonal antibody cetuximab. J. Pharm. Anal. 2016, 6, 117–124. [Google Scholar] [CrossRef] [PubMed]
Sample Availability: Samples of L-tryptophan-amino-15N, L-tryptophan, L-kynurenine and L-kynurenic acid are not available from the authors but it can be purchased from the manufacturer: Sigma-Aldrich (St. Louis, MO, USA). |


| Analyte | Concentration Range (ng/mL) | Determination Coefficient | Calibration Curve |
|---|---|---|---|
| Tryptophan | 4–2000 | 0.9973 | y = 0.0213 (±0.0015)x − 0.0330 (±0.0023) |
| Kynurenine | 4–2000 | 0.9972 | y = 0.0325 (±0.0030)x − 0.0325 (±0.0030) |
| Kynurenic acid | 4–2000 | 0.9982 | y = 0.0088 (±0.0010)x − 0.1097 (±0.0121) |
| Analyte | Tryptophan | Kynurenine | Kynurenic Acid |
|---|---|---|---|
| LOD (ng/mL) | 0.20 | 1.20 | 0.40 |
| LOQ (ng/mL) | 0.66 | 3.9 | 1.32 |
| Parameters | Tryptophan | |||
| Fortification level (ng/mL) | 50 | 150 | 400 | 2000 |
| Average recovery (n = 18) (%) | 95.0 ± 3.2 | 96.1 ± 3.4 | 98.0 ± 4.0 | 94.3 ± 2.2 |
| Average repeatability, (RSDr, %) | 4.4 ± 3.4 | 3.4 ± 2.2 | 3.6 ± 3.9 | 4.1 ± 4.1 |
| Average within-lab reproducibility, (RSDwR, %) | 5.7 ± 3.2 | 5.0 ± 3.0 | 5.2 ± 2.0 | 5.4 ± 3.8 |
| Kynurenine | ||||
| Fortification level (ng/mL) | 10 | 50 | 150 | 400 |
| Average recovery (n = 18) (%) | 91.0 ± 4.6 | 92.2 ± 4.2 | 94.6 ± 3.0 | 95.0 ± 4.3 |
| Average repeatability, (RSDr, %) | 5.5 ± 3.9 | 4.9 ± 4.4 | 5.1 ± 4.3 | 6.4 ± 4.1 |
| Average within-lab reproducibility, (RSDwR, %) | 6.9 ± 5.3 | 5.1 ± 4.3 | 4.8 ± 4.5 | 5.8 ± 5.2 |
| Kynurenic acid | ||||
| Fortification level (ng/mL) | 4 | 10 | 50 | 150 |
| Average recovery (n = 18) (%) | 96.0 ± 3.7 | 96.3 ± 3.5 | 97.2 ± 3.8 | 97.6 ± 2.6 |
| Average repeatability, (RSDr, %) | 5.0 ± 3.6 | 3.6 ± 2.9 | 3.2 ± 3.4 | 4.0 ± 3.7 |
| Average within-lab reproducibility, (RSDwR, %) | 5.3 ± 3.9 | 4.2 ± 3.3 | 4.4 ± 2.9 | 4.6 ± 3.2 |
| Diabetes and Cataract (n = 8) | ||||
| Range | Mean ± Standard Deviation | Median | CV | |
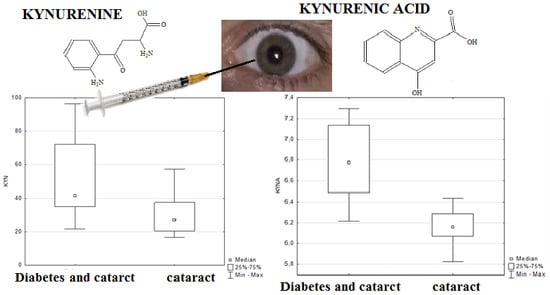
| KYN (ng/mL) | 21.85–191.84 | 64.06 ± 56.17 | 41.93 | 0.876 |
| KYNA (ng/mL) | 6.22–8.51 | 6.94 ± 0.72 | 6.78 | 0.104 |
| TRP (ng/mL) | 694.86–1784.12 | 1010.69 ± 387.45 | 817.76 | 0.383 |
| TRP/KYNA | 101.57–256.80 | 145.53 ± 53.36 | 125.81 | 0.367 |
| TRP/KYN | 9.33–33.46 | 20.59 ± 8.72 | 19.23 | 0.423 |
| KYN/KYNA | 3.40–27.54 | 9.29 ± 8.12 | 6.51 | 0.874 |
| Cataract (n = 20) | ||||
| Range | Mean ± Standard Deviation | Median | CV | |
| KYN (ng/mL) | 16.61–67.84 | 31.11 ± 14.59 | 27.37 | 0.469 |
| KYNA (ng/mL) | 5.83–6.76 | 6.19 ± 0.23 | 6.17 | 0.038 |
| TRP (ng/mL) | 465.36–1356.26 | 855.57 ± 203.13 | 835.02 | 0.237 |
| TRP/KYNA | 75.72–219.30 | 138.03 ± 31.00 | 132.25 | 0.225 |
| TRP/KYN | 6.86–53.91 | 32.12 ± 11.72 | 32.36 | 0.365 |
| KYN/KYNA | 2.71–11.03 | 5.01 ± 2.29 | 4.42 | 0.457 |
| Variables | The Sum of a Rank for Diabetics Group | The Sum of a Rank for Cataract Group | U | Z | p | Z (Corrected for Ties) | P | 2*1 P |
|---|---|---|---|---|---|---|---|---|
| KYNA | 185.00 | 221.00 | 11.00 | 3.4836 | 0.0005 | 3.4836 | 0.0005 | 0.0001 |
| KYN | 161.00 | 245.00 | 35.00 | 2.2630 | 0.0236 | 2.2630 | 0.0236 | 0.0213 |
| TRP | 120.00 | 286.00 | 76.00 | 0.1780 | 0.8587 | 0.1780 | 0.8587 | 0.8617 |
| TRP/KYNA | 108.00 | 298.00 | 72.00 | −0.3814 | 0.7029 | −0.3814 | 0.7029 | 0.7086 |
| TRP/KYN | 71.00 | 335.00 | 35.00 | −2.2630 | 0.0236 | −2.2630 | 0.0236 | 0.0213 |
| KYN/KYNA | 150.00 | 256.00 | 46.00 | 1.7036 | 0.0885 | 1.7036 | 0.0885 | 0.0887 |
| Age of patient | 83.00 | 323.00 | 47.000 | −1.6528 | 0.0984 | −1.6562 | 0.0977 | 0.0991 |
| Analyte | Precursor Ion (m/z) | Ion Transition | Declustering Potential | Collision Energy (eV) | Collision Cell Exit Potential | Entrance Potential |
|---|---|---|---|---|---|---|
| Tryptophan | 205.0 | 188.0 146.0 | 50 | 16 23 | 16 10 | 10 10 |
| Kynurenine | 209.1 | 191.9 146.0 | 66 | 11 25 | 14 10 | 10 10 |
| Kynurenic acid | 190.0 | 172.0 144.0 | 81 | 17 25 | 12 14 | 10 10 |
| (IS) | 206.0 | 188.0 | 50 | 16 | 16 | 10 |
© 2018 by the authors. Licensee MDPI, Basel, Switzerland. This article is an open access article distributed under the terms and conditions of the Creative Commons Attribution (CC BY) license (http://creativecommons.org/licenses/by/4.0/).
Share and Cite
Flieger, J.; Święch-Zubilewicz, A.; Śniegocki, T.; Dolar-Szczasny, J.; Pizoń, M. Determination of Tryptophan and Its Major Metabolites in Fluid from the Anterior Chamber of the Eye in Diabetic Patients with Cataract by Liquid Chromotography Mass Spectrometry (LC-MS/MS). Molecules 2018, 23, 3012. https://doi.org/10.3390/molecules23113012
Flieger J, Święch-Zubilewicz A, Śniegocki T, Dolar-Szczasny J, Pizoń M. Determination of Tryptophan and Its Major Metabolites in Fluid from the Anterior Chamber of the Eye in Diabetic Patients with Cataract by Liquid Chromotography Mass Spectrometry (LC-MS/MS). Molecules. 2018; 23(11):3012. https://doi.org/10.3390/molecules23113012
Chicago/Turabian StyleFlieger, Jolanta, Anna Święch-Zubilewicz, Tomasz Śniegocki, Joanna Dolar-Szczasny, and Magdalena Pizoń. 2018. "Determination of Tryptophan and Its Major Metabolites in Fluid from the Anterior Chamber of the Eye in Diabetic Patients with Cataract by Liquid Chromotography Mass Spectrometry (LC-MS/MS)" Molecules 23, no. 11: 3012. https://doi.org/10.3390/molecules23113012