Capillary Blood GSH Level Monitoring, Using an Electrochemical Method Adapted for Micro Volumes
by
 ,
,
Zaneta Buchtova
1, 
Zuzana Lackova
1,2,
Jiri Kudr
1,2,
Zdenek Zitka
3,
Jan Skoda
3 and
Ondrej Zitka
1,2,* 
1
Department of Chemistry and Biochemistry, Mendel University in Brno, Zemedelska 1, CZ-613 00 Brno, Czech Republic
2
Central European Institute of Technology, Brno University of Technology, Purkyňova 656/123, CZ-612 00 Brno, Czech Republic
3
University Sports Centre, Faculty of Sports Studies, Masaryk University, Komenskeho namesti 2, CZ-662 43 Brno, Czech Republic
*
Author to whom correspondence should be addressed.
Molecules 2018, 23(10), 2504; https://doi.org/10.3390/molecules23102504
Submission received: 10 August 2018
/
Revised: 19 September 2018
/
Accepted: 23 September 2018
/
Published: 29 September 2018
(This article belongs to the Section Electrochemistry)
Abstract
:Glutathione (γ-glutamyl-cysteinyl-glycine; also known as GSH) is an endogenous antioxidant that plays a crucial role in cell defense mechanisms against oxidative stress. It is thus not surprising that this molecule can serve as a biomarker for oxidative stress monitoring. As capillary blood is a highly accessible target for biomarking, it is a valuable bodily fluid for diagnosing human GSH levels. This study focused on the optimization of GSH measurements from micro volumes of capillary blood prior to using electrochemical detection. The optimization of experimental parameters, including the sample volume and its stability, was performed and evaluated. Moreover, we tested the optimized method as part of a short-term study. The study consisted of examining 10 subjects within 96 h of their consumption of high amounts of antioxidants, attained from a daily dose of 2 g/150 mL of green tea. The subjects’ capillary blood (5 μL) was taken at 0 h, 48 h, and 96 h for subsequent analysis. The short-term supplementation of diet with green tea showed an increase of GSH pool by approximately 38% (between 0 and 48 h) within all subjects.
1. Introduction
Antioxidants are important molecules that prevent negative effects of free radicals, produced in vivo by molecular oxygen metabolism. The presence of antioxidants and free radicals is well-balanced in healthy organisms, with such compounds being obtained through dietary intake, such as polyphenolics [1], contained in fruit and vegetables [2,3]. Increasing the level of free radicals impairs equilibrium and induces oxidative stress. Oxidative stress can result in the damage of DNA, proteins, lipids, and carbohydrates, and can cause several diseases [4,5,6,7]. Glutathione (L-γ-glutamyl-L-cysteinyl-glycine; also known as GSH) is one of the most important intracellular, non-enzymatic antioxidants [8,9], and is valuable as a pool-making, cofactor substance for the neutralization of reactive oxygen/nitrogen species (ROS, NOS). It plays an important role in nutrient metabolism, cell regulation (including gene expression), DNA and protein synthesis, signal transduction, proliferation and apoptosis, production of cytokines, and immune response [5,10,11,12,13,14]. GSH is also needed for the detoxification of xenobiotics [8,15,16]. GSH possesses thiol moiety, which acts as a reducing agent, due to its ability to transform into oxidized, dimeric glutathione (GSSG), which can be reduced back to GSH in the glutathione-ascorbate cycle [17,18]. Since thiols play an important role in several biological processes, they are objects of increasing interest [19,20]. Additionally, a stable GSH and GSSG ratio is important for the antioxidant capacity of cells, for numerous reasons [12].
Generally, blood markers reliably depict the oxidative status of organisms [21,22]. Usually, venous blood is used for GSH/GSSG analysis; however, a relatively low amount of blood is sufficient for analysis using modern analytical methods. On the other hand, to maintain the selectivity of the detection method in suppressing the interference of other antioxidants, a separation step is necessary. As such, High Performance Liquid Chromatography (HPLC) is commonly used for GSH separation. HPLC can be combined with Electrochemical Detection (HPLC-ED), which is suitable for the analysis of natural antioxidants, such as phenolics, in comparative studies [2,23], or bodily antioxidants in diagnostic studies [22]. HPLC-ED—also frequently used spectrophotometric analysis—is a competitive alternative to laboratory-led procedures, using fluorescence detection [24] or capillary electrophoresis (CE) with Laser Induced Fluorescence (LIF) [25]. It is also possible to analyze tissue or cell samples, using microchip capillary electrophoresis [26] or high performance capillary electrophoresis (HPCE) [27]. Nevertheless, state-of-the-art laboratory analysis is usually carried out by Mass Spectrometry (MS) analysis, which is highly sensitive and selective, in comparison to other methods [28]. However, though MS methods are used in the study of GSH in biochemical studies, they are useless in terms of point-of-care testing (POCT), due to high purchase and maintenance costs, the high level of expertise needed to operate them, and the size of the mass spectrometer itself.
The main reason why we are dealing with electrochemical detection above the other methods previously mentioned is that electrochemical detection has the biggest potential next to optical detection methods, in terms of miniaturization, and thus, in its further use in POCT. For that matter, several recently published works have shown this potential, in using electrochemistry for simple POC-like applications on a real samples [29] or in studies directly focused on biosensors [30].
In addition, colorimetric determination of GSH in blood volumes as low as 0.5 μL was reported by Giustarini et al. [31]. In such cases, capillary blood has been used instead of venous blood, due to the former’s being easier and faster to sample, as well as causing less discomfort to examined patients. Thus, capillary blood sampling has become increasingly more common in medical practice [32]. Though such sampling provides low amounts of blood (about 20 μL), such amounts are sufficient for currently trending POCT devices, which may be developed in the near future. Nevertheless, there is no record regarding the lack of GSH levels in POCT. This may be due to insufficient research into GSH analysis.
Sample preparation plays a crucial role in the analysis of glutathione in blood and other biological materials, as GSH can spontaneously oxidize to GSSG, which can significantly influence the determination of the GSH/GSSG ratio. Several procedures of samples preparation were suggested for GSH/GSSG determination; however, standardized, reliable procedures are lacking [33,34,35,36]. Wurzinger et al. showed that both venous and capillary blood is suitable for determining some oxidative state parameters [37]. Only a few studies have focused on the analysis of GSH/GSSG in capillary blood [38]; one was aimed at the analysis of dried blood spots [39].
Our study focused on the optimization of critical steps in a sample preparation, before GSH/GSSG ratio analysis. To our best knowledge, we are showing the first GSH/GSSG analysis of capillary blood, using an electrochemical method, in a real study in which the short-term effects of a green tea supplementation on the GSH/GSSG ratio were investigated.
2. Results and Discussion
2.1. Conditions of HPLC-ED Analysis
We used a HPLC-ED set-up, believing it to be the most robust electrochemical method for GSH analysis. To begin, the flow rate of the mobile phase was optimized in the context of our previous work [40]. A flow rate of 1.1 mL min−1 was selected as optimal for both GSH and GSSG, as shown in Figure S1A,B, in the Supplementary Materials. The ideal column temperature for determination of GSH and GSSG ratio was also investigated, as shown in Figure S1C,D, in the Supplementary Materials. The best detector temperature for directly influencing GSH and GSSG ratio response was investigated, as well, as shown Figure S1E,F, Supplementary Materials. In light of these findings, the column and detector temperatures were set for 35 °C and 40 °C, respectively.
Direct, accurate analysis of GSH and GSSG was not applicable in this study, due to the rapid self-oxidation of GSH. This required that the sample be protected through freezing or by using stabilizing agents [41]. For most analytical methods analyzing GSH/GSSG ratio, derivatization could be enabled, for a limited time, by derivatizing agents [41]. In the case of direct analysis of GSH/GSSG ratio, without such agents, only HPLC-ED or more rapid, expansive, and accurate ESI-MS/MS [42] methods could be used. However, in such cases, the sample’s temperature needed to be strictly controlled and preanalytical steps taken, before injection of the sample into the system. This needed to be done within a few minutes. As such, the influence of a widely-used, autosampler temperature on the stability of the real sample was investigated. The autosampler temperature of 4 °C provided the most stable response and a gentle increase of the GSH signal was observed, as shown in Figure S2A, in the Supplementary Materials. The best result for preserving the ratio of GSH/GSSG was recorded, while 4 °C was applied, as shown in Figure S2B, in the Supplementary Materials. The best detection potential was found under +0.9 V, as shown in Figure S2C, Supplementary Materials, which is in strong agreement with our previously-published works [40,43].
Additionally, the best conditions for analysis were found, in using: A flow rate of 1.1 mL min−1, a column temperature of 35 °C, a detector temperature of 40 °C, a sampler temperature of 4 °C, and an electrode potential of + 0.9 V. The final calibration parameters for the HPLC-ED method were set as follows for GSH–LOD (3S/N) 2.3 μM (linear dynamic range 5.1–325.4 μM, Regression equation y = 0.1581x + 0.2908, RSD 4.5%) and for GSSG–LOD (3S/N) 21.2 μM (linear dynamic range 21.2–172.0 μM, Regression equation y = 0.2276x − 0.0598, RSD 4.8%), as shown in Figure S3C,D, in the Supplementary Materials.
2.2. Sample Preparation
As has been reported in previous studies, GSH easily undergoes spontaneous oxidation to GSSG. Therefore, after the optimization of the GSH/GSSG assay, using HPLC-ED, we focused on a real sample preparation before analysis. Next to the strictly-controlled, low temperature, the effect of Trifluoroacetic acid (TFA) (concentrations 5, 10 and 15% w/w) was examined, based on our previous experience in different studies, focused on HPLC-ED [22,40]. In order to stabilize GSH levels in real samples, 10% (w/w) of TFA (final concentration) showed the best results and was used in subsequent experiments, as shown in Figure S3A,B, in the Supplementary Materials.
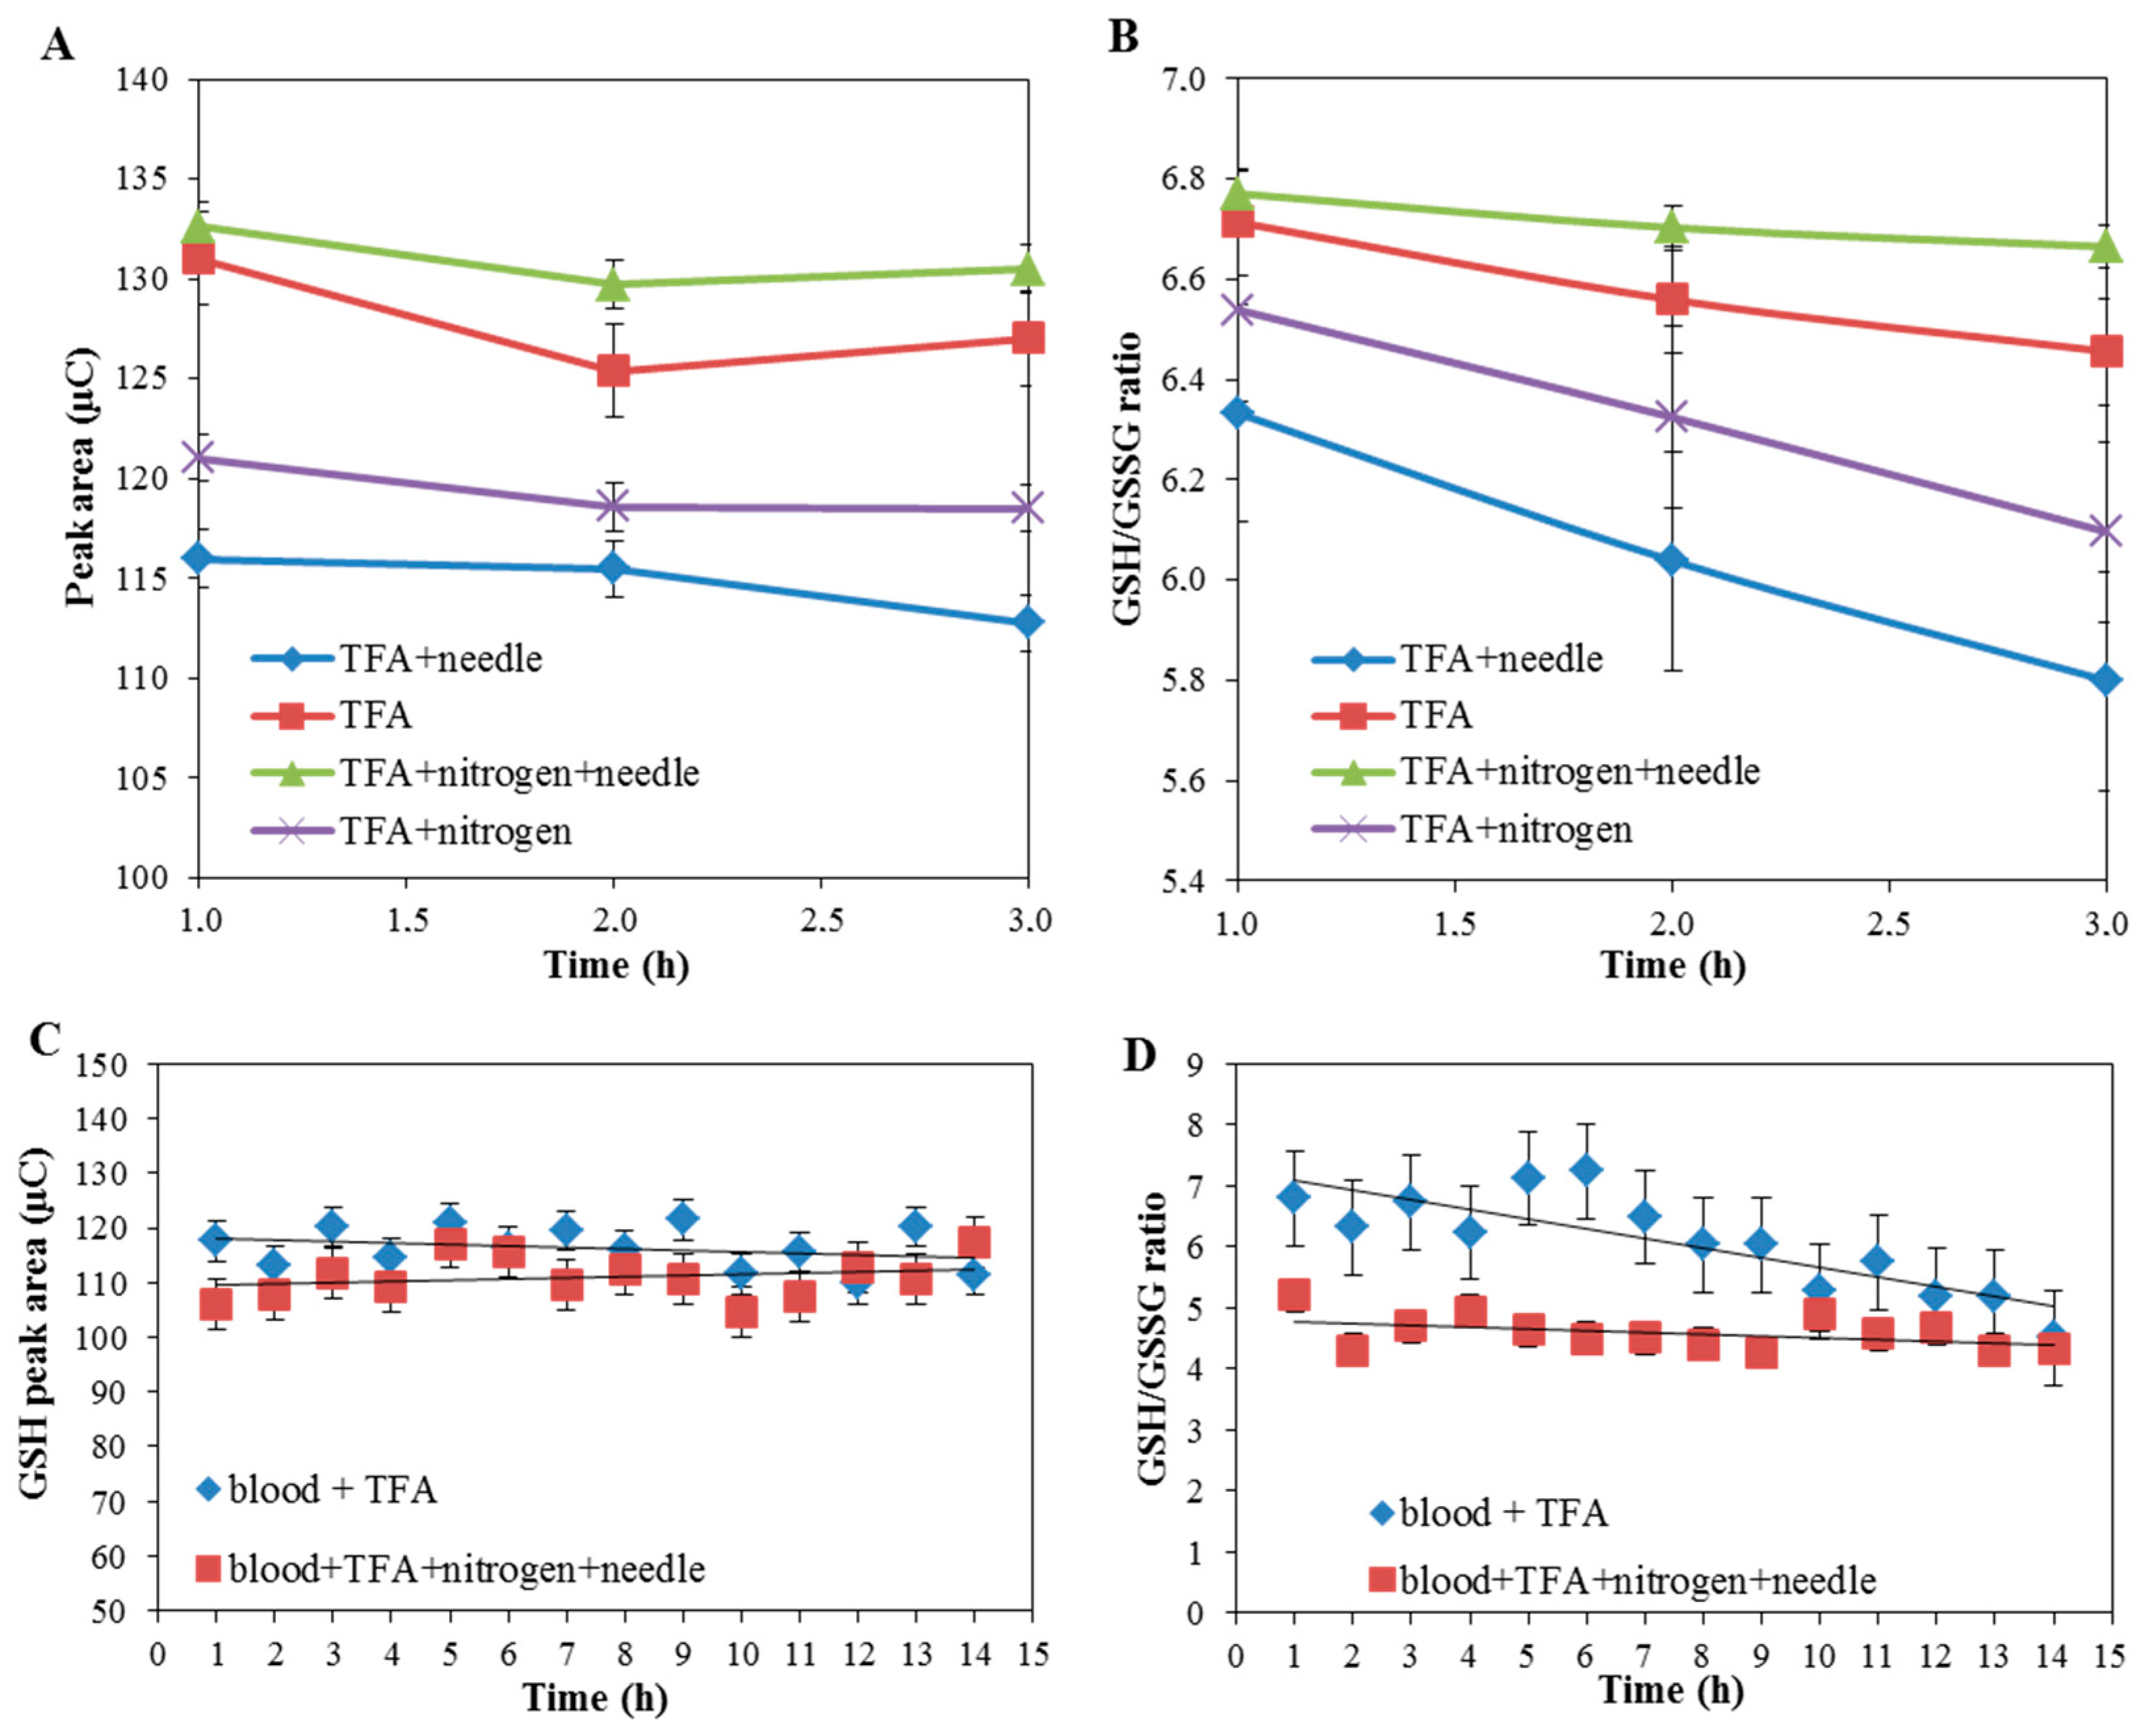
Further, we compared the effects of different physical conditions, during sample processing, and their effects on the ratio of GSH/GSSG. TFA (10% w/w) was added to the sample and divided into 4 aliquots. The first was analyzed without additional processing and others were treated using: (i) liquid nitrogen, (ii) a sonication needle, and (iii) a combination of the two. Subsequently, the samples were centrifuged (at 25,000 RPM, for a 20 min, at 4 °C) and analyzed. The highest levels of GSH were provided by the samples with just the addition of TFA and the addition of TFA, sonication, and nitrogen treatment, as shown in Figure 1A. The most stable GSH/GSSG ratio was provided by the sample treated with TFA, sonication, and liquid nitrogen, as shown in Figure 1B. Subsequently, GSH levels and the GSH/GSSG ratio were observed for a prolonged amount of time (1–14 h), as shown in Figure 1C,D.
From the results obtained, it clearly follows that the best GSH/GSSG ratio was determined using samples prepared with TFA, nitrogen, and sonication needle, and solely TFA, respectively. Moreover, the lower standard error has been reached in the case of samples prepared with TFA, nitrogen, and sonication needle, as shown in Figure 1C,D.
2.3. Green Tea Supplementation Study
From the evidence presented, the GSH/GSSG ratio analysis using HPLC-ED methods, coupled with the proper sample pretreatment, could be used in a short-term, preliminary study, on easily acquired capillary blood, during three days of controlled, green tea consumption. In the past, the green tea, Camellia sinensis, attracted a lot of attention, due to its positive effects on the antioxidant status of organisms, metabolic syndromes, and cardiovascular diseases [44,45]. Green tea also possesses anti-inflammatory, hepatoprotective, anticancer, and anti-mutagenic properties [46]. Further, epigallocatechin 3-gallate, included in green tea modulates: signals pathways—including NF-κB—influences mitochondrial membrane potential, increases caspase-3 activity, and increases expression of phase II antioxidant enzymes [47,48,49].
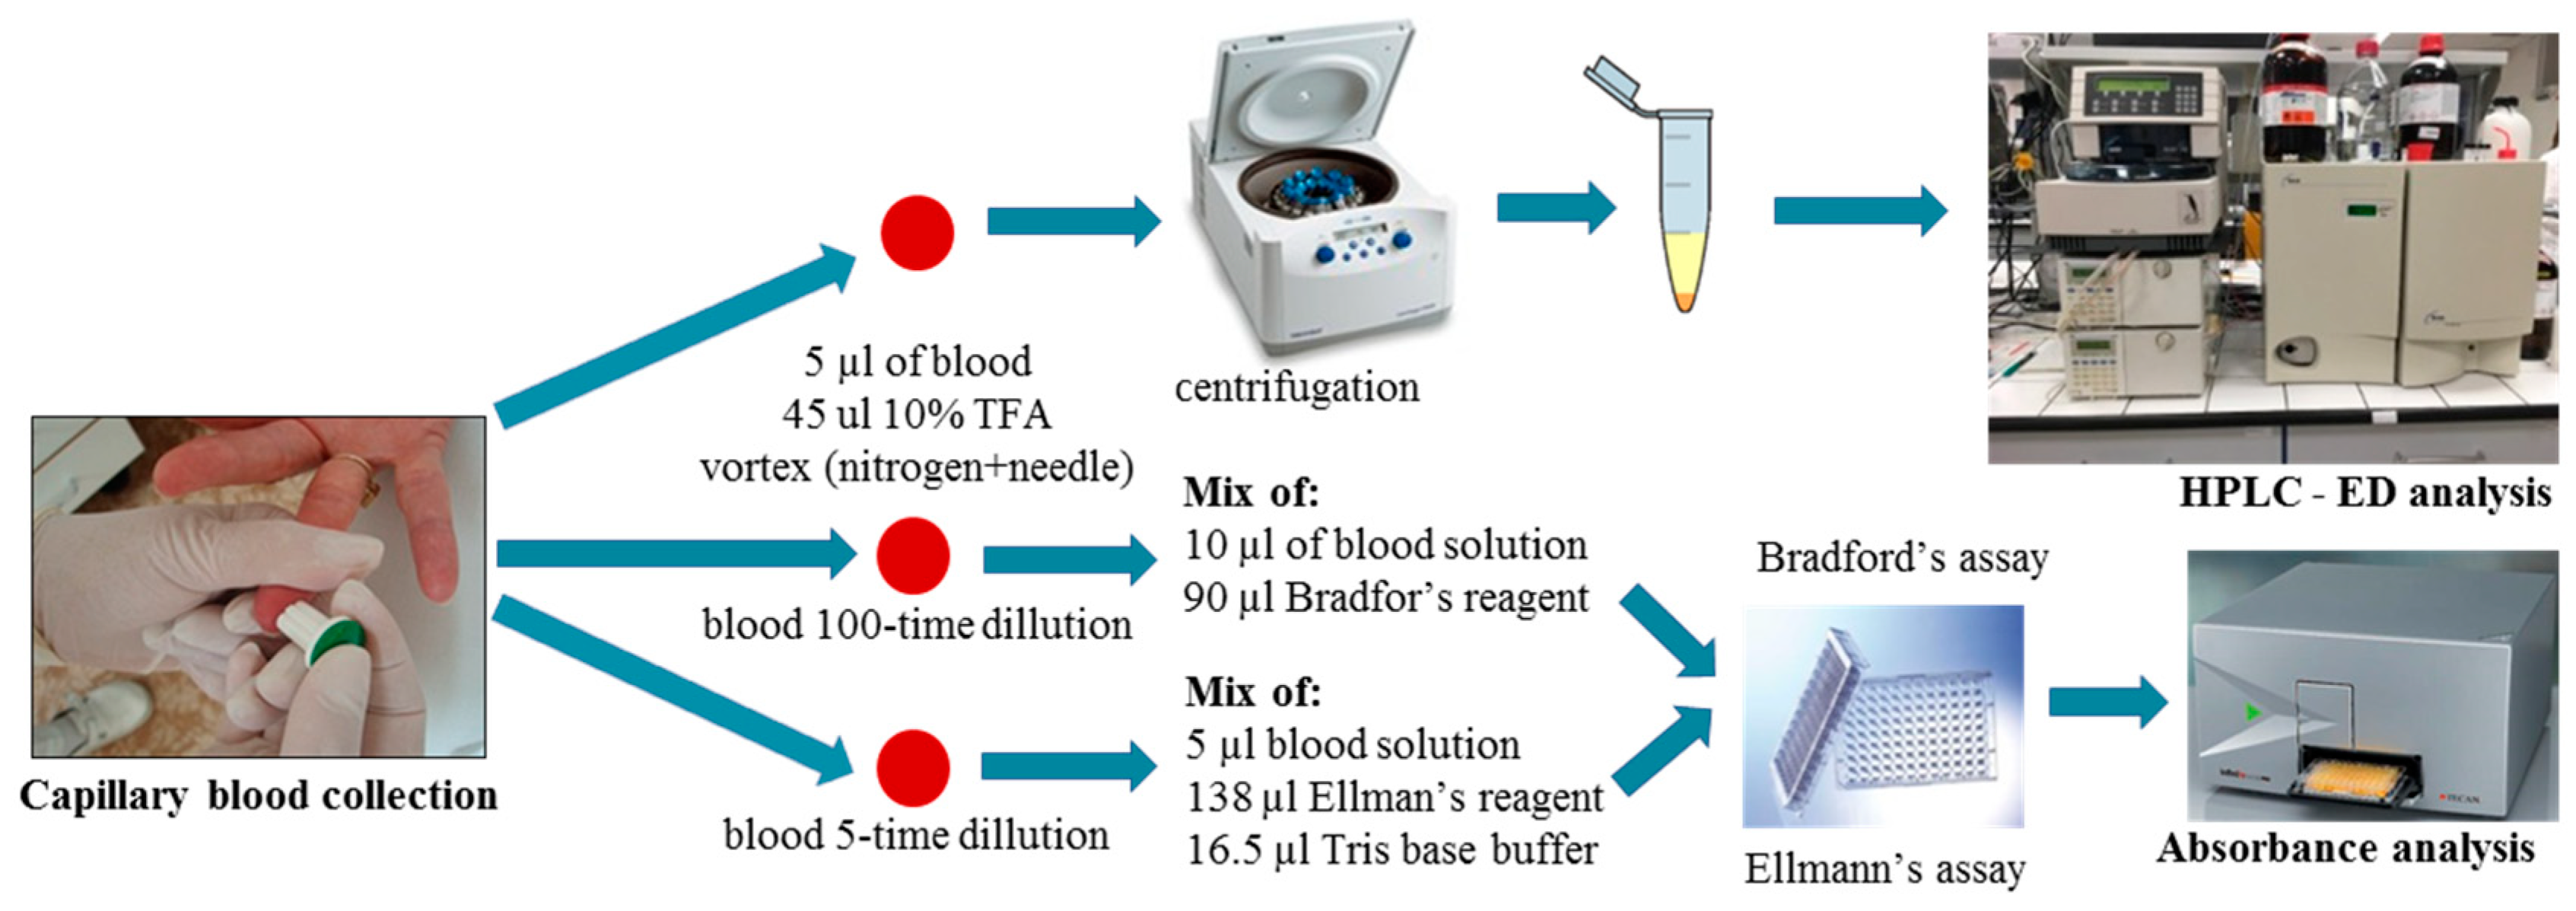
Herein, the optimized method for GSH analysis was used to investigate GSH levels in capillary blood samples of group of ten volunteers, supplemented with green tea. This said, the GSSG amount was not the target of the green tea study. GSH levels in volunteers were determined three times: before the start of supplementation, after 48 h of supplementation, and after 96 h of supplementation. The dose of green tea was calculated, according to a volunteer weight. A limited intake of food and beverages with high antioxidant concentrations—like coffee, wine, fruits, vegetables, and dietary supplements—was recommended to volunteers. 15 µL of capillary blood was taken, and GSH levels and total protein concentrations were determined. GSH levels were determined as µg of GSH per total protein mg. The schema of such a sample treatment can be seen in Figure 2.
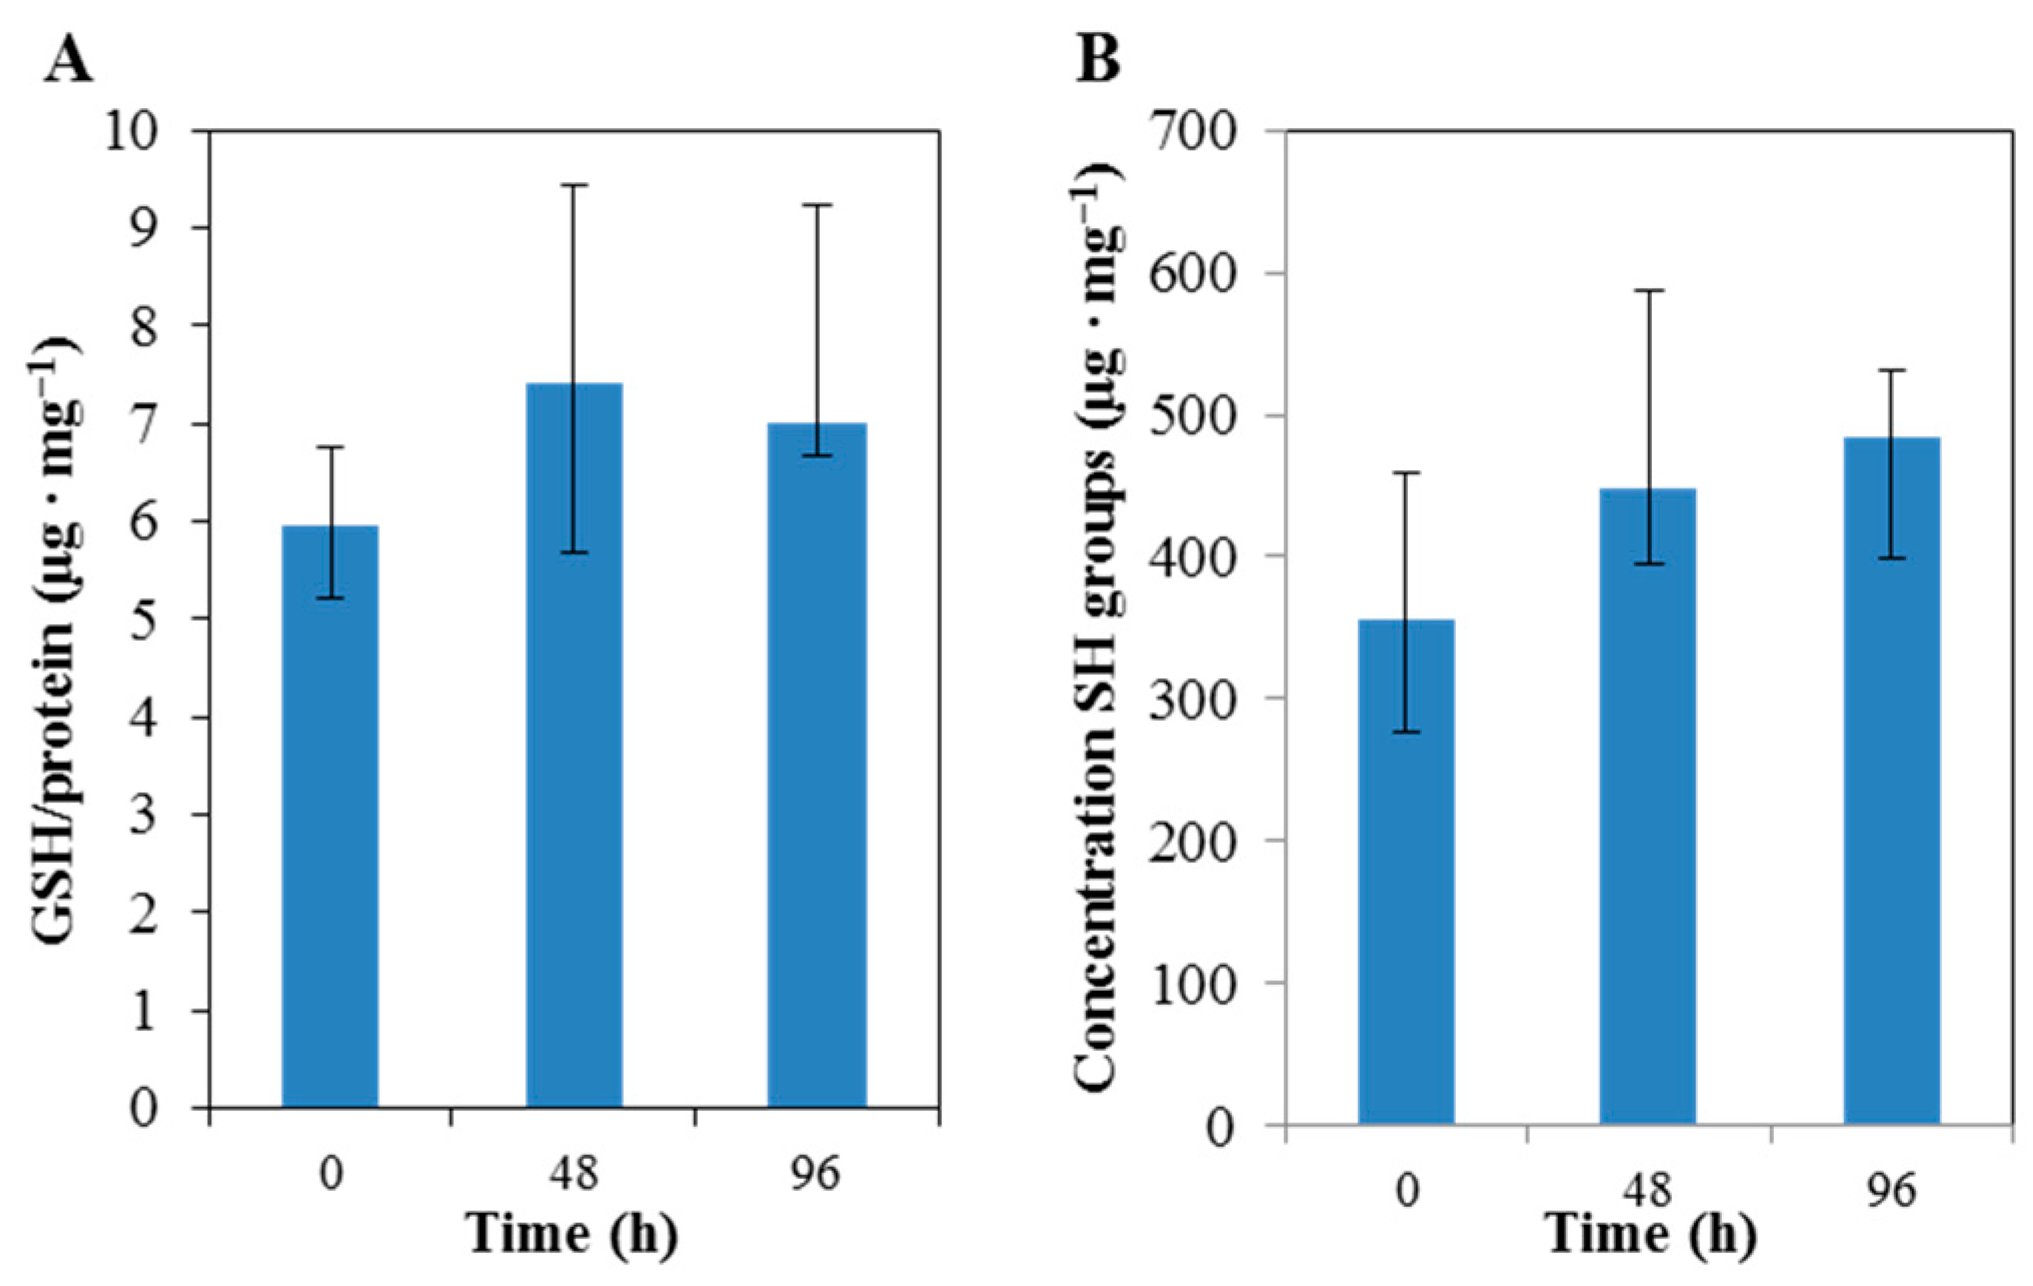
Obtained results suggested that the green tea supplementation was connected to an increase of GSH concentration in blood. Increase of GSH levels by 26% on average was observed between the first and second blood samplings. The third collection of blood showed stagnating, or gently decreasing, GSH levels, as shown in Figure 3. Increasing levels of GSH, after green tea supplementation, has been shown previously in mice, as part of a long-term study [50], and in PC 12 cells under of effect of Pb++ [51]. Basu et al. reported a GSH increase of 34%, after 8 weeks of green tea supplementation [4]. Supplementation with green tea polyphenols in animal models of oxidative stress showed increase in antioxidant enzymes and glutathione concentration [52]. Further, total levels of thiol groups in blood samples were determined, using Ellman’s reagent, as GSH is one of the most represented thiols in blood [53,54,55]. This was determined using 2.5 µL of capillary blood, mixed with phosphate buffer. Similar trends, in terms of GSH levels, were observed total thiol levels. More precisely, after 3 days of the green tea supplementation, the total amount of thiol groups within capillary blood samples increased by an average of 32.6%, but the difference was not so significant, as shown in Figure 3. Moreover, such an intensive increase was not observed. The total amount of thiol groups increased by 33.8% (p < 0.05), after 5 days of the supplementation, in comparison with the previous supplementation.
3. Materials and Methods
3.1. Chemicals
GSH and GSSG, 5,5′-dithiobis-(2-nitrobenzoic acid), cysteine, sodium acetate, Coomasie Brilliant Blue G-250, and a phosphoric acid TFA were obtained from Sigma Aldrich (St. Louis, MA, USA). Methanol in HPLC grade was obtained from Chromservis (Prague, Czech Republic).
3.2. Samples
All subjects gave their informed consent for inclusion, before participating in the study. The study was conducted in accordance with the Declaration of Helsinki and the protocol was approved by the Ethics Committee of the Faculty Hospital in Brno (01269746). Blood samples (10–15 μL) were taken from a lateral part of the finger, previously heated in a water bath, using a safety lancet for a capillary blood testing and a Minivette POCT (both from Sarstedt, Nümbrecht, Germany). Directly after, 45 µL of 10% TFA was added to 5 µL of blood and, for a few minutes, the mixture was stored on ice, at 4 °C. Subsequently, samples were placed within liquid nitrogen for 1 min. Samples were melted and disintegrated, using a sonication needle for 30 s, and centrifuged (25,000 RPM, 4 °C). Supernatant (40 μL) was then analyzed, using HPLC-ED.
3.3. Method of HPLC-ED
Analysis of GSH and GSSG was performed, using HPLC-ED, which consisted of two chromatographic pumps (Model 582; ESA Inc., Chelmsford, MA, USA), a twelve-channel CoulArray electrochemical detector (Model 5600A; ESA Inc., Chelmford, MA, USA), and a column, containing reverse phase Zorbax eclipse AAA C18 (150 × 4.6 mm; particles size 3.5 µm, Agilent Technologies, Santa Clara, CA, USA). The detector consisted of three, flow analytical chambers (Model 6210; ESA Inc., Chelmsford, MA, USA). Each chamber contained four analytical cells. Each analytical cell contained two reference electrodes (hydrogen-palladium), two counter electrodes, and porous graphite working electrodes. The electrochemical detector, situated in the control module, was tempered. Mobile phase A consisted of TFA-water (3:97, w/w) and mobile phase B was 100% Met-OH. Compounds were eluted, following a linear increase in gradient: 0 → 1 min (4% B), 1 → 5 min (7% B), 5 → 6 min (98% B), and 6 → 20 min (100% B). Detection was carried out with an applied potential of +0.9 V. The time taken for one analysis was 20 min.
3.4. Total Thiol Content Analysis
Blood samples (5 μL, 5-times diluted with water) were mixed with 138 μL of Ellman’s reagent (2 mM 5,5′-dithiobis-(2-nitrobenzoic acid), in 50 mM of sodium acetate). The reaction was started, using an addition of 16.5 μL Tris base buffer (1 M, pH 8 was adjusted, using acetic acid). The colored product of the reaction (159.5 μL) was determined, using Infinite M200Pro (Tecan, Männedorf, Switzerland) at 436 nm, within a 96-well plate with a flat bottom (Thermo Fisher Scientific, Waltham, MA, USA).
3.5. Protein Content Analysis
Bovine serum albumin was used as a standard for Bradford’s assay. Bradford’s reagent was prepared as follows: 10 mg of Coomasie Brilliant Blue G-250 was dissolved in 5 mL of 100% ethanol; subsequently, 10 mL of 85% phosphoric acid was added, and the solution was filled to 100 mL with double-distilled water. Ninety microliters of Bradford’s reagent were mixed with blood samples diluted 100 times (10 μL). The colored product of reaction was determined, using Infinite M200Pro (Tecan, Männedorf, Switzerland) at 595 nm. One-hundred microliters were pipetted within a 96-well plate with a flat bottom (Thermo Fisher Scientific, Waltham, MA, USA).
3.6. Design of the Study
Ten, healthy volunteers (3 woman and 7 men, between the ages of 23–33 years) were supplemented with green tea. Old England Green tea (Milford, Hall in Tirol, Austria) was prepared as follows: 1 tea bag (2 g of tea mixture) was macerated in 150 mL of water (60 °C) for 4 min. Volunteers were supplemented, according to their weight: 150 mL of tea per 50 kg of weight for one subject, twice a day for one week. Other intakes of antioxidants were not controlled; however, it was recommended that subjects avoid consuming fruits, vegetables, wine, coffee, and dietary supplements. Volunteer’s blood was taken on the first, third, and fifth day of the experiment. Subsequently, the optimized preparation procedure was analyzed, using HPLC-ED. Volunteers signed an informed consent, before the experiment.
4. Conclusions
We optimized the direct, electrochemical method for analysis of GSH level in small samples of capillary blood. Suitability of the method was proved by performing a simple experiment, showing the short-term effects of green tea supplementation on GSH levels of 10 volunteers. A fast increase of GSH levels in the capillary blood of volunteers, due to consumption of green tea, was observed. This was in a strong agreement with an observed increase of total thiol concentration in the samples. This is not surprising, as GSH is the most abundant thiol compound in blood. However, we also showed that capillary blood is suitable for GSH electrochemical analysis. Therefore, this method could be used in future, for monitoring changes in GSH levels of capillary blood. In addition, our proposed method will certainly be less demanding on the subjects and patients, in comparison to the intravenous taking of blood by syringe.
Supplementary Materials
The following are available online at: Figures S1, S2, and S3.
Author Contributions
Design of experiments: Z.Z., J.S., and O.Z.; performance of optimizations: Z.B.; performance of LC/MS analysis, including protein and total thiol content assay: Z.B. and Z.L.; data analysis: Z.B., J.K., and Z.Z.; 1st draft of paper: Z.B.; revision of paper J.K., J.S., and O.Z.
Funding
This research was funded by IGA IP_2017/067 and CEITEC 2020 (LQ1601).
Acknowledgments
The study was financially supported by IGA IP_2017/067 and CEITEC 2020 (LQ1601).
Conflicts of Interest
The authors declare no conflicts of interest.
References
- Leopoldini, M.; Russo, N.; Toscano, M. The molecular basis of working mechanism of natural polyphenolic antioxidants. Food Chem. 2011, 125, 288–306. [Google Scholar] [CrossRef]
- Jurikova, T.; Sochor, J.; Rop, O.; Mlcek, J.; Balla, S.; Szekeres, L.; Zitny, R.; Zitka, O.; Adam, V.; Kizek, R. Evaluation of polyphenolic profile and nutritional value of non-traditional fruit species in the Czech Republic—A comparative study. Molecules 2012, 17, 8968–8981. [Google Scholar] [CrossRef] [PubMed]
- Cartea, M.E.; Francisco, M.; Soengas, P.; Velasco, P. Phenolic compounds in brassica vegetables. Molecules 2011, 16, 251–280. [Google Scholar] [CrossRef] [PubMed] [Green Version]
- Basu, A.; Betts, N.M.; Mulugeta, A.; Tong, C.; Newman, E.; Lyons, T.J. Green tea supplementation increases glutathione and plasma antioxidant capacity in adults with the metabolic syndrome. Nutr. Res. 2013, 33, 180–187. [Google Scholar] [CrossRef] [PubMed] [Green Version]
- Childs, S.; Haroune, N.; Williams, L.; Gronow, M. Determination of cellular glutathione:Glutathione disulfide ratio in prostate cancer cells by high performance liquid chromatography with electrochemical detection. J. Chromatogr. A 2016, 1437, 67–73. [Google Scholar] [CrossRef] [PubMed]
- Squellerio, I.; Caruso, D.; Porro, B.; Veglia, F.; Tremoli, E.; Cavalca, V. Direct glutathione quantification in human blood by LC-MS/MS: Comparison with HPLC with electrochemical detection. J. Pharm. Biomed. Anal. 2012, 71, 111–118. [Google Scholar] [CrossRef] [PubMed]
- Carru, C.; Zinellu, A.; Sotgia, S.; Marongiu, G.; Farina, M.G.; Usai, M.F.; Pes, G.M.; Tadolini, B.; Deiana, L. Optimization of the principal parameters for the ultrarapid electrophoretic separation of reduced and oxidized glutathione by capillary electrophoresis. J. Chromatogr. A 2003, 1017, 233–238. [Google Scholar] [CrossRef] [PubMed]
- Giustarini, D.; Dalle-Donne, I.; Milzani, A.; Rossi, R. Detection of glutathione in whole blood after stabilization with n-ethylmaleimide. Anal. Biochem. 2011, 415, 81–83. [Google Scholar] [CrossRef] [PubMed]
- Chen, S.S.; Chang, L.S.; Chen, H.W.; Wei, Y.H. Polymorphisms of glutathione s-transferase m1 and male infertility in taiwanese patients with varicocele. Hum. Reprod. 2002, 17, 718–725. [Google Scholar] [CrossRef] [PubMed]
- Sies, H. Glutathione and its role in cellular functions. Free Radic. Biol. Med. 1999, 27, 916–921. [Google Scholar] [CrossRef]
- Townsend, D.M.; Tew, K.D.; Tapiero, H. The importance of glutathione in human disease. Biomed. Pharmacother. 2003, 57, 145–155. [Google Scholar] [CrossRef]
- Wu, G.Y.; Fang, Y.Z.; Yang, S.; Lupton, J.R.; Turner, N.D. Glutathione metabolism and its implications for health. J. Nutr. 2004, 134, 489–492. [Google Scholar] [CrossRef] [PubMed]
- Jowko, E.; Dlugolecka, B.; Makaruk, B.; Cieslinski, I. The effect of green tea extract supplementation on exercise-induced oxidative stress parameters in male sprinters. Eur. J. Nutr. 2015, 54, 783–791. [Google Scholar] [CrossRef] [PubMed]
- Masarik, M.; Gumulec, J.; Hlavna, M.; Sztalmachova, M.; Babula, P.; Raudenska, M.; Pavkova-Goldbergova, M.; Cernei, N.; Sochor, J.; Zitka, O.; et al. Monitoring of the prostate tumour cells redox state and real-time proliferation by novel biophysical techniques and fluorescent staining. Integr. Biol. 2012, 4, 672–684. [Google Scholar] [CrossRef] [PubMed]
- Iwasaki, Y.; Saito, Y.; Nakano, Y.; Mochizuki, K.; Sakata, O.; Ito, R.; Saito, K.; Nakazawa, H. Chromatographic and mass spectrometric analysis of glutathione in biological samples. J. Chromatogr. B 2009, 877, 3309–3317. [Google Scholar] [CrossRef] [PubMed]
- Giustarini, D.; Dalle-Donne, I.; Milzani, A.; Fanti, P.; Rossi, R. Analysis of gsh and gssg after derivatization with n-ethylmaleimide. Nat. Protoc. 2013, 8, 1660–1669. [Google Scholar] [CrossRef] [PubMed]
- Allen, J.; Bradley, R.D. Effects of oral glutathione supplementation on systemic oxidative stress biomarkers in human volunteers. J. Altern. Complement. Med. 2011, 17, 827–833. [Google Scholar] [CrossRef] [PubMed]
- Zhang, Q.; Song, Q.; Li, J.L.; Zou, M.L.; Zhang, C.X. Alteration of the enantioselective toxicity of diclofop acid by nonylphenol: Effect on ascorbate-glutathione cycle in microcystis aeruginosa. Chirality 2016, 28, 475–481. [Google Scholar] [CrossRef] [PubMed]
- Giustarini, D.; Galvagni, F.; Tesei, A.; Farolfi, A.; Zanoni, M.; Pignatta, S.; Milzani, A.; Marone, I.M.; Dalle-Donne, I.; Nassini, R.; et al. Glutathione, glutathione disulfide, and s-glutathionylated proteins in cell cultures. Free Radic. Biol. Med. 2015, 89, 972–981. [Google Scholar] [CrossRef] [PubMed]
- Rossi, R.; Dalle-Donne, I.; Milzani, A.; Giustarini, D. Oxidized forms of glutathione in peripheral blood as biomarkers of oxidative stress. Clin. Chem. 2006, 52, 1406–1414. [Google Scholar] [CrossRef] [PubMed]
- Veskoukis, A.S.; Nikolaidis, M.G.; Kyparos, A.; Kouretas, D. Blood reflects tissue oxidative stress depending on biomarker and tissue studied. Free Radic. Biol. Med. 2009, 47, 1371–1374. [Google Scholar] [CrossRef] [PubMed]
- Zitka, O.; Skalickova, S.; Gumulec, J.; Masarik, M.; Adam, V.; Hubalek, J.; Trnkova, L.; Kruseova, J.; Eckschlager, T.; Kizek, R. Redox status expressed as gsh:Gssg ratio as a marker for oxidative stress in paediatric tumour patients. Oncol. Lett. 2012, 4, 1247–1253. [Google Scholar] [CrossRef] [PubMed]
- Sochor, J.; Zitka, O.; Skutkova, H.; Pavlik, D.; Babula, P.; Krska, B.; Horna, A.; Adam, V.; Provaznik, I.; Kizek, R. Content of phenolic compounds and antioxidant capacity in fruits of apricot genotypes. Molecules 2010, 15, 6285–6305. [Google Scholar] [CrossRef] [PubMed]
- Ling, B.L.; Baeyens, W.R.G.; Dewaele, C.; Delcastillo, B. Packed capillary liquid-chromatography coupled to fluorescence detection: Application to human blood-samples for the determination of glutathione. J. Pharm. Biomed. Anal. 1992, 10, 985–988. [Google Scholar] [CrossRef]
- Carru, C.; Deiana, L.; Sotgia, S.; Pes, G.M.; Zinellu, A. Plasma thiols redox status by laser-induced fluorescence capillary electrophoresis. Electrophoresis 2004, 25, 882–889. [Google Scholar] [CrossRef] [PubMed]
- Ling, Y.Y.; Yin, X.F.; Fang, Z.L. Simultaneous determination of glutathione and reactive oxygen species in individual cells by microchip electrophoresis. Electrophoresis 2005, 26, 4759–4766. [Google Scholar] [CrossRef] [PubMed]
- Carlucci, F.; Tabucchi, A.; Biagioli, B.; Sani, G.; Lisi, G.; Maccherini, M.; Rosi, F.; Marinello, E. Capillary electrophoresis in the evaluation of ischemic injury: Simultaneous determination of purine compounds and glutathione. Electrophoresis 2000, 21, 1552–1557. [Google Scholar] [CrossRef]
- Sekkien, A.; Swilam, N.; Ebada, S.S.; Esmat, A.; El-Khatib, A.H.; Linscheid, M.; Singab, A.N. Polyphenols from tamarix nilotica: LC-ESI-MSn profiling and in vivo antifibrotic activity. Molecules 2018, 23, 1411. [Google Scholar] [CrossRef] [PubMed]
- Zhao, L.Z.; Zhao, L.; Miao, Y.Q.; Zhang, C.X. Selective electrochemical determination of glutathione from the leakage of intracellular gsh contents in hela cells following doxorubicin-induced cell apoptosis. Electrochim. Acta 2016, 206, 86–98. [Google Scholar] [CrossRef]
- Karimi-Maleh, H.; Tahernejad-Javazmi, F.; Ensafi, A.A.; Moradi, R.; Mallakpour, S.; Beitollahi, H. A high sensitive biosensor based on fept/cnts nanocomposite/n-(4-hydroxyphenyl)-3,5-dinitrobenzamide modified carbon paste electrode for simultaneous determination of glutathione and piroxicam. Biosens. Bioelectron. 2014, 60, 1–7. [Google Scholar] [CrossRef] [PubMed]
- Giustarini, D.; Fanti, P.; Matteucci, E.; Rossi, R. Micro-method for the determination of glutathione in human blood. J. Chromatogr. B 2014, 964, 191–194. [Google Scholar] [CrossRef] [PubMed] [Green Version]
- Krleza, J.L.; Dorotic, A.; Grzunov, A.; Maradin, M. Capillary blood sampling: National recommendations on behalf of the croatian society of medical biochemistry and laboratory medicine. Biochem. Med. 2015, 25, 335–358. [Google Scholar] [CrossRef] [PubMed]
- Lin, S.K.; Tsai, S.M.; Huang, J.C.; Lee, S.C.; Wu, S.H.; Ma, H.; Lin, J.T.; Tsai, L.Y. Effects of storage time and temperature on the stability of glutathione in deproteinized blood sample. J. Food Drug Anal. 2006, 14, 141–146. [Google Scholar]
- Minelli, C.; Gogele, M. The role of antioxidant gene polymorphisms in modifying the health effects of environmental exposures causing oxidative stress: A public health perspective. Free Radic. Biol. Med. 2011, 51, 925–930. [Google Scholar] [CrossRef] [PubMed]
- Stempak, D.; Dallas, S.; Klein, J.; Bendayan, R.; Koren, G.; Baruchel, S. Glutathione stability in whole blood: Effects of various deproteinizing acids. Ther. Drug Monit. 2001, 23, 542–549. [Google Scholar] [CrossRef] [PubMed]
- Lee, S.G.; Yim, J.; Lim, Y.; Kim, J.H. Validation of a liquid chromatography tandem mass spectrometry method to measure oxidized and reduced forms of glutathione in whole blood and verification in a mouse model as an indicator of oxidative stress. J. Chromatogr. B 2016, 1019, 45–50. [Google Scholar] [CrossRef] [PubMed]
- Wurzinger, S.; Bratu, M.; Wonisch, W.; Wintersteiger, R.; Halwachs-Baumann, G.; Porta, S. Interdependency of the oxidizability of lipoproteins and peroxidase activity with base excess, HCO3, pH and magnesium in human venous and capillary blood. Life Sci. 2006, 78, 1754–1759. [Google Scholar] [CrossRef] [PubMed]
- Zunic, G.; Spasic, S. Capillary electrophoresis method optimized with a factorial design for the determination of glutathione and amino acid status using human capillary blood. J. Chromatogr. B 2008, 873, 70–76. [Google Scholar] [CrossRef] [PubMed]
- Kandar, R.; Stramova, X.; Drabkova, P.; Brandtnerova, M. Determination of total glutathione in dried blood spot samples using a high-performance liquid chromatography. J. Chromatogr. Sci. 2015, 53, 879–885. [Google Scholar] [CrossRef] [PubMed]
- Zitka, O.; Krystofova, O.; Sobrova, P.; Adam, V.; Zehnalek, J.; Beklova, M.; Kizek, R. Phytochelatin synthase activity as a marker of metal pollution. J. Hazard. Mater. 2011, 192, 794–800. [Google Scholar] [CrossRef] [PubMed]
- Kandar, R. Determination of glutathione and glutathione disulfide in biological samples. Chem. Listy 2016, 110, 754–760. [Google Scholar]
- Jiang, Z.T.; Liang, Q.L.; Luo, G.A.; Hu, P.; Li, P.; Wang, Y.M. Hplc-electrospray tandem mass spectrometry for simultaneous quantitation of eight plasma aminothiols: Application to studies of diabetic nephropathy. Talanta 2009, 77, 1279–1284. [Google Scholar] [CrossRef] [PubMed]
- Khan, A.; Khan, M.I.; Iqbal, Z.; Shah, Y.; Ahmad, L.; Nazir, S.; Watson, D.G.; Khan, J.A.; Nasir, F.; Ismail. A new hplc method for the simultaneous determination of ascorbic acid and aminothiols in human plasma and erythrocytes using electrochemical detection. Talanta 2011, 84, 789–801. [Google Scholar] [CrossRef] [PubMed]
- Thielecke, F.; Boschmann, M. The potential role of green tea catechins in the prevention of the metabolic syndrome—A review. Phytochemistry 2009, 70, 11–24. [Google Scholar] [CrossRef] [PubMed]
- Phung, O.J.; Baker, W.L.; Matthews, L.J.; Lanosa, M.; Thorne, A.; Coleman, C.I. Effect of green tea catechins with or without caffeine on anthropometric measures: A systematic review and meta-analysis. Am. J. Clin. Nutr. 2010, 91, 73–81. [Google Scholar] [CrossRef] [PubMed]
- Jurado-Coronel, J.C.; Avila-Rodriguez, M.; Echeverria, V.; Hidalgo, O.A.; Gonzalez, J.; Aliev, G.; Barreto, G.E. Implication of green tea as a possible therapeutic approach for parkinson disease. CNS Neurol. Disord. Drug Targets 2016, 15, 292–300. [Google Scholar] [CrossRef] [PubMed]
- Di Lorenzo, C.; Dell’Agli, M.; Sangiovanni, E.; Dos Santos, A.; Uberti, F.; Moro, E.; Bosisio, E.; Restani, P. Correlation between catechin content and NF-kappa b inhibition by infusions of green and black tea. Plant Food Hum. Nutr. 2013, 68, 149–154. [Google Scholar] [CrossRef] [PubMed]
- Reuland, D.J.; Khademi, S.; Castle, C.J.; Irwin, D.C.; McCord, J.M.; Miller, B.F.; Hamilton, K.L. Upregulation of phase ii enzymes through phytochemical activation of nrf2 protects cardiomyocytes against oxidant stress. Free Radic. Biol. Med. 2013, 56, 102–111. [Google Scholar] [CrossRef] [PubMed]
- Ran, Z.H.; Xu, Q.; Tong, J.L.; Xiao, S.D. Apoptotic effect of epigal locatechin-3-gallate on the human gastric cancer cell line mkn45 via activation of the mitochondrial pathway. World J. Gastroenterol. 2007, 13, 4255–4259. [Google Scholar] [CrossRef] [PubMed]
- Hsu, Y.W.; Tsai, C.F.; Ting, H.C.; Chen, W.K.; Yen, C.C. Green tea supplementation in mice mitigates senescence-induced changes in brain antioxidant abilities. J. Funct. Food. 2014, 7, 471–478. [Google Scholar] [CrossRef]
- Chen, L.J.; Yang, X.Q.; Jiao, H.L.; Zhao, B.L. Effect of tea catechins on the change of glutathione levels caused by pb++ in pc12 cells. Chem. Res. Toxicol. 2004, 17, 922–928. [Google Scholar] [CrossRef] [PubMed]
- Carlsen, H.; Myhrstad, M.C.W.; Thoresen, M.; Moskaug, J.O.; Blomhoff, R. Berry intake increases the activity of the gamma-glutamylcysteine synthetase promoter in transgenic reporter mice. J. Nutr. 2003, 133, 2137–2140. [Google Scholar] [CrossRef] [PubMed]
- Giustarini, D.; Tsikas, D.; Colombo, G.; Milzani, A.; Dalle-Donne, I.; Fanti, P.; Rossi, R. Pitfalls in the analysis of the physiological antioxidant glutathione (GSH) and its disulfide (GSSG) in biological samples: An elephant in the room. J. Chromatogr. B 2016, 1019, 21–28. [Google Scholar] [CrossRef] [PubMed] [Green Version]
- Khan, H.; Jan, S.U.; Hashmatullah; Khan, M.F.; Khan, K.A.; Rehman, A.U.; Wahab, A. Effect of lithium metal on the chemical status of glutathione (GSH) present in whole blood (especially in plasma and cytosolic fraction in human blood). Pak. J. Pharm. Sci. 2010, 23, 188–193. [Google Scholar] [PubMed]
- Giustarini, D.; Galvagni, F.; Colombo, G.; Dalle-Donne, I.; Milzani, A.; Aloisi, A.M.; Rossi, R. Determination of protein thiolation index (PTI) as a biomarker of oxidative stress in human serum. Anal. Biochem. 2017, 538, 38–41. [Google Scholar] [CrossRef] [PubMed]
Sample Availability: Samples of the compounds are available from the authors. |
Figure 1.
The effect of sample preparation on glutathione (GSH) signal (A,C) and on the ratio of GSH to oxidized, dimeric glutathione (GSSG) (B,D) over a certain amount of time. Values are means of three replicates (n = 3). Vertical bars indicate standard error.
Figure 1.
The effect of sample preparation on glutathione (GSH) signal (A,C) and on the ratio of GSH to oxidized, dimeric glutathione (GSSG) (B,D) over a certain amount of time. Values are means of three replicates (n = 3). Vertical bars indicate standard error.

Figure 2.
Scheme of glutathione (GSH) and oxidized, dimeric glutathione (GSSH) blood analysis procedure.
Figure 2.
Scheme of glutathione (GSH) and oxidized, dimeric glutathione (GSSH) blood analysis procedure.

Figure 3.
The effect of the tea supplementation on glutathione (GSH) levels (A) and the level of total SH-moieties in capillary blood (B) (analyzed subjects n = 10). Data are presented as median with error line (the lowest and highest value in the file).
Figure 3.
The effect of the tea supplementation on glutathione (GSH) levels (A) and the level of total SH-moieties in capillary blood (B) (analyzed subjects n = 10). Data are presented as median with error line (the lowest and highest value in the file).

© 2018 by the authors. Licensee MDPI, Basel, Switzerland. This article is an open access article distributed under the terms and conditions of the Creative Commons Attribution (CC BY) license (http://creativecommons.org/licenses/by/4.0/).
Share and Cite
MDPI and ACS Style
Buchtova, Z.; Lackova, Z.; Kudr, J.; Zitka, Z.; Skoda, J.; Zitka, O. Capillary Blood GSH Level Monitoring, Using an Electrochemical Method Adapted for Micro Volumes. Molecules 2018, 23, 2504. https://doi.org/10.3390/molecules23102504
AMA Style
Buchtova Z, Lackova Z, Kudr J, Zitka Z, Skoda J, Zitka O. Capillary Blood GSH Level Monitoring, Using an Electrochemical Method Adapted for Micro Volumes. Molecules. 2018; 23(10):2504. https://doi.org/10.3390/molecules23102504
Chicago/Turabian StyleBuchtova, Zaneta, Zuzana Lackova, Jiri Kudr, Zdenek Zitka, Jan Skoda, and Ondrej Zitka. 2018. "Capillary Blood GSH Level Monitoring, Using an Electrochemical Method Adapted for Micro Volumes" Molecules 23, no. 10: 2504. https://doi.org/10.3390/molecules23102504