Article

Study of the UV Light Conversion of Feruloyl Amides from Portulaca oleracea and Their Inhibitory Effect on IL-6-Induced STAT3 Activation

1
Natural Product Research Center, Korea Research Institute of Bioscience and Biotechnology, 181 Ipsin-gil, Jeongeup-si, Jeonbuk 56212, Korea
2
College of Agriculture and Life Sciences, Chungnam National University, 99 Daehak-ro, Yuseong-gu, Daejeon 300-764, Korea
*
Authors to whom correspondence should be addressed.
Molecules 2016, 21(7), 865; https://doi.org/10.3390/molecules21070865
Submission received: 16 May 2016 / Revised: 24 June 2016 / Accepted: 28 June 2016 / Published: 30 June 2016
(This article belongs to the Section Natural Products Chemistry)

Abstract

:
Two new feruloyl amides, N-cis-hibiscusamide (5) and (7′S)-N-cis-feruloylnormetanephrine (9), and eight known feruloyl amides were isolated from Portulaca oleracea L. and the geometric conversion of the ten isolated feruloyl amides by UV light was verified. The structures of the feruloyl amides were determined based on spectroscopic data and comparison with literature data. The NMR data revealed that the structures of the isolated compounds showed cis/trans-isomerization under normal laboratory light conditions. Therefore, cis and trans-isomers of feruloyl amides were evaluated for their convertibility and stability by UV light of a wavelength of 254 nm. After 96 h of UV light exposure, 23.2%–35.0% of the cis and trans-isomers were converted to trans-isomers. Long-term stability tests did not show any significant changes. Among all compounds and conversion mixtures collected, compound 6 exhibited the strongest inhibition of IL-6-induced STAT3 activation in Hep3B cells, with an IC50 value of 0.2 μM. This study is the first verification of the conversion rates and an equilibrium ratio of feruloyl amides. These results indicate that this natural material might provide useful information for the treatment of various diseases involving IL-6 and STAT3.

Graphical Abstract

1. Introduction

P. oleracea is an annual plant widely distributed in the Middle East, Central Europe, America, Australia and Asia [1,2]. It is generally more tolerant than other crops to saline soil and to drought, high temperature, and low nutrient conditions [3,4]. The plant’s strong adaptability might inhibit major crops from growing in some regions, and as such, P. oleracea is also considered a weed. However, the stems and leaves of the plant are edible, with a salty and sour taste. These parts of the plant are commonly used for salads or are cooked like spinach in many countries [2,5]. Additionally, the plant leaves and stems have long been used as traditional medicines for diuretic, febrifuge, antispasmodic, antiseptic and vermifuge purposes [6]. In particular, recent studies have demonstrated the nutritional and pharmaceutical importance of P. oleracea. Chemical constituents such as omega-3-fatty acids, vitamins and β-carotene are present at high concentrations in this plant [4,7]. Flavonoids, coumarins, monoterpene glycosides and alkaloids have also been observed [6]. The extensive pharmacological activities of these compounds, including analgesic, skeletal muscle-relaxing, anti-ulcerogenic, anti-hypoxic, anti-aging, anti-inflammatory and anti-oxidative activities, have been previously studied [1,8,9,10].
Interleukin-6 (IL-6) is an inflammatory cytokine. The levels of IL-6 are increased in several pathological conditions of inflammation and other diseases such as carcinomatous cachexia, multiple myeloma, rheumarthritis and hypercalcemia [11,12,13,14]. IL-6 activates signal transducer and activator of transcription 3 (STAT3), leading to an increase of various inflammatory factors such as tumor necrosis factor alpha (TNF-α), transforming growth factor beta 1 (TGF-β1), and interleukin-1 beta (IL-1β) [15]. Increased levels of inflammatory factors have been reported to promote human inflammatory diseases [16]. Therefore, many studies have aimed to identify candidate treatments inhibiting the activation of IL-6 or STAT3.
In our search for inhibitors of IL-6/STAT3 from edible plants, the 95% EtOH extract of the entire P. oleracea plant showed inhibitory activity on IL-6-induced STAT3 activation in Hep3B cells. Ten feruloyl amides 110 were next purified from the P. oleracea 95% EtOH extract (Figure 1A), and their chemical structures were identified by the corresponding spectroscopic data. Herein, we describe the isolation and structural determination of these feruloyl amides, their conversion rates upon UV light exposure and their inhibitory effects on IL-6-induced STAT3 activation in Hep3B cells.

2. Results and Discussion

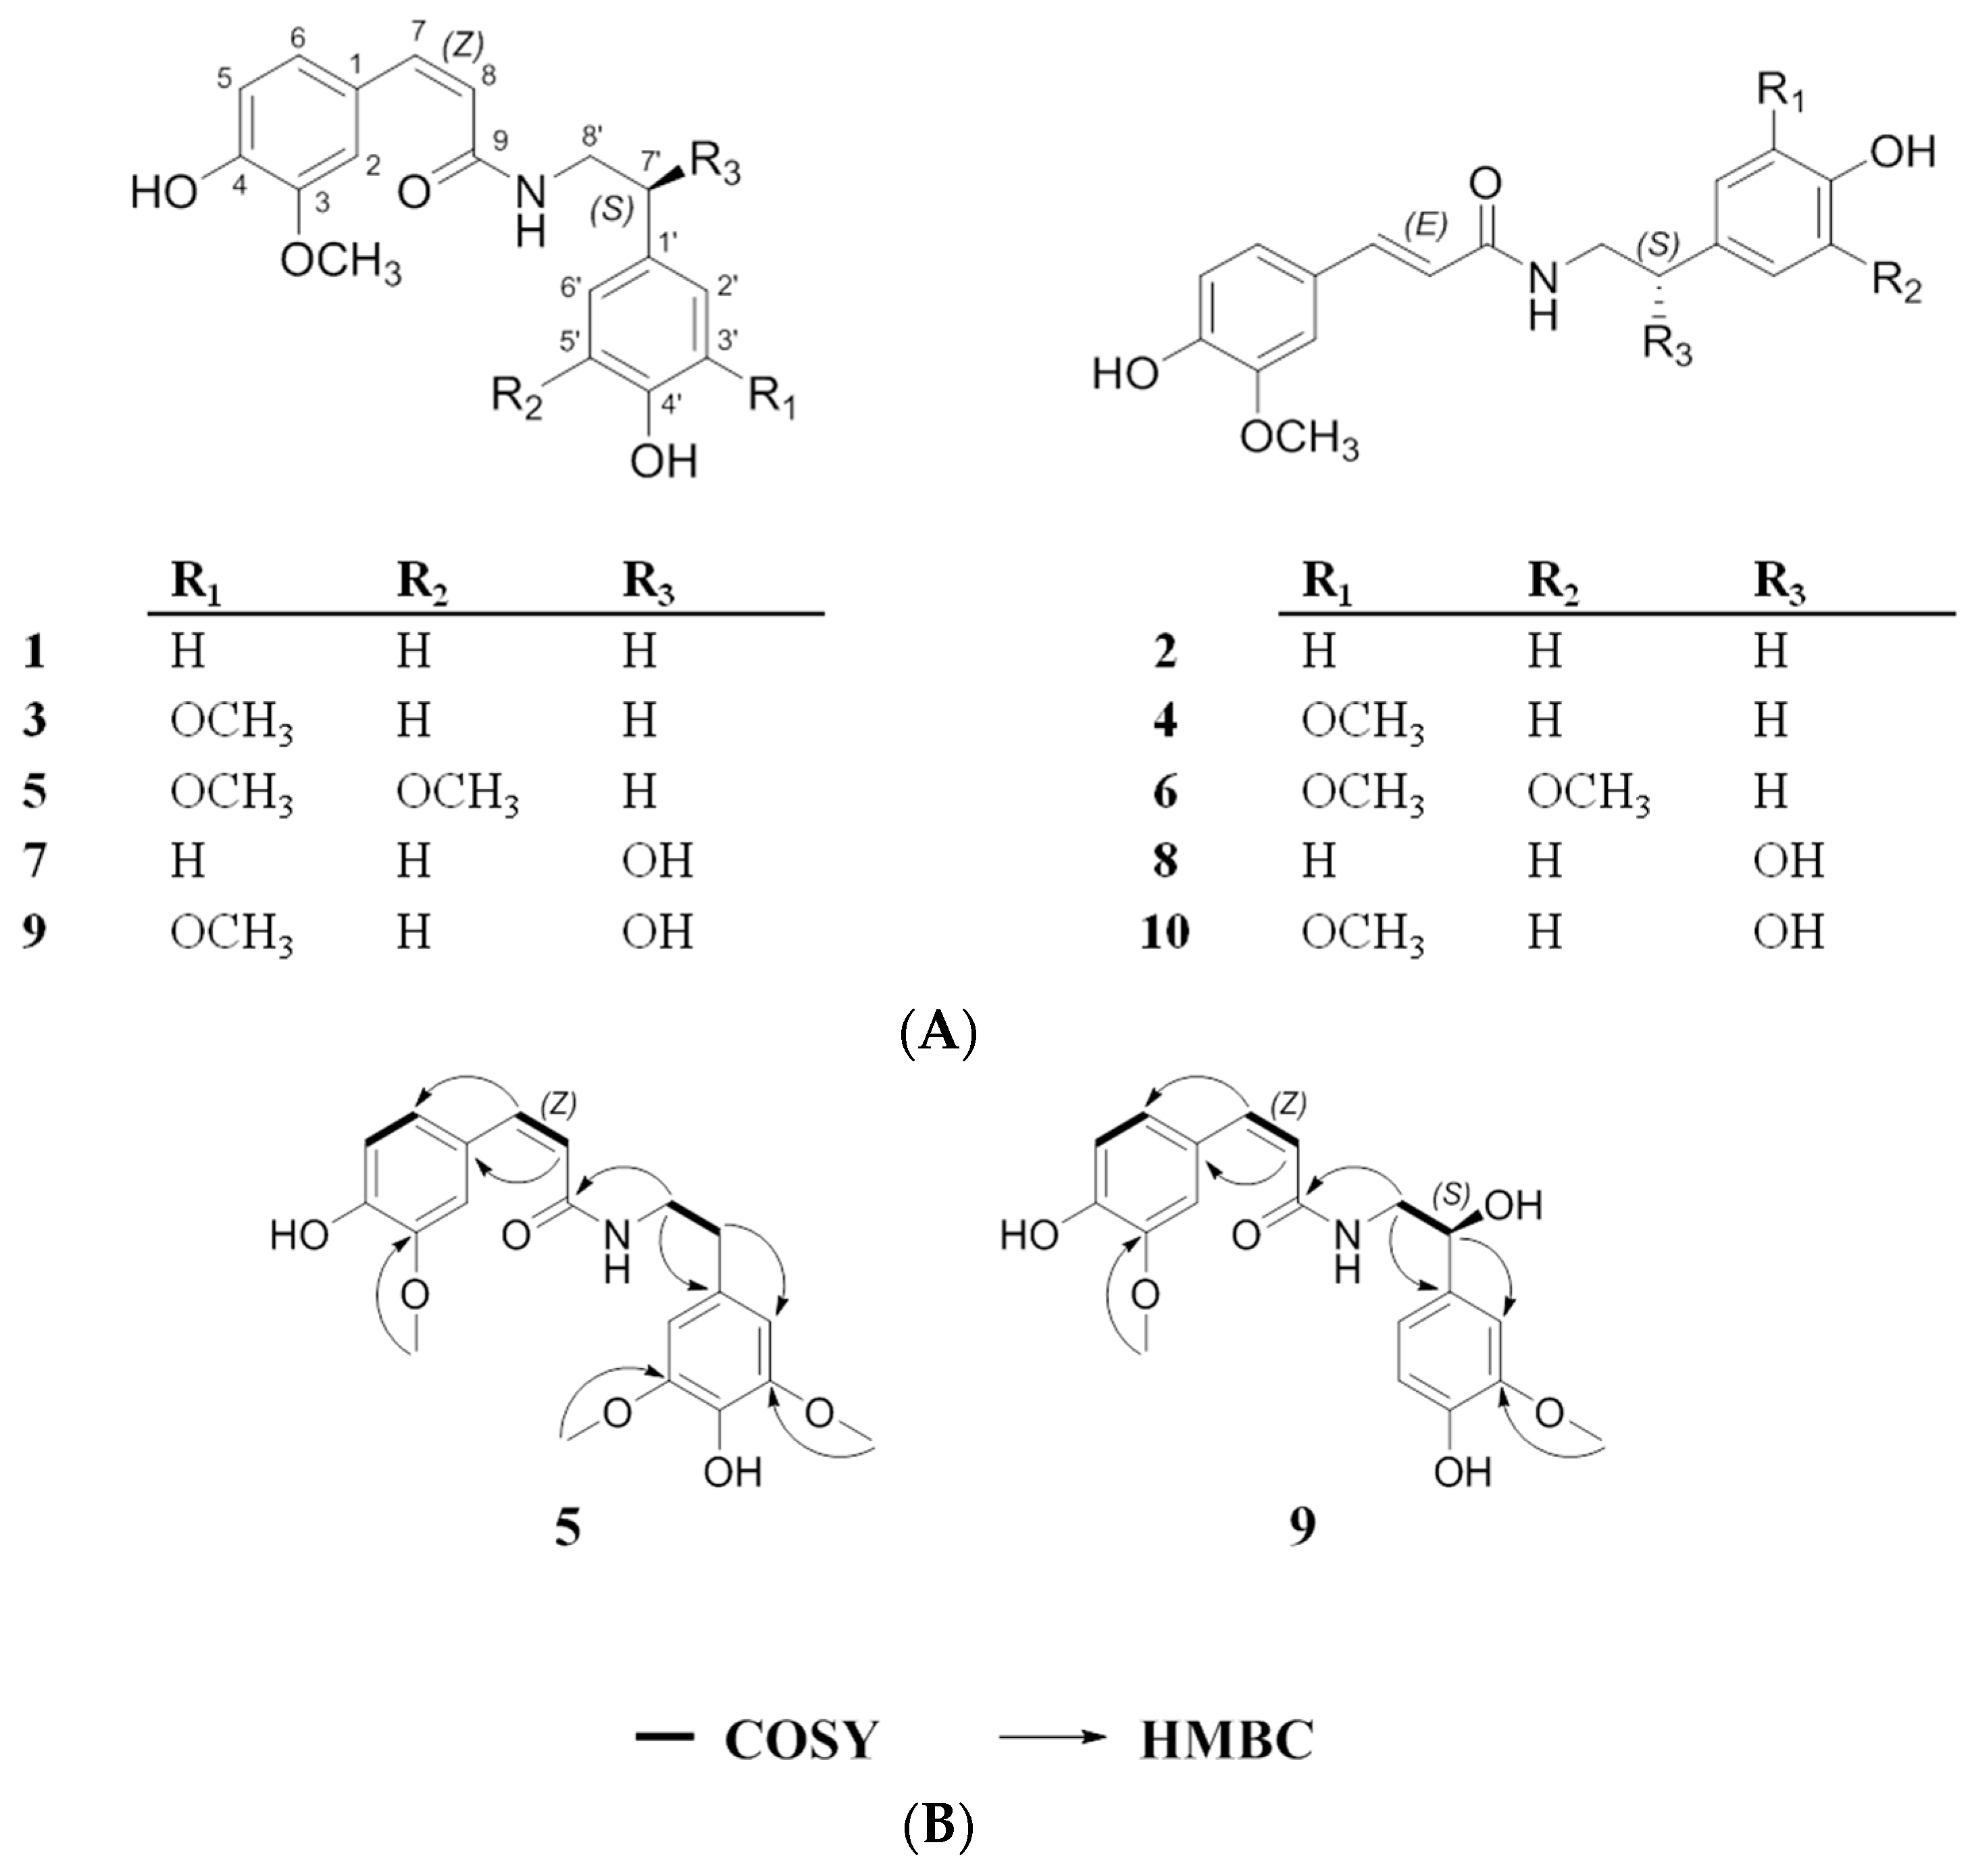
2.1. Structural Elucidation of the Isolated Compounds
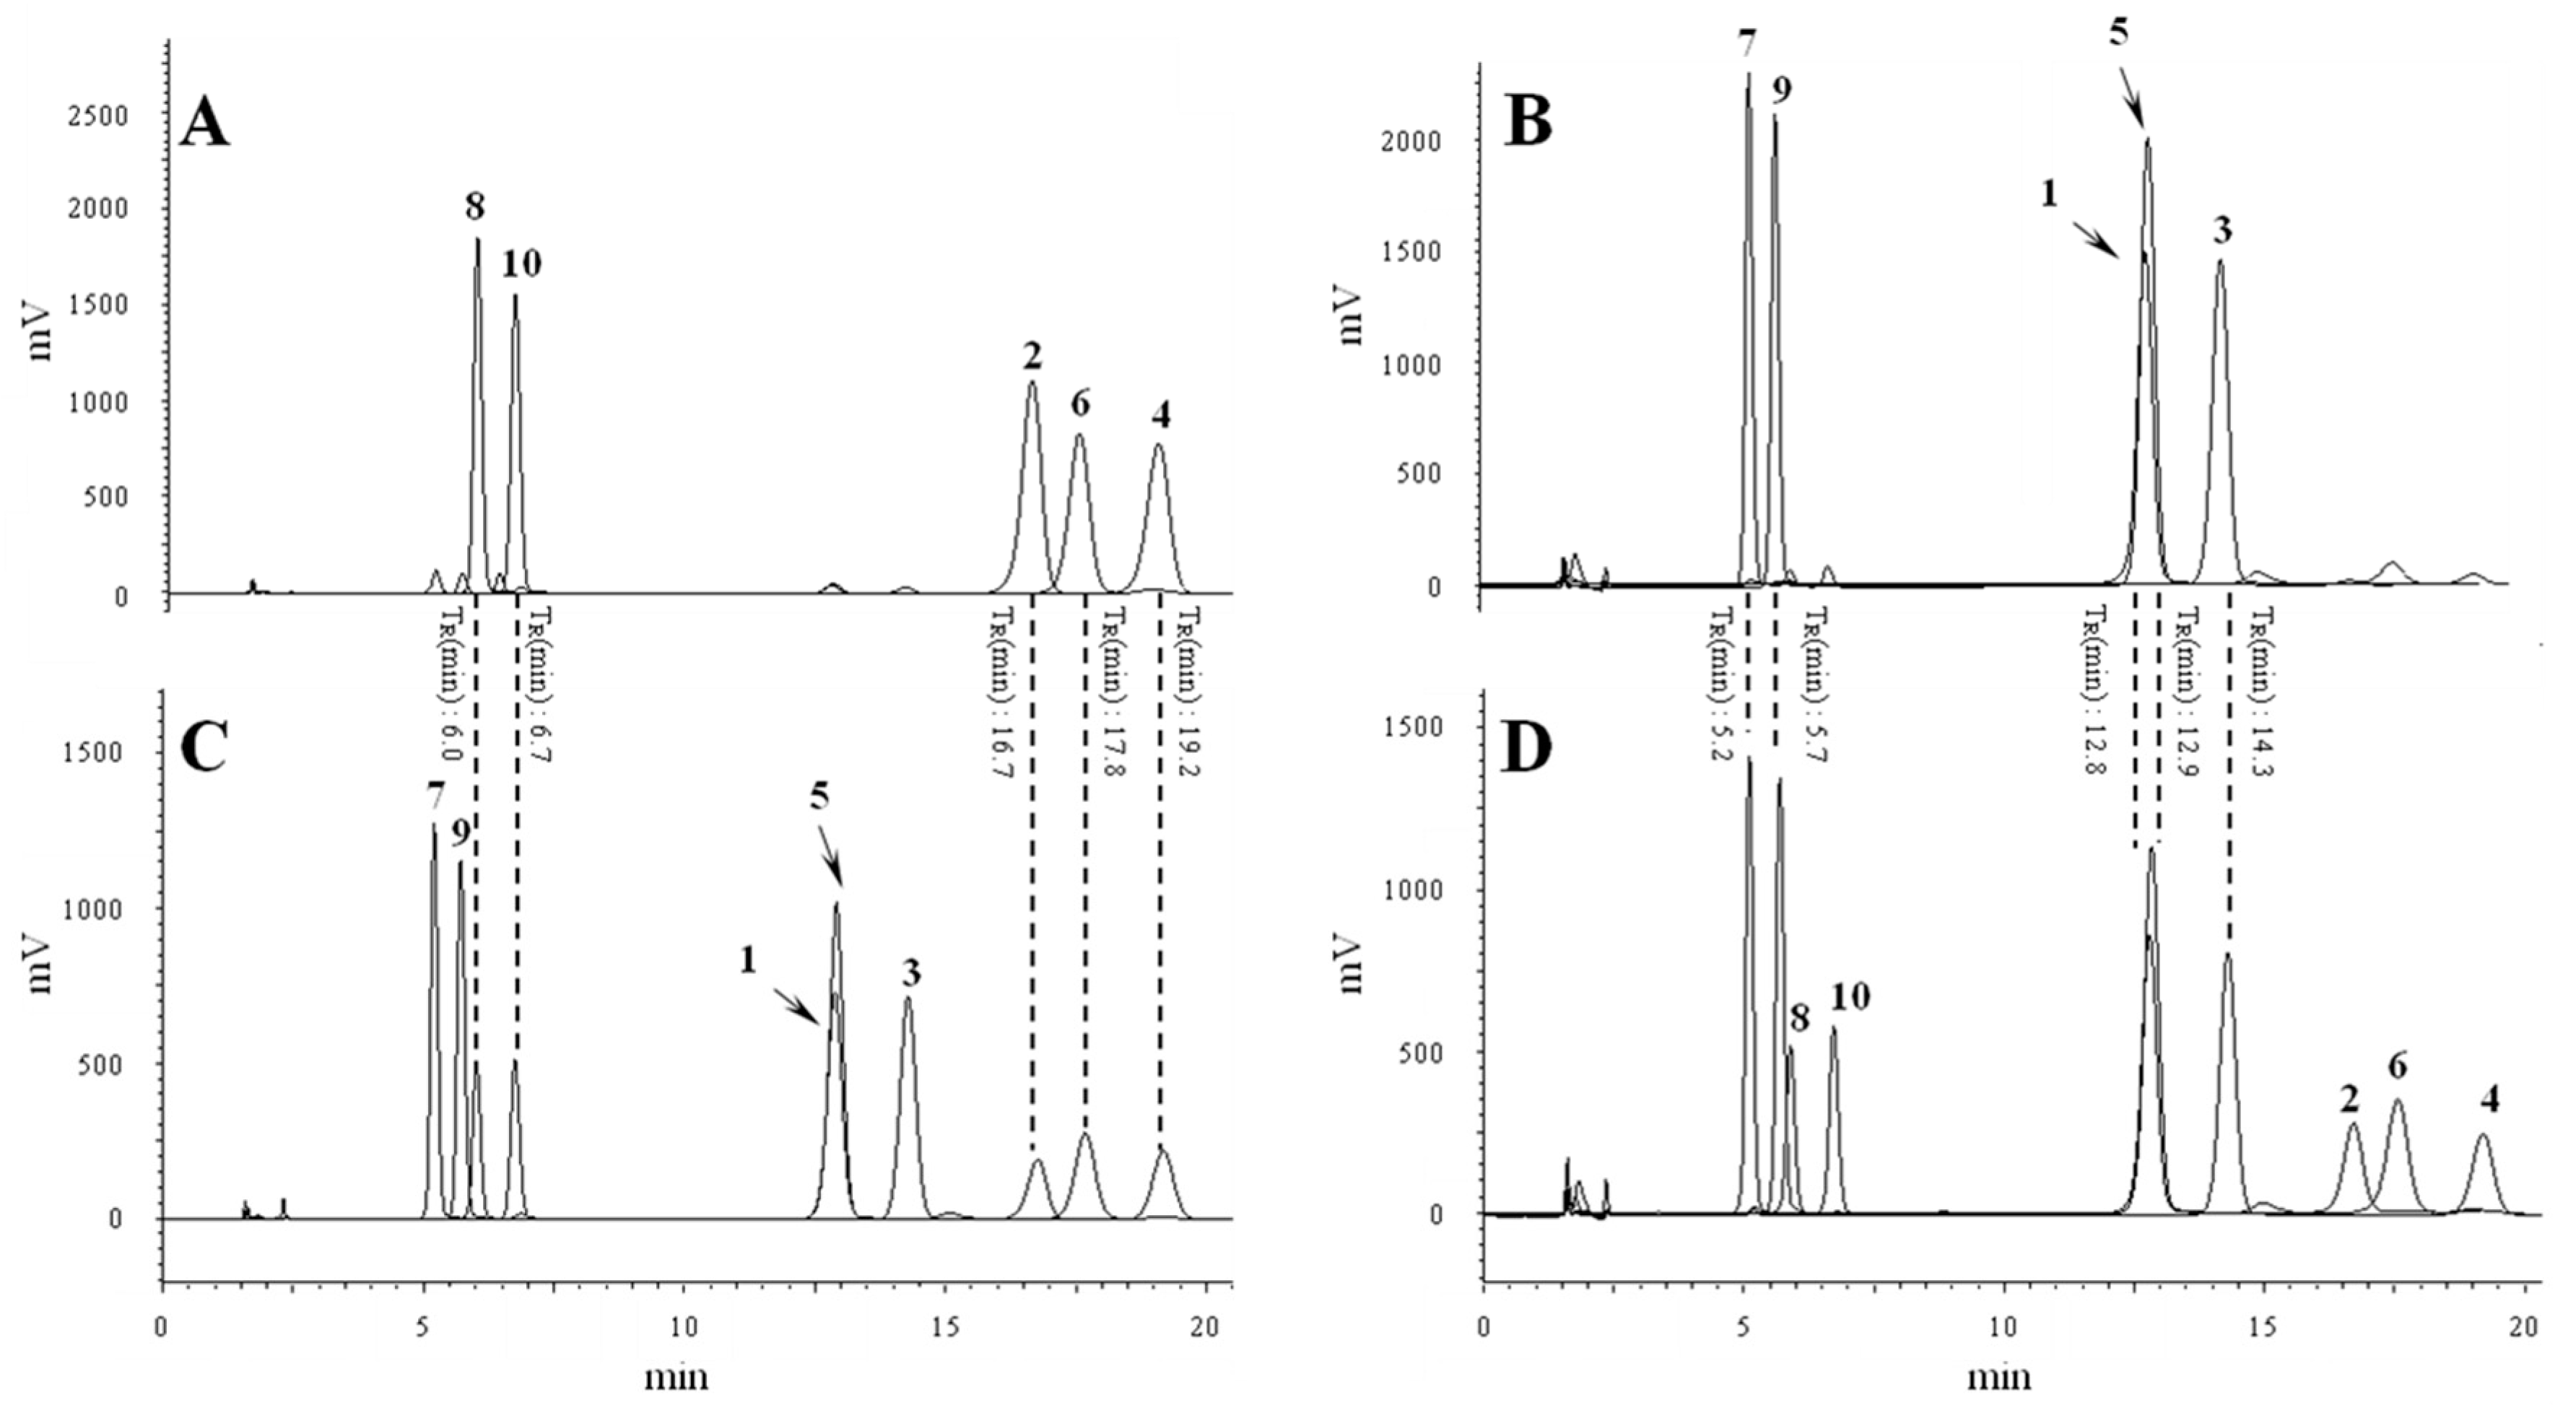
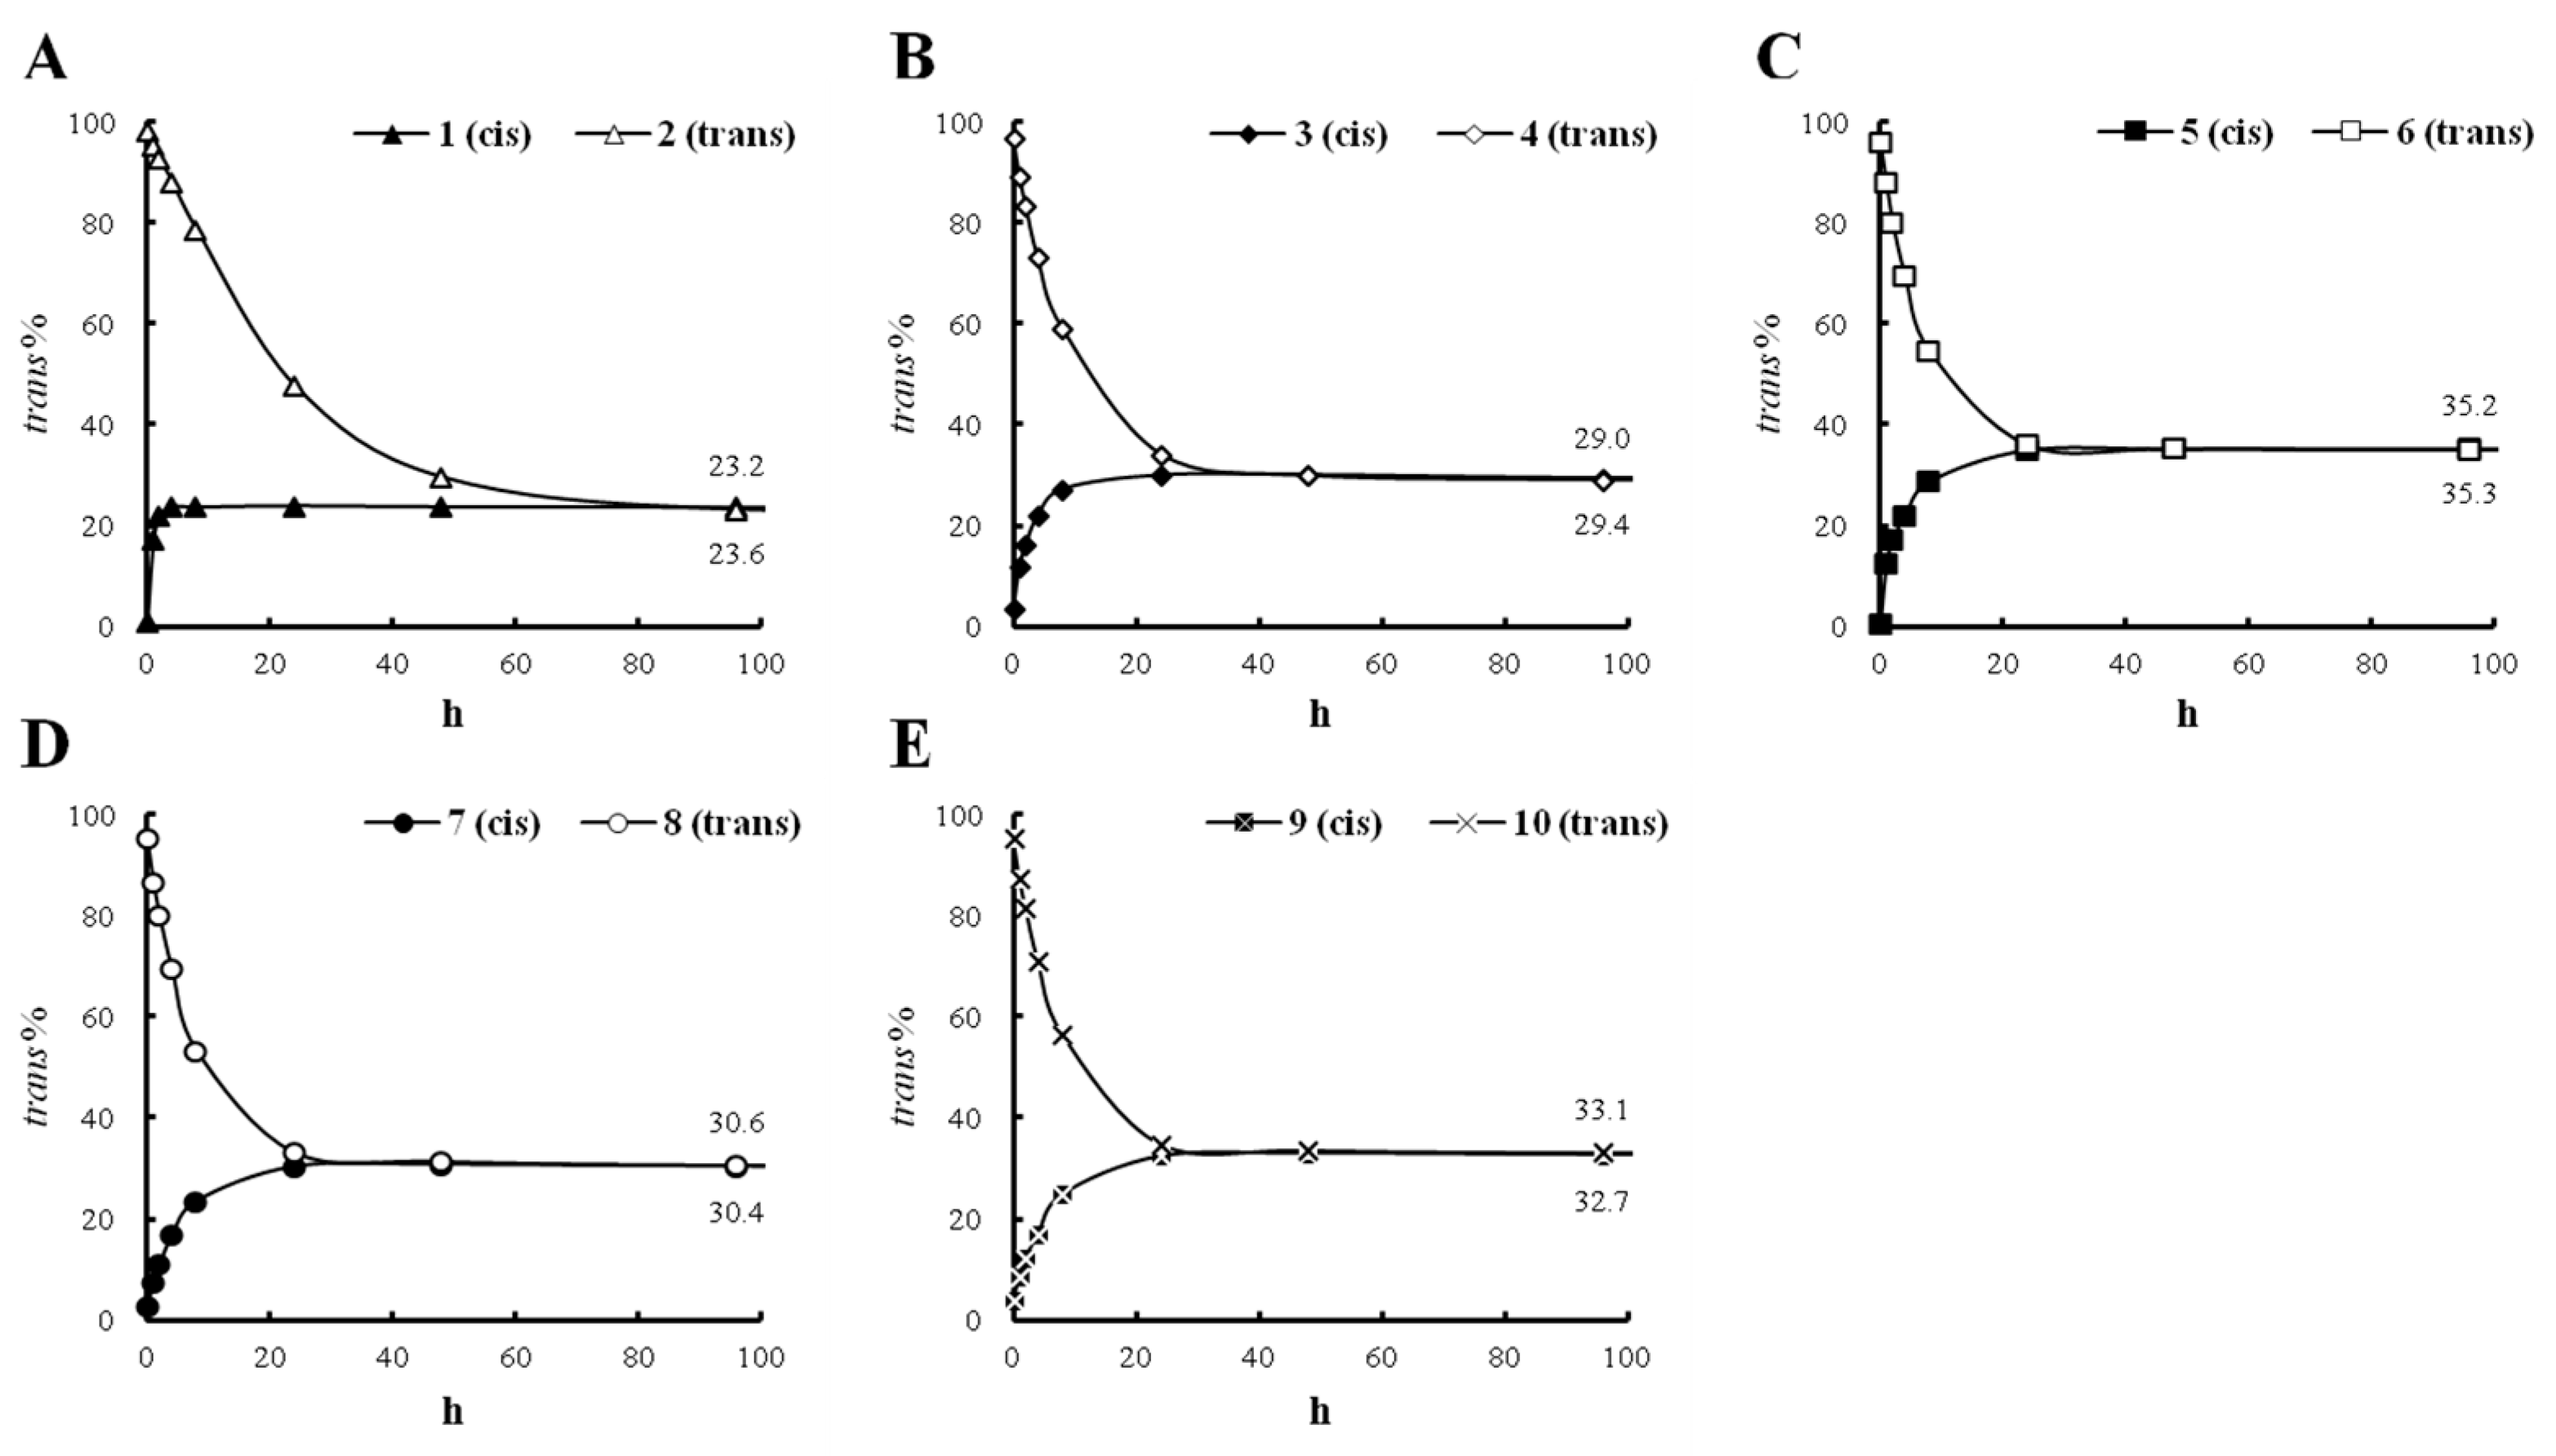
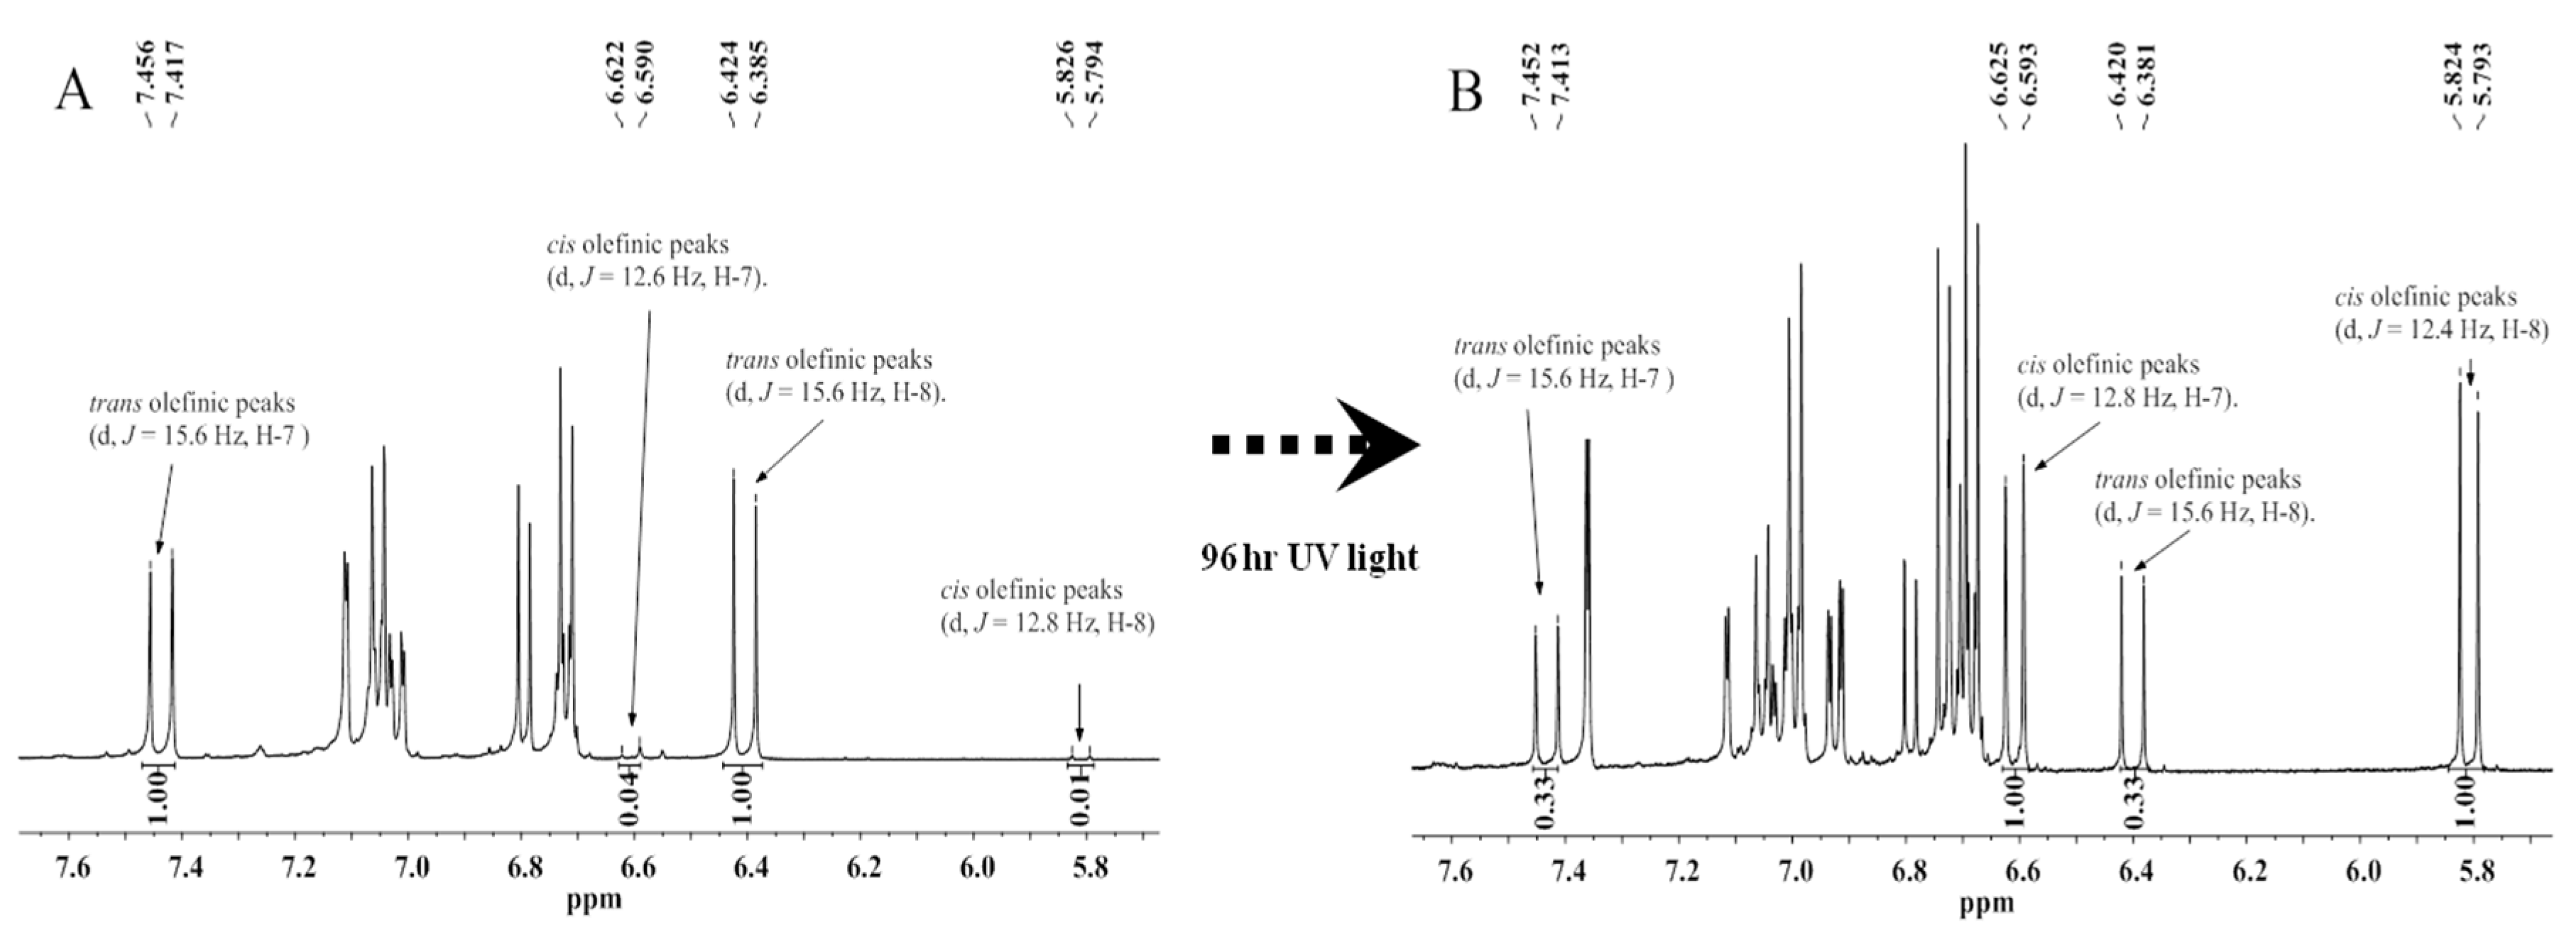
The EtOH extract from P. oleracea inhibited STAT3 reporter gene activation by IL-6 in Hep3B cells (60 μg/mL: 101.1% ± 0.4%, 30 μg/mL: 91.0% ± 0.3% and 10 μg/mL: 33.1% ± 1.2% inhibition in triplicate experiments). The following ten cis and trans-feruloyl amide isomers were isolated from the EtOH extract: N-cis-feruloyltyramine (1), N-trans-feruloyltyramine (2), N-cis-feruloyl-3′-methoxy-tyramine (3), N-trans-feruloyl-3′-methoxytyramine (4) N-cis-hibiscusamide (5), N-trans-hibiscus-amide (6), (7′S)-N-cis-feruloyloctopamine (7), (7′S)-N-trans-feruloyloctopamine (8), (7′S)-N-cis-feruloylnormetanephrine (9) and (7′S)-N-trans-feruloylnormetanephrine (10). The structures of 1, 2, 3, 4, 7, 8 and 10 were determined from ESI-MS, 1H- and 13C-NMR data and through comparisons with the literature [17,18,19,20,21,22,23,24,25].
Compound 5 was isolated as a dark brown oil. A molecular formula of C20H23NO6 was determined based on its HRESI-MS spectrum, which showed a quasi-molecular ion peak at m/z 396.1418 [M + Na]+. The UV spectrum displayed absorption peaks at 201, 223 and 314 nm. The IR spectrum suggested the presence in the molecule of OH and NH groups, as indicated by a band at 3332 (br) cm−1 and an amide carbonyl group band at 1650 cm−1. The obtained 13C-NMR data clearly revealed 20 resonance signals, which were classified as three methoxy, two methylene, seven methine, and eight quaternary carbons (Table 1). The 1H-NMR spectrum exhibited signals for two olefinic protons at δH 6.57 (1H, d, J = 13.2 Hz, H-7) and 5.78 (1H, d, J = 13.2 Hz, H-8); ABX aromatic protons at δH 7.34 (1H, d, J = 2.0 Hz, H-2), 6.90 (1H, dd, J = 8.0, 2.0 Hz, H-6), and 6.69 (1H, d, J = 8.0 Hz, H-5); meta-coupled aromatic protons at δH 6.45 (2H, s, H-2′ and H-6′); two methylene protons at δH 2.70 (2H, t, J = 7.2 Hz, H-7′) and 3.42 (2H, t, J = 7.6 Hz, H-8′); and three methoxy groups at δH 3.75 (6H, s, H-3-OCH3 and H-3′-OCH3), and 3.79 (3H, s, H-5′-OCH3). These proton and carbon assignments were further confirmed by detailed analyses of the 1H-1H COSY, HMQC and HMBC spectra (Figure 1B). In the 1H-1H COSY spectrum, a spin-spin coupling partner sequence of H-5/H-6, H-7/H-8 and H-7′/H-8′ was observed. Furthermore, the HMBC experiment showed the following correlations: H-2/C-4, H-7/C-6, H-8/C-1, H-8′/C-1′ and C-9, H-7′/C-2′, H-2′/C-4′, H-3-OCH3/C-3, H-3′-OCH3/C-3′, and H-5′-OCH3/C-5′. Except for the additional methoxy group at H-5′ of 5, its NMR signals were very similar to those of 3, which was previously reported in a cis-conformation. When the two olefinic protons of 3 at δH 6.59 (1H, d, J = 12.4 Hz, H-7) and 5.80 (1H, d, J = 12.8 Hz, H-8) were compared with those of 5 at δH 6.57 (1H, d, J = 13.2 Hz, H-7) and 5.78 (1H, d, J = 13.2 Hz, H-8), the cis conformation was evident. Additionally, when comparing 5 with 6, which is a previously reported feruloyl amide that is a trans-isomer of hibiscusamide, the NMR signals for 5 were similar to those of 6 except for two olefinic protons in trans-geometry δH 7.41 (1H, d, J = 15.6 Hz, H-7), and 6.39 (1H, d, J = 15.6 Hz, H-8). This result indicates that 5 and 6 are cis and trans-isomers. Accordingly, compound 5 was determined to be N-cis-hibiscusamide. To the best of the authors’ knowledge, this is the first time a cis-isomer has been reported from this plant.
Compound 9 was collected as a yellowish oil and has a molecular formula of C19H21NO6 as deduced from the molecular peak at m/z 382.1257 [M + Na]+ in the HRESI-MS spectrum. The UV spectrum revealed bands at 221, 283 and 314 nm. The OH and NH groups in the molecule were observed at 3320 (br) cm−1, and an amide carbonyl group was seen at 1651 cm−1 in the IR spectrum. The 1H and 13C-NMR spectra of 9 were similar to those of 3, except for the presence of a hydroxyl group at H-7′. In the 13C-NMR spectrum of 9, the presence of 19 resonance signals were classified as two methoxy, one methylene, nine methine, and seven quaternary carbons. The 1H-NMR spectrum revealed two olefinic protons at δH 6.59 (1H, d, J = 12.6 Hz, H-7) and 5.79 (1H, d, J = 12.6 Hz, H-8); ABX aromatic protons from the ferulic moiety at δH 7.38 (1H, d, J = 1.8 Hz, H-2), 6.91 (1H, dd, J = 8.4 Hz, 1.8 Hz, H-6), and 6.72 (1H, d, J = 8.4 Hz, H-5); ABX aromatic protons from the normetanephrine moiety at δH 6.93 (1H, d, J = 1.8 Hz, H-2′), 6.76 (1H, dd, J = 8.4 Hz, 1.8 Hz, H-6′), and 6.69 (1H, d, J = 8.4 Hz, H-5′); methylene protons at 3.39 (1H, dd, J = 13.8 Hz, 5.4 Hz, H-8′ α) and δH 3.46 (1H, dd, J = 13.2 Hz, 7.8 Hz, H-8′ β); a methine proton at 4.66 (1H, dd, J = 7.8 Hz, 4.8 Hz, H-7′); and two methoxy groups at δH 3.79 (3H, s, H-3-OCH3) and 3.80 (3H, s, H-3′-OCH3). The 1H and 13C resonances of 9 were assigned with a combination of 1H-1H COSY, HMQC and HMBC experiments (Figure 1B). The J values of the olefinic hydrogens of 3 were reported as 12.4 Hz (H-7) and 12.8 Hz (H-8), respectively. The configuration of olefinic hydrogens was confirmed as the cis-conformation. The J values of H-7 and H-8 of 9 were calculated to be 12.6 Hz and 12.6 Hz compared to those of 3, respectively. Thus, compound 9 was identified as the cis-isomer of N-feruloylnormetanephrine. The configuration of C-7′ was determined based on a comparison of optical rotations and J-coupling constants with reported data for 8 [24]. The optical rotation values of 8 and 9 were measured as [ α ] D 20 : −8.2 (c 0.10 CH3OH) for 8 and [ α ] D 20 : −7.8 (c 0.10 CH3OH) for 9. The J-coupling constants of H-7′ of 8 and 9 were calculated as J = 7.8 Hz, 4.8 Hz for 8 and J = 7.8 Hz, 4.8 Hz for 9. The reported data for 8 [24] included similar optical rotation values, [ α ] D 20 : −3.0 (c 0.12 CH3OH), and J-coupling constants of C-7′, J = 7.8 Hz, 4.9 Hz, suggesting that the relative configuration at C-7′ was estimated as an S-configuration. Thus, compound 9 was determined to be (7′S)-N-cis-feruloylnormetanephrine and is the first reported extraction of this compound from this plant.

2.2. Conversion Study of Compounds 110

In the NMR spectra analysis of the trans-feruloyl amide, we identified minor peaks that implied the simultaneous presence of small amounts of the cis-isomers. These data and a previous phytochemical study on P. oleracea led us to consider that the isolated feruloyl amide isomer could be isomerized upon UV light exposure [18,25]. Conversion studies of other compounds with geometric isomers, such as resveratrol [26] and retinal [27], under light exposure have been performed, but the structural isomerization of feruloyl amide from P. oleracea has not been evaluated previously. Therefore, we selected the compounds isolated as cis and trans-isomers and performed conversions under UV light. The isolated cis and trans-compounds were verified with purities of ≥95% by HPLC. The verified pure compounds were dissolved in MeOH to a concentration of 1 mg/mL and were exposed to UV light at λ = 254 nm for 1, 2, 4, 8, 24, 48 or 96 h. The conversion rates, according to the UV light exposure time, were analyzed by HPLC (Figure 2A,B).
Compound 2, which was isolated as a trans-isomer, has a methoxy group at the tyramine moiety (Figure 1A). The conversion rates of 2, which were calculated based on the peak area% of the trans-isomer in the HPLC chromatograms, showed dramatic changes from 0 h to 24 h: 98.3% at 0 h, 92.6% at 2 h, 78.6% at 8 h, and 47.7% at 24 h (Figure 3A). The data after 24 h (29.6% at 48 h and 23.2% at 96 h) indicated that the conversion rates of the trans-isomer rapidly decreased after 48 h and stabilized at 96 h (Figure 3A).
Additionally, to confirm the conversion of the cis and trans-structures of 2 under UV light, the treatment samples at 0 h and 96 h exposure times were analyzed by 1H-NMR (Figure 4A,B). The ratio of the integration values of the two olefinic proton peaks implied that the cisH 6.61 (d, J = 12.6 Hz, H-7), 5.81 (d, J = 12.8 Hz, H-8)) and transH 7.44 (d, J = 15.6 Hz, H-7), 6.40 (d, J = 15.6 Hz, H-8)) isomers in the 1H-NMR spectrum of compound 2 were converted in a trans/cis proportion = 0.33/1. Under the same conditions, compound 4 (Figure 1A), which has two methoxy groups at the tyramine moiety, showed a more rapid trans-conversion rate than 2: 96.8% at 0 h, 83.4% at 2 h, 58.9% at 8 h, and 34.1% at 24 h (Figure 3B). From 48 h to 96 h, the conversion rate declined. At 96 h, the mixture had equilibrated at a ratio of 29.0% trans- and 71.0% cis-isomer (Table S1 in the Supplementary Materials). Compared with 2, we confirmed that the stabilized trans-conversion ratio was 5.8% higher (Figure 3B). In the case of compound 6 (Figure 1A), which has three methoxy groups at the tyramine moiety, the trans-conversion rates showed similar changes to those of 4: 95.8% at 0 h, 80.1% at 2 h, 54.6% at 8 h, and 36.1% at 24 h (Figure 3C and Table S1). The conversion rates decreased from 48 h to 96 h. By 96 h, the equilibrium compositions were stabilized with 34.2% of trans- and 65.8% of the cis-isomer. Compound 6 showed 5.2% and 11.0% higher equilibrium compositions than 4 and 2, respectively (Figure 3C). From these data, we confirmed that the conversion rate and equilibrium ratio of feruloyl amides are dependent on the number of methoxy groups attached to the tyramine moiety.
The data for compound 8 showed a dissimilar trend from that of 2, which has a methoxy group. In addition to a methoxy group at the tyramine moiety, compound 8 has a hydroxyl group at the 7′ proton (Figure 1A). The trans-conversion rate of 8 was 33.1% at 24 h and stabilized at 30.6% at 96 h. Thus, the conversion rate of 8 was greater and the equilibrium composition was 7.4% higher than that of 2 (Figure 3D). Compound 10 has one more methoxy group at the 5′ position than 8 (Figure 1A). By 24 h, compound 10 showed similar conversion rates as 8. However, the final equilibrium composition was 2.5% higher than 8 (Figure 3E). Based on these findings, similar to methoxy groups, 7′-hydroxyl group in feruloyl amides might also be a factor in determining conversion and stabilization rates.
The same experiments for the cis-isomers, 1 (99.1%), 3 (96.6%), 5 (95.0%), 7 (97.1%) and 9 (96.0%) of cis, were conducted as those for the trans-isomers. The conversion rates for compound 1 were high, 23.8% at 4 h, and subsequently stabilized (Figure 3A). The other cis-compounds, 3 (Figure 3B), 5 (Figure 3C), 7 (Figure 3D) and 9 (Figure 3E), showed conversion rates of 30.0%, 35.0%, 30.3% and 32.3% at 24 h, respectively. Subsequently, after 24 h, these values stabilized. The final equilibrium compositions of the cis-compounds were similar to those of the trans-compounds: 1 (cis):2 (trans) = trans 23.6%:23.2%, 3 (cis):4 (trans) = trans 29.4%:29.0%, 5 (cis):6 (trans) = trans 35.3%:34.2%, 7 (cis):8 (trans) = trans 30.4%:30.6% and 9 (cis):10 (trans) = trans 32.7%:33.1% (Table S1). These data demonstrate that all feruloyl amide cis and trans-isomers have specific equilibrium ratios which are different from trans/cis = 23.2%/76.8% to 35.0%/65.0%, depending on the number of methoxy groups and the existence of 7′-hydroxyl group.
In most cases, it is known that trans-form geometric isomers are more stable. However, in our conversion study, the cis-isomers were found more stable than the trans-isomers in the mixtures after equilibration under UV light (254 nm). We found similar cases in photoisomerization studies of isomers that have structures related to feruloyl amides. For example, dicaffeoylquinic acids, except 1,3-dicaffeoylquinic acid, were converted to cis-forms as major isomers under UV-light (254 nm) after 30 min [28]. Meanwhile, in the case of resveratrol, trans-resveratrol was converted to 90.6% cis-resveratrol under 366 nm. However, 50% of cis-resveratrol was converted in trans-form at certain condition (at pH 1.0 after 22.8 h under the 366 nm) [26]. Therefore, there is a possibility that stabilized feruloyl amides can be converted in to another equilibrium composition under certain conditions. Thus, we consider more studies necessary to investigate the behavior of feruloyl amides and their conversion at various wavelength, pH values and temperature.
The isolated isomers did not exhibit any observable changes after the long-term, three-month stability tests in the dark at room temperature. Further stability experiments using different storage conditions were considered.

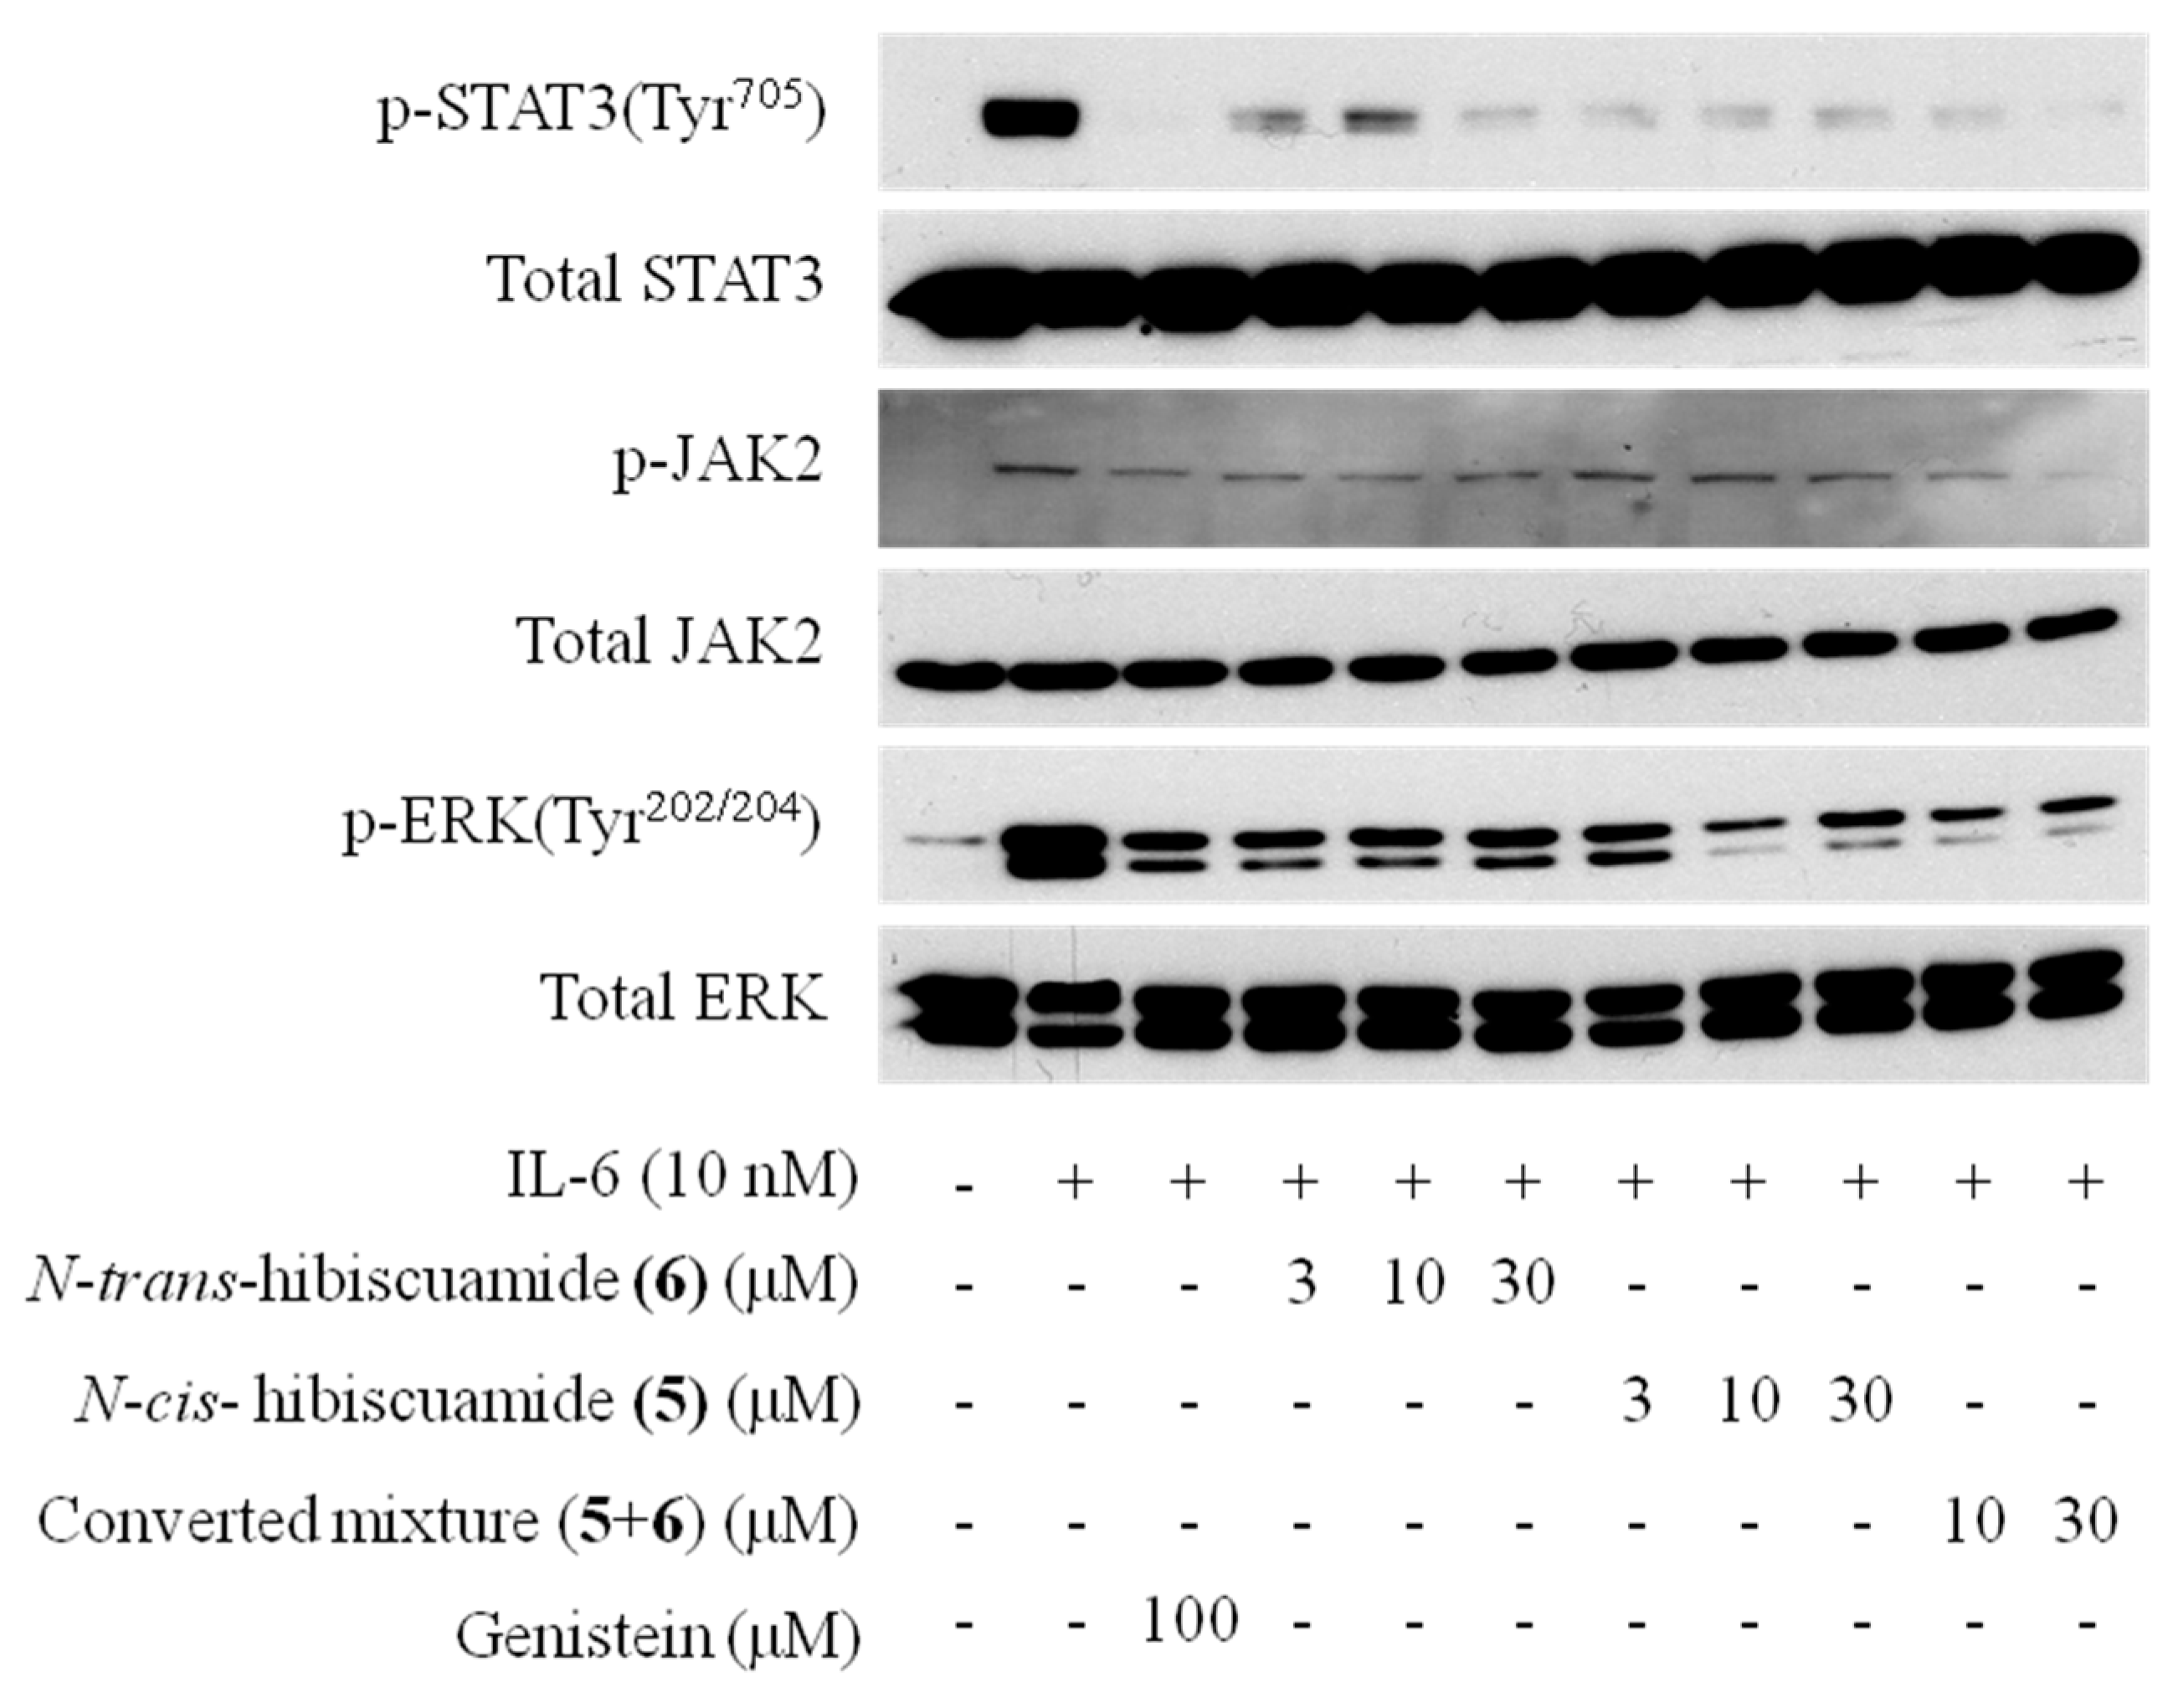
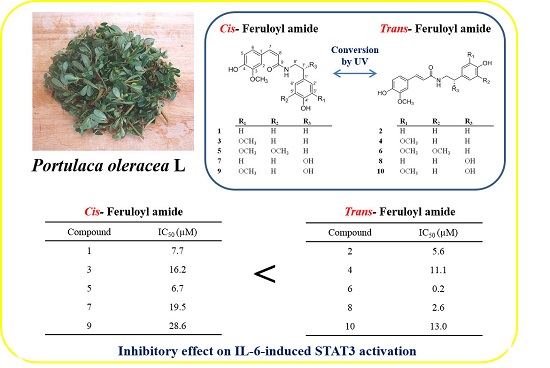
2.3. Activity of Isolated Compounds

The inhibitory activity of the ten compounds 110 against IL-6-induced STAT3 activation in Hep3B cells was evaluated using oleanolic acid acetate [29] as a positive control (IC50 value: 0.7 μM). An MTT assay was performed to assess cell cytotoxicity and confirm that the effects at the tested concentrations were not due to cytotoxicity (data not shown). All isolated compounds exhibited inhibitory effects, with IC50 values of 19.3 (1), 5.6 (2), 16.2 (3), 6.0 (4), 6.7 (5), 0.2 (6), 19.5 (7), 2.6 (8), 28.6 (9) and 13.0 (10) μM. The IL-6/STAT3 inhibitory activities of the trans- feruloyl amides were more potent than those of the cis-isomers, indicating that the trans-double bond at C-7′ enhanced the inhibitory activity (Table 2). The conversion mixtures of compounds (110) also exhibited inhibitory activities, with IC50 values of 15.2 (1 + 2), 6.5 (3 + 4), 5.9 (5 + 6), 6.7 (7 + 8) and 13.7 (9 + 10). IC50 values of conversion mixtures were in the range of IC50 values of their pure cis and trans-isomers (Table 2). We expected that the IC50 values of all mixtures should be close to those of cis-feruloyl amides. However, except for (1 + 2) and (5 + 6), the IC50 values of the rest mixtures were close to those of trans-feruloyl amides. Therefore, to verify the activities of converted mixtures more clearly, it seems that more experiments investigating the various cis/trans ratios are needed. In addition, we investigated whether compounds 5 and 6 and their converted mixture (5 + 6), which exhibited the greatest inhibitory activities, had inhibitory effects on the tyrosine phosphorylation of STAT3 induced by IL-6 in Hep3B cells. As shown in Figure 5, treatment of Hep3B cells with compounds 5 and 6 for 20 min at 3, 10 and 30 µM resulted in inhibition of the phosphorylation of p-STAT3. The phosphorylation of p-JAK2, the upstream molecule in the IL-6/STAT3 signaling pathway, was also inhibited, as was phosphorylation of p-ERK, another downstream signaling molecule involved in the IL-6 signaling pathway.

3. Materials and Methods

3.1. Plant Material

Dried P. oleracea L. (15 kg) was purchased at the Kyung-dong Market in Seoul, Korea in May 2013. One of the authors (M.-C. Rho) performed botanical identification, and a voucher specimen (KRIB-KR2013-003) has been deposited at the laboratory of the Natural Product Research Center, Jeonbuk Branch of the Korea Research Institute of Bioscience and Biotechnology.

3.2. General Procedure

The structures of the isolated compounds were identified by spectroscopy using 1H-NMR, 13C-NMR, 1H-1H COSY, HMBC, HMQC, ESI-MS, HRESI-MS, IR, spectrophotometry and polarimetry. 1H, 13C and 2D NMR spectra were recorded on a JNM-EX400 (Jeol, Tokyo, Japan) and JNM-ECA600 (Jeol) instruments using TMS as references. MS data were obtained with a Jeol JMS-700 and Bruker- maXis 4G (Bruker-Daltonics, Bremen, Germany) mass spectrometers in positive and negative-ion modes. IR spectra were measured on Nicolet 6700 FT-IR (Thermo Scientific, Waltham, MA, USA) and Spectrum GX (Perkin Elmer, Boston, MA, USA) spectrometers. UV spectra were recorded on a Spectramax M2e (Molecular Devices, Sunnyvale, CA, USA) spectrophotometer. Optical rotations were measured on a P-2000 polarimeter (Jasco, Tokyo, Japan). The HPLC analyses were performed using a Shimadzu (Tokyo, Japan) HPLC system equipped with a quaternary pump (LC-20AD), an auto-sampler (SIL-20A), a UV-detector (SPD-20A) and a column oven (CTO-20A). To isolate and purify compounds, a Hitachi (Tokyo, Japan) semi-preparative HPLC system with a UV-detector (L-2400) and a quaternary pump (L-2130) was used.

3.3. Isolation and Purification Procedures

P. oleracea (12 kg) dry powder was extracted three times with 95% EtOH (3 × 36 L) at room temperature, and the EtOH solution was evaporated under reduced pressure. The EtOH extract (612 g) was suspended in H2O and partitioned with ethyl acetate (3 × 4 L). The EtOAc fraction (381 g) was chromatographed on a silica gel column (50 cm × 10 cm, 200–400 mesh) and eluted with a hexane/ethyl acetate gradient (100:0–0:100, v/v) system to generate twelve fractions (fr.3-1–fr.3-12). Fractions 3-9 (12 g) were suspended in MeOH and partitioned with hexane. The MeOH soluble fraction 3-9-1 (8.6 g) was chromatographed on a C18 MPLC to generate fractions fr.3-9-1-1–fr.3-9-1-6) with a gradient solvent system containing H2O and MeOH (9:1–0:1). Fraction 3-9-1-2 (2.7 g) was re-chromatographed on a C18 MPLC to generate fractions fr.3-9-1-2-1–fr.3-9-1-2-7 with a gradient solvent system containing H2O and MeOH (9:1–1:1). Compounds 7 (8.1 mg), 8 (38.7 mg), 9 (4.2 mg) and 10 (28.3 mg) were purified from the fr.3-9-1-2-2 fraction (230 mg) by semi-preparative HPLC (Phenomenex Luna 5 μ C18, 150 mm × 21.20 mm i.d., MeCN: H2O = 20:80, flow rate 6 mL/min, UV 210 nm). Compounds 1 (8.0 mg), 2 (17.8 mg), 3 (4.3 mg), 4 (48.1 mg), 5 (3.8 mg), and 6 (26.2 mg) were purified from the fr.3-9-1-2-4 fraction (320 mg) by semi-preparative HPLC (Phenomenex Luna 5 μ C18, 150 mm × 21.20 mm i.d., MeCN:H2O = 19:81, flow rate 6 mL/min, UV 210 nm). The purity of each compound was verified as ≥95% by HPLC analysis (Figure 2A,B).
N-cis-Feruloyltyramine (1): Dark yellowish oil. ESI-MS ion peaks at m/z 314.1 [M + H]+ and 312.1 [M − H]. 1H-NMR (400 MHz, CD3OD): δH 7.35 (1H, s, H-2), 7.00 (2H, d, J = 8.4, H-2′ and H-6′), 6.93 (1H, d, J = 8.4, H-6), 6.74 (1H, d, J = 7.6, H-5), 6.69 (2H, d, J = 8.4, H-3′ and H-5′), 6.61 (1H, d, J = 12.4, H-7), 5.81 (1H, d, J = 12.4, H-8), 3.83 (3H, s, 3-OCH3), 3.40 (2H, t, J = 8.0, H-8′), 2.69 (2H, t, J = 8.0, H-7′). 13C-NMR (100 MHz, none of the instruments given have this field strength CD3OD): δC 157.2 (C-4′), 148.8 (C-4), 148.8 (C-3), 138.5 (C-7), 131.4 (C-1), 130.9 (C-2′ and C-6′), 128.8 (C-1′), 125.0 (C-6), 122.0 (C-8), 116.5 (C-3′ and C-5′), 116.1 (C-5), 114.2 (C-2), 56.6 (C-3-OCH3), 42.4 (C-8′), 35.7 (C-7′).
N-trans-Feruloyltyramine (2): Dark brown oil. ESI-MS ion peaks at m/z 314.1 [M + H]+ and 312.1 [M − H]+. 1H-NMR (400 MHz, CD3OD): δH 7.45 (1H, d, J = 15.6 Hz, H-7), 7.10 (1H, d, J = 1.6 Hz, H-2), 7.05 (2H, d, J = 8.4 Hz, H-2′ and H-6′), 7.01 (1H, dd, J = 8.4 Hz, 2.0 Hz, H-6), 6.80 (1H, d, J = 8.0 Hz, H-5), 6.72 (2H, d, J = 8.6 Hz, H-3′ and H-5′), 6.42 (1H, d, J = 15.6 Hz, H-8), 3.86 (3H, s, H-3′-OCH3), 3.47 (2H, t, J = 7.6 Hz, H-8′), 2.75 (2H, t, J = 7.6 Hz, H-7′). 13C-NMR (100 MHz, CD3OD): δC 157.1 (C-4′), 150.0 (C-4), 149.4 (C-3), 142.2 (C-7), 131.5 (C-1), 130.9 (C-2′ and C-6′), 128.5 (C-1′), 123.4 (C-6), 119.0 (C-8), 116.6 (C-5), 116.4 (C-3′ and C-5′), 111.7 (C-2), 56.5 (C-3-OCH3), 42.5 (C-8′), 35.8 (C-7′).
N-cis-Feruloyl-3′-methoxytyramine (3): Dark green oil. ESI-MS ion peaks at m/z 344.0 [M + H]+ and 342.2 [M − H]+. 1H-NMR (400 MHz, CD3OD): δH 7.35 (1H, d, J = 2.0 Hz, H-2), 6.91 (1H, dd, J = 8.0, 2.0 Hz, H-6), 6.75 (1H, d, J = 1.6 Hz, H-2′), 6.71 (1H, d, J = 8.0 Hz, H-5), 6.68 (1H, d, J = 8.0 Hz, H-5′), 6.59 (1H, d, J = 12.4 Hz, H-7), 6.59 (1H, dd, J = 8.0, 2.0 Hz, H-6′), 5.80 (1H, d, J = 12.8 Hz, H-8), 3.81 (3H, s, H-3-OCH3), 3.77 (3H, s, H-3′-OCH3), 3.41 (2H, t, J = 7.2 Hz, H-7′), 2.69 (2H, t, J = 7.8 Hz, H-8′). 13C-NMR (100 MHz, CD3OD): δC 149.2 (C-3), 148.9 (C-3′), 148.8 (C-4), 146.3 (C-4′), 138.6 (C-7), 132.2 (C-1), 128.8 (C-1′), 125.1 (C-6), 122.4 (C-6′), 121.9 (C-8), 116.4 (C-5), 116.1 (C-5′), 114.2 (C-2′), 113.6 (C-2), 56.5 (C-3-OCH3), 56.5 (C-3′-OCH3), 42.4 (C-8′), 36.1 (C-7′).
N-trans-Feruloyl-3′-methoxytyramine (4): Dark brown oil. ESI-MS ion peaks at m/z 344.0 [M + H]+ and 342.2 [M − H]+. 1H-NMR (400 MHz, CD3OD): δH 7.38 (1H, d, J = 15.6 Hz, H-7), 7.04 (1H, d, J = 1.6 Hz, H-2), 6.95 (1H, dd, J = 8.0 Hz, 1.6, H-6), 6.75 (1H, d, J = 2.0 Hz, H-2′), 6.73 (1H, d, J = 8.0 Hz, H-5), 6.66 (1H, d, J = 8.0 Hz, H-5′), 6.60 (1H, dd, J = 8.0 Hz, 2.0 Hz, H-6′), 6.36 (1H, d, J = 15.6 Hz, H-8), 3.80 (3H, s, H-3-OCH3), 3.75 (3H, s, H-3′-OCH3), 3.42 (2H, t, J = 7.2 Hz, H-8′), 2.70 (1H, t, J = 7.2 Hz, H-7′). 13C-NMR (100 MHz, CD3OD): δC 150.1 (C-4), 149.5 (C-3), 149.2 (C-3′), 146.2 (C-4′), 142.3 (C-7), 132.3 (C-1′), 128.5 (C-1), 123.4 (C-6), 122.5 (C-6′), 119.0 (C-8), 116.7 (C-5), 116.4 (C-5′), 113.7 (C-2), 111.7 (C-2′), 56.5 (C-3-OCH3), 56.5 (C-3′-OCH3), 42.6 (C-8′), 36.3 (C-7′).
N-cis-Hibiscusamide (5): Dark brown oil. [ α ] D 20 : −0.2 (c 0.10 CH3OH). HRESI-MS ion peak at m/z 396.1418 [M + Na]+ (calcd for C20H23NO6, 396.1418). UV (CH3OH) λmax (log ε): 201 (3.95), 223 (3.56) and 314 nm (3.33). IR (KBr) νmax: 3332 (br), 1650, 1580, 1517 and 1459 cm−1. 1H-NMR data in CD3OD (600 MHz) and 13C-NMR data CD3OD (150 MHz) are reported in (Table 1).
N-trans-Hibiscusamide (6): Dark brown oil. ESI-MS ion peaks at m/z 374.0 [M + H]+ and 372.2 [M − H]+. 1H-NMR data in CD3OD (600 MHz) and 13C-NMR data CD3OD (150 MHz) are reported in (Table 1).
(7′S)-N-cis-Feruloyloctopamine (7): Yellowish oil. [ α ] D 20 : −7.2 (c 0.10 CH3OH). ESI-MS ion peak at m/z 328.2 [M − H]+. 1H-NMR (600 MHz, CD3OD): δH 7.37 (1H, d, J = 1.8 Hz, H-5), 7.15 (2H, d, J = 8.4 Hz, H-2 and H-6′), 6.91 (1H, d, J = 8.4 Hz, H-6), 6.72 (2H, d, J = 8.4 Hz, H-3′ and H-5′), 6.70 (1H, d, J = 12.6 Hz, H-7), 6.59 (1H, d, J = 7.8 Hz, H-2), 5.79 (1H, d, J = 12.6 Hz, H-8), 4.65 (1H, dd, J = 7.8, 3.0 Hz, H-7′), 3.81 (3H, s, H-3-OCH3), 3.44 (1H, dd, J = 13.2 Hz, 4.6 Hz, H-8′β), 3.37 (1H, dd, J = 13.8 Hz, 7.8 Hz, H-8′α). 13C-NMR (150 MHz, CD3OD): δC 170.5 (C-9), 158.3 (C-4′), 149.6 (C-4), 148.8 (C-3), 139.1 (C-7), 134.5 (C-1), 128.4 (C-2′ and C-6′), 127.9 (C-1′), 125.2 (C-8), 120.9 (C-6), 116.2 (C-3′ and C-5′), 116.1 (C-5), 114.0 (C-2), 73.4 (C-7′), 56.4 (C-3-OCH3), 48.1 (C-8′).
(7′S)-N-trans-Feruloyloctopamine (8): Yellowish oil. [ α ] D 20 : −8.2 (c 0.10 CH3OH). ESI-MS ion peak at m/z 328.1 [M − H]+. 1H-NMR (600 MHz, CD3OD): δH 7.44 (1H, d, J = 15.6 Hz, H-7), 7.22 (2H, d, J = 8.4 Hz, H-2′ and H-6′), 7.11 (1H, d, J = 1.8 Hz, H-5), 7.01 (1H, dd, J = 8.4, 1.8 Hz, H-6), 6.79 (1H, d, J = 8.4 Hz, H-2), 6.77 (2H, d, J = 8.4 Hz, H-3′ and H-5′), 6.46 (1H, d, J = 15.6 Hz, H-8), 4.73 (1H, dd, J = 7.8 Hz, 4.8 Hz, H-7′), 3.86 (3H, s, H-3-OCH3) 3.54 (1H, dd, J = 13.2 Hz, 4.6 Hz, H-8′β), 3.45 (1H, dd, J = 13.8 Hz, 7.8 Hz, H-8′α). 13C-NMR (150 MHz, CD3OD): δC 169.8 (C-9), 158.3 (C-4), 150.1 (C-4′), 149.5 (C-3), 142.5 (C-7), 135.0 (C-1), 128.7 (C-2′ and C-6′), 128.5 (C-1′), 123.5 (C-8), 118.9 (C-6), 116.7 (C-5), 116.3 (C-3′ and C-5′), 111.8 (C-2), 73.6 (C-7′), 56.5 (C-3-OCH3), 50.0 (C-8′).
(7′S)-N-cis-Feruloylnormetanephrine (9): Yellowish oil. [ α ] D 20 : −7.8 (c 0.10 CH3OH). HRESI-MS ion peak at (m/z 382.1257 [M + Na]+; calcd for C19H21NO6, 382.1261). UV (CH3OH) λmax (log ε): 221 (3.24), 283 (3.06) and 314 nm (3.04). IR (KBr) νmax: 3320 (br), 1651, 1599, 1521 and 1458 cm−1. 1H-NMR data in CD3OD (600 MHz) and 13C-NMR data CD3OD (150 MHz) are reported in (Table 1).
(7′S)-N-trans-Feruloylnormetanephrine (10): Yellowish oil. [ α ] D 20 : −30.4 (c 0.10 CH3OH). ESI-MS ion peak at m/z 358.1 [M − H]+. 1H-NMR data in CD3OD (600 MHz) and 13C-NMR data CD3OD (150 MHz) are reported in (Table 1).

3.4. Stability and Conversion Testing of Cis and trans-Feruloyl Amides

All isolated pure compounds 110 (verified as ≥95% by HPLC analysis) were dissolved in MeOH to a concentration of 1 mg/mL, and the solutions were stored in the dark at room temperature for stability testing. For conversion tests, 0.1 mL of each solution was used to determine the initial ratio of cis and trans- by HPLC. Subsequently, the remainder of each solution was then exposed to a UV lamp (30 W, UV output 13.4 W, 253.7 nm) in a dark room for 96 h. A 0.1-mL aliquot of each solution was removed and analyzed by HPLC at 1, 2, 4, 8, 24, 48 and 96 h to determine the ratio of cis and trans- isomers. HPLC analysis was performed on a Phenomenex Luna 5 μ C18, 150 mm × 4.60 mm i.d column under isocratic solvent conditions (H2O/MeCN = 80/20, v/v, 20 min). The flow rate was 1.0 mL/min, and the injection volume was 10 μL. The detection wavelength was 210 nm, and the column temperature was maintained at 40 °C. The wavelength for detection was set at 210 nm, where all compounds exhibited maximum absorption.

3.5. Cell Culture

Human hepatoma Hep3B cells (ATCC No. HB-8064) and myeloma U266 cells (ATCC No. TIB-196TM) were obtained from American Type Culture Collection (Rockville, MD, USA) and were maintained in a DMEM medium, supplemented with 10% fetal bovine serum, 50 U/mL penicillin and 50 mg/mL streptomycin, at 37 °C in a 5% CO2 incubator. All of the cell culture reagents were purchased from GibcoBRL (Life Technologies, Cergy-Pontoise, France).

3.6. Reagents and Chemicals

Recombinant human IL-6 was purchased from R & D systems (Minneapolis, MN, USA). Anti-phospho STAT3 (Tyr705) antibody was purchased from Calbiochem (Darmstadt, Germany) and anti-total STAT3, anti-phospho JAK2 (Tyr1007/1008), anti-phospho ERK (Tyr202/204) were from Cell Signaling Technology (Boston, MA, USA). All reagents including genistein were obtained from Sigma-Aldrich Ltd (St Louis, MO, USA).

3.7. Establishment of the Stable Cell Line Expressing pStat3-Luc

Hep3B cells were cotransfected with pStat3-Luc encoding the Stat3 binding site and pcDNA3.1 (+) carrying a hygromycin selection marker (Clontech Laboratories, Palo Alto, CA, USA) using Lipofectamine plus (Invitrogen, Carlsbad, CA, USA). Two days after transfection, cells that stably expressed luciferase were selected with hygromycin (100 μg/mL), and stable clones were expanded. The expression of luciferase in the clones stably expressing pStat3-Luc was confirmed by luciferase assays.

3.8. IL-6-Induced STAT3 Activation

Hep3B cells stably expressing pSTAT3-Luc were established as described previously [29]. The Hep3B cells stably expressing pSTAT3-Luc were seeded in 96-well culture plates at 2 × 10⁴ cells/well. After 24 h, cells were subjected to starvation for 12 h, followed by treatment with IL-6 (10 ng/mL) with or without compounds for 12 h. Luciferase activity was measured according to the manufacturer’s protocol (Promega Corp., Madison, WI, USA).

3.9. Cell Viability Assay

Hep3B cells were seeded and cultured for 24 h in 96-well culture plates. After 24 h, the culture medium was replaced with serum-free medium supplemented with a sample at the indicated dose. Following culture with the sample for 48 h, MTT (0.5 mg/mL) was added, and after 4 h of incubation at 37 °C, 200 μL of DMSO was added to each well. Cell viability was determined by MTT assay according to the manufacturer’s protocol (Sigma Chemical Co., St Louis, MO, USA).

3.10. Western Blot Analysis

Hep3B or U266 cells were stimulated with IL-6 (10 ng/mL) for 20 min after pre-treatment with compound for 1 h. Whole-cell lysates were prepared using a cell lysis buffer (Cell Signaling Technology) and subjected to western blot [29].

4. Conclusions

In this work, we evaluated the IL-6/STAT3 inhibitory activity of ten feruloyl amides isolated from P. oleracea. Their structures were determined by NMR and MS spectral data. Among the isolated compounds, with cis-configured double bonds, compounds 5 and 9 were reported for the first time. In experiments studying the UV-induced cis/trans-isomerization of the isolated feruloyl amides, we found that all isomeric pairs equilibrated to trans/cis-ratios of about 22%/77% to 35%/65%. As the number of methoxy groups in the tyramine moiety increased, the equilibrium ratio increased in favor of the trans-isomers, and the presence of the 7′-hydroxyl group also increased the trans-isomer proportion. Although all isomer compounds exhibited potent inhibitory activity in the STAT3-dependent luciferase assay, the trans-feruloyl amides had stronger activity than the cis-isomers, and the conversion mixtures maintained in the ranges of IC50 values on their pure cis and trans-isomers. Among the tested compounds, 5 and 6 exhibited the most potent inhibitory activity against IL-6/STAT3. Also, compound 5, 6 and their converted mixture (5 + 6) exhibited inhibition on the phosphorylation of p-STAT3, p-JAK2 and p-ERK. Based on these results, these isolated feruloyl amides from P. oleracea might be useful candidates for lead compounds against inflammatory diseases and their conversion study could be the basis for the design of IL-6 inhibitors.

Supplementary Materials

The following are available online at https://www.mdpi.com/1420-3049/21/7/865/s1.

Acknowledgments

This research was supported by a grant from the KRIBB Research Initiative Program (KGM2221622) and the Agricultural Bio-industry Technology Development Program of the Ministry of Agriculture, Food, and Rural Affairs (314011-5).

Author Contributions

Conceived and designed the experiments: Seung Woong Lee, Mun-Chual Rho; Performed the experiments: Joo Tae Hwang, Yesol Kim, Hyun-Jae Jang; Analyzed the data: Joo Tae Hwang, Hyun-Mee Oh, Seung Woong Lee, Mun-Chual Rho; Wrote the paper: Joo Tae Hwang, Chi-Hwan Lim, Seung Woong Lee; All authors read and approved the final manuscript.

Conflicts of Interest

The authors declare no conflict of interest.

References

  1. Lim, Y.Y.; Quah, E.P.L. Antioxidant properties of different cultivars of Portulaca oleracea. Food Chem. 2007, 103, 734–740. [Google Scholar] [CrossRef]
  2. Rashed, A.N.; Afifi, F.U.; Disi, A.M. Simple evaluation of the wound healing activity of a crude extract of Portulaca oleracea L. (growing in Jordan) in Mus musculus JVI-1. J. Ethnopharmacol. 2003, 88, 131–136. [Google Scholar] [CrossRef]
  3. Amirul Alam, M.; Juraimi, A.S.; Rafii, M.Y.; Hamid, A.A.; Aslani, F.; Alam, M.Z. Effects of salinity and salinity-induced augmented bioactive compounds in purslane (Portulaca oleracea L.) for possible economical use. Food Chem. 2015, 169, 439–447. [Google Scholar] [CrossRef] [PubMed]
  4. Koch, K.E.; Kennedy, R.A. Crassulacean Acid metabolism in the succulent C (4) dicot, Portulaca oleracea L under natural environmental conditions. Plant Physiol. 1982, 69, 757–761. [Google Scholar] [CrossRef] [PubMed]
  5. Erkan, N. Antioxidant activity and phenolic compounds of fractions from Portulaca oleracea L. Food Chem. 2012, 133, 775–781. [Google Scholar] [CrossRef]
  6. Xiang, L.; Xing, D.; Wang, W.; Wang, R.; Ding, Y.; Du, L. Alkaloids from Portulaca oleracea L. Phytochemistry 2005, 66, 2595–2601. [Google Scholar] [CrossRef] [PubMed]
  7. Liu, L.; Howe, P.; Zhou, Y.F.; Xu, Z.Q.; Hocart, C.; Zhan, R. Fatty acids and β-carotene in Australian purslane (Portulaca oleracea) varieties. J. Chromatogr. A 2000, 893, 207–213. [Google Scholar] [CrossRef]
  8. Chan, K.; Islam, M.W.; Kamil, M.; Radhakrishnan, R.; Zakaria, M.N.; Habibullah, M.; Attas, A. The analgesic and anti-inflammatory effects of Portulaca oleracea L. subsp. Sativa (Haw.) Celak. J. Ethnoparmacol. 2000, 73, 445–451. [Google Scholar] [CrossRef]
  9. Chen, C.J.; Wang, W.Y.; Wang, X.L.; Dong, L.W.; Yue, Y.T.; Xin, H.L.; Ling, C.Q.; Li, M. Anti-hypoxic activity of the ethanol extract from Portulaca oleracea in mice. J. Ethnopharmacol 2009, 124, 246–250. [Google Scholar] [CrossRef] [PubMed]
  10. Xu, X.; Yu, L.; Chen, G. Determination of flavonoids in Portulaca oleracea L. By capillary electrophoresis with electrochemical detection. J. Pharm. Biomed. Anal. 2006, 41, 493–499. [Google Scholar] [CrossRef] [PubMed]
  11. De la Mata, J.; Uy, H.L.; Guise, T.A.; Story, B.; Boyce, B.F.; Mundy, G.R.; Roodman, G.D. Interleukin-6 enhances hypercalcemia and bone resorption mediated by parathyroid hormone-related protein in vivo. J. Clin. Investig. 1995, 95, 2846–2852. [Google Scholar] [CrossRef] [PubMed]
  12. Klein, B.; Zhang, X.G.; Lu, Z.Y.; Bataille, R. Interleukin-6 in human multiple myeloma. Blood 1995, 85, 863–872. [Google Scholar] [PubMed]
  13. Nishimura, R.; Nagao, K.; Miyayama, H.; Matsuda, M.; Baba, K.; Matsuoka, Y.; Yamashita, H.; Fukuda, M.; Mizumoto, T.; Hamamoto, R. An analysis of serum interleukin-6 levels to predict benefits of medroxyprogesterone acetate in advanced or recurrent breast cancer. Oncology 2000, 59, 166–173. [Google Scholar] [CrossRef] [PubMed]
  14. Nowell, M.A.; Richards, P.J.; Fielding, C.A.; Ognjanovic, S.; Topley, N.; Williams, A.S.; Bryant-Greenwood, G.; Jones, S.A. Regulation of pre-B cell colony-enhancing factor by STAT-3-dependent interleukin-6 trans-signaling: Implications in the pathogenesis of rheumatoid arthritis. Arthritis Rheum. 2006, 54, 2084–2095. [Google Scholar] [CrossRef] [PubMed]
  15. Agrawal, S.; Gollapudi, S.; Su, H.; Gupta, S. Leptin activates human B cells to secrete TNF-α, IL-6, and IL-10 via JAK2/STAT3 and p38MAPK/ERK1/2 signaling pathway. J. Clin. Immunol. 2011, 31, 472–478. [Google Scholar] [CrossRef] [PubMed]
  16. Tak, P.P.; Firestein, G.S. NF-κB: A key role in inflammatory diseases. J. Clin. Investig. 2001, 107, 7–11. [Google Scholar] [CrossRef] [PubMed]
  17. Ge, L.; Liao, M.; Yang, F.; Xiong, S. Amide alkaloids from Acorus Tatarinowii Schott. Adv. Biomed. Eng. Res. 2014, 2, 1–4. [Google Scholar]
  18. King, R.R.; Calhoun, L.A. Characterization of cross-linked hydroxycinnamic acid amides isolated from potato common scab lesions. Phytochemistry 2005, 66, 2468–2473. [Google Scholar] [CrossRef] [PubMed]
  19. Al-Taweel, A.M.; Perveen, S.; El-Shafae, A.M.; Fawzy, G.A.; Malik, A.; Afza, N.; Iqbal, L.; Latif, M. Bioactive phenolic amides from Celtis Africana. Molecules 2012, 17, 2675–2682. [Google Scholar] [CrossRef] [PubMed]
  20. Chen, C.; Chang, F.; Yen, H.; Wu, Y. Amides from stems of annona Cherimola. Phytochemistry 1998, 49, 1443–1447. [Google Scholar] [CrossRef]
  21. Seo, G.W.; Cho, J.; Moon, J.; Park, K. Isolation and identification of Cinnamic acid amides as antioxidants from Allium fistulosum L. and their free radical scavenging activity. Food Sci. Biotechnol. 2011, 20, 555–560. [Google Scholar] [CrossRef]
  22. Chen, J.J.; Huang, S.Y.; Duh, C.Y.; Chen, I.S.; Wang, T.C.; Fang, H.Y. A new cytotoxic amide from the stem wood of Hibiscus tiliaceus. Planta Med. 2006, 72, 935–938. [Google Scholar] [CrossRef] [PubMed]
  23. Fang, J.B.; Jia, W.; Gao, W.Y.; Yao, Z.; Teng, J.; Zhao, A.H.; Duan, H.Q. Antitumor constituents from Alternanthera philoxeroides. J. Asian Nat. Prod. Res. 2007, 9, 511–515. [Google Scholar] [CrossRef] [PubMed]
  24. DellaGreca, M.; Previtera, L.; Purcaro, R.; Zarrelli, A. Cinnamic acid amides and lignanamides from Aptenia cordifolia. Tetrahedron 2006, 62, 2877–2882. [Google Scholar] [CrossRef]
  25. Holzbach, J.C.; Lopes, L.M. Aristolactams and alkamides of Aristolochia gigantea. Molecules 2010, 15, 9462–9472. [Google Scholar] [CrossRef] [PubMed]
  26. Brent, C.T.; Andrew, L. Resveratrol: Isomeric molar absorptivities and stability. J. Agric. Food Chem. 1996, 44, 1253–9472. [Google Scholar]
  27. Song, Li.; Lanyi, J.K.; Yang, D.; Ei-Sayed, M.A. Retinal isomer composition in some bacteriorhodopsin mutants under light and dark adaptation conditions. J. Phys. Chem. 1995, 99, 10052–10055. [Google Scholar] [CrossRef]
  28. Karaköse, H.; Jaiswal, R.; Deshpande, S.; Kuhnert, N. Investigation of the photochemical changes of chlorogenic acids induced by ultraviolet light in model systems and in agricultural practice with Stevia rebaudiana cultivation as an example. J. Agric. Food Chem. 2015, 63, 3339–3347. [Google Scholar] [CrossRef] [PubMed]
  29. Oh, H.M.; Lee, S.W.; Yun, B.R.; Hwang, B.S.; Kim, S.N.; Park, C.S.; Jeoung, S.H.; Kim, H.K.; Lee, W.S.; Rho, M.C. Vigna angularis inhibits IL-6-induced cellular signaling and ameliorates collagen-induced arthritis. Rheumatology 2014, 53, 56–64. [Google Scholar] [CrossRef] [PubMed]
  • Sample Availability: Not Available.
Figure 1. Structures of compounds 110 isolated from Portulaca oleracea (A); 1H-1H COSY and HMBC correlations for compounds 5 and 9 (B).
Molecules 21 00865 g001
Figure 2. Overlaid HPLC-UV chromatograms obtained at 210 nm of (A) isolated trans-compounds with purities of ≥95%; (B) isolated cis-compounds with purities of ≥95%; (C) fully converted mixtures from trans-compounds after 96 h of UV exposure and (D) fully converted mixtures from cis-compounds after 96 h of UV (254 nm) exposure.
Molecules 21 00865 g002
Figure 3. Conversion rates and stabilized ratios of compounds 1 and 2 (A); compound 3 and 4 (B); compound 5 and 6 (C); compound 7 and 8 (D); compound 9 and 10 (E).
Molecules 21 00865 g003
Figure 4. 1H-NMR (600 MHz) spectra of compound 2, which was isolated with a purity of ≥95% (A); and fully converted compound 2 after 96 h of UV (245 nm) exposure (B).
Molecules 21 00865 g004
Figure 5. Effects of compounds 5 and 6 and their converted mixture (5 + 6) on the STAT3, JAK2 and ERK Phosphorylation by IL-6.
Molecules 21 00865 g005
Table 1. 1H and 13C-NMR data for compounds 5, 6, 9 and 10 1.
Positions5 (cis, Z)6 (trans, E)9 (cis, Z)10 (trans, E)
δHδcδHδcδHδcδHδc
1-128.0-127.6-126.6-128.5
27.34 (d, 2.0) 2116.27.07 (d, 2.0)111.67.38 (d, 1.8)112.77.09 (d, 1.8)111.8
3-149.3-149.4-147.4-149.2
4-149.8-149.4-148.2-150.1
56.69 (d, 8.0)114.06.74 (d, 8.0)117.06.72 (d, 8.4)115.96.77 (d, 7.8)116.7
66.90 (dd, 8.0, 2.0)125.26.98 (dd, 8.0, 2.0)123.66.91 (dd, 8.4, 1.8)123.87.00 (d, 7.8)123.5
76.57 (d, 13.2)138.67.41 (d, 15.6)142.46.59 (d, 12.6)137.77.42 (d, 15.6)142.5
85.78 (d, 13.2)121.26.36 (d, 15.6)118.35.79 (d, 12.6)118.66.45 (d, 15.6)118.9
9-170.6-169.5-169.2-169.8
1′-131.3-131.4-133.9-135.7
2′6.45 (s)107.16.50 (s)106.96.93 (d, 1.8)109.46.97 (d, 1.8)111.1
3′-149.3-151.5-147.6-149.6
4′-135.2-135.2-145.9-147.4
5′-149.0-149.96.69 (d, 8.4)114.46.75 (d, 7.8)116.2
6′6.45 (s)107.06.50 (s)107.26.76 (dd, 8.4, 1.8)118.66.81 (dd, 7.8, 1.8)120.2
7′2.70 (t, 7.2)36.62.75 (t, 7.2)36.84.66 (dd, 7.8, 4.8)72.24.71 (dd, 7.8, 4.8)73.8
8′ α3.42 (t, 7.6)42.43.47 (t, 7.6)42.63.39 (dd, 13.8, 5.4)46.83.43 (dd, 13.8, 5.4)50.0
8′ β3.42 (t, 7.6)42.43.47 (t, 7.6)42.63.46 (dd, 13.2, 7.8)46.83.52 (dd, 13.2, 7.8)50.0
3-OCH33.75 (s)56.83.80 (s)56.93.79 (s)55.03.82 (s)55.6
3′-OCH33.75 (s)56.83.80 (s)56.93.80 (s)55.03.84 (s)55.5
5′-OCH33.79 (s)56.43.85 (s)56.5----
1 1H-NMR data in CD3OD (600 MHz), 13C-NMR data in CD3OD (150 MHz); 2 Chemical shifts (δ) in ppm relative to TMS, J in Hz.
Table 2. IC50 values of compounds 110 for the inhibition of the induction of STAT3 by IL-6.
CompoundsIC50 (μM)
N-cis-feruloyltyramine (1)19.3
N-trans-feruloyltyramine (2)5.6
Converted mixture (1 + 2) 15.2
N-cis-feruloyl-3′-methoxytyramine (3)16.2
N-trans-feruloyl-3′-methoxytyramine (4)6.0
Converted mixture (3 + 4)6.5
N-cis-hibiscusamide (5)6.7
N-trans-hibiscusamide (6)0.2
Converted mixture (5 + 6)5.9
(7′S)-N-cis-feruloyloctopamine (7)19.5
(7′S)-N-trans-feruloyloctopamine (8)2.6
Converted mixture (7 + 8)6.7
(7′S)-N-cis-feruloylnormetanephrine (9)28.6
(7′S)-N-trans-feruloylnormetanephrine (10)13.0
Converted mixture (9 + 10)13.7
Oleanolic acid acetate 10.7
1 Oleanolic acid acetate was used as the positive control.

