2. Results and Discussion
The seeds of
L. apetalum were refluxed with 50% ethanol/water. Evaporation of the solvent under reduced pressure provided a 50% ethanol/water extract. The extract was subjected to kinds of column chromatography (CC) and finally preparative HPLC (PHPLC) to yield seven new rare sinapoyl acylated flavonoid glycosides, apetalumosides A
1 (
1), B
8 (
2), B
9 (
3), B
10 (
4), B
11 (
5), B
12 (
6), and C
1 (
7) (
Figure 1).
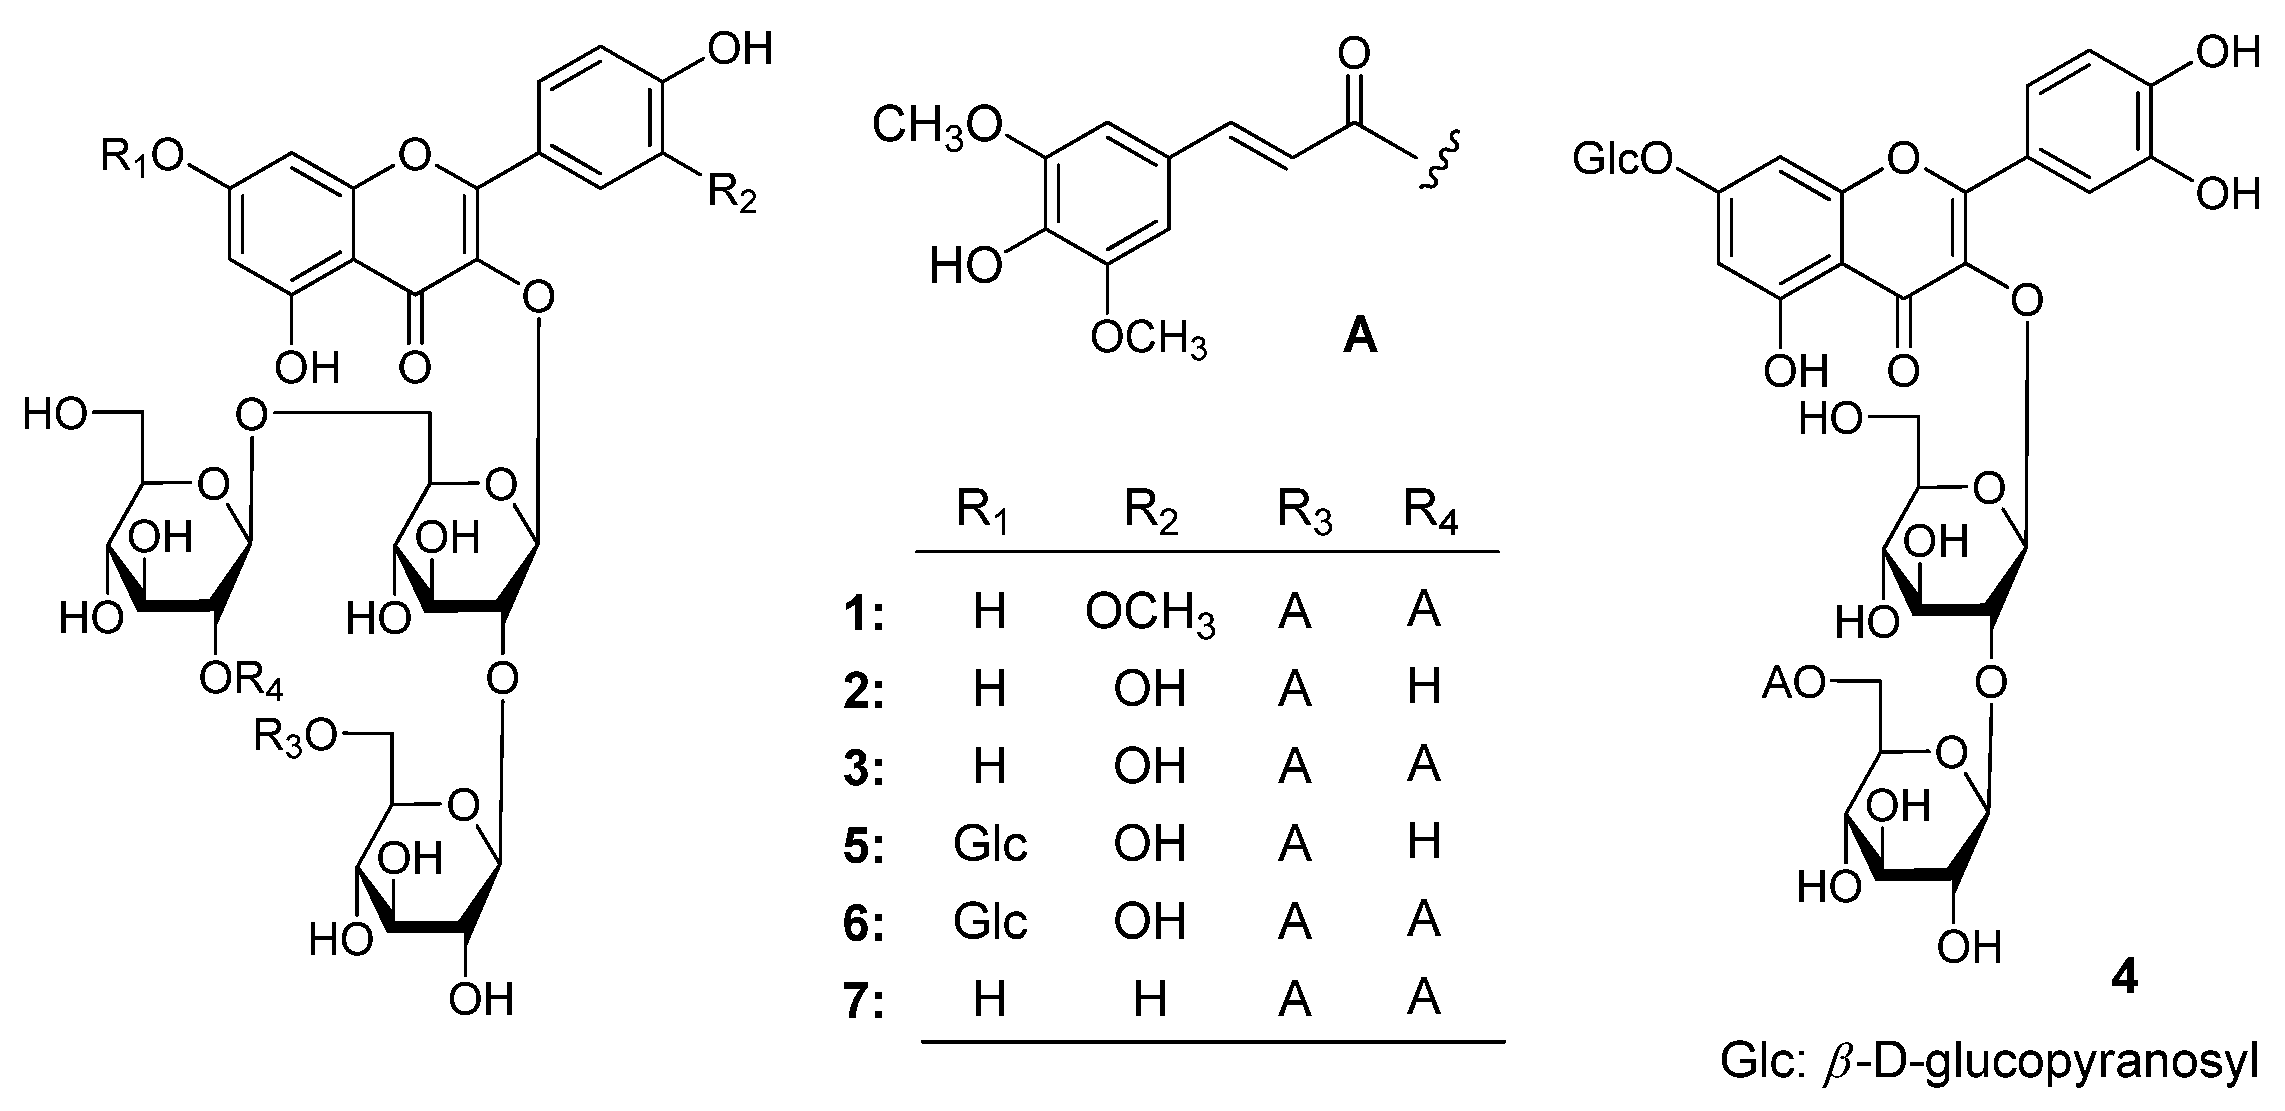
Figure 1.
The structure of compounds 1–7. (A), the moiety structure which indicated in the table for compounds 1–3 and 5–7; (4), an isolated structure of B10 (4).
Figure 1.
The structure of compounds 1–7. (A), the moiety structure which indicated in the table for compounds 1–3 and 5–7; (4), an isolated structure of B10 (4).
Apetalumoside A1 (
1),
–49.0° (MeOH), was isolated as yellow powder. The IR spectrum of
1 showed absorption bands ascribable to hydroxyl (3394 cm
−1), α,β-unsaturated ester (1701, 1630 cm
−1), aromatic ring (1648, 1604, 1514, 1458 cm
−1), and
O-glycosidic linkage (1075 cm
−1). The molecular formula, C
56H
62O
30, of
1 was eatablished by negative-ion HRESI-TOF-MS (
m/
z 1213.3238 [M − H]
−, calcd for C
56H
61O
30 1213.3253). Acid hydrolysis of it yielded D-glucose, which was identified by retention time and optical rotation using chiral detection by HPLC analysis [
1,
2]. The
1H and
13C-NMR (DMSO-
d6,
Table 1) spectra of
1 showed signals assignable to an isorhamnetin aglycon [δ 3.85 (3H, s, 3′-OCH
3), 6.18 (1H, br. s, H-6), 6.32 (1H, br. s, H-8), 6.90 (1H, d,
J = 8.5 Hz, H-5′), 7.60 (1H, dd,
J = 1.5, 8.5 Hz, H-6′), 7.74 (1H, d,
J = 1.5 Hz, H-2′), 12.74 (1H, br. s, 5-OH)], three β-
d-glucopyranosyl groups [δ 4.33 (1H, d,
J = 8.0 Hz, H-1′′′′), 4.67 (1H, d,
J = 7.5 Hz, H-1′′′), 5.74 (1H, d,
J = 7.0 Hz, H-1′′)], together with two sinapoyl {6′′′-sinapoyl: δ
H 3.77 (6H, s, 3′′′′′,5′′′′′-OCH
3), 6.27 (1H, d,
J = 15.5 Hz, H-8′′′′′), 6.81 (2H, s, H-2′′′′′,6′′′′′), 7.38 (1H, d,
J = 15.5 Hz, H-7′′′′′), and δ
C 166.4 (C-9′′′′′); 2′′′′-sinapoyl: δ
H 3.91 (6H, s, 3′′′′′′,5′′′′′′-OCH
3), 6.28 (1H, d,
J = 16.0 Hz, H-8′′′′′′), 7.08 (2H, s, H-2′′′′′′,6′′′′′′), 7.51 (1H, d,
J = 16.0 Hz, H-7′′′′′′), and δ
C 165.6 (C-9′′′′′′)]. The
1H
1H COSY experiment (
Figure 2) on
1 indicated the presence of partial structure written in bold lines. To assign the badly overlapped protons in sugar chemical shift range, HSQC-TOCSY experiment was determined. In the HSQC-TOCSY spectrum, the correlations between the following proton and carbon pairs were observed: δ
C 98.2 (C-1′′) and δ
H 3.04 (H-4′′), 3.21 (H-5′′), 3.46 (H-3′′), 3.51 (H-2′′), 5.74 (H-1′′); δ
C 66.7 (C-6′′) and δ
H 3.04 (H-4′′), 3.21 (H-5′′), 3.50, 3.75 (H
2-6′′); δ
C 103.8 (C-1′′′) and δ
H 3.15 (H-2′′′), 3.24 (H-4′′′), 3.25 (H-3′′′), 3.40 (H-5′′′), 4.67 (H-1′′′); δ
C 63.3 (C-6′′′) and δ
H 3.24 (H-4′′′), 3.40 (H-5′′′), 4.20, 4.27 (H
2-6′′′); δ
C 100.2 (C-1′′′′) and δ
H 2.68 (H-5′′′′), 2.87 (H-3′′′′), 3.15 (H-4′′′′), 4.33 (H-1′′′′), 4.45 (H-2′′′′); δ
C 60.3 (C-6′′′′) and δ
H 2.68 (H-5′′′′), 2.87 (H-3′′′′), 3.15 (H-4′′′′), 3.41, 3.48 (H
2-6′′′′). Finally, in the HMBC experiment (
Figure 2), long-range correlations were observed between δ
H 5.74 (H-1′′) and δ
C 132.7 (C-3); δ
H 4.67 (H-1′′′) and δ
C 82.1 (C-2′′); δ
H 4.33 (H-1′′′′) and δ
C 66.7 (C-6′′); δ
H 4.20, 4.27 (H
2-6′′′) and δ
C 166.4 (C-9′′′′′); δ
H 4.45 (H-2′′′′) and δ
C 165.6 (C-9′′′′′′), then the connectivities between oligoglycoside moieties and aglycon or sinapoyl groups were characterized. On the basis of above mentioned evidence, the structure of apetalumoside A
1 (
1) was elucidated to be isorhamnetin 3-
O-[β-
d-(2-
O-sinapoyl)-glucopyranosyl(1→6)]-β-
d-(6-
O-sinapoyl)-glucopyranosyl(1→2)-β-
d-glucopyranoside.
Table 1.
1H and 13C-NMR data for 1 in DMSO-d6 (500 MHz for 1H and 125 MHz for 13C).
Table 1.
1H and 13C-NMR data for 1 in DMSO-d6 (500 MHz for 1H and 125 MHz for 13C).
| No. | δC | δH (J in Hz) | No. | δC | δH (J in Hz) |
|---|
| 2 | 155.9 | - | 4′′′ | 69.6 | 3.24 (dd, 9.0, 9.0) |
| 3 | 132.7 | - | 5′′′ | 73.9 | 3.40 (m) |
| 4 | 177.3 | - | 6′′′ | 63.3 | 4.20 (br. d, ca. 12) |
| 5 | 161.1 | - | | | 4.27 (dd, 5.5, 12.0) |
| 6 | 98.9 | 6.18 (br. s) | 1′′′′ | 100.2 | 4.33 (d, 8.0) |
| 7 | 164.7 | - | 2′′′′ | 73.6 | 4.45 (dd, 8.0, 9.0) |
| 8 | 94.0 | 6.32 (br. s) | 3′′′′ | 74.2 | 2.87 (dd, 9.0, 9.0) |
| 9 | 156.2 | - | 4′′′′ | 69.9 | 3.15 (dd, 8.0, 9.0) |
| 10 | 103.8 | - | 5′′′′ | 76.4 | 2.68 (m) |
| 1′ | 120.9 | - | 6′′′′ | 60.3 | 3.41 (dd, 5.0, 11.0) |
| 2′ | 112.7 | 7.74 (d, 1.5) | | | 3.48 (br. d, ca. 11) |
| 3′ | 147.0 | - | 1′′′′′ | 124.2 | - |
| 4′ | 149.6 | - | 2′′′′′,6′′′′′ | 106.0 | 6.81 (s) |
| 5′ | 115.3 | 6.90 (d, 8.5) | 3′′′′′,5′′′′′ | 147.9 | - |
| 6′ | 122.8 | 7.60 (dd, 1.5, 8.5) | 4′′′′′ | 138.2 | - |
| 5-OH | - | 12.74 (br. s) | 7′′′′′ | 145.2 | 7.38 (d, 15.5) |
| 3′-OCH3 | 55.7 | 3.85 (s) | 8′′′′′ | 114.3 | 6.27 (d, 15.5) |
| 1′′ | 98.2 | 5.74 (d, 7.0) | 9′′′′′ | 166.4 | - |
| 2′′ | 82.1 | 3.51 (dd, 7.0, 8.5) | 3′′′′′,5′′′′′-OCH3 | 55.9 | 3.77 (s) |
| 3′′ | 76.3 | 3.46 (dd, 8.5, 8.5) | 1′′′′′′ | 124.6 | - |
| 4′′ | 69.4 | 3.04 (dd, 8.5, 9.0) | 2′′′′′′,6′′′′′′ | 106.0 | 7.08 (s) |
| 5′′ | 78.1 | 3.21 (m) | 3′′′′′′,5′′′′′′ | 148.1 | - |
| 6′′ | 66.7 | 3.50 (dd, 4.5, 11.5) | 4′′′′′′ | 138.3 | - |
| | | 3.75 (br. d, ca. 12) | 7′′′′′′ | 145.3 | 7.51 (d, 16.0) |
| 1′′′ | 103.8 | 4.67 (d, 7.5) | 8′′′′′′ | 114.8 | 6.28 (d, 16.0) |
| 2′′′ | 74.3 | 3.15 (dd, 7.5, 8.0) | 9′′′′′′ | 165.6 | - |
| 3′′′ | 76.3 | 3.25 (dd, 8.0, 9.0) | 3′′′′′′,5′′′′′′-OCH3 | 56.2 | 3.91 (s) |
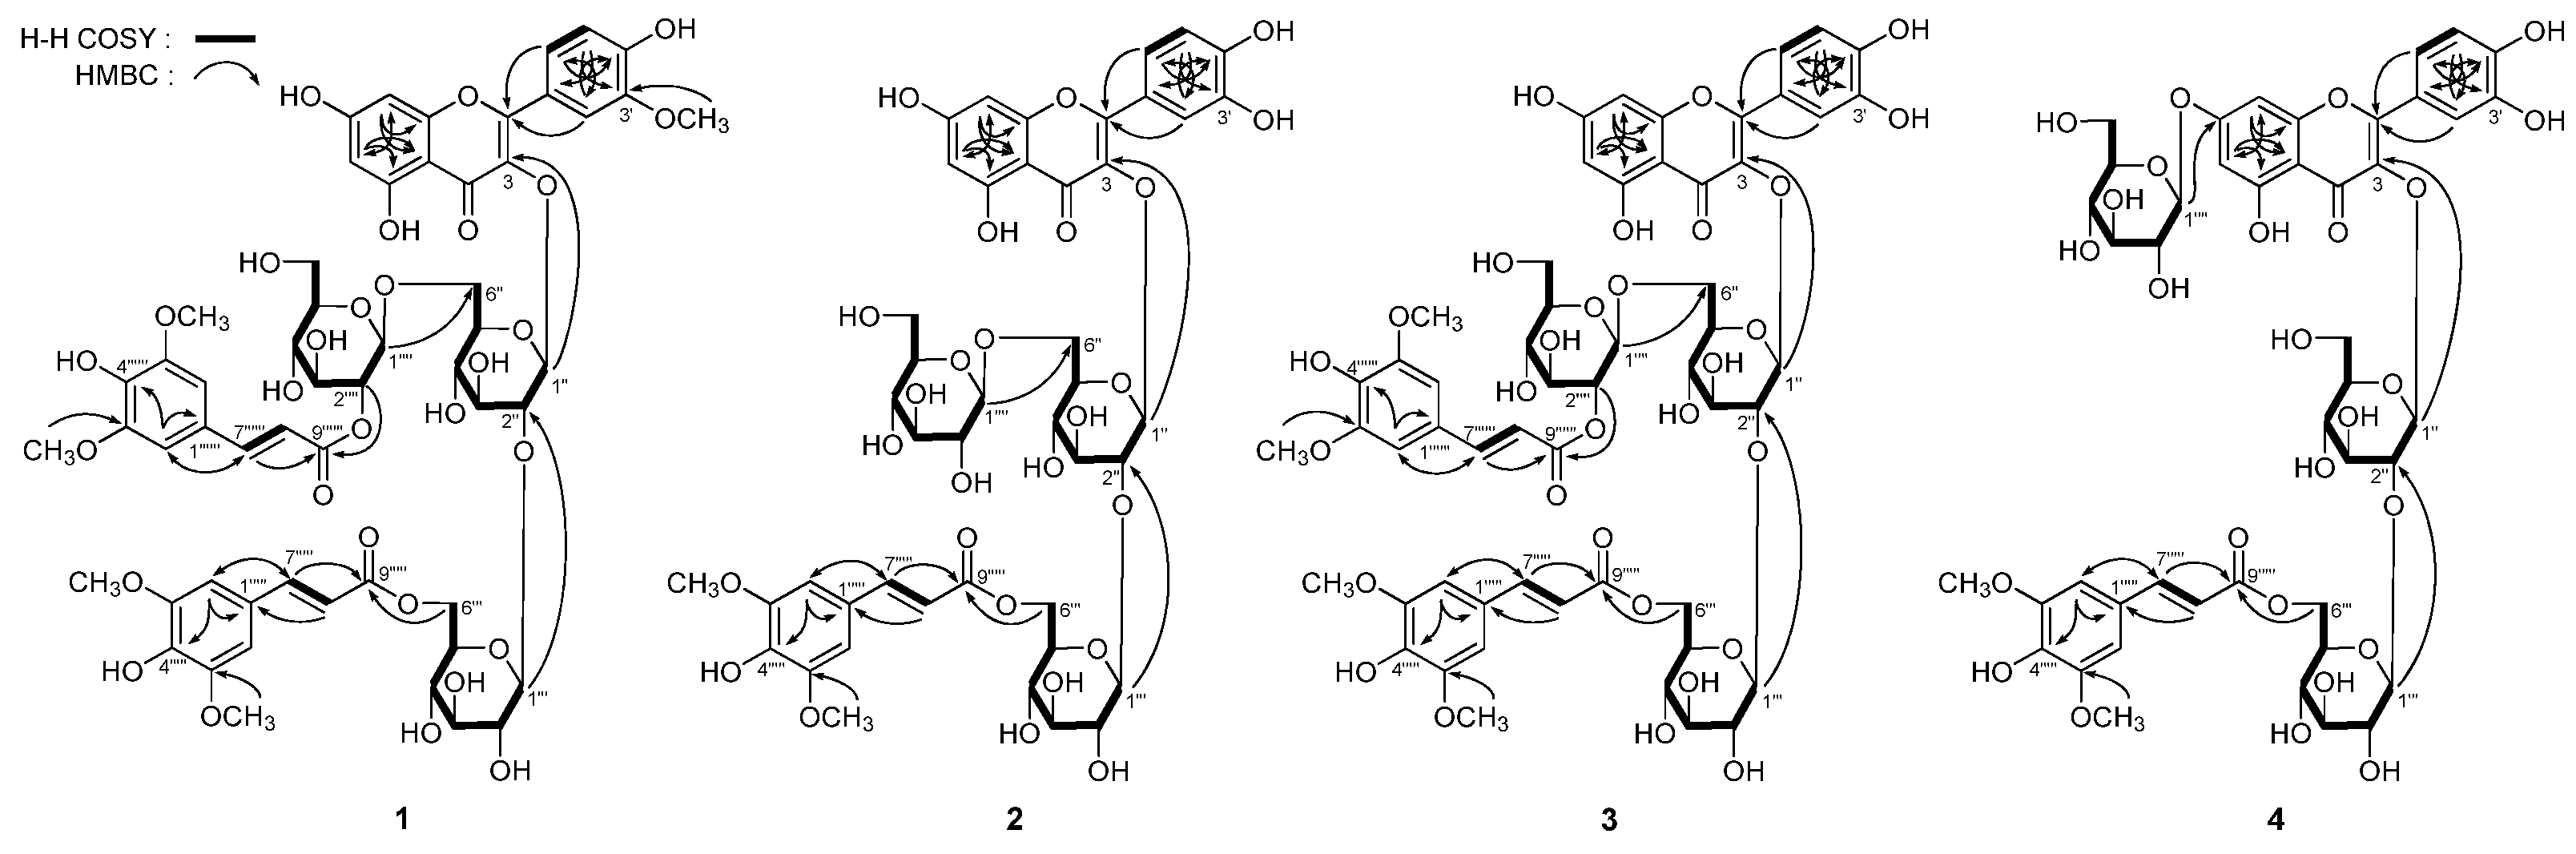
Figure 2.
The main 1H 1H COSY and HMBC correlations of 1–4.
Figure 2.
The main 1H 1H COSY and HMBC correlations of 1–4.
Apetalumoside B8 (
2), was obtained as yellow powder with negative rotation (
–41.6°, in MeOH). The molecular formula, C
44H
50O
26, of
2 was determined by negative-ion HRESI-TOF-MS (
m/
z 993.2522 [M − H]
−, calcd for C
44H
49O
26 993.2518). Acid hydrolysis of it yielded
d-glucose, which was identified by the same method as
1 [
1,
2]. The
1H and
13C (DMSO-
d6,
Table 2) and various 2D NMR experiments including
1H
1H COSY, HSQC, HMBC, and HSQC-TOCSY spectra of
2 indicated the presences of a quercetin aglycon [δ 6.16 (1H, d,
J = 2.0 Hz, H-6), 6.26 (1H, d,
J = 2.0 Hz, H-8), 6.89 (1H, d,
J = 8.5 Hz, H-5′), 7.55 (1H, d,
J = 2.0 Hz, H-2′), 7.59 (1H, dd,
J = 2.0, 8.5 Hz, H-6′), 12.64 (1H, br. s, 5-OH)], three β-
d-glucopyranosyls [δ 4.03 (1H, d,
J = 7.5 Hz, H-1′′′′), 4.69 (1H, d,
J = 7.5 Hz, H-1′′′), 5.65 (1H, d,
J = 7.0 Hz, H-1′′)], and a sinapoyl [δ
H 3.77 (6H, s, 3′′′′′,5′′′′′-OCH
3), 6.30 (1H, d,
J = 16.0 Hz, H-8′′′′′), 6.83 (2H, s, H-2′′′′′,6′′′′′), 7.39 (1H, d,
J = 16.0 Hz, H-7′′′′′); δ
C 166.4 (C-9′′′′′)]. According to the correlations from
1H
1H COSY, HSQC, and HSQC-TOCSY experiments, the
1H and
13C-NMR data for three β-D-glucopyranosyl groups were assigned in detail. Furthermore, in the HMBC experiments, long-range correlations between δ
H 5.65 (H-1′′) and δ
C 132.8 (C-3); δ
H 4.69 (H-1′′′) and δ
C 83.0 (C-2′′); δ
H 4.03 (H-1′′′′) and δ
C 67.8 (C-6′′); δ
H 4.21, 4.31 (H
2-6′′′) and δ
C 166.4 (C-9′′′′′) were observed (
Figure 2). Consequently, the structure of apetalumoside B
8 (
2) was determined as quercetin 3-
O-[β-
d-glucopyranosyl(1→6)]-β-
d-(6-
O-sinapoyl)-glucopyranosyl(1→2)-β-
d-glucopyranoside.
Table 2.
1H and 13C-NMR data for 2 in DMSO-d6 (500 MHz for 1H and 125 MHz for 13C).
Table 2.
1H and 13C-NMR data for 2 in DMSO-d6 (500 MHz for 1H and 125 MHz for 13C).
| No. | δC | δH (J in Hz) | No. | δC | δH (J in Hz) |
|---|
| 2 | 155.5 | - | 1′′′ | 104.3 | 4.69 (d, 7.5) |
| 3 | 132.8 | - | 2′′′ | 74.3 | 3.17 (dd, 7.5, 8.5) |
| 4 | 177.2 | - | 3′′′ | 76.2 | 3.26 (dd, 8.5, 9.0) |
| 5 | 161.1 | - | 4′′′ | 69.4 | 3.29 (dd, 9.0, 9.0) |
| 6 | 98.6 | 6.16 (d, 2.0) | 5′′′ | 73.8 | 3.51 (m) |
| 7 | 164.1 | - | 6′′′ | 63.0 | 4.21 (br. d, ca. 11) |
| 8 | 93.4 | 6.26 (d, 2.0) | | | 4.31 (dd, 5.0, 11.0) |
| 9 | 156.1 | - | 1′′′′ | 103.2 | 4.03 (d, 7.5) |
| 10 | 103.7 | - | 2′′′′ | 73.2 | 2.83 (dd, 7.5, 8.5) |
| 1′ | 121.0 | - | 3′′′′ | 76.4 | 2.96 (dd, 8.5, 8.5) |
| 2′ | 116.1 | 7.55 (d, 2.0) | 4′′′′ | 69.6 | 3.02 (dd, 8.5, 8.5) |
| 3′ | 144.8 | - | 5′′′′ | 76.4 | 2.87 (m) |
| 4′ | 148.4 | - | 6′′′′ | 60.7 | 3.40 (dd, 5.0, 11.5) |
| 5′ | 115.2 | 6.89 (d, 8.5) | | | 3.55 (br. d, ca. 12) |
| 6′ | 121.8 | 7.59 (dd, 2.0, 8.5) | 1′′′′′ | 124.2 | - |
| 5-OH | - | 12.64 (br. s) | 2′′′′′,6′′′′′ | 105.8 | 6.83 (s) |
| 1′′ | 98.0 | 5.65 (d, 7.0) | 3′′′′′,5′′′′′ | 147.8 | - |
| 2′′ | 83.0 | 3.53 (dd, 7.0, 8.5) | 4′′′′′ | 138.1 | - |
| 3′′ | 76.1 | 3.52 (dd, 8.5, 9.0) | 7′′′′′ | 145.2 | 7.39 (d, 16.0) |
| 4′′ | 69.1 | 3.27 (dd, 9.0, 9.0) | 8′′′′′ | 114.3 | 6.30 (d, 16.0) |
| 5′′ | 76.2 | 3.32 (m) | 9′′′′′ | 166.4 | - |
| 6′′ | 67.8 | 3.45 (dd, 5.0, 11.5) | 3′′′′′,5′′′′′-OCH3 | 55.9 | 3.77 (s) |
| | | 3.78 (br. d, ca. 12) | | | |
Apetalumoside B9 (
3),
–61.6° (MeOH). Negative-ion HRESI-TOF-MS determination suggested the molecular formula of it was C
55H
60O
30 (
m/
z 1199.3095 [M − H]
−, calcd for C
55H
59O
30 1199.3097). The proton and carbon signals in
1H and
13C-NMR spectra (DMSO-
d6,
Table 3) were very similar to those of
1, except for the signals due to the aglycon, quercetin [δ 6.15 (1H, br. s, H-6), 6.20 (1H, br. s, H-8), 6.86 (1H, d,
J = 8.5 Hz, H-5′), 7.52 (1H, dd,
J = 1.5, 8.5 Hz, H-6′), 7.57 (1H, d,
J = 1.5 Hz, H-2′), 12.76 (1H, br. s, 5-OH)]. The linkage positions of sugar parts with aglycon and two sinapoyl groups were elucidated by the HMBC determination (
Figure 2), which showed long-range correlations between δ
H 5.69 (1H, d,
J = 7.5 Hz, H-1′′) and δ
C 132.6 (C-3); δ
H 4.63 (1H, d,
J = 7.5 Hz, H-1′′′and δ
C 82.6 (C-2′′); δ
H 4.27 (1H, d,
J = 8.0 Hz, H-1′′′′) and δ
C 66.6 (C-6′′); δ
H [4.15 (1H, br. d,
ca. J = 12 Hz), 4.28 (1H, dd,
J = 4.5, 11.5 Hz), H
2-6′′′] and δ
C 166.4 (C-9′′′′′); δ
H 4.42 (1H, dd,
J = 8.0, 9.0 Hz, H-2′′′′) and δ
C 165.5 (C-9′′′′′′). Meanwhile, the badly overlapped protons in sugar chemical shift range were assigned by HSQC-TOCSY experiment. Finally, the presence of
d-glucose was proved by acid analysis [
1,
2]. Then the structure of apetalumoside B
9 (
3) was elucidated as quercetin 3-
O-[β-
d-(2-
O-sinapoyl)-glucopyranosyl(1→6)]-β-
d-(6-
O-sinapoyl)-glucopyranosyl(1→2)-β-
d-glucopyranoside.
Table 3.
1H and 13C-NMR data for 3 in DMSO-d6 (500 MHz for 1H and 125 MHz for 13C).
Table 3.
1H and 13C-NMR data for 3 in DMSO-d6 (500 MHz for 1H and 125 MHz for 13C).
| No. | δC | δH (J in Hz) | No. | δC | δH (J in Hz) |
|---|
| 2 | 156.0 | - | 4′′′ | 69.4 | 3.23 (dd, 8.0, 8.0) |
| 3 | 132.6 | - | 5′′′ | 73.8 | 3.41 (m) |
| 4 | 177.3 | - | 6′′′ | 63.1 | 4.15 (br. d, ca. 12) |
| 5 | 161.0 | - | | | 4.28 (dd, 4.5, 11.5) |
| 6 | 98.7 | 6.15 (br. s) | 1′′′′ | 100.1 | 4.27 (d, 8.0) |
| 7 | 163.9 | - | 2′′′′ | 73.7 | 4.42 (dd, 8.0, 9.0) |
| 8 | 93.7 | 6.20 (br. s) | 3′′′′ | 74.2 | 2.79 (dd, 9.0, 9.0) |
| 9 | 156.1 | - | 4′′′′ | 69.6 | 3.15 (dd, 8.0, 9.0) |
| 10 | 103.9 | - | 5′′′′ | 76.3 | 2.69 (m) |
| 1′ | 121.0 | - | 6′′′′ | 60.1 | 3.44 (m) |
| 2′ | 116.1 | 7.57 (d, 1.5) | 1′′′′′ | 124.2 | - |
| 3′ | 144.7 | - | 2′′′′′,6′′′′′ | 105.9 | 6.79 (s) |
| 4′ | 148.5 | - | 3′′′′′,5′′′′′ | 147.8 | - |
| 5′ | 115.2 | 6.86 (d, 8.5) | 4′′′′′ | 138.1 | - |
| 6′ | 121.6 | 7.52 (dd, 1.5, 8.5) | 7′′′′′ | 145.1 | 7.34 (d, 16.0) |
| 5-OH | - | 12.76 (br. s) | 8′′′′′ | 114.3 | 6.25 (d, 16.0) |
| 1′′ | 97.9 | 5.69 (d, 7.5) | 9′′′′′ | 166.4 | - |
| 2′′ | 82.6 | 3.51 (dd, 7.5, 8.5) | 3′′′′′,5′′′′′-OCH3 | 55.9 | 3.74 (s) |
| 3′′ | 76.1 | 3.39 (dd, 8.0, 8.5) | 1′′′′′′ | 124.5 | - |
| 4′′ | 69.2 | 3.04 (dd, 8.0, 9.0) | 2′′′′′′,6′′′′′′ | 105.9 | 7.07 (s) |
| 5′′ | 78.1 | 3.16 (m) | 3′′′′′′,5′′′′′′ | 148.1 | - |
| 6′′ | 66.6 | 3.43 (dd, 5.5, 11.5) | 4′′′′′′ | 138.2 | - |
| | | 3.69 (br. d, ca. 12) | 7′′′′′′ | 145.1 | 7.49 (d, 16.0) |
| 1′′′ | 104.2 | 4.63 (d, 7.5) | 8′′′′′′ | 115.0 | 6.32 (d, 16.0) |
| 2′′′ | 74.3 | 3.14 (dd, 7.5, 8.0) | 9′′′′′′ | 165.5 | - |
| 3′′′ | 76.2 | 3.24 (dd, 8.0, 8.0) | 3′′′′′′,5′′′′′′-OCH3 | 56.2 | 3.88 (s) |
Apetalumoside B10 (
4) was obtained as yellow powder with negative rotation (
–66.4°, in MeOH). Acid hydrolysis with 1 M HCl, it gave
d-glucose [
1,
2]. The molecular formula of
4, C
44H
50O
26 (
m/
z 993.2537 [M − H]
−, calcd for C
44H
49O
26 993.2518), was the same as that of
2. And the
1H and
13C (DMSO-
d6,
Table 4) together with various 2D NMR experiments of
4 showed the same fragments {quercetin aglycon [δ 6.39 (1H, d,
J = 1.5 Hz, H-6), 6.58 (1H, d,
J = 1.5 Hz, H-8), 6.90 (1H, d,
J = 8.5 Hz, H-5′), 7.57 (1H, d,
J = 1.5 Hz, H-2′), 7.61 (1H, dd,
J = 1.5, 8.5 Hz, H-6′), 12.70 (1H, br. s, 5-OH)], three β-
d-glucopyranosyl groups [δ 4.68 (1H, d,
J = 7.5 Hz, H-1′′′), 5.03 (1H, d,
J = 7.5 Hz, H-1′′′′), 5.68 (1H, d,
J = 6.5 Hz, H-1′′)], and a sinapoyl [δ
H 3.75 (6H, s, 3′′′′′,5′′′′′-OCH
3), 6.25 (1H, d,
J = 15.5 Hz, H-8′′′′′), 6.78 (2H, s, H-2′′′′′,6′′′′′), 7.36 (1H, d,
J = 15.5 Hz, H-7′′′′′); δ
C 166.4 (C-9′′′′′)]} as
2. But comparison the
1H and
13C-NMR data of 6–8 positions in
4 [δ
H 6.39 (H-6), 6.58 (H-8); δ
C 94.0 (C-8), 99.1 (C-6), 162.5 (C-7)] with those in
2 [δ
H 6.16 (H-6), 6.26 (H-8); δ
C 93.4 (C-8), 98.6 (C-6), 164.1 (C-7)] revealed a glycoside substitution shift around the 7-position. Meanwhile, the
13C-NMR data of C-6′′ of
4 (δ
C 60.4) shifted to high field compared with that of
2 (δ
C 67.8), which meant there was no substitution at C-6′′ position for compound
4. Furthermore, in the HMBC experiment, long-range correlations were observed between δ
H 5.68 (H-1′′) and δ
C 133.1 (C-3); δ
H 4.68 (H-1′′′) and δ
C 83.6 (C-2′′); δ
H 5.03 (H-1′′′′) and δ
C 162.5 (C-7); δ
H [4.20 (1H, br. d,
ca. J = 12 Hz), 4.31 (1H, dd,
J = 5.0, 11.5 Hz), H
2-6′′′] and δ
C 166.4 (C-9′′′′′). Consequently, the structure of apetalumoside B
10 (
4) was determined as quercetin 3-
O-β-
d-(6-
O-sinapoyl)-glucopyranosyl(1→2)-β-
d-glucopyranoside-7-
O-β-
d-glucopyranoside.
Table 4.
1H and 13C-NMR data for 4 in DMSO-d6 (500 MHz for 1H and 125 MHz for 13C).
Table 4.
1H and 13C-NMR data for 4 in DMSO-d6 (500 MHz for 1H and 125 MHz for 13C).
| No. | δC | δH (J in Hz) | No. | δC | δH (J in Hz) |
|---|
| 2 | 156.1 | - | 1′′′ | 104.5 | 4.68 (d, 7.5) |
| 3 | 133.1 | - | 2′′′ | 74.4 | 3.17 (dd, 7.5, 9.0) |
| 4 | 177.4 | - | 3′′′ | 76.1 | 3.26 (dd, 8.0, 9.0) |
| 5 | 160.7 | - | 4′′′ | 69.5 | 3.25 (dd, 8.0, 8.0) |
| 6 | 99.1 | 6.39 (d, 1,5) | 5′′′ | 73.8 | 3.53 (m) |
| 7 | 162.5 | - | 6′′′ | 63.1 | 4.20 (br. d, ca. 12) |
| 8 | 94.0 | 6.58 (d, 1.5) | | | 4.31 (dd, 5.0, 11.5) |
| 9 | 155.7 | - | 1′′′′ | 99.6 | 5.03 (d, 7.5) |
| 10 | 105.4 | - | 2′′′′ | 73.0 | 3.28 (dd, 7.5, 8.0) |
| 1′ | 120.8 | - | 3′′′′ | 76.2 | 3.34 (dd, 8.0, 9.0) |
| 2′ | 116.2 | 7.57 (d, 1.5) | 4′′′′ | 69.5 | 3.19 (dd, 9.0, 9.0) |
| 3′ | 144.8 | - | 5′′′′ | 77.0 | 3.44 (m) |
| 4′ | 148.7 | - | 6′′′′ | 60.5 | 3.49 (m, overlapped) |
| 5′ | 115.2 | 6.90 (d, 8.5) | | | 3.72 (br. d, ca. 11) |
| 6′ | 121.9 | 7.61 (dd, 1.5, 8.5) | 1′′′′′ | 124.1 | - |
| 5-OH | - | 12.70 (br. s) | 2′′′′′,6′′′′′ | 105.8 | 6.78 (s) |
| 1′′ | 97.7 | 5.68 (d, 6.5) | 3′′′′′,5′′′′′ | 147.8 | - |
| 2′′ | 83.6 | 3.49 (m, overlapped) | 4′′′′′ | 138.1 | - |
| 3′′ | 76.3 | 3.49 (m, overlapped) | 7′′′′′ | 145.1 | 7.36 (d, 15.5) |
| 4′′ | 69.4 | 3.13 (dd, 8.0, 8.0) | 8′′′′′ | 114.3 | 6.25 (d, 15.5) |
| 5′′ | 77.4 | 3.10 (m) | 9′′′′′ | 166.4 | - |
| 6′′ | 60.4 | 3.27 (m, overlapped) | 3′′′′′,5′′′′′-OCH3 | 55.9 | 3.75 (s) |
| | | 3.49 (m, overlapped) | | | |
Apetalumoside B11 (
5) was isolated as yellow powder, too. It had the molecular formula, C
50H
60O
31, deduced from the negative-ion HRESI-TOF-MS (
m/
z 1155.3063 [M − H]
−, calcd for C
50H
59O
31 1155.3046). On acid hydrolysis and identification with HPLC analysis, the presence of D-glucose was determined [
1,
2]. The
1H and
13C (DMSO-
d6,
Table 5) together with
1H
1H COSY, HSQC, HMBC, and HSQC-TOCSY spectra revealed it had the same aglycon, quercetin as
2–
4 [δ 6.38 (1H, d,
J = 2.0 Hz, H-6), 6.55 (1H, d,
J = 2.0 Hz, H-8), 6.88 (1H, d,
J = 8.5 Hz, H-5′), 7.57 (1H, d,
J = 2.0 Hz, H-2′), 7.58 (1H, dd,
J = 2.0, 8.5 Hz, H-6′), 12.63 (1H, br. s, 5-OH)]. On the other hand, there were four β-
d-glucopyranosyl groups [δ 3.99 (1H, d,
J = 7.5 Hz, H-1′′′′), 4.66 (1H, d,
J = 7.5 Hz, H-1′′′), 5.01 (1H, d,
J = 7.5 Hz, H-1′′′′′), 5.62 (1H, d,
J = 6.5 Hz, H-1′′)], and a sinapoyl [δ
H 3.75 (6H, s, 3′′′′′′,5′′′′′′-OCH
3), 6.26 (1H, d,
J = 16.0 Hz, H-8′′′′′′), 6.80 (2H, s, H-2′′′′′′,6′′′′′′), 7.36 (1H, d,
J = 16.0 Hz, H-7′′′′′′); δ
C 166.4 (C-9′′′′′′)]} in
5. There was one more β-
d-glucopyranosyl in
5 than in
4. Moreover, the
13C-NMR data of C-6′′ for
5 (δ
C 67.8) shifted to low field compared with that of
4 (δ
C 60.4), which indicated C-6′′ position might be substituted with β-
d-glucopyranosyl in
5. Meanwhile, in the HMBC experiment (
Figure 3), long-range correlation was observed between δ
H 3.99 (1H, d,
J = 7.5 Hz, H-1′′′′) and δ
C 67.8 (C-6′′). Finally, in the HSQC-TOCSY spectra, the correlations between δ
C 97.9 (C-1′′) and δ
H 3.25 (H-4′′), 3.32 (H-5′′), 3.50 (H-3′′), 3.52 (H-2′′), 5.62 (H-1′′); δ
H 3.78 (H-6b′′) and δ
C 67.8 (C-6′′), 69.2 (C-4′′), 76.3 (C-5′′); δ
C 104.5 (C-1′′′) and δ
H 3.16 (H-2′′′), 3.25 (H-4′′′), 3.26 (H-3′′′), 3.51 (H-5′′′), 4.66 (H-1′′′); δ
H 4.19, 4.30 (H
2-6′′′) and δ
C 63.1 (C-6′′′), 69.4 (C-4′′′), 73.8 (C-5′′′); δ
C 103.2 (C-1′′′′) and δ
H 2.80 (H-2′′′′), 2.85 (H-5′′′′), 2.90 (H-3′′′′), 2.98 (H-4′′′′), 3.99 (H-1′′′′); δ
C 60.7 (C-6′′′′) and δ
H 2.85 (H-5′′′′), 2.90 (H-3′′′′), 2.98 (H-4′′′′), 3.38, 3.54 (H
2-6′′′′); δ
C 99.8 (C-1′′′′′) and δ
H 3.19 (H-4′′′′′), 3.32 (H-3′′′′′), 3.27 (H-2′′′′′), 3.43 (H-5′′′′′), 5.01 (H-1′′′′′); δ
C 60.6 (C-6′′′′′) and δ
H 3.19 (H-4′′′′′), 3.32 (H-3′′′′′), 3.43 (H-5′′′′′), 3.49, 3.72 (H
2-6′′′′′) were observed, then the badly overlapped protons in sugar chemical shift range were assigned clearly. On the basis of above mentioned evidence, the structure of
5 was determined to be quercetin 3-
O-[β-
d-glucopyranosyl(1→6)]-β-
d-(6-
O-sinapoyl)-glucopyranosyl(1→2)-β-
d-glucopyranoside-7-
O-β-
d-glucopyranoside.
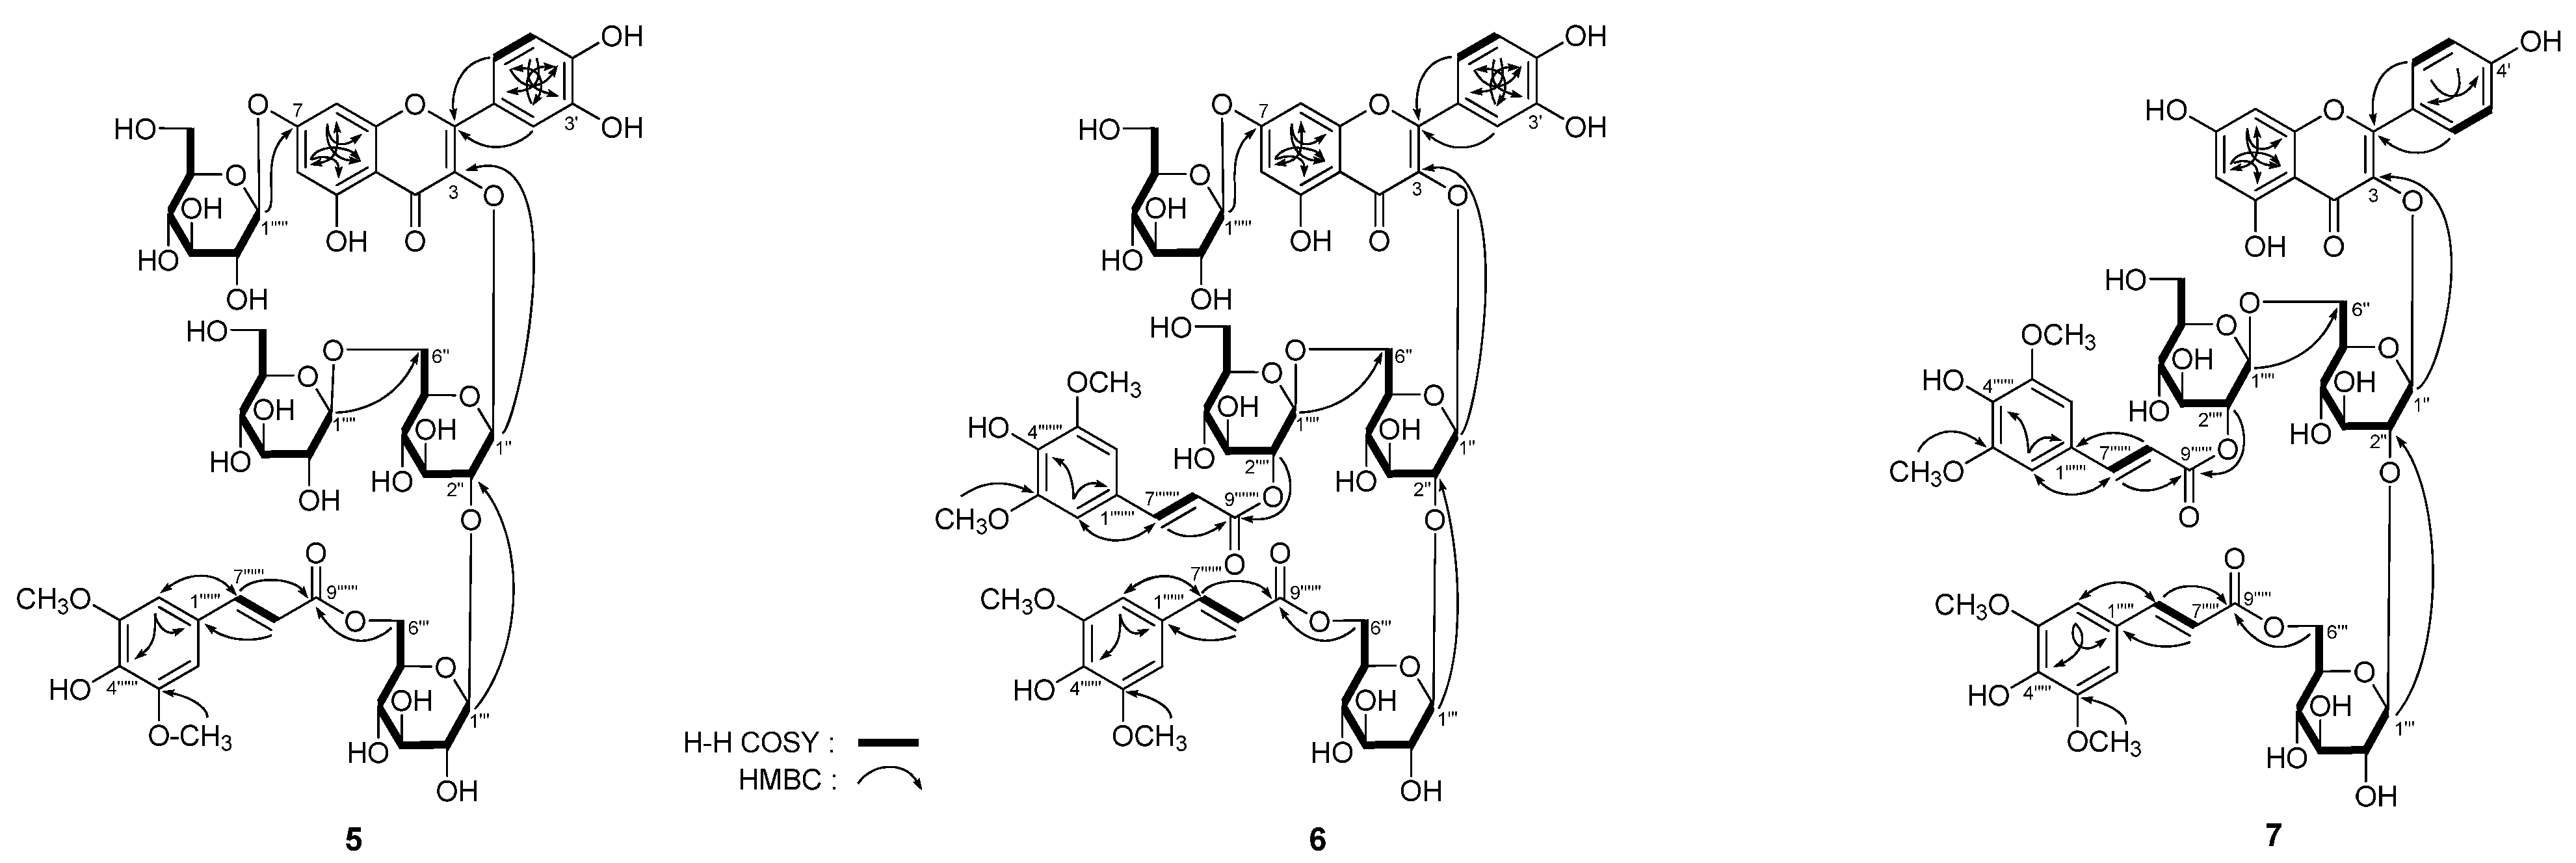
Figure 3.
The main 1H 1H COSY and HMBC correlations of 5–7.
Figure 3.
The main 1H 1H COSY and HMBC correlations of 5–7.
Table 5.
1H and 13C-NMR data for 5 in DMSO-d6 (500 MHz for 1H and 125 MHz for 13C).
Table 5.
1H and 13C-NMR data for 5 in DMSO-d6 (500 MHz for 1H and 125 MHz for 13C).
| No. | δC | δH (J in Hz) | No. | δC | δH (J in Hz) |
|---|
| 2 | 156.2 | - | 4′′′ | 69.4 | 3.25 (m, overlapped) |
| 3 | 133.1 | - | 5′′′ | 73.8 | 3.51 (m) |
| 4 | 177.3 | - | 6′′′ | 63.1 | 4.19 (br. d, ca. 12) |
| 5 | 160.7 | - | | | 4.30 (dd, 4.5, 12.0) |
| 6 | 99.2 | 6.38 (d, 2.0) | 1′′′′ | 103.2 | 3.99 (d, 7.5) |
| 7 | 162.6 | - | 2′′′′ | 73.1 | 2.80 (dd, 7.5, 8.0) |
| 8 | 94.3 | 6.55 (d, 2.0) | 3′′′′ | 76.2 | 2.90 (dd, 8.0, 9.0) |
| 9 | 155.7 | - | 4′′′′ | 69.6 | 2.98 (dd, 9.0, 9.0) |
| 10 | 105.5 | - | 5′′′′ | 76.4 | 2.85 (m) |
| 1′ | 120.8 | - | 6′′′′ | 60.7 | 3.38 (dd, 5.5, 11.5) |
| 2′ | 116.3 | 7.57 (d. 2.0) | | | 3.54 (br. d, ca. 12) |
| 3′ | 144.8 | - | 1′′′′′ | 99.8 | 5.01 (d, 7.5) |
| 4′ | 148.7 | - | 2′′′′′ | 73.1 | 3.27 (dd, 7.5, 8.0) |
| 5′ | 115.2 | 6.88 (d, 8.5) | 3′′′′′ | 76.2 | 3.32 (dd, 8.0, 9.0) |
| 6′ | 121.9 | 7.58 (dd, 2.0, 8.5) | 4′′′′′ | 69.5 | 3.19 (dd, 9.0, 9.0) |
| 5-OH | - | 12.63 (br. s) | 5′′′′′ | 77.0 | 3.43 (m) |
| 1′′ | 97.9 | 5.62 (d, 6.5) | 6′′′′′ | 60.6 | 3.49 (dd, 4.0, 11.5) |
| 2′′ | 83.2 | 3.52 (dd, 6.5, 8.0) | | | 3.72 (br. d, ca. 12) |
| 3′′ | 76.1 | 3.50 (dd, 8.0, 8.0) | 1′′′′′′ | 124.2 | - |
| 4′′ | 69.2 | 3.25 (m, overlapped) | 2′′′′′′,6′′′′′′ | 105.9 | 6.80 (s) |
| 5′′ | 76.3 | 3.32 (m) | 3′′′′′′,5′′′′′′ | 147.8 | - |
| 6′′ | 67.8 | 3.43 (dd, 5.5, 11.5) | 4′′′′′′ | 138.1 | - |
| | | 3.78 (dd, 3.5, 11.5) | 7′′′′′′ | 145.1 | 7.36 (d, 16.0) |
| 1′′′ | 104.5 | 4.66 (d, 7.5) | 8′′′′′′ | 114.3 | 6.26 (d, 16.0) |
| 2′′′ | 74.4 | 3.16 (dd, 7.5, 8.0) | 9′′′′′′ | 166.4 | - |
| 3′′′ | 76.2 | 3.26 (m, overlapped) | 3′′′′′′,5′′′′′′-OCH3 | 55.9 | 3.75 (s) |
Apetalumoside B12 (
6),
–84.0° (MeOH), was isolated as yellow powder. The molecular formula, C
61H
70O
35, of
6 was determined from negative-ion HRESI-TOF-MS (
m/
z 1361.3625 [M − H]
−, calcd for C
61H
69O
35 1361.3625). Acid hydrolysis of
6 with 1 M HCl liberated D-glucose [
1,
2]. Comparison the
1H and
13C (DMSO-
d6,
Table 6) spectra with those of
5, revealed there was another sinapoyl [δ
H 3.87 (6H, s, 3′′′′′′′,5′′′′′′′-OCH
3), 6.32 (1H, d,
J = 16.0 Hz, H-8′′′′′′′), 7.06 (2H, s, H-2′′′′′′′,6′′′′′′′), 7.50 (1H, d,
J = 16.0 Hz, H-7′′′′′′′); δ
C 165.5 (C-9′′′′′′′)] appeared in
6, and the
1H-NMR data of 2′′′′-position [δ
H 4.39 (1H, dd,
J = 8.0, 8.0 Hz, H-2′′′′)] shifted to low field relatived to that of
5 [δ
H 2.80 (1H, dd,
J = 7.5, 8.0 Hz, H-2′′′′). The above mentioned evidence suggested the another sinapoyl group linked with 2′′′′-position, which was certified by the long-range correlation between δ
H 4.39 (H-2′′′′) and δ
C 165.5 (C-9′′′′′′′) observed in the HMBC experiment. In conjunction with analysis of HSQC and HSQC-TOCSY spectra, the
1H and
13C-NMR data for
6 were assigned. Finally, the structure of apetalumoside B
12 (
6) was clarified to be quercetin 3-
O-[β-
d-(2-
O-sinapoyl)-glucopyranosyl(1→6)]-β-
d-(6-
O-sinapoyl)-glucopyranosyl(1→2)-β-
d-glucopyranoside-7-
O-β-
d-glucopyranoside.
Table 6.
1H and 13C-NMR data for 6 in DMSO-d6 (500 MHz for 1H and 125 MHz for 13C).
Table 6.
1H and 13C-NMR data for 6 in DMSO-d6 (500 MHz for 1H and 125 MHz for 13C).
| No. | δC | δH (J in Hz) | No. | δC | δH (J in Hz) |
|---|
| 2 | 156.8 | - | 1′′′′ | 100.2 | 4.22 (d, 8.0) |
| 3 | 132.8 | - | 2′′′′ | 73.4 | 4.39 (dd, 8.0, 8.0) |
| 4 | 177.4 | - | 3′′′′ | 74.0 | 2.71 (dd, 8.0, 8.0) |
| 5 | 160.8 | - | 4′′′′ | 69.6 | 3.11 (dd, 8.0, 9.5) |
| 6 | 99.3 | 6.40 (d, 1.5) | 5′′′′ | 76.3 | 2.68 (m) |
| 7 | 162.7 | - | 6′′′′ | 60.1 | 3.44 (m, overlapped) |
| 8 | 94.8 | 6.51 (d, 1.5) | | | 3.48 (m, overlapped) |
| 9 | 155.5 | - | 1′′′′′ | 100.0 | 5.00 (d, 7.5) |
| 10 | 105.5 | - | 2′′′′′ | 73.1 | 3.26 (dd, 7.5, 7.5) |
| 1′ | 120.7 | - | 3′′′′′ | 76.2 | 3.30 (dd, 7.5, 8.5) |
| 2′ | 116.3 | 7.58 (d, 1.5) | 4′′′′′ | 69.6 | 3.16 (dd, 7.5, 8.5) |
| 3′ | 144.8 | - | 5′′′′′ | 77.0 | 3.40 (m) |
| 4′ | 148.8 | - | 6′′′′′ | 60.6 | 3.48 (m, overlapped) |
| 5′ | 115.2 | 6.86 (d, 8.5) | | | 3.75 (br. d, ca. 12) |
| 6′ | 121.7 | 7.51 (dd, 1.5, 8.5) | 1′′′′′′ | 124.1 | - |
| 5-OH | - | 12.76 (br. s) | 2′′′′′′,6′′′′′′ | 105.8 | 6.76 (s) |
| 1′′ | 97.8 | 5.67 (d, 7.5) | 3′′′′′′,5′′′′′′ | 147.8 | - |
| 2′′ | 82.8 | 3.48 (m, overlapped) | 4′′′′′′ | 138.1 | - |
| 3′′ | 76.0 | 3.38 (dd, 7.5, 8.0) | 7′′′′′′ | 145.2 | 7.33 (d, 16.0) |
| 4′′ | 69.1 | 3.01 (dd, 8.0, 9.0) | 8′′′′′′ | 114.3 | 6.22 (d, 16.0) |
| 5′′ | 78.1 | 3.14 (m) | 9′′′′′′ | 166.3 | - |
| 6′′ | 66.7 | 3.45 (m, overlapped) | 3′′′′′′,5′′′′′′-OCH3 | 55.9 | 3.73 (s) |
| | | 3.67 (br. d, ca. 13) | 1′′′′′′′ | 124.5 | - |
| 1′′′ | 104.4 | 4.61 (d, 7.5) | 2′′′′′′′,6′′′′′′′ | 105.9 | 7.06 (s) |
| 2′′′ | 74.4 | 3.13 (dd, 7.5, 8.0) | 3′′′′′′′,5′′′′′′′ | 148.1 | - |
| 3′′′ | 76.2 | 3.24 (dd, 8.0, 8.0) | 4′′′′′′′ | 138.2 | - |
| 4′′′ | 69.5 | 3.23 (dd, 8.0, 8.0) | 7′′′′′′′ | 145.1 | 7.50 (d, 16.0) |
| 5′′′ | 73.8 | 3.41 (m) | 8′′′′′′′ | 114.9 | 6.32 (d, 16.0) |
| 6′′′ | 63.2 | 4.15 (br. d, ca. 11) | 9′′′′′′′ | 165.5 | - |
| | | 4.28 (dd, 6.5, 11.0) | 3′′′′′′′,5′′′′′′′-OCH3 | 56.1 | 3.87 (s) |
Apetalumoside C1 (
7),
–47.2° (MeOH). Negative-ion HRESI-TOF-MS determination suggested the molecular formula of it was C
55H
60O
29 (
m/
z 1183.3123 [M − H]
−, calcd for C
55H
59O
29 1183.3147). Treated
7 with 1 M HCl to yield D-glucose [
1,
2]. The proton and carbon signals in
1H and
13C-NMR spectra (DMSO-
d6,
Table 7) were very similar to those of
1, except for the signals due to the aglycon, kaempferol [δ 6.14 (1H, br. s, H-6), 6.27 (1H, br. s, H-8), 6.85 (2H, d,
J = 8.5 Hz, H-3′,5′), 7.93 (2H, d,
J = 8.5 Hz, H-2′,6′), 12.72 (1H, br. s, 5-OH)]. The linkage positions of sugar parts with aglycon and two sinapoyl groups were determined by the HMBC experiment, which showed long-range correlations between δ
H 5.58 (1H, d,
J = 6.5 Hz, H-1′′) and δ
C 132.5 (C-3); δ
H 4.62 (1H, d,
J = 7.5 Hz, H-1′′′) and δ
C 82.0 (C-2′′); δ
H 4.26 (1H, d,
J = 8.0 Hz, H-1′′′′) and δ
C 66.7 (C-6′′); δ
H [4.17 (1H, br. d,
ca. J = 12 Hz), 4.28 (1H, dd,
J = 5.5, 11.5 Hz), H
2-6′′′] and δ
C 166.4 (C-9′′′′′); δ
H 4.43 (1H, dd,
J = 8.0, 9.0 Hz, H-2′′′′) and δ
C 165.4 (C-9′′′′′′). Moreover, the
1H-NMR data for four β-
d-glucopyranosyl groups were assigned by HSQC and HSQC-TOCSY determination. On the basis of above mentioned evidence, the structure of apetalumoside C
1 (
7) was elucidated as kaempferol 3-
O-[β-
d-(2-
O-sinapoyl)-glucopyranosyl(1→6)]-β-
d-(6-
O-sinapoyl)-glucopyranosyl(1→2)-β-
d-glucopyranoside.
Table 7.
1H and 13C-NMR data for 7 in DMSO-d6 (500 MHz for 1H and 125 MHz for 13C).
Table 7.
1H and 13C-NMR data for 7 in DMSO-d6 (500 MHz for 1H and 125 MHz for 13C).
| No. | δC | δH (J in Hz) | No. | δC | δH (J in Hz) |
|---|
| 2 | 156.1 | - | 6′′′ | 63.2 | 4.17 (br. d, ca. 12) |
| 3 | 132.5 | - | | | 4.28 (dd, 5.5, 11.5) |
| 4 | 177.3 | - | 1′′′′ | 100.2 | 4.26 (d, 8.0) |
| 5 | 161.1 | - | 2′′′′ | 73.6 | 4.43 (dd, 8.0, 9.0) |
| 6 | 98.9 | 6.14 (br. s) | 3′′′′ | 74.2 | 2.86 (dd, 9.0, 9.0) |
| 7 | 164.5 | - | 4′′′′ | 69.9 | 3.11 (dd, 9.0, 9.0) |
| 8 | 93.8 | 6.27 (br. s) | 5′′′′ | 76.5 | 2.78 (m) |
| 9 | 156.2 | - | 6′′′′ | 60.4 | 3.40 (m, overlapped) |
| 10 | 103.7 | - | | | 3.52 (br. d, ca. 12) |
| 1′ | 120.6 | - | 1′′′′′ | 124.2 | - |
| 2′,6′ | 130.7 | 7.93 (d, 8.5) | 2′′′′′,6′′′′′ | 106.0 | 6.79 (s) |
| 3′,5′ | 115.1 | 6.85 (d, 8.5) | 3′′′′′,5′′′′′ | 147.8 | - |
| 4′ | 159.9 | - | 4′′′′′ | 138.2 | - |
| 5-OH | - | 12.72 (br. s) | 7′′′′′ | 145.1 | 7.37 (d, 15.5) |
| 1′′ | 97.9 | 5.58 (d, 6.5) | 8′′′′′ | 114.4 | 6.27 (d, 15.5) |
| 2′′ | 82.0 | 3.41 (dd, 6.5, 8.0) | 9′′′′′ | 166.4 | - |
| 3′′ | 76.2 | 3.40 (dd, 8.0, 9.0) | 3′′′′′,5′′′′′-OCH3 | 55.9 | 3.73 (s) |
| 4′′ | 69.2 | 3.01 (dd, 9.0, 9.0) | 1′′′′′′ | 124.5 | - |
| 5′′ | 77.8 | 3.13 (m) | 2′′′′′′,6′′′′′′ | 106.0 | 7.05 (s) |
| 6′′ | 66.7 | 3.44 (dd, 6.5, 12.0) | 3′′′′′′,5′′′′′′ | 148.1 | - |
| | | 3.68 (br. d, ca. 12) | 4′′′′′′ | 138.3 | - |
| 1′′′ | 103.9 | 4.62 (d, 7.5) | 7′′′′′′ | 145.1 | 7.49 (d, 16.0) |
| 2′′′ | 74.3 | 3.11 (dd, 7.5, 9.0) | 8′′′′′′ | 115.0 | 6.29 (d, 16.0) |
| 3′′′ | 76.3 | 3.21 (dd, 9.0, 9.0) | 9′′′′′′ | 165.4 | - |
| 4′′′ | 69.5 | 3.23 (dd, 9.0, 9.0) | 3′′′′′′,5′′′′′′-OCH3 | 56.1 | 3.87 (s) |
| 5′′′ | 73.8 | 3.35 (m) | | | |


