
Factors Influencing Oral Bioavailability of Thai Mango Seed Kernel Extract and Its Key Phenolic Principles

Abstract
: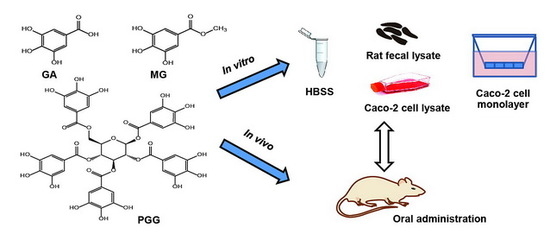
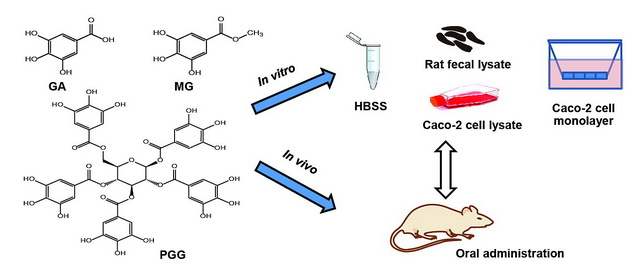
1. Introduction
2. Results and Discussion
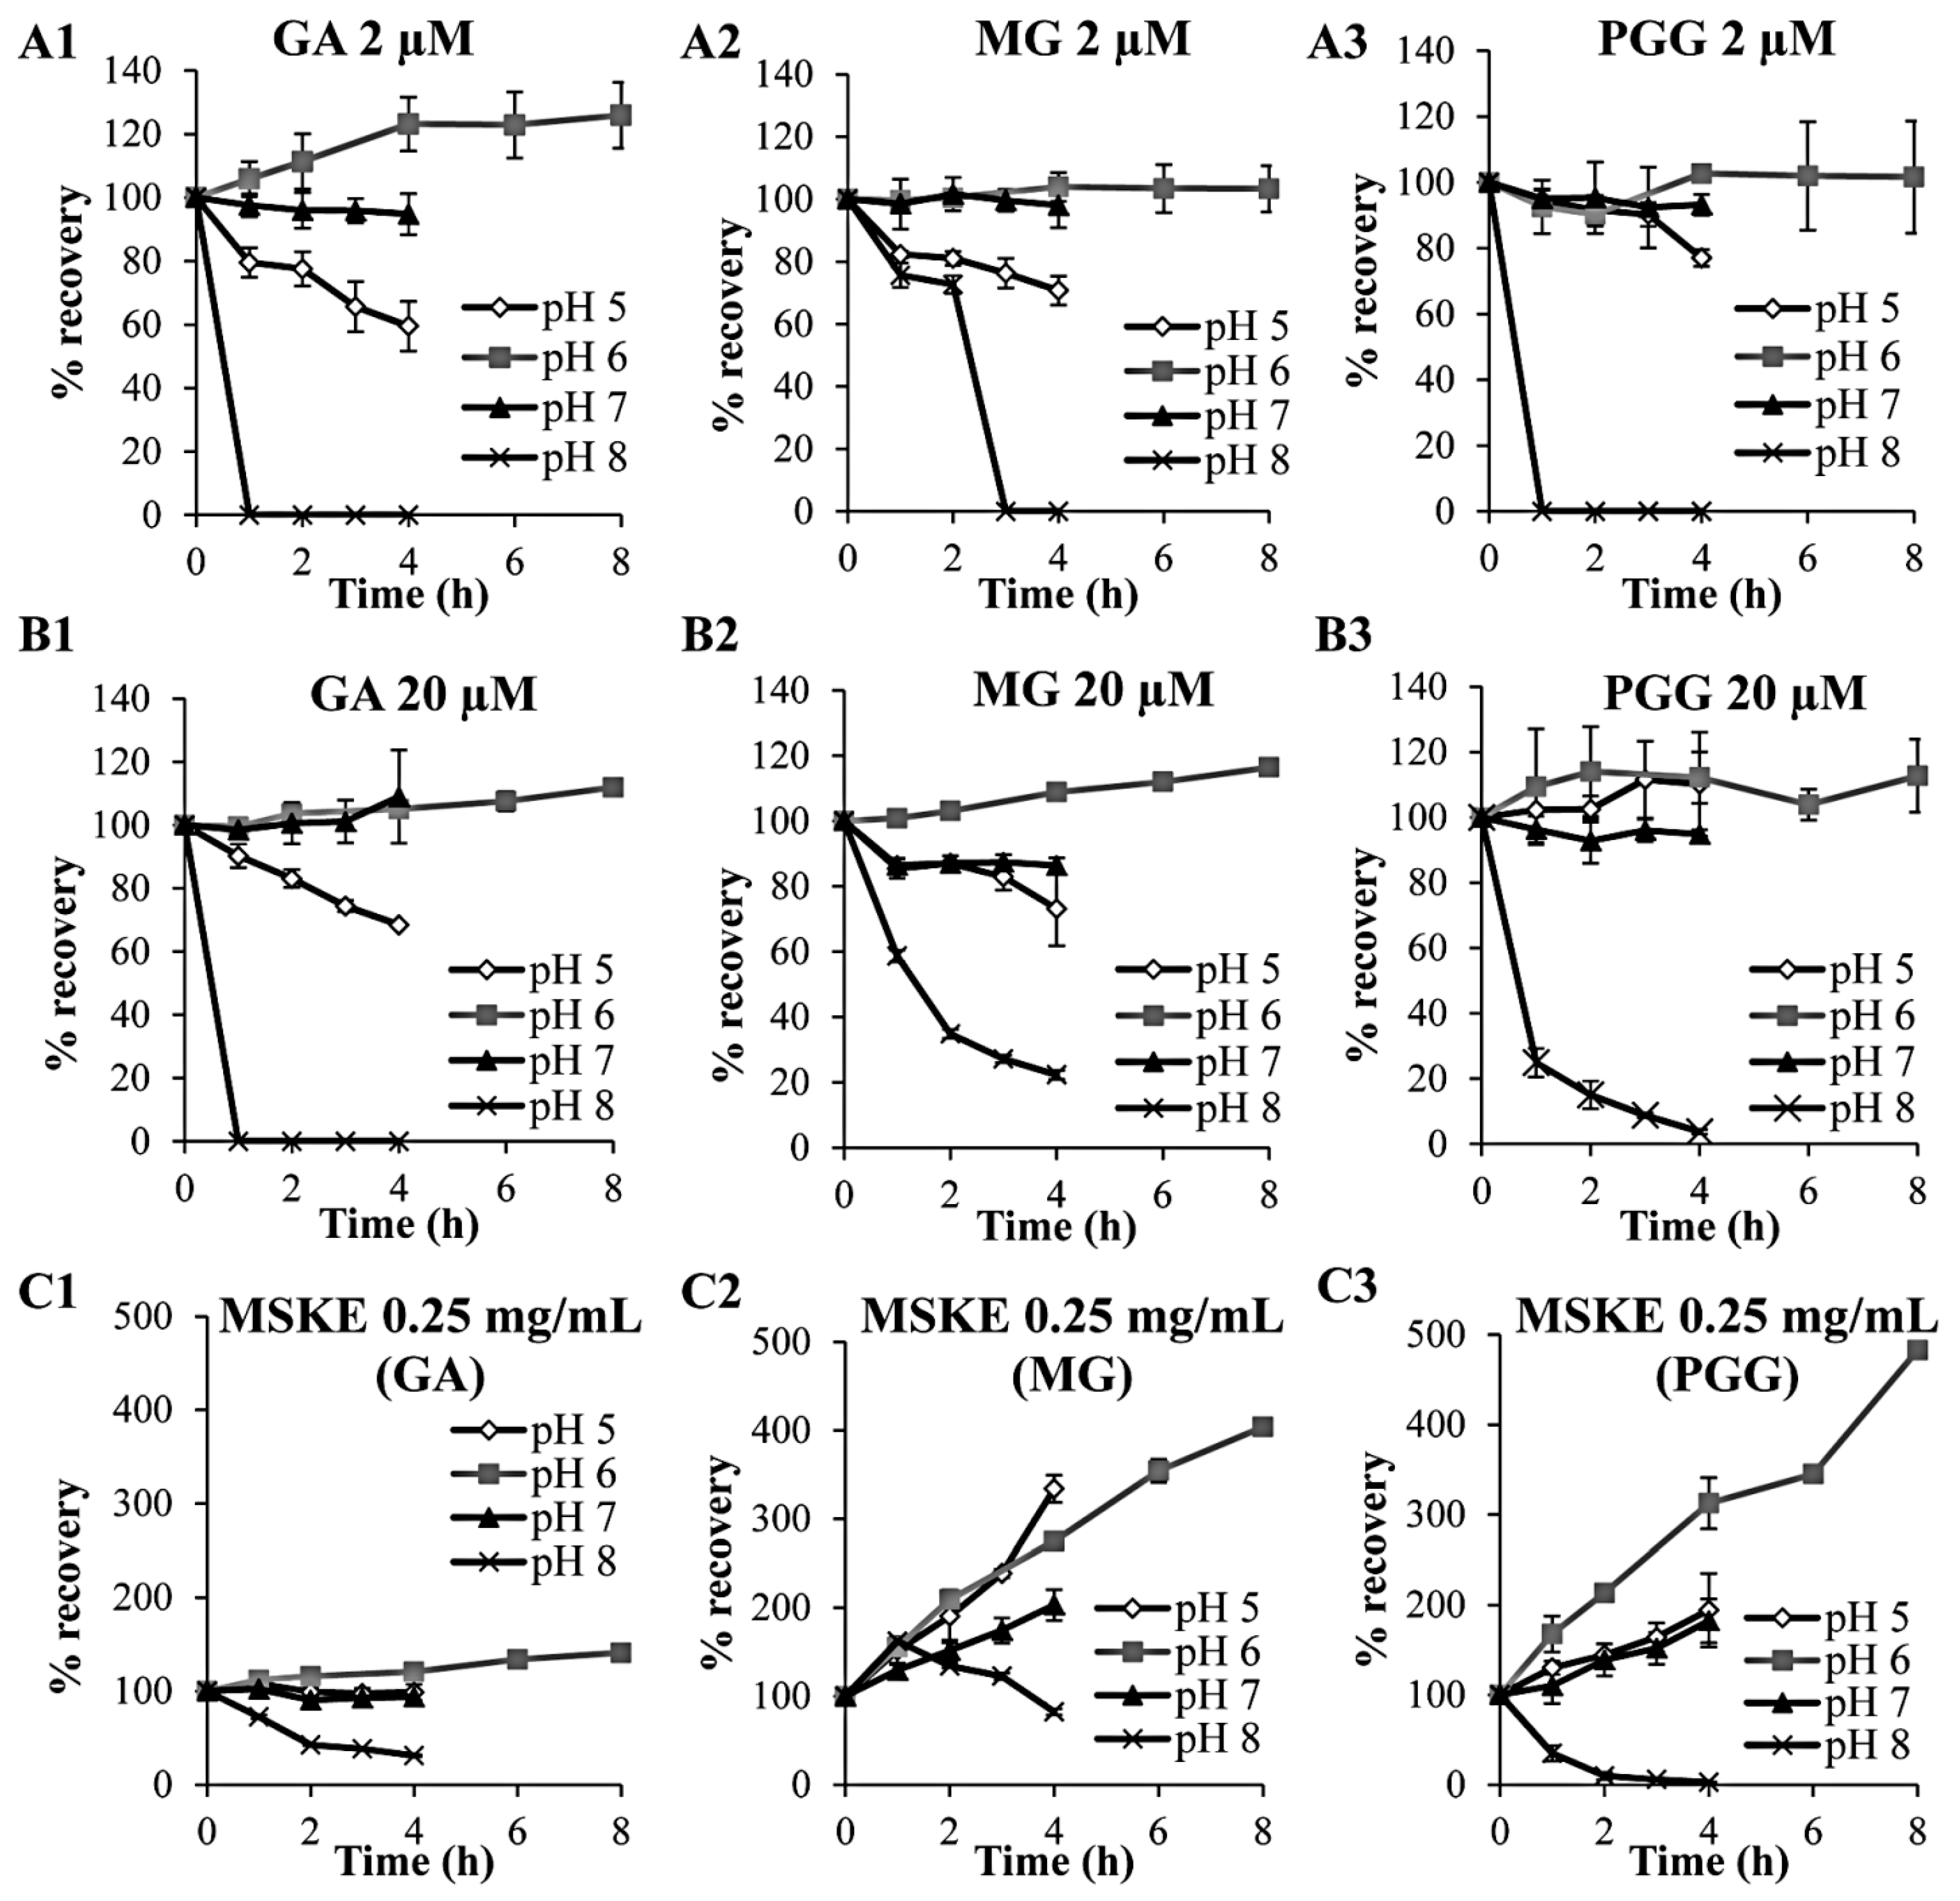
2.1. Chemical Stability in Hanks’ Balanced Salt Solution (HBSS) at pH 5, 6, 7 and 8
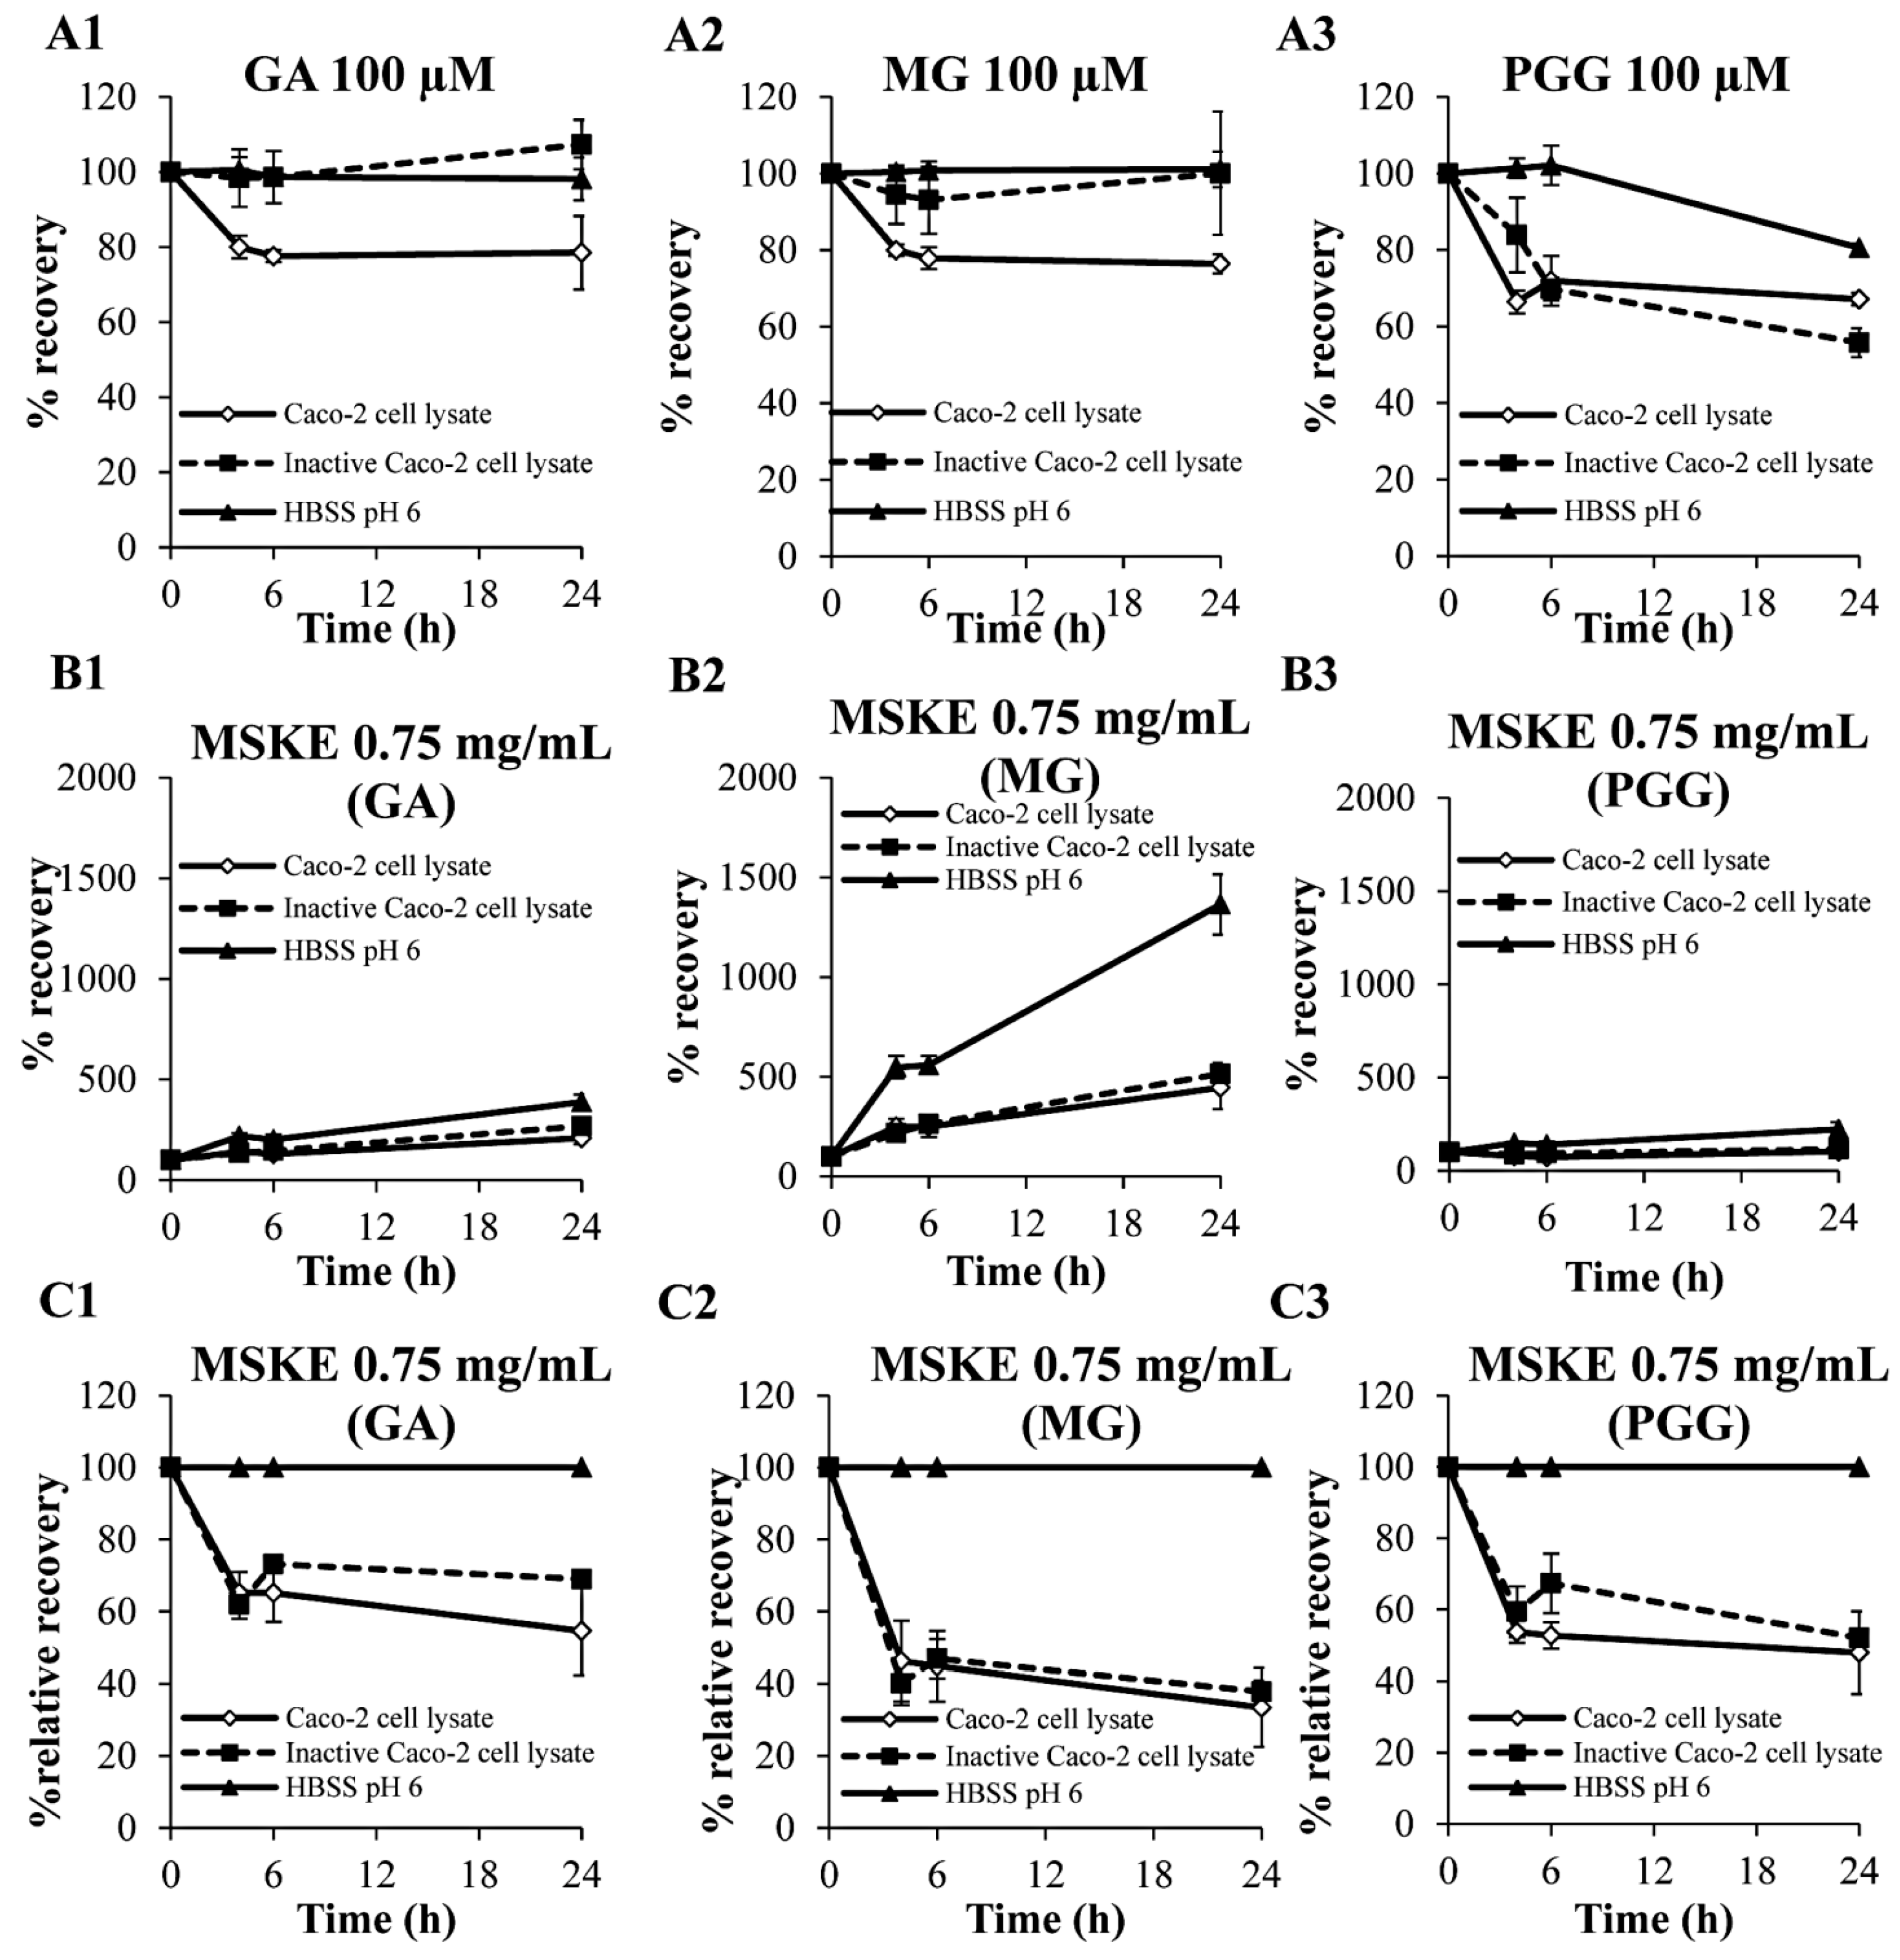
2.2. Biological Stability in Caco-2 Cell Lysates
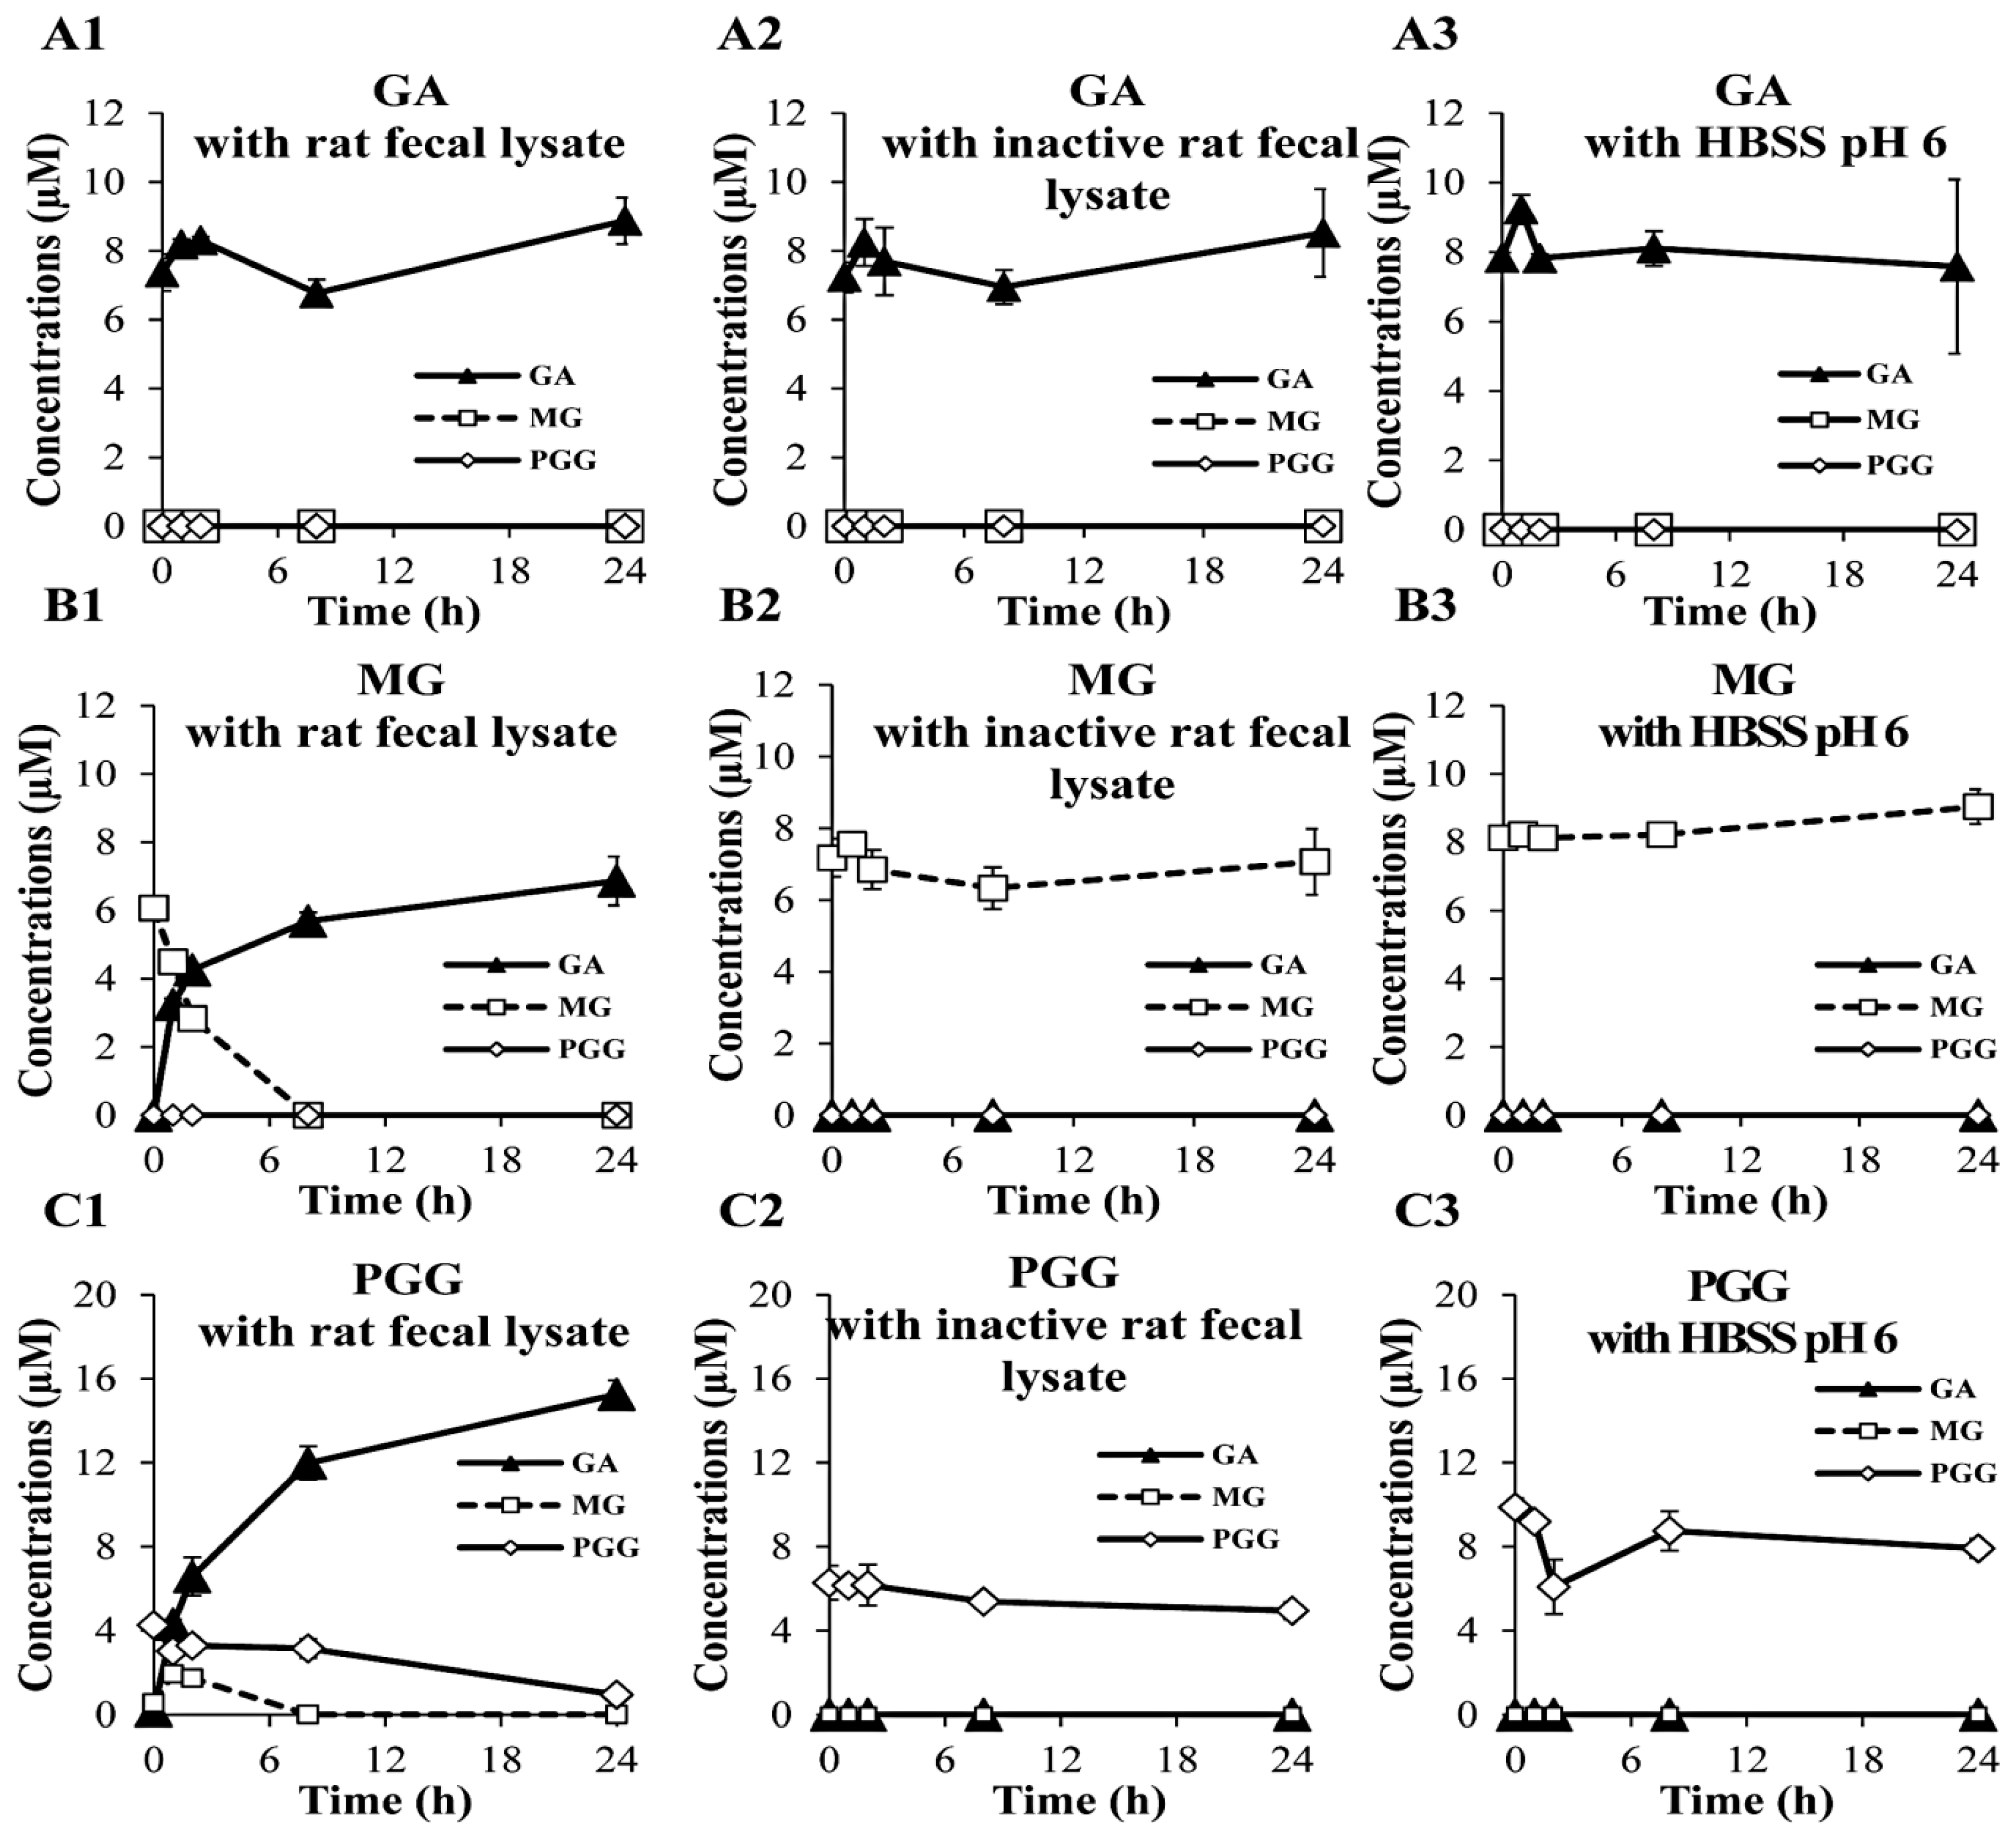
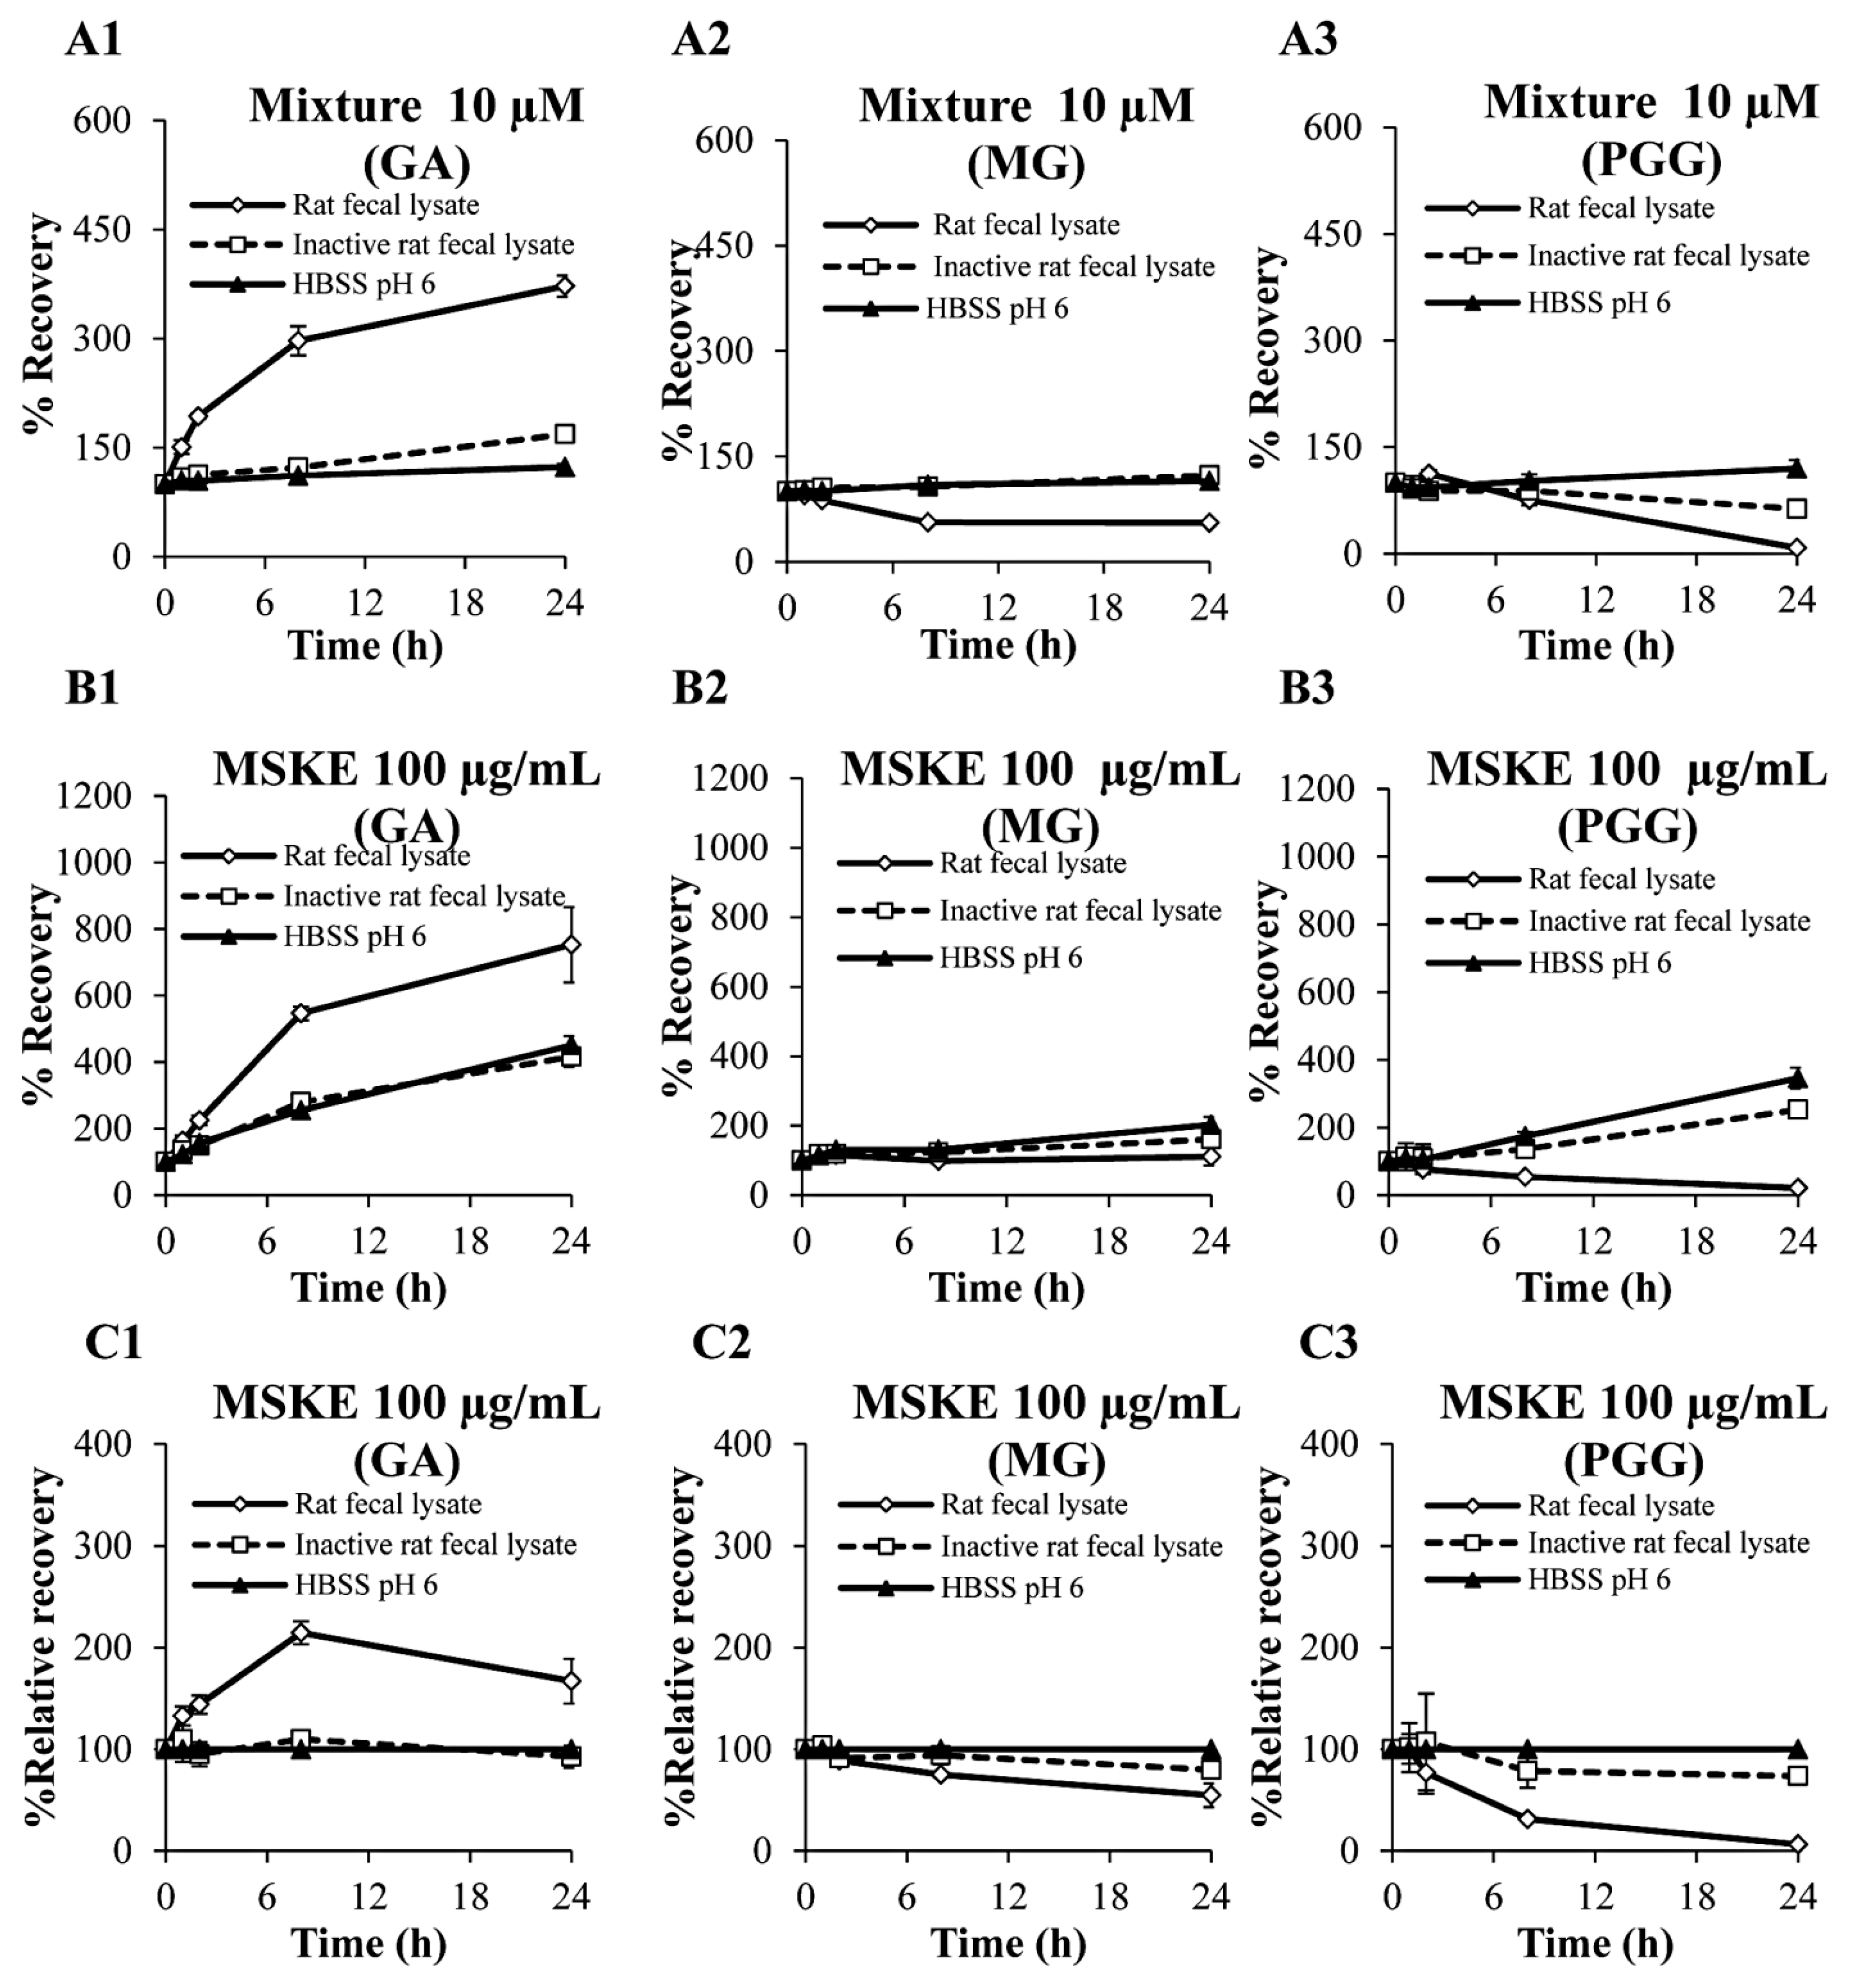
2.3. Biological Stability in Rat Fecal Lysates

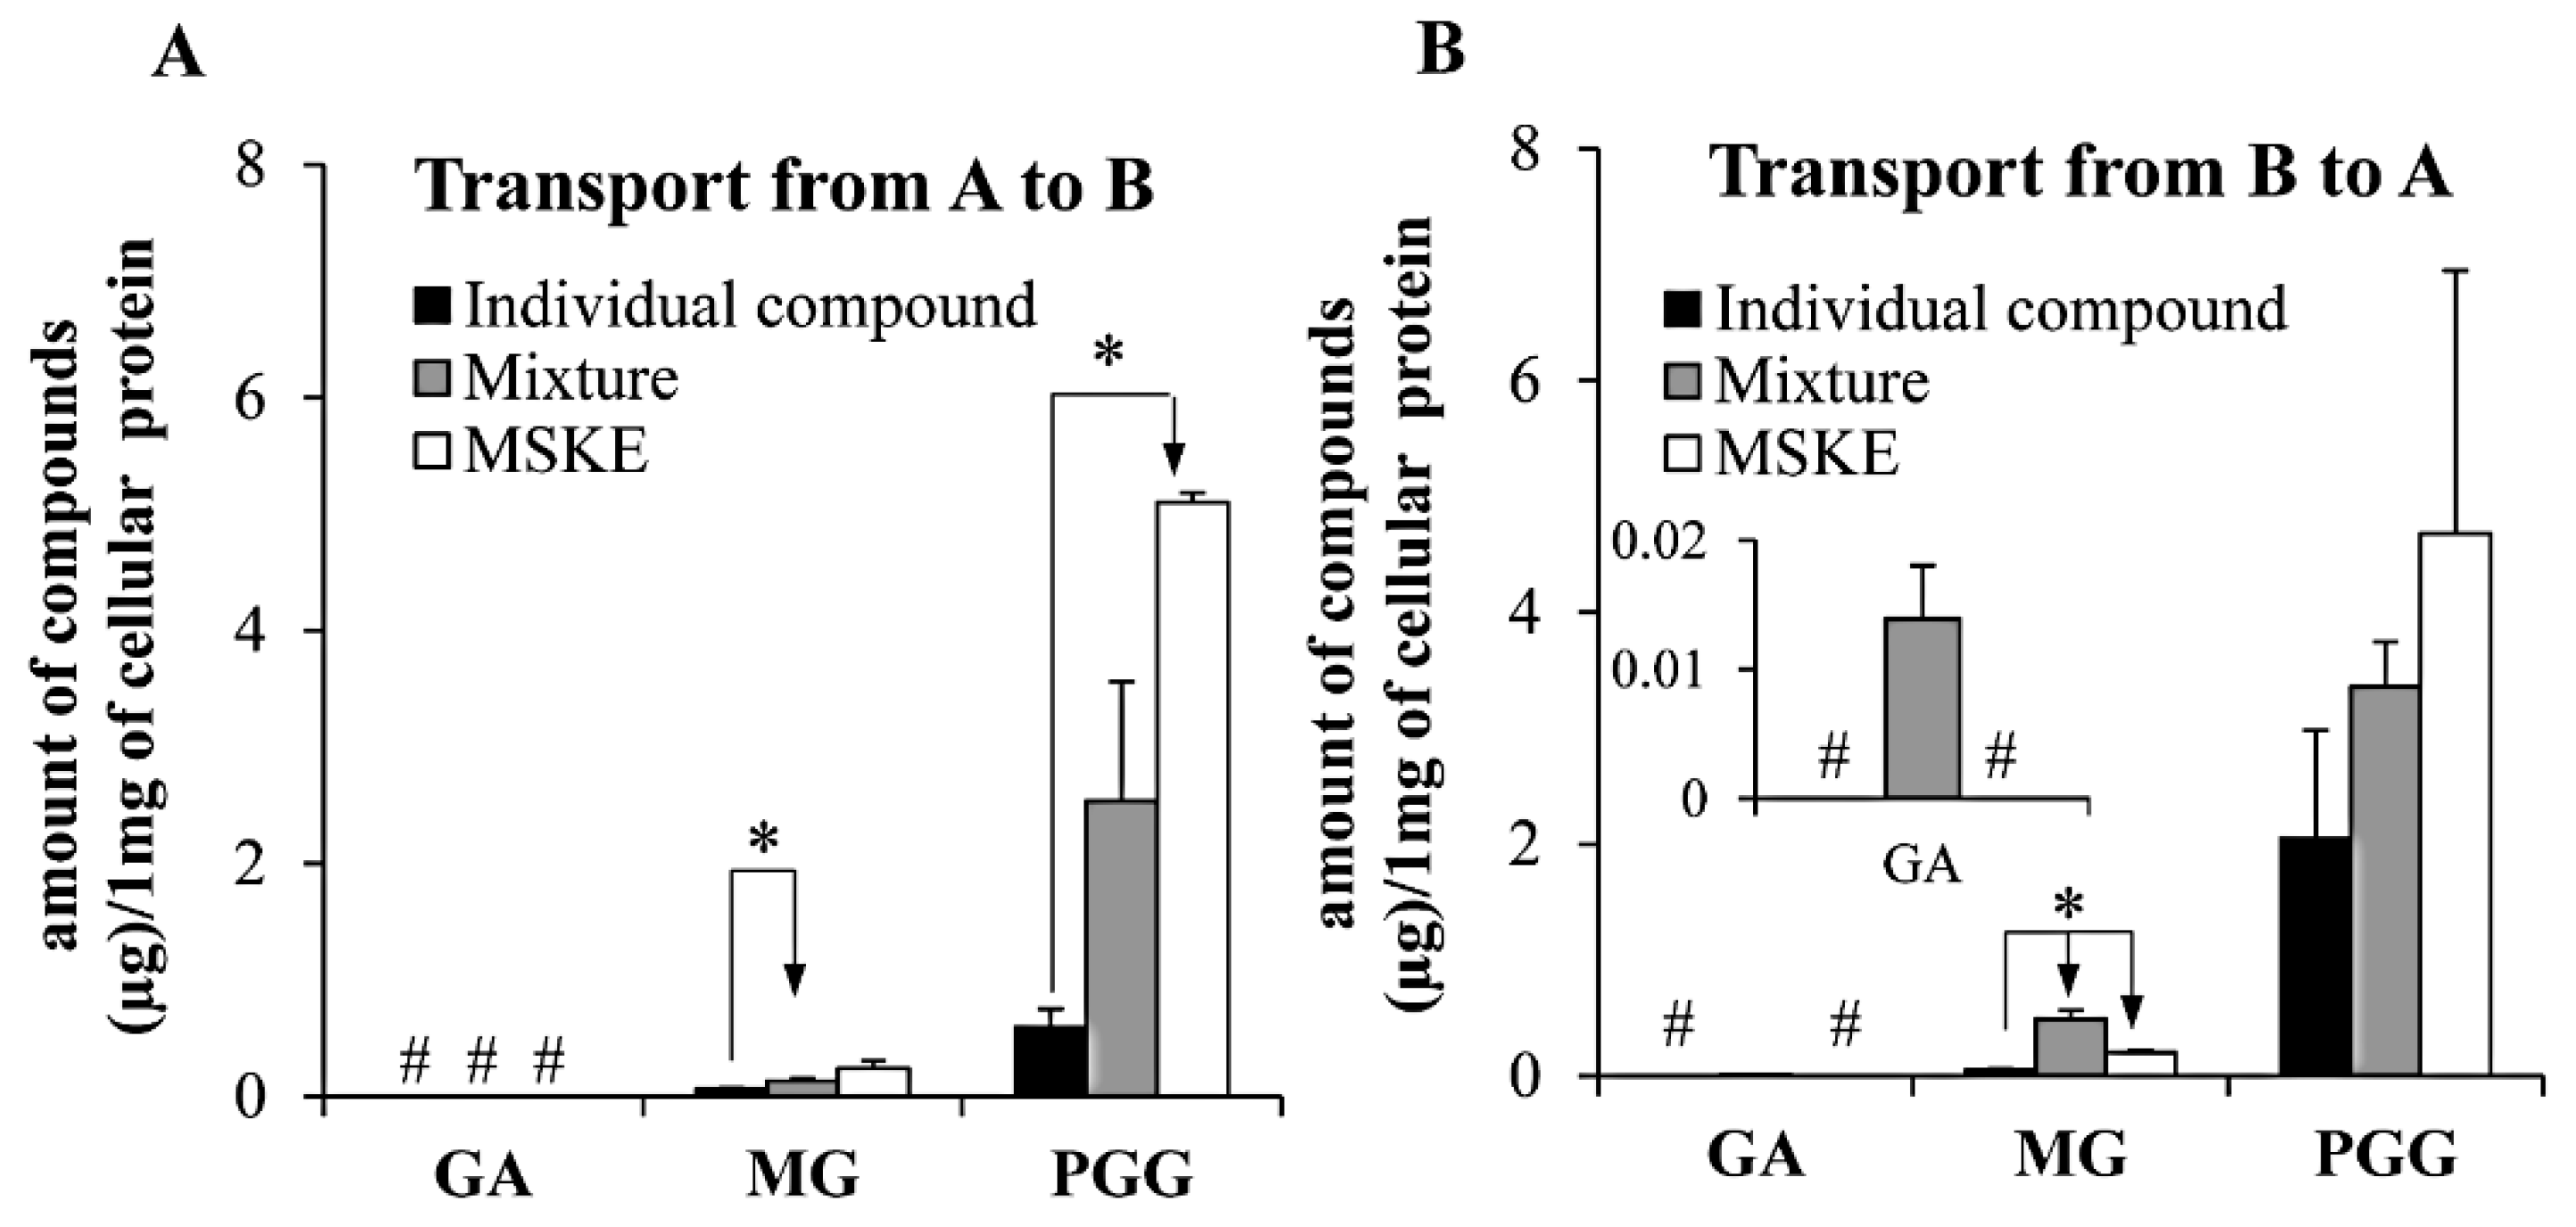
2.4. Caco-2 Transepithelial Transport Experiment
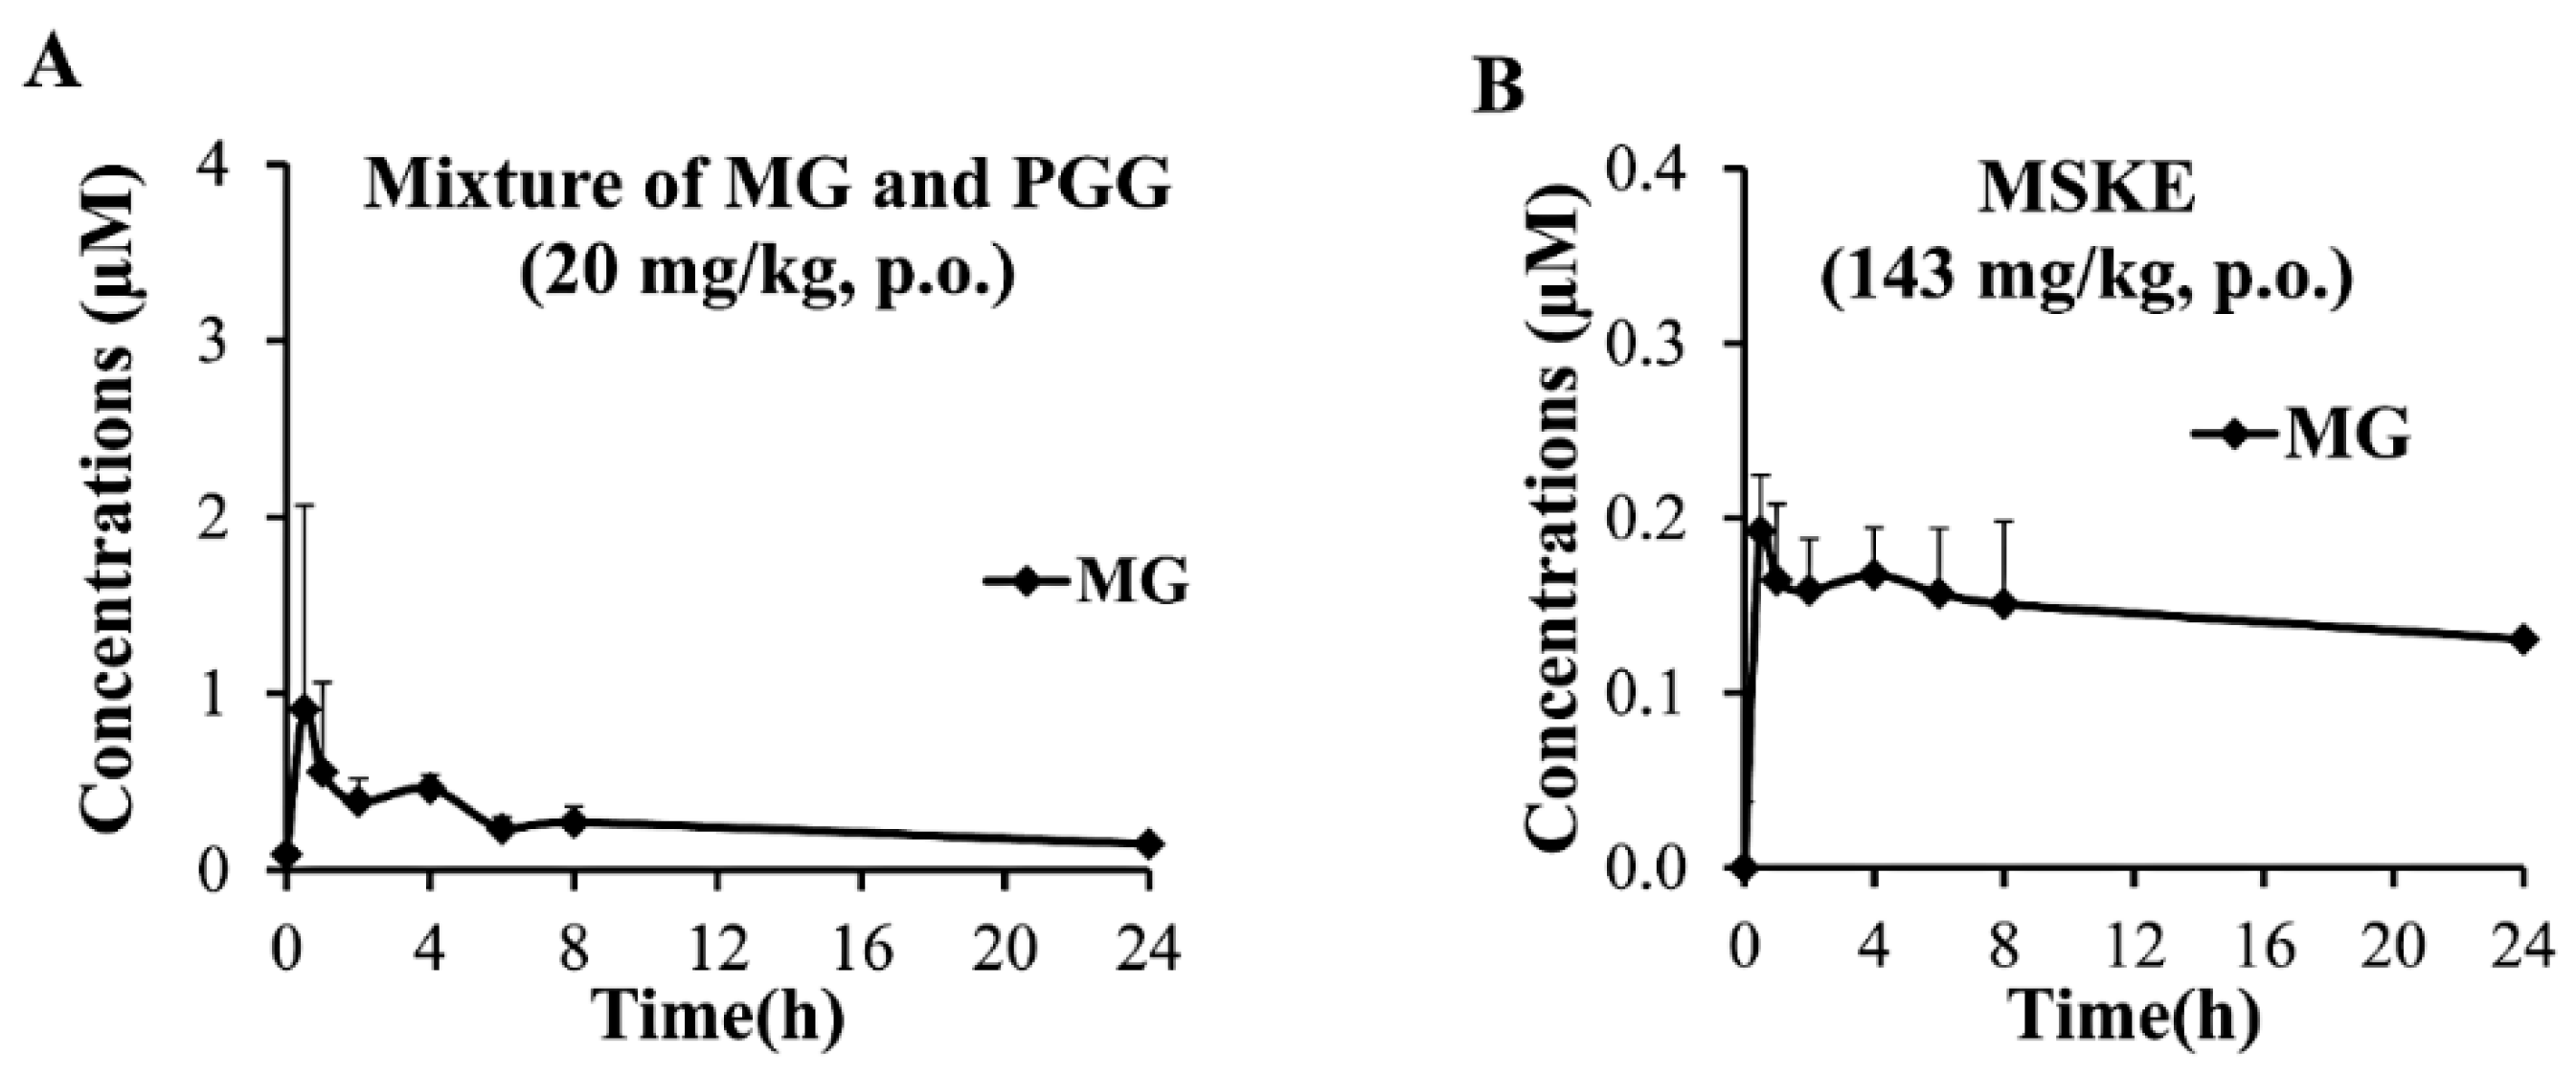
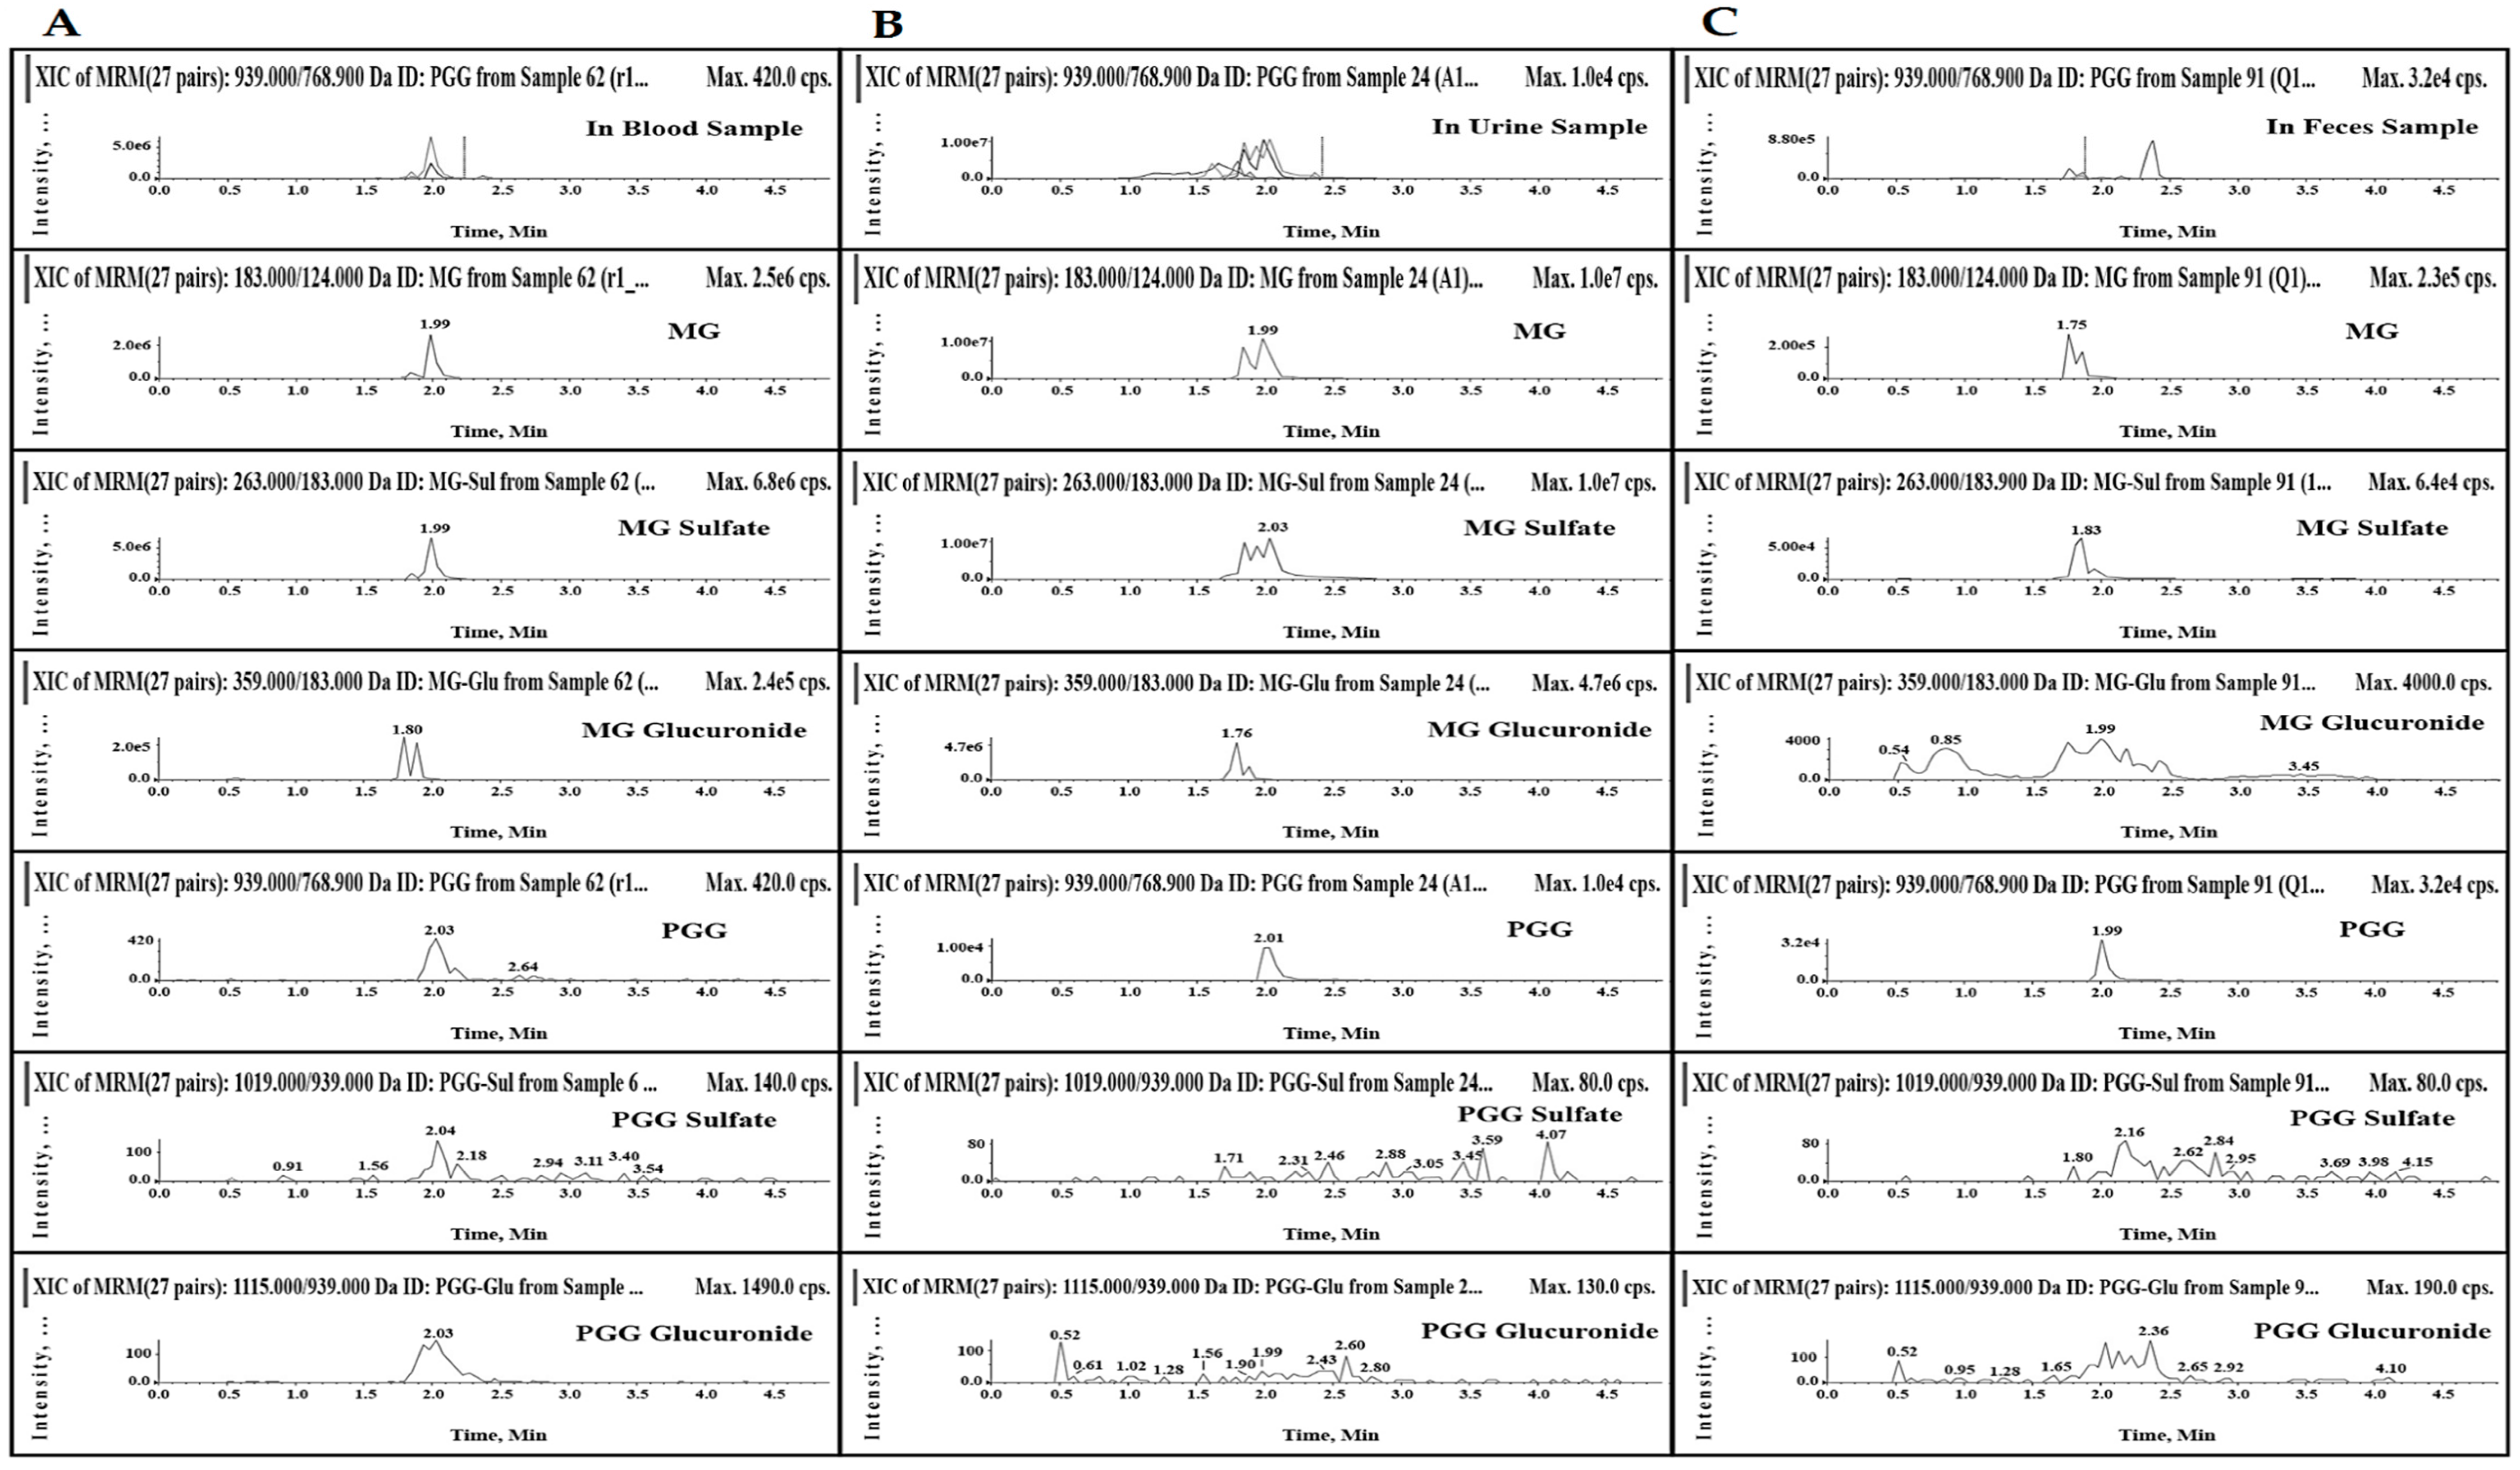
2.5. In Vivo Oral Pharmacokinetic Studies

| Analytes | Individual a (20 μM) | Mixture a (20 μM) | MSKE a (0.25 mg/mL) | ||||||
|---|---|---|---|---|---|---|---|---|---|
| Papp ± S.D. (×10−6 cm/s) | Efflux Ratios | Papp ± S.D. (×10−6 cm/s) | Efflux Ratios | Papp ± S.D. (×10−6 cm/s) | Efflux Ratios | ||||
| A to B | B to A | A to B | B to A | A to B | B to A | ||||
| GA | 1.02 ± 0.36 | 1.02 ± 0.29 | 1.00 | 0.35 ± 0.18 b | 1.87 ± 0.47 | 5.34 | 1.46 ± 0.21 | 8.04 ± 0.43 b | 5.51 |
| MG | 13.57 ± 0.40 | 7.02 ± 1.11 | 0.52 | 12.46 ± 0.63 | 6.33 ± 0.57 | 0.51 | 17.61 ± 1.54 b | 11.30 ± 0.31 b | 0.66 |
| PGG c | 0.28 ± 0.14 | 0.94 ± 0.14 | 3.36 | 0.12 ± 0.09 | 0.58 ± 0.06 b | 4.83 | 0.83 ± 0.17 b | 4.20 ± 0.11 b | 5.06 |
| Pharmacokinetic Parameters | Mixture of MG and PGG (20 mg/kg) | MSKE (143 mg/kg; 20 mg/kg PGG and 0.13 mg/kg MG) | |||
|---|---|---|---|---|---|
| i.p. (n = 5) b | p.o. a | p.o. a | |||
| MG | MG | PGG | MG | PGG | |
| Tmax (h) | 0.85 ± 0.70 | 2.30 ± 1.64 | ND | 0.50 ± 0.00 | ND |
| Cmax (µM) | 34.72 ± 17.32 | 1.13 ± 1.06 | ND | 0.24 ± 0.06 | ND |
| AUC0–24h (h·µM) | 109.9 0 ± 73.40 | 6.47 ± 0.75 | ND | 3.57 ± 0.79 | ND |
| Ke (1/h) | 0.056 ± 0.032 | 0.036 ± 0.016 | ND | 0.015 ± 0.008 | ND |
| t1/2 (h) | 17.50 ± 12.25 | 24.84 ± 15.71 | ND | 65.17 ± 49.35 | ND |
| Vd (L/kg) | 530.95 ± 247.54 | 10,246.44 ± 2660.70 | ND | 135.39 ± 21.94 | ND |
| CL (L/h/kg) | 159.91 ± 76.05 | 332.06 ± 99.72 | ND | 2.11 ± 1.26 | ND |
| MRTlast (h) | 8.71 ± 2.53 | 8.69 ± 1.57 | ND | 11.06 ± 0.60 | ND |

| Total Mass (µg) | Analytes | Oral Administration a | |
|---|---|---|---|
| Mixture of MG and PGG (20 mg/kg) | MSKE (143 mg/kg; 20 mg/kg PGG and 0.13 mg/kg MG) | ||
| Urine (0−24 h) | GA | 42.95 ± 26.88 | 54.54 ± 26.59 |
| MG | 100.36 ± 74.67 | 9.81 ± 2.81 b | |
| PGG | 3.73 ± 1.41 | 3.02 ± 0.92 | |
| Feces (0−24 h) | GA | 9.64 ± 1.91 | 39.47 ± 17.44 b |
| MG | 3.25 ± 1.73 | 18.35 ± 10.14 b | |
| PGG | 28.20 ± 10.14 | 85.66 ± 25.53 b | |
| % recovery | MG | 1.89 ± 1.39 | 73.38 ± 29.98 b |
| PGG | 0.56 ± 0.15 | 2.61 ± 2.66 | |
3. Experimental Section
3.1. Materials
3.2. Preparation of MSKE
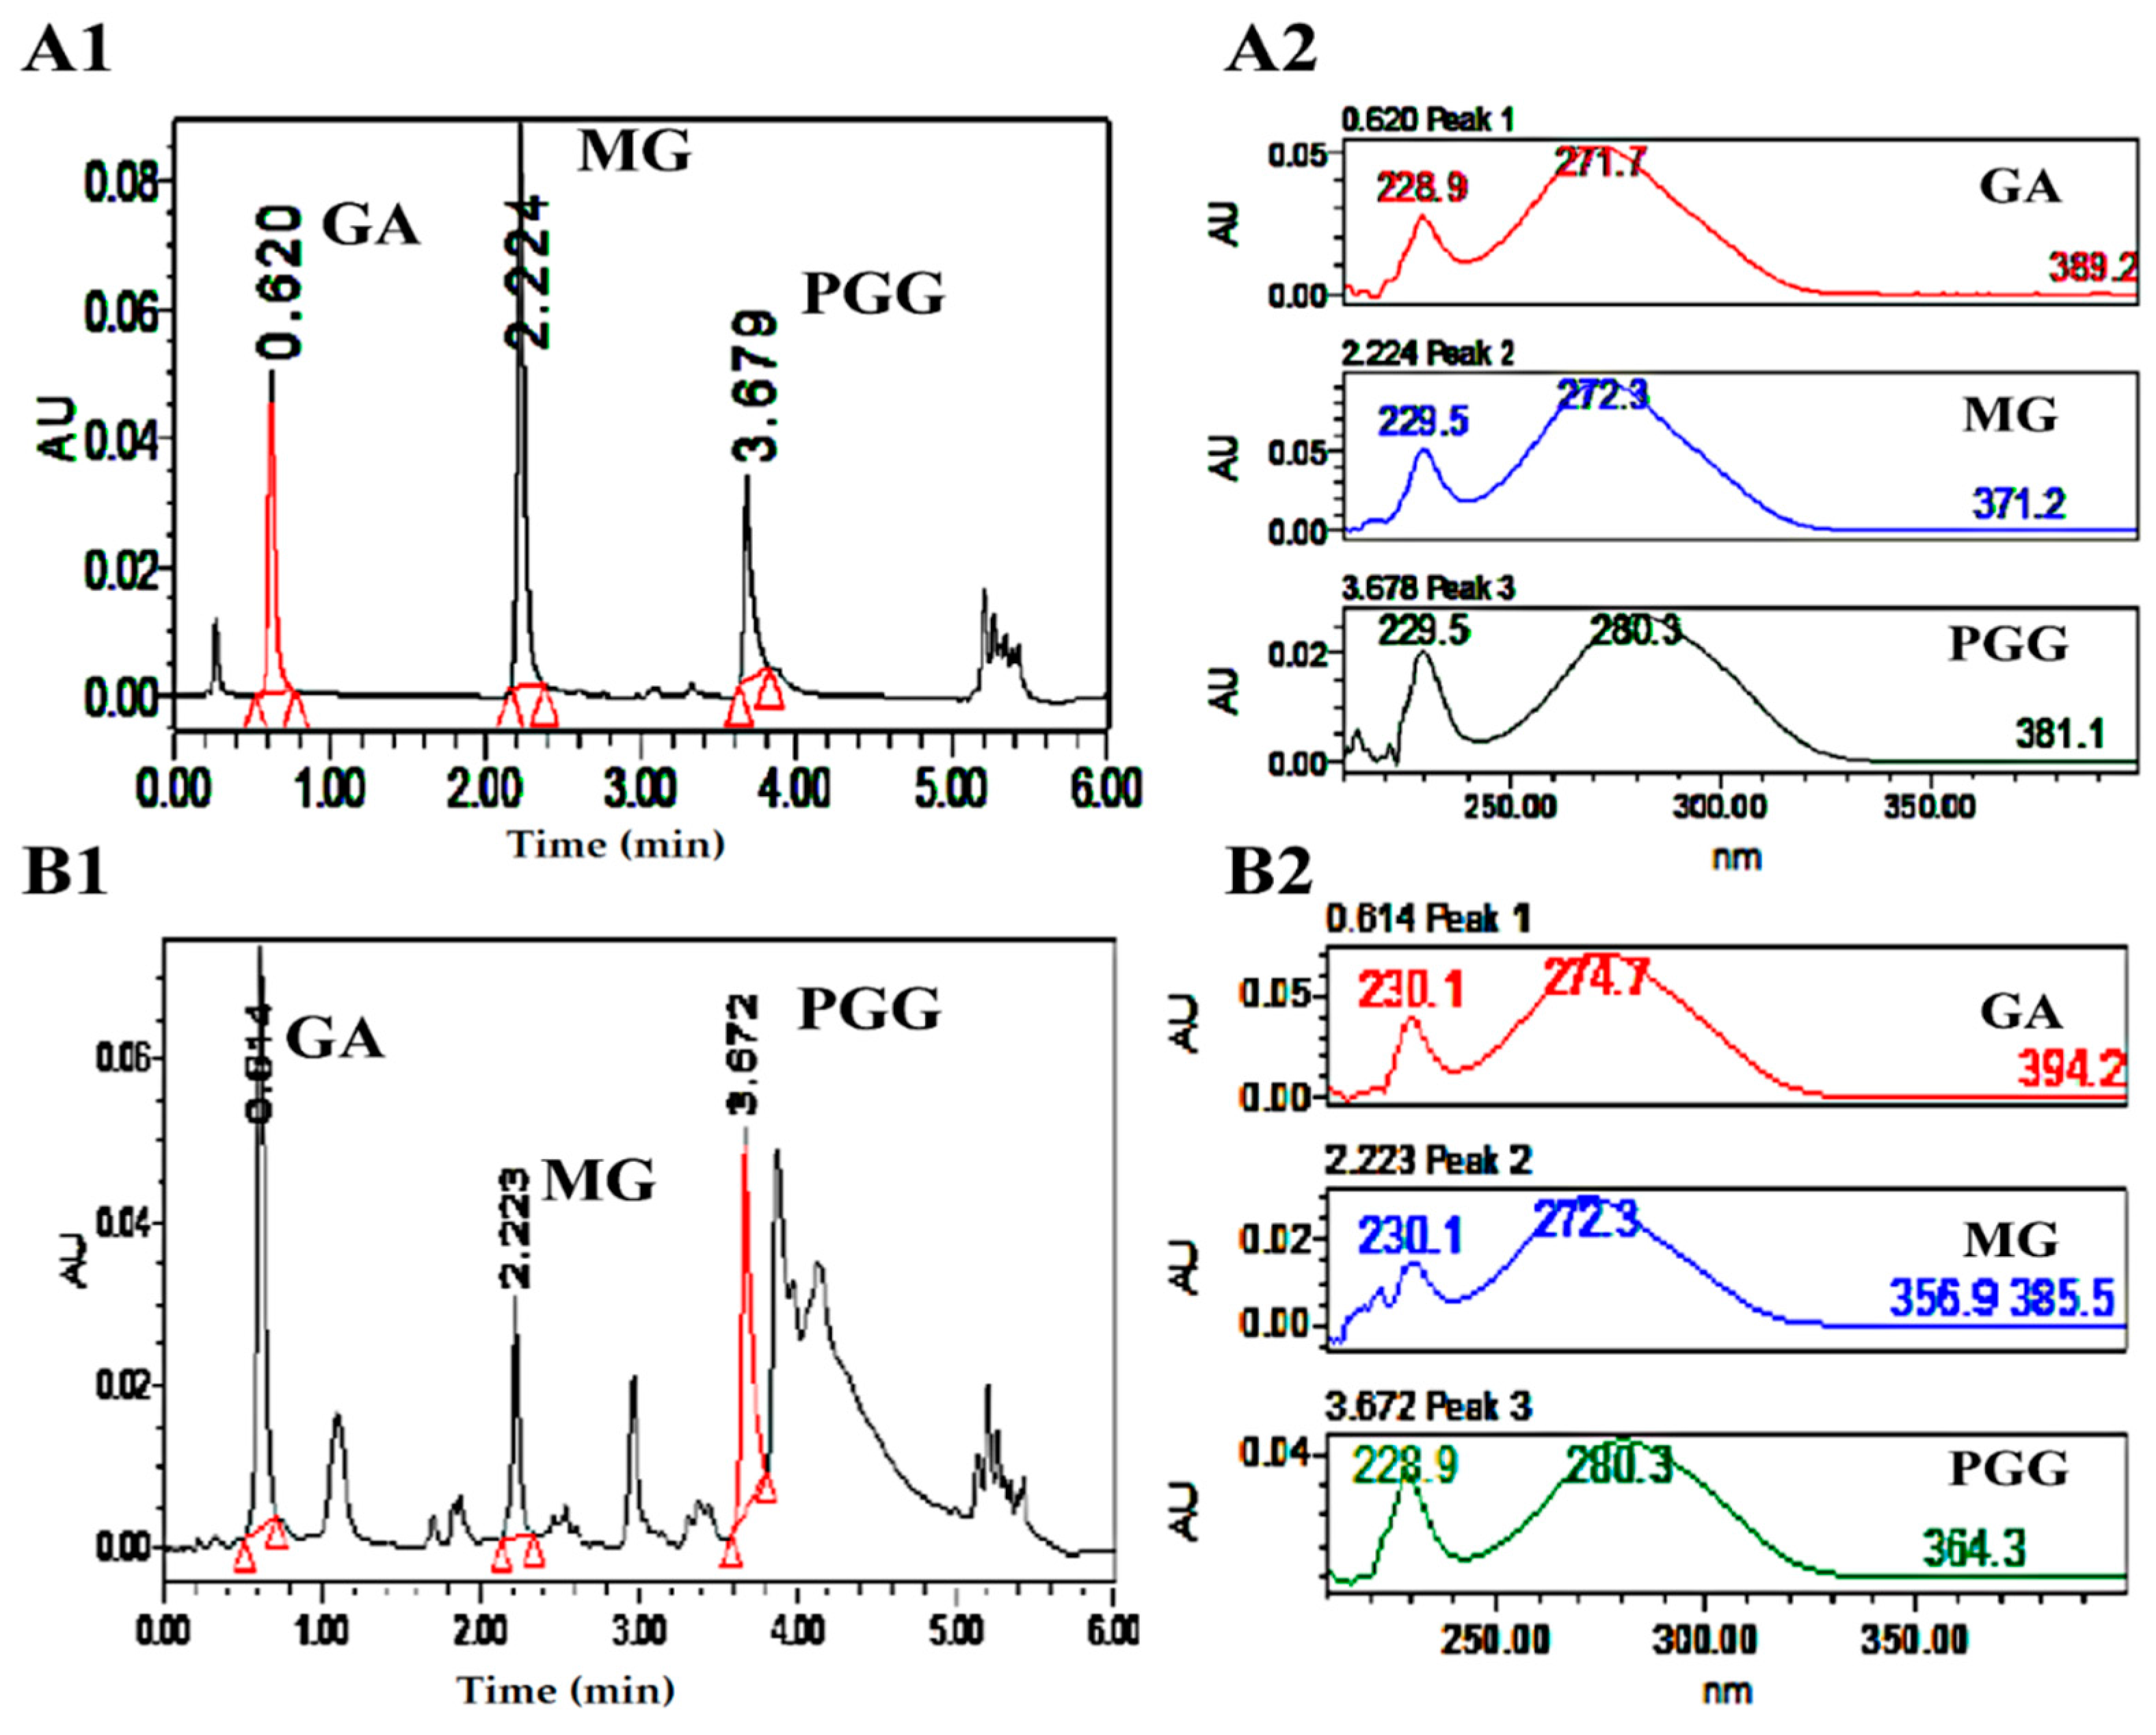
3.3. Standardization of Plant Extract
3.4. Cell Culture
3.5. Animals
3.6. Chemical and Biological Stabilities
3.6.1. Chemical Stability in HBSS pH 5, 6, 7 and 8
3.6.2. Biological Stability in Caco-2 Cell Lysates
3.6.3. Biological Stability in Rat Fecal Lysates
3.6.4. Data Analysis in Chemical and Biological Stability Assays
3.7. Caco-2 Transepithelial Transport Experiment
Data Analysis in the Caco-2 Cell Culture Model
3.8. In Vivo Oral Pharmacokinetic Studies
3.8.1. Sample Preparation Procedure
3.8.2. Pharmacokinetic Analysis
3.9. UPLC Analysis of GA, MG and PGG
3.10. LC–MS/MS Analysis of MG and PGG
3.11. Statistical Analysis
| Analytes | Q1 (m/z) | Q3 (m/z) | DP (V) | CE (V) | CXP (V) | Dwell Time (ms) |
|---|---|---|---|---|---|---|
| MG | 183 | 124 | −98 | −30 | −9 | 100 |
| MG sulfate | 263 | 183 | −98 | −30 | −9 | 100 |
| MG glucuronide | 359 | 183 | −98 | −30 | −9 | 100 |
| PGG | 939 | 769 | −194 | −44 | −39 | 100 |
| PGG sulfate | 1019 | 939 | −194 | −44 | −39 | 100 |
| PGG glucuronide | 1115 | 939 | −194 | −44 | −39 | 100 |
| Formononetin | 267 | 252 | −54 | −28 | −11 | 100 |
4. Conclusions
Acknowledgments
Author Contributions
Conflicts of Interest
References
- Ribeiro, S.M.R.; Barbosa, L.C.A.; Queiroz, J.H.; Knödler, M.; Schieber, A. Phenolic compounds and antioxidant capacity of Brazilian mango (Mangifera indica L.) varieties. Food Chem. 2008, 110, 620–626. [Google Scholar] [CrossRef]
- Abdalla, A.E.M.; Darwish, S.M.; Ayad, E.H.E.; El-Hamahmy, R.M. Egyptian mango by-product 1. Compositional quality of mango seed kernel. Food Chem. 2007, 103, 1134–1140. [Google Scholar] [CrossRef]
- Berardini, N.; Carle, R.; Schieber, A. Characterization of gallotannins and benzophenone derivatives from mango (Mangifera indica L. cv. “Tommy Atkins”) peels, pulp and kernels by high-performance liquid chromatography/electrospray ionization mass spectrometry. Rapid Commun. Mass Spectrom. 2004, 18, 2208–2216. [Google Scholar] [CrossRef] [PubMed]
- Nithitanakool, S.; Pithayanukul, P.; Bavovada, R. Antioxidant and hepatoprotective activities of Thai mango seed kernel extract. Planta Med. 2009, 75, 1118–1123. [Google Scholar] [CrossRef] [PubMed]
- Jiamboonsri, P.; Pithayanukul, P.; Bavovada, R.; Chomnawang, M.T. The inhibitory potential of Thai mango seed kernel extract against methicillin-resistant Staphylococcus aureus. Molecules 2011, 16, 6255–6270. [Google Scholar] [CrossRef] [PubMed]
- Nithitanakool, S.; Pithayanukul, P.; Bavovada, R.; Saparpakorn, P. Molecular docking studies and anti-tyrosinase activity of Thai mango seed kernel extract. Molecules 2009, 14, 257–265. [Google Scholar] [CrossRef] [PubMed]
- Leanpolchareanchai, J.; Pithayanukul, P.; Bavovada, R.; Saparpakorn, P. Molecular docking studies and anti-enzymatic activities of Thai mango seed kernel extract against snake venoms. Molecules 2009, 14, 1404–1422. [Google Scholar] [CrossRef] [PubMed]
- Pithayanukul, P.; Leanpolchareanchai, J.; Saparpakorn, P. Molecular docking studies and anti-snake venom metalloproteinase activity of Thai mango seed kernel extract. Molecules 2009, 14, 3198–3213. [Google Scholar] [CrossRef] [PubMed]
- Konishi, Y.; Hitomi, Y.; Yoshioka, E. Intestinal absorption of p-coumaric and gallic acids in rats after oral administration. J. Agric. Food Chem. 2004, 52, 2527–2532. [Google Scholar] [CrossRef] [PubMed]
- Ferruzzi, M.G.; Lobo, J.K.; Janle, E.M.; Cooper, B.; Simon, J.E.; Wu, Q.L.; Welch, C.; Ho, L.; Weaver, C.; Pasinetti, G.M. Bioavailability of gallic acid and catechins from grape seed polyphenol extract is improved by repeated dosing in rats: Implications for treatment in Alzheimer’s disease. J. Alzheimers Dis. 2009, 18, 113–124. [Google Scholar] [PubMed]
- Song, R.; Xu, L.; Zhang, Z.; Tian, Y.; Xu, F.; Dong, H. Determination of gallic acid in rat plasma by LC-MS-MS. Chromatographia 2010, 71, 1107–1111. [Google Scholar] [CrossRef]
- Shahrzad, S.; Bitsch, I. Determination of gallic acid and its metabolites in human plasma and urine by high-performance liquid chromatography. J. Chromatogr. B Biomed. Sci. Appl. 1998, 705, 87–95. [Google Scholar] [CrossRef]
- Shahrzad, S.; Aoyagi, K.; Winter, A.; Koyama, A.; Bitsch, I. Pharmacokinetics of gallic acid and its relative bioavailability from tea in healthy humans. J. Nutr. 2001, 131, 1207–1210. [Google Scholar] [PubMed]
- Jiamboonsri, P.; Pithayanukul, P.; Bavovada, R.; Gao, S.; Hu, M. A validated liquid chromatography-tandem mass spectrometry method for the determination of methyl gallate and pentagalloyl glucopyranose: Application to pharmacokinetic studies. J. Chromatogr. B Anal. Technol. Biomed. Life Sci. 2015, 986–987, 12–17. [Google Scholar] [CrossRef] [PubMed]
- Li, L.; Shaik, A.A.; Zhang, J.; Nhkata, K.; Wang, L.; Zhang, Y.; Xing, C.; Kim, S.H.; Lü, J. Preparation of penta-O-galloyl-β-d-glucose from tannic acid and plasma pharmacokinetic analyses by liquid–liquid extraction and reverse-phase HPLC. J. Pharm. Biomed. Anal. 2011, 54, 545–550. [Google Scholar] [CrossRef] [PubMed]
- Gao, S.; Hu, M. Bioavailability challenges associated with development of anti-cancer phenolics. Mini Rev. Med. Chem. 2010, 10, 550–567. [Google Scholar] [CrossRef] [PubMed]
- Chang, Q.; Zuo, Z.; Ho, W.K.; Chow, M.S. Comparison of the pharmacokinetics of hawthorn phenolics in extract versus individual pure compound. J. Clin. Pharmacol. 2005, 45, 106–112. [Google Scholar] [CrossRef] [PubMed]
- Chen, L.; Lee, M.J.; Li, H.; Yang, C.S. Absorption, distribution, elimination of tea polyphenols in rats. Drug Metab. Dispos. 1997, 25, 1045–1050. [Google Scholar] [PubMed]
- Friedman, M.; Jürgens, H.S. Effect of pH on the stability of plant phenolic compounds. J. Agric. Food Chem. 2000, 48, 2101–2110. [Google Scholar] [CrossRef] [PubMed]
- Engels, C.; Gänzle, M.G.; Schieber, A. Fast LC–MS analysis of gallotannins from mango (Mangifera indica L.) kernels and effects of methanolysis on their antibacterial activity and iron binding capacity. Food Res. Int. 2012, 45, 422–426. [Google Scholar] [CrossRef]
- Kern, S.M.; Bennett, R.N.; Needs, P.W.; Mellon, F.A.; Kroon, P.A.; Garcia-Conesa, M.T. Characterization of metabolites of hydroxycinnamates in the in vitro model of human small intestinal epithelium Caco-2 cells. J. Agric. Food Chem. 2003, 51, 7884–7891. [Google Scholar] [CrossRef] [PubMed]
- Jakobek, L. Interactions of polyphenols with carbohydrates, lipids and proteins. Food Chem. 2015, 175, 556–567. [Google Scholar] [CrossRef] [PubMed]
- Hagerman, A.E.; Rice, M.E.; Ritchard, N.T. Mechanisms of protein precipitation for two tannins, pentagalloyl glucose and epicatechin16 (4→8) catechin (procyanidin). J. Agric. Food Chem. 1998, 46, 2590–2595. [Google Scholar] [CrossRef]
- Krook, M.A.; Hagerman, A.E. Stability of polyphenols epigallocatechin gallate and pentagalloyl glucose in a simulated digestive system. Food Res. Int. 2012, 49, 112–116. [Google Scholar] [CrossRef] [PubMed]
- Griffiths, D.W. The inhibition of digestive enzymes by polyphenolic compounds. Adv. Exp. Med. Biol. 1986, 199, 509–516. [Google Scholar] [PubMed]
- Jenkinson, C.; Petroczi, A.; Naughton, D.P. Effects of dietary components on testosterone metabolism via UDP-glucuronosyltransferase. Front. Endocrinol. 2013, 4. [Google Scholar] [CrossRef] [PubMed]
- Mena, P.; Calani, L.; Bruni, R.; Rio, D.D. Bioactivation of high-molecular-weight polyphenols by the gut microbiome. In Diet-Microbe Interactions in the Gut: Effects on Human Health and Disease, 1st ed.; Tuohy, K., Rio, D.D., Eds.; Academic Press: San Diego, CA, USA, 2015; pp. 73–101. [Google Scholar]
- Chen, H.; Hayek, S.; Rivera Guzman, J.; Gillitt, N.D.; Ibrahim, S.A.; Jobin, C.; Sang, S. The microbiota is essential for the generation of black tea theaflavins-derived metabolites. PLoS ONE 2012, 7, e51001. [Google Scholar] [CrossRef] [PubMed]
- Bhat, T.K.; Singh, B.; Sharma, O.P. Microbial degradation of tannins–A current perspective. Biodegradation 1998, 9, 343–357. [Google Scholar] [CrossRef] [PubMed]
- Brown, J.P. Hydrolysis of glycosides and esters. In Role of the Gut Flora in Toxicity and Cancer; Rowland, I.R., Ed.; Academic Press: San Diego, CA, USA, 1988; pp. 109–144. [Google Scholar]
- Konishi, Y.; Kobayashi, S.; Shimizu, M. Transepithelial transport of p-coumaric acid and gallic acid in Caco-2 cell monolayers. Biosci. Biotech. Biochem. 2003, 67, 2317–2324. [Google Scholar] [CrossRef] [PubMed]
- Cai, K.; Hagerman, A.E.; Minto, R.E.; Bennick, A. Decreased polyphenol transport across cultured intestinal cells by a salivary proline-rich protein. Biochem. Pharmacol. 2006, 71, 1570–1580. [Google Scholar] [CrossRef] [PubMed]
- Tammela, P.; Laitinen, L.; Galkin, A.; Wennberg, T.; Heczko, R.; Vuorela, H.; Slotte, J.P.; Vuorela, P. Permeability characteristics and membrane affinity of flavonoids and alkyl gallates in Caco-2 cells and in phospholipid vesicles. Arch. Biochem. Biophys. 2004, 425, 193–199. [Google Scholar] [CrossRef] [PubMed]
- Tagashira, T.; Choshi, T.; Hibino, S.; Kamishikiryou, J.; Sugihara, N. Influence of gallate and pyrogallol moieties on the intestinal absorption of (−)-epicatechin and (−)-epicatechin gallate. J. Food Sci. 2012, 77, H208–H215. [Google Scholar] [CrossRef] [PubMed]
- Kitagawa, S.; Nabekura, T.; Kamiyama, S.; Takahashi, T.; Nakamura, Y.; Kashiwada, Y.; Ikeshiro, Y. Effects of alkyl gallates on P-glycoprotein function. Biochem. Pharmacol. 2005, 70, 1262–1266. [Google Scholar] [CrossRef] [PubMed]
- Kitagawa, S.; Nabekura, T.; Nakamura, Y.; Takahashi, T.; Kashiwada, Y. Inhibition of P-glycoprotein function by tannic acid and pentagalloylglucose. J. Pharm. Pharmacol. 2007, 59, 965–969. [Google Scholar] [CrossRef] [PubMed]
- Kwon, S.H.; Kang, M.J.; Huh, J.S.; Ha, K.W.; Lee, J.R.; Lee, S.K.; Lee, B.S.; Han, I.H.; Lee, M.S.; Lee, M.W.; et al. Comparison of oral bioavailability of genistein and genistin in rats. Int. J. Pharm. 2007, 337, 148–154. [Google Scholar] [CrossRef] [PubMed]
- Eler, G.J.; Santos, I.S.; de Moraes, A.G.; Mito, M.S.; Comar, J.F.; Peralta, R.M.; Bracht, A. Kinetics of the transformation of n-propyl gallate and structural analogs in the perfused rat liver. Toxicol. Appl. Pharmacol. 2013, 273, 35–46. [Google Scholar] [CrossRef] [PubMed]
- Antonio, L.; Grillasca, J.P.; Taskinen, J.; Elovaara, E.; Burchell, B.; Piet, M.H.; Ethell, B.; Ouzzine, M.; Fournel-Gigleux, S.; Magdalou, J. Characterization of catechol glucuronidation in rat liver. Drug Metab. Dispos. 2002, 30, 199–207. [Google Scholar] [CrossRef] [PubMed]
- Antonio, L.; Xu, J.; Little, J.M.; Burchell, B.; Magdalou, J.; Radominska-Pandya, A. Glucuronidation of catechols by human hepatic, gastric, and intestinal microsomal UDP-glucuronosyltransferases (UGT) and recombinant UGT1A6, UGT1A9, and UGT2B7. Arch. Biochem. Biophys. 2003, 411, 251–261. [Google Scholar] [CrossRef]
- Yasuda, T.; Inaba, A.; Ohmori, M.; Endo, T.; Kubo, S.; Ohsawa, K. Urinary metabolites of gallic acid in rats and their radical-scavenging effects on 1,1-diphenyl-2-picrylhydrazyl radical. J. Nat. Prod. 2000, 63, 1444–1446. [Google Scholar] [CrossRef] [PubMed]
- Hu, M.; Chen, J.; Zhu, Y.; Dantzig, A.H.; Stratford, R.E., Jr.; Kuhfeld, M.T. Mechanism and kinetics of transcellular transport of a new β-lactam antibiotic loracarbef across an intestinal epithelial membrane model system (Caco-2). Pharm. Res. 1994, 11, 1405–1413. [Google Scholar] [CrossRef] [PubMed]
- Zhang, L.; Zheng, Y.; Chow, M.S.; Zuo, Z. Investigation of intestinal absorption and disposition of green tea catechins by Caco-2 monolayer model. Int. J. Pharm. 2004, 287, 1–12. [Google Scholar] [CrossRef] [PubMed]
- Niu, T.; Smith, D.L.; Yang, Z.; Gao, S.; Yin, T.; Jiang, Z.H.; You, M.; Gibbs, R.A.; Petrosino, J.F.; Hu, M. Bioactivity and bioavailability of ginsenosides are dependent on the glycosidase activities of the A/J mouse intestinal microbiome defined by pyrosequencing. Pharm. Res. 2013, 30, 836–846. [Google Scholar] [CrossRef] [PubMed]
- Yang, Z.; Gao, S.; Yin, T.; Kulkarni, K.H.; Teng, Y.; You, M.; Hu, M. Biopharmaceutical and pharmacokinetic characterization of matrine as determined by a sensitive and robust UPLC–MS/MS method. J. Pharm. Biomed. Anal. 2010, 51, 1120–1127. [Google Scholar] [CrossRef] [PubMed]
- Sample Availability: Samples of the compounds are available from the authors.
© 2015 by the authors. Licensee MDPI, Basel, Switzerland. This article is an open access article distributed under the terms and conditions of the Creative Commons by Attribution (CC-BY) license ( http://creativecommons.org/licenses/by/4.0/).
Share and Cite
Jiamboonsri, P.; Pithayanukul, P.; Bavovada, R.; Leanpolchareanchai, J.; Yin, T.; Gao, S.; Hu, M. Factors Influencing Oral Bioavailability of Thai Mango Seed Kernel Extract and Its Key Phenolic Principles. Molecules 2015, 20, 21254-21273. https://doi.org/10.3390/molecules201219759
Jiamboonsri P, Pithayanukul P, Bavovada R, Leanpolchareanchai J, Yin T, Gao S, Hu M. Factors Influencing Oral Bioavailability of Thai Mango Seed Kernel Extract and Its Key Phenolic Principles. Molecules. 2015; 20(12):21254-21273. https://doi.org/10.3390/molecules201219759
Chicago/Turabian StyleJiamboonsri, Pimsumon, Pimolpan Pithayanukul, Rapepol Bavovada, Jiraporn Leanpolchareanchai, Taijun Yin, Song Gao, and Ming Hu. 2015. "Factors Influencing Oral Bioavailability of Thai Mango Seed Kernel Extract and Its Key Phenolic Principles" Molecules 20, no. 12: 21254-21273. https://doi.org/10.3390/molecules201219759