Article

Technological Application of Maltodextrins According to the Degree of Polymerization

by
Zenaida Saavedra-Leos
1,*,
César Leyva-Porras
2,
Sandra B. Araujo-Díaz
3,
Alberto Toxqui-Terán
2,3 and
Anahí J. Borrás-Enríquez
4
1
Academic Coordination, Altiplano Region, Autonomous University of San Luis Potosi, Road Cedral km. 5+600, 78700 Matehuala, San Luis Potosi, Mexico
2
Advanced Materials Research Center (CIMAV), Alianza Norte 202, Research and Technological Innovation Park (PIIT), 66600 Apodaca, Nuevo Leon, Mexico
3
Doctorate Institutional in Engineering and Materials Science (DICIM), Sierra Leona 530, Lomas, 2nd. Section, 78210 San Luis Potosi, San Luis Potosi, Mexico
4
Faculty of Chemistry Sciences, Autonomous University of San Luis Potosi, Manuel Nava 6, 78290 San Luis Potosi, San Luis Potosi, Mexico
*
Author to whom correspondence should be addressed.
Molecules 2015, 20(12), 21067-21081; https://doi.org/10.3390/molecules201219746
Submission received: 24 October 2015 / Revised: 17 November 2015 / Accepted: 19 November 2015 / Published: 27 November 2015
(This article belongs to the Section Molecular Diversity)

Abstract

:
Maltodextrin (MX) is an ingredient in high demand in the food industry, mainly for its useful physical properties which depend on the dextrose equivalent (DE). The DE has however been shown to be an inaccurate parameter for predicting the performance of the MXs in technological applications, hence commercial MXs were characterized by mass spectrometry (MS) to determine their molecular weight distribution (MWD) and degree of polymerization (DP). Samples were subjected to different water activities (aw). Water adsorption was similar at low aw, but radically increased with the DP at higher aw. The decomposition temperature (Td) showed some variations attributed to the thermal hydrolysis induced by the large amount of adsorbed water and the supplied heat. The glass transition temperature (Tg) linearly decreased with both, aw and DP. The microstructural analysis by X-ray diffraction showed that MXs did not crystallize with the adsorption of water, preserving their amorphous structure. The optical micrographs showed radical changes in the overall appearance of the MXs, indicating a transition from a glassy to a rubbery state. Based on these characterizations, different technological applications for the MXs were suggested.

1. Introduction

Maltodextrin (MX) is a polysaccharide produced from the acidic or enzymatic hydrolysis of starch which has a nutritional contribution of only 4 calories per gram. It is considered a polymer of d-glucose chains linked by glycosidic α-(1-4) and α-(1-6) bonds, and is formed by linear (amylase) and branched (amylopectin) carbohydrates with different equivalents of dextrose (DE) [1]. Traditionally, the way to chemically characterize commercial polysaccharides containing reducing sugars is by the DE, which is an indirect measure of the free glucose functional groups (aldehydes) responsible for granting the reducing power [2]. Maltodextrin is the name given to those hydrolysates with DE values in the 3–20 range, while those with values higher than 20 are known as glucose syrups. In this sense, the physicochemical and functional properties of MXs depend on the DE value i.e., powder may behave as a highly hygroscopic powder or as a concentrated liquid solutions [3]. The DE is inversely related to the number-average molecular weight (Mn) and the degree of polymerization (DP), both commonly employed for describing the size distribution of the polysaccharide chains in the carbohydrate polymer. The importance of the Mn is related with the prediction of the colligative properties such as boiling and freezing temperatures, while the DP is related with the polymer chain mobility, where larger chains have limited movement [4]. In the food industry MXs have been widely employed, providing different benefits such as the improvement of texture, reducing floury taste, as sweetness modifiers, controlling non-enzymatic browning, decreasing the freezing point in mixtures, as carriers and ingredients [3,5]. Likewise, because of their high solubility in water, MXs are widely employed in the encapsulation industry, mainly as additives in the drying processes [6,7]. The most important benefit of the addition of MX is increasing the Tg of the food product and the subsequent preservation of the physicochemical properties.
Among the drying methods used for producing powdered foods (e.g., hot air fluidized bed, freeze drying, flash drying, etc.), spray drying is preferred because it is economical, flexible, of easy operation and control, with high drying rates and very short residence times [8]. Therefore, heat sensitive products can be dried at relatively high temperatures while retaining some of their properties such as taste, color, odor and nutrients [9,10]. However, drying of sugar-rich foods products is difficult due to the high water content, low molecular weight and low glass transition temperatures (Tg) [11]. These products are very sensitive to the processing conditions and may adhere to the walls of the dryer forming an agglomerated powder. This leads to low processing yields and adverse product quality [12,13]. Thus to avoid this type of unwanted conditions such as sticking problems, collapse of the microstructure and damage during storage, the physical and thermal properties of polysaccharides like MXs must be determined first.
Therefore, the goal of this study was to establish a relation between the DP and the physicochemical properties of MXs with different DE. For this purpose, MXs powders were initially chemically characterized for determining the DP and their total number of glucose units. Then, the effect of water adsorption on the physical and thermal properties was determined for the different MXs. It is expected that the results obtained in the study will prove useful to identify the potential applications of MXs according to the DP and to establish optimal storage conditions. These results may be of importance when using MXs as an additive in the drying process, as carrier agents in the encapsulation of proteins, and in the development of food products with high sugar content.

2. Results and Discussion

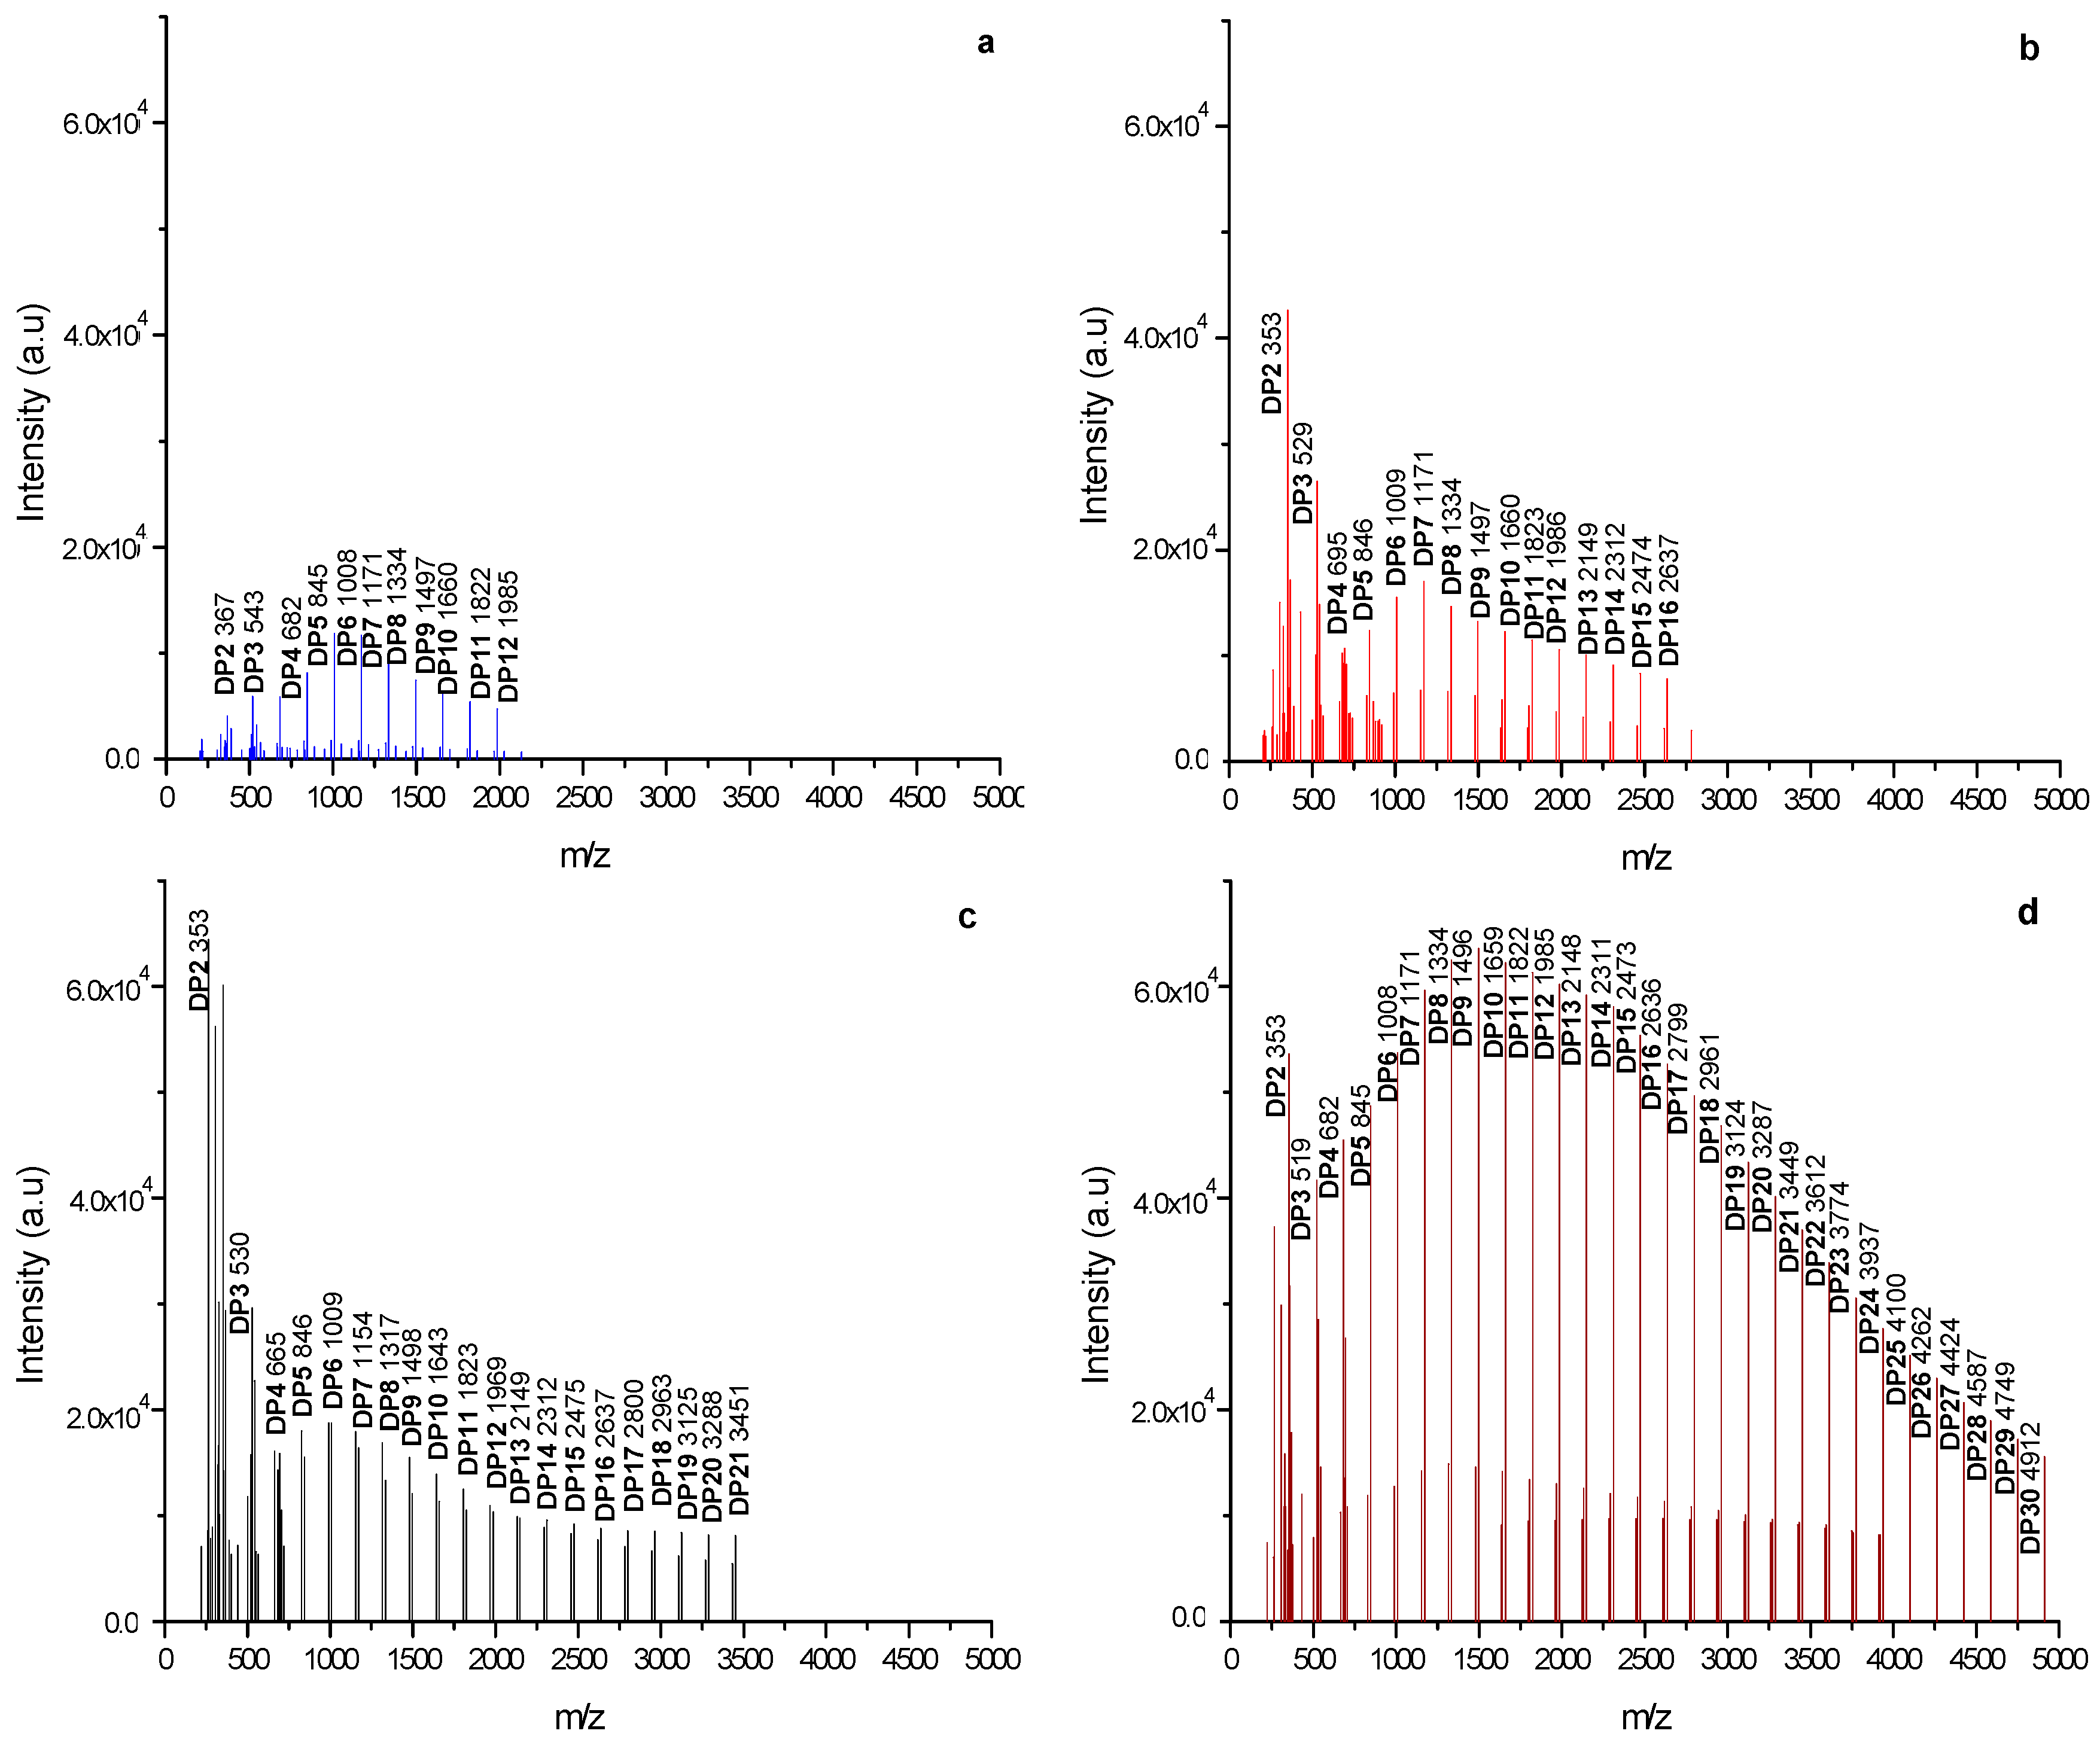
2.1. Determination of the Degree of Polymerization of Powdered Maltodextrins

The initial state of MXs powder is of major importance to the final properties and applications. Properties such as water adsorption, crystallinity and glass transition temperature depend in turn on the degree of polymerization (DP). As known, synthetic polymers have a molecular weight distribution (MWD) which can be characterized by the weight-average molecular weight (Mw), the number-average molecular weight (Mn) and polydispersity. MALDI-TOF mass spectrometry has shown to be an accurate technique to characterize the MWD of carbohydrate polymers [14]. Moreover, Kazmaier et al. [15], studied a set of maltodextrins with a DP in the range of 2–13, and concluded that MALDI-TOF mass spectrometry is best suited technique for the detection of high molecular weight species such as oligosaccharides. Figure 1a–d show the mass to charge ratio (m/z) spectra obtained from the MALDI-TOF analysis of the MXs powders. On the x-axis is plotted the molecular weight, while in the y-axis is the number of molecules having the given molecular weight. The spectra show adjacent peaks related to the thermal fragmentation of inulin separated by a mass interval of 162 g/mole. This value is related to the loss of water produced by the hydrolysis of the polysaccharide during the thermal fragmentation (Mw glucose−Mw water). As observed in the figures, the spectrum from the M40 sample exhibited a greater degree of fragmentation, which qualitatively indicates larger chains of glucose units with a value up to 4911 (m/z). Contrary to this, the Mc sample exhibited the shorter fragmentation with a value up to 1985 (m/z). Average molecular weight values Mw and Mn were calculated from the MADI-TOF spectra according to the Equations (1) and (2), respectively:
Mw = Σ(NiMi2)/Σ(NiMi)
Mn = Σ(NiMi)/ΣNi
where Ni represents the intensity of the i peak and Mi is the mass of the oligomer. The polydispersity (Xn) was calculated from the ratio of the molecular weights (Mw/Mn) [16]. The DP value was calculated by dividing the mass of the i oligomer by the mass interval (162 g/mole). The Mw, Mn, Xn and DP were calculated with the aid of the appropriate software (Polytoos v.10) and the values are reported in Table 1. For comparison purposes, the DE values reported by the supplier of the maltodextrins and the DE values determined experimentally in this work are included in Table 1. The experimentally determined values showed good agreement with those reported by the supplier. As expected, the MWD for MXs showed the typical behavior of synthetic polymers, where Mn presented lower values than those for Mw. The calculated Mw and Mn showed values in the range of 1335–2873 and 1168–2242 g/mole, respectively. The four MXs exhibited close to unitary polydispersity values, which indicates a narrow molecular weight distribution. For samples Mc, M10 and M20, the Xn slightly increased with the DE, showing the extent of the hydrolysis of starch. However, for sample M40, the value decreased slightly to 1.28. The DP range was between 12 and 30, and the values increased linearly with the molecular weight. These results are in agreement with those reported by Meuter et al. [17], who studied maltodextrins with DP values in the range of 1–7, and the corresponding increase in the Mw range of 180–1152 g/mole. When comparing the relation between the DE and DP, our results showed a linear relation. Accordingly to Kennedy et al. [18], the chemical composition of maltodextrins is affected by the type and conditions exerted during the hydrolysis. In consequence, MX-based products with similar DE value may present different physical properties [19]. Anyway, it has been shown that the DE is not the best parameter for predicting the performance of maltodextrins [20]. Several methodologies have been employed for setting a relation between the MWD and DE of MXs, showing remarkably variable results. Rong, Sillick and Gregson [4], determined both Mn and DE from osmometry measurements of MXs with a DP up to 7, and found an inverse relation between the calculated parameters. Sun et al. [2], employed high-performance liquid chromatography (HPLC) and gel permeation chromatography (GPC) for determining MWD of MXs in the DE range of 7–28, finding an uneven variation between the molecular distribution and the composition of oligosaccharides. Recently, Silva et al. [21] reported the structural analysis of commercial grade maltodextrins by MALDI-TOF and size exclusion chromatography (SEC). They determined the neutral sugar content (acetylated and alditol acetate) by gas chromatography (GC), identified the corresponding links from the linear chains (1–4 amylose) and the branched amylopectin chains (1–4 Glcp, 1–6 Glcp and 1–4,6 Glcp). With these results, they calculated the percentage of branching of the main chain and established that the higher the branching the higher the hydrodynamic volume (OH groups) and in consequence the higher molecular weight. During the hydrolysis of starch, both processes may occur simultaneously, the breaking of the polymer chain and the subsequent polymerization of the chains into amylose and amylopectin. Depending on the arrangement of these chains the resulting maltodextrin may be linear or branched. Thus, a high DE value indicates more available functional groups and a higher percentage of branching. Our results showed a linear increase in the DP as the DE was increased. This finding suggested that branching increased for the MXs samples in the following order Mc, M10, M20 and M40.
Certainly, the characterization by mass spectroscopy yielded important data about the chemical structure of the different MXs, determining the number of glucose oligomers contained in the carbohydrate polymer chains. From the technological point of view, this is essential in order to establish the potential applications for commercial grade MXs. Additionally, these results were of importance to understand that there is not a direct relation between the DP and DE, and from these parameters, the DP provided a better insight about the chemical structure of the MX.
Figure 1. MALDI-TOF spectra of MXs: (a) Mc; (b) M10; (c) M20 and (d) M40.
Molecules 20 19746 g001
Table 1. Molecular weight parameters from the MXs, determined from MALDI-TOF spectrometry experiments.
MaltodextrinDE 1 (%)DE 2 (%)MALDI-TOF
Mw (g/mole)Mn (g/mole)XnDP (Units of Glucose)
Mc------7 ± 1.021335 ± 1061168 ± 931.142–12
M109–1410 ± 1.981625 ± 1131205 ± 841.342–16
M2018–2221 ± 2.041925 ± 961324 ± 661.452–21
M4037–4239 ± 1.272873 ± 1722242 ± 1341.282–30
Dextrose Equivalent (DE): 1 Values reported by the commercial supplier; 2 Values determined experimentally as described in Section 2.1.

2.2. Sorption Isotherms

Figure 2 shows the moisture content at equilibrium for water activities (aw) from 0.070 to 0.75, for the MXs (Mc, M10, M20 and M40) at 30 °C. The equilibrium water content (aw) is expressed as the water absorbed (in grams) per 100 g of dry sample. Mainly two types of models are employed to describe this type of isotherm: the BET and the GAB [22] equations. The BET equation better reproduces the experimental behavior at aw in the range of 0.05 < aw < 0.40, but hinders the fitting of the experimental data over the whole range of water activities. Unlike the BET model, the GAB equation includes the experimental data of aw up to a value of 0.9. Thus, in this study the GAB model was used for fitting the adsorptions isotherms according to Equation (3):
m/m0 = ckaw/[(1 − kaw)(1 – kaw + ckaw)]
In Figure 2, the continuous line connecting the scattered data points represents the regression according to the GAB model. On the other hand, Brunauer, Deming, Deming and Teller [23], established five types of isotherms based on the adsorption of Van der Waals gases: Type 1 corresponds to chemisorption phenomena that take place in a single layer at the surface-active sites. Type II and III are frequently associated for nonporous food powders, while type IV and V for porous products. Mc sample exhibited an adsorption behavior corresponding to curve Type I. The amount of water absorbed was from 1.6 to 8.2 g of water per 100 g of dry sample at aw in the range of 0.07–0.75. Likewise, samples M10 and M40 exhibited a Type II isotherm known as sigmoid, which is characteristic of soluble products that show an asymptotic trend as the water activity approaches to the unit. These samples (M10 and M40) showed equilibrium water contents of 1.89–9.81 and 2.33–13.72 g of water per 100 g of dry sample, respectively. Sample M20 exhibited an equilibrium moisture content of 1.50–13.66 g of water per 100 g of dry sample, which corresponded to the Type III isotherm in the interval previously stated for aw. According to Fabra et al. [24], this behavior is typical of sugar-rich products, which adsorb small amounts of water at low water activities, but exhibit a steady increase in the amount of water adsorbed at higher values of aw. Similar isotherms for single maltodextrin systems and mixtures with other components such as juice, proteins and lipids, have been reported in several works [1,25,26].
Figure 2. Moisture adsorption isotherms at 30 °C for MXs with different DP. The continuous line indicates the regression according to the GAB model.
Molecules 20 19746 g002
Three parameters (m0, c and k) characterize the interaction of water with the constituents of the food: m0 is the water content at the monolayer level, c is characteristic of the product and it is related to the adsorption heat of the monolayer, and k is a correction factor related with the desorption heat of the monolayer [26]. Table 2 shows the values of c, k, m0 and the correlation coefficient (r2). Accordingly to Lewicki [27], if these values are in the range of 5.67 ≤ c ≤ ∞ and 0.24 ≤ k ≤ 1, then the predicted value for the monolayer will vary only ±15% of its actual value. Thus, after comparing the values of the c and k constants for the systems analyzed in this work, it was clearly observed that the constant values for samples M10 and M40 were between the limits established by Lewicki. This indicated a good prediction of the monolayer water content from the adsorption isotherms. However, for samples Mc and M20 the values of the constants deviated from that established by Lewicki. These observations corroborated that the values of m0 predicted by the GAB model were reliable only for the M10 and M40 samples, which showed values very close to 5 g of water per 100 g of dry powder. Additionally, the sigmoidal curve may be divided into three zones, each one representing an adsorption phenomenon. In zone I, corresponding to water activity in the range of 0–0.25, water monolayer is strongly adsorbed on the surface of the solid by hydrogen bond interactions. This water monolayer is difficult to eliminate by dehydration or to immobilize by freezing. The boundary between zone I and II is associated to the monolayer water level. For zone II in the range of aw of 0.25–0.8, more water molecules are added forming multilayers, observing capillary condensation on the surface of the solid. Zone III is presented at aw values greater than 0.8; the proportion of water is such that the liquid phase is observed. As observed in Figure 2, the equilibrium monolayer content determined graphically at aw of 0.25 is very similar for all the MXs analyzed in this work, with a water content about 4–5 g of water per 100 g of dry sample. These results indicated that the MXs analyzed herein showed a similar adsorption behavior at low aw, but behaved differently at aw higher than 0.43. Certainly, water adsorption in sugar rich products is largely influenced by the chemical structure and the availability of the active sites on the surface of the powder particles [28].
Table 2. Fitting constants of the GAB model for water adsorption in the MXs.
MaltodextrinGAB Model Parameters
ckm0r2
Mc6.266340.1059923.290.997
M108.6471170.6984175.250.996
M201.0988730.3198641.330.992
M4011.586170.949734.120.993
Martínez-Navarrete et al. [29] concluded that this type of curves can be useful for determining the rate of deterioration in food products such as milk powder and fruits (kiwi and strawberry), and found that the product is more stable at aw of 0.15–0.25. Saavedra-Leos et al. [12] established that adsorption isotherms together with the results from other characterization techniques such as thermogravimetric analysis (TGA), modulated differential scanning calorimetry (MDSC), X-ray diffraction (XRD), scanning electron microscopy (SEM) and optical microscopy (OP) were useful in the developing of new food products and the prediction of product stability. Moreover, with these isotherms it was possible to determine the maximum water content at which the physical properties of the powder product may remain unchanged during storage.

2.3. Simultaneous Thermal Analysis (TGA-DSC)
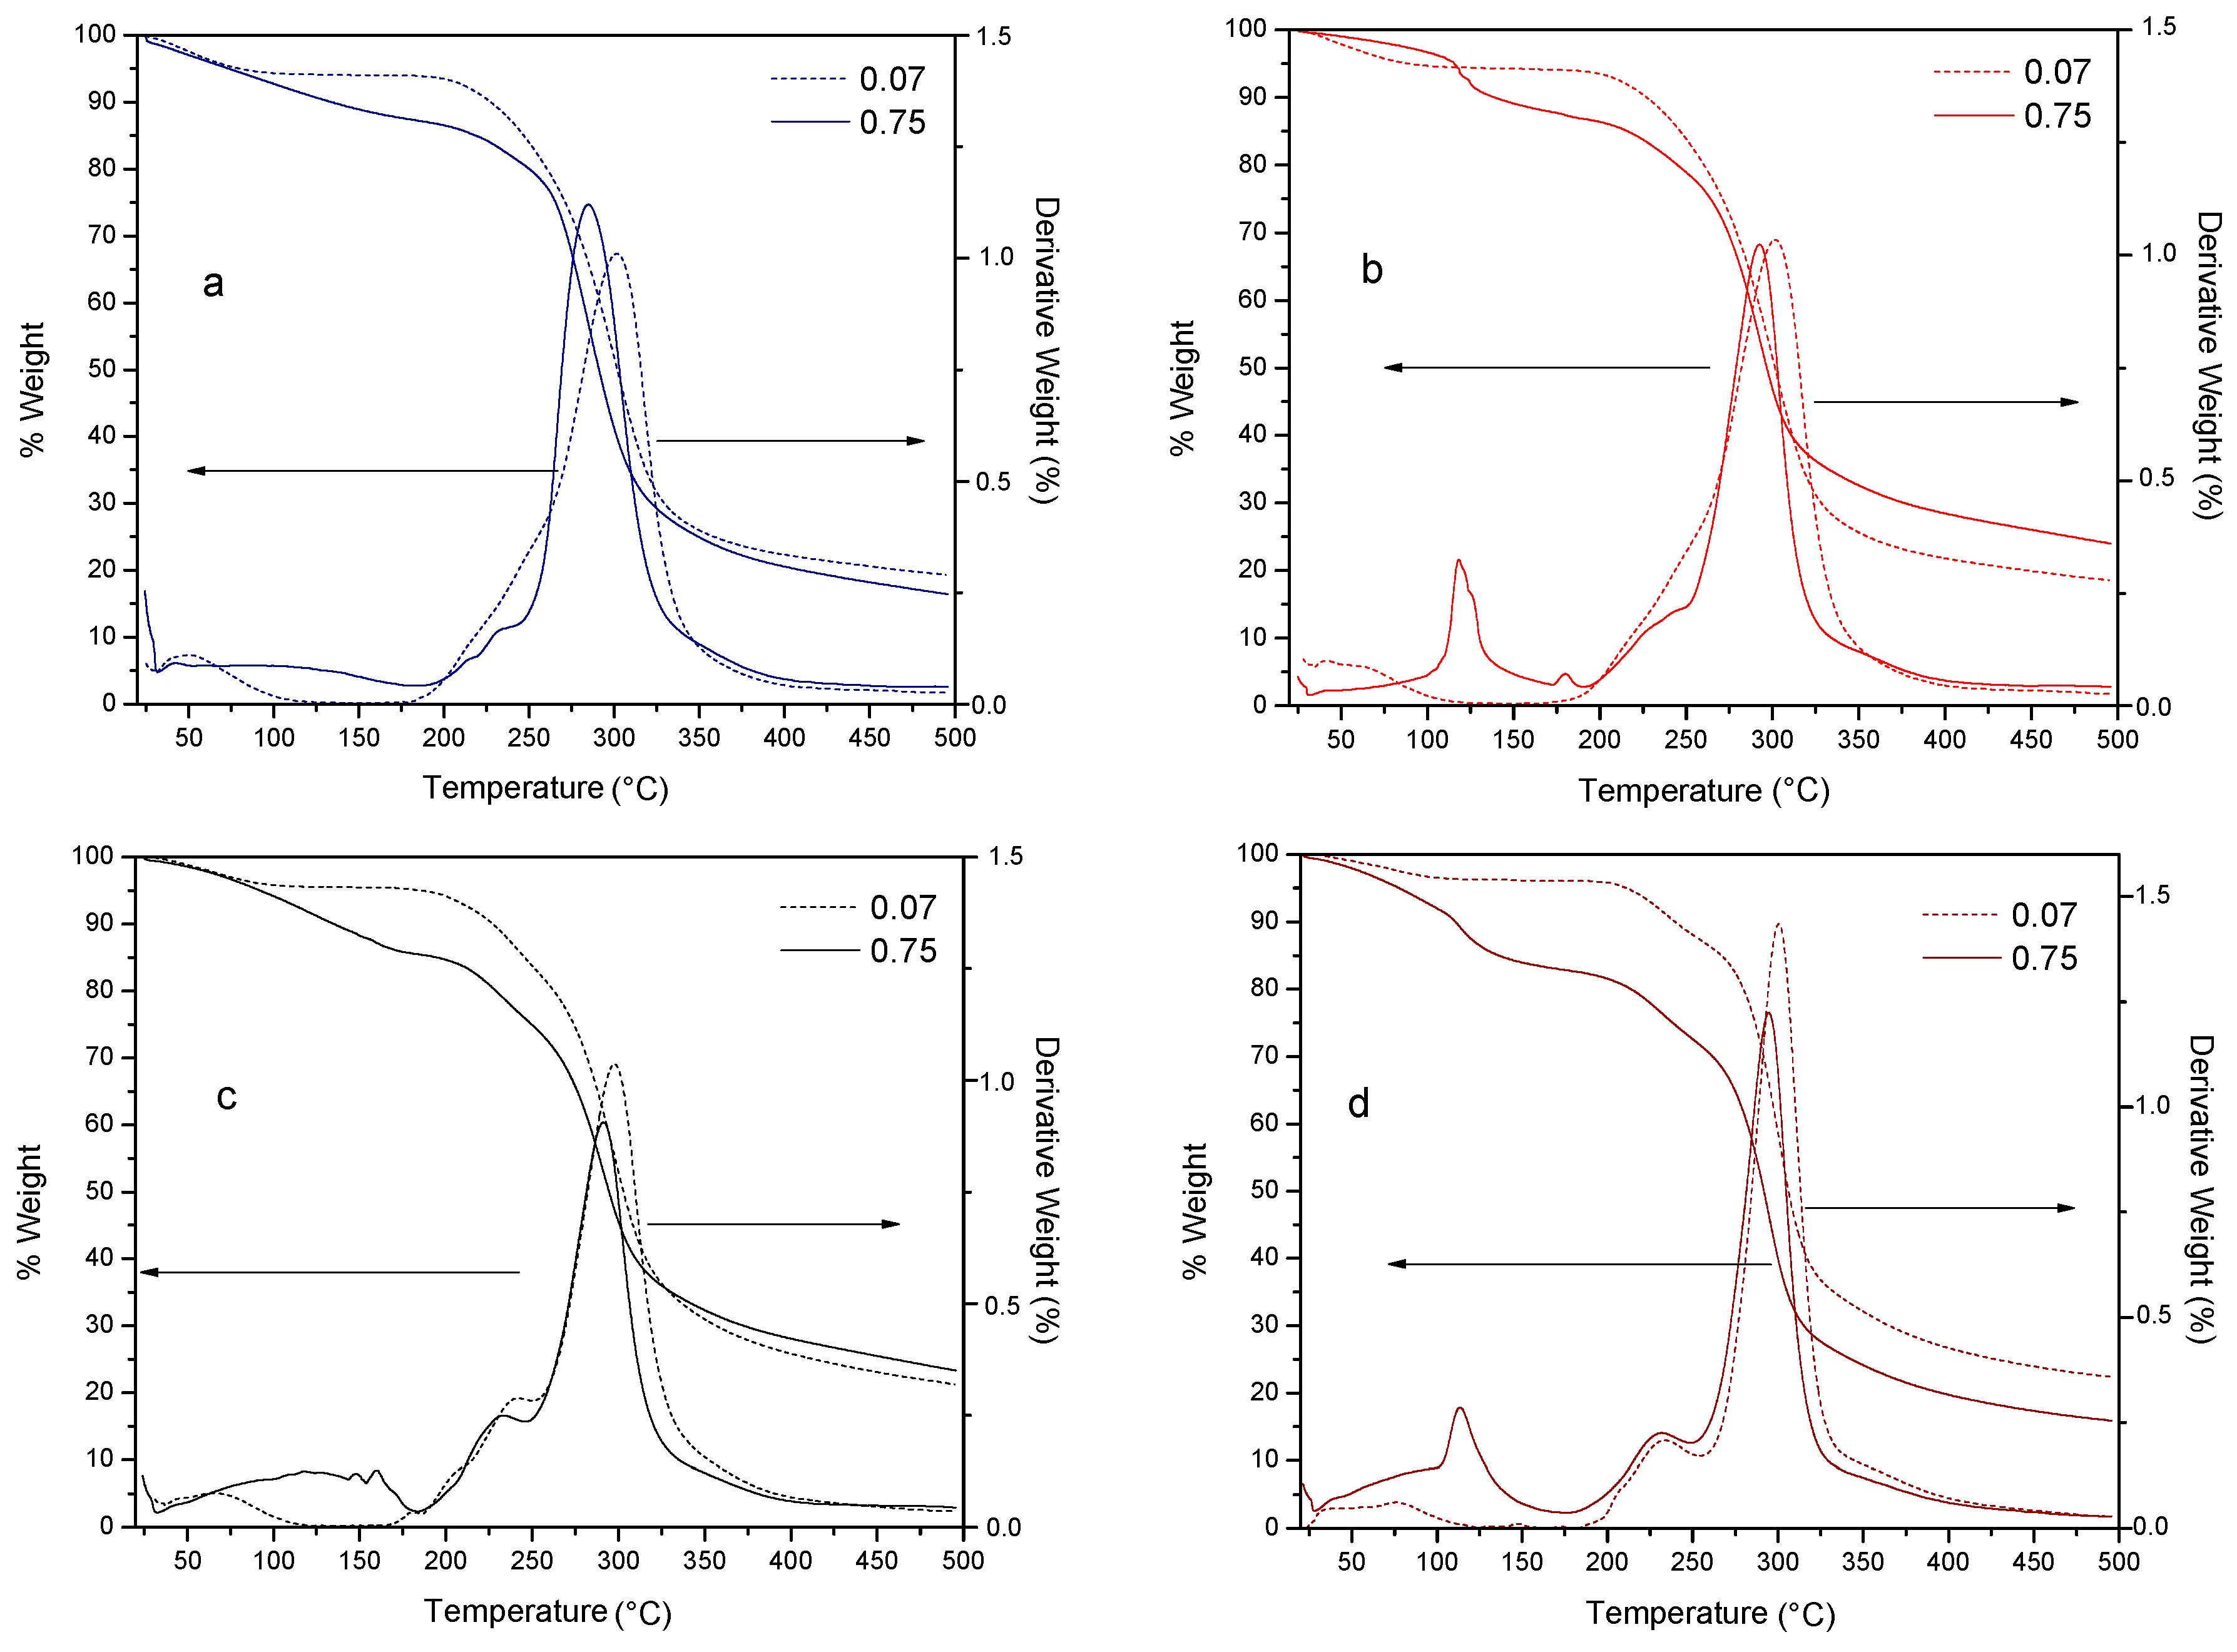
With the aid of the thermogravimetric analysis (TGA) along with its derivative (DTG) it is possible to determine the thermal degradation temperature Td of the different species contained in a sample. Particularly, the TGA analysis allows the determination of mass losses that are related to the thermal stability, being the decomposition a thermal phenomenon that starts at Td onset. The DTG allows separating thermal events occurring in a narrow temperature range. Figure 3 shows the TGA and DTG of the MXs studied in this work, corresponding to aw of 0.07 and 0.75.
In the TGA curve, the first thermal event observed was in the temperature range of 70–110 °C, associated with a first order transition such as evaporation and corresponding to approximately 3.5%–7% of water loss. A second and more pronounced thermal event was presented in the temperature range of 200–350 °C, associated with a mass loss of about 65%–70%. This mass loss was attributed to the thermal decomposition (Td) of long molecular chains, the polymerization processes and the isomerization reactions associated with dehydration [30]. In Table 3 are summarized the decomposition temperatures for the MXs at the extremes aw values (0.07 and 0.75). At low water activity, the onset (Td Onset) of the decomposition occurred in the range of 163–180 °C, whereas the peak (Td Peak) was observed about 300 °C. Although it is well known that the thermal decomposition mainly depends on the homogeneity in the chemical composition and the MWD of the carbohydrate polymer, at higher water activity some differences in both Td Onset and Td Peak were observed. These variations were attributed to the thermal hydrolysis induced by the large amount of adsorbed water and the supplied heat. The hydrolysis was observed as a broad band or as a well-defined peak at a temperature about 115 °C, and was presented only at aw of 0.75. The last feature observed in the DTG curve, it was a small decomposition peak presented about 230–240 °C. This event was identified as the thermal decomposition of the low molecular weight oligosaccharides and clearly it is related with the MWD, since samples M10, M20 and M40 showed a high content of oligosaccharides with a DP of 2. At the higher water activity, this peak was observed for all the samples studied, confirming the aforementioned thermal hydrolysis.
Figure 3. Thermal decomposition of MXs. TGA and DTG curves for: (a) Mc; (b) M10; (c) M20, and (d) M40.
Molecules 20 19746 g003
Table 3. Thermal decomposition temperatures of MXs at the extreme water activities (aw), determined from TGA-DTG curves in Figure 3.
MaltodextrinawTd onset (°C)Td peak (°C)
Mc0.07180.1301.4
0.75190.1284.7
M100.07165.2301.7
0.75192.8292.4
M200.07163.4297.6
0.75182.1291.2
M400.07180.9300.4
0.75181.8294.6
These results were of importance to set the decomposition temperature range at which the MXs can be heated for avoiding chemical changes in the product. Additionally, other thermal events were identified and related to the decomposition phenomena occurred during the heating and caused by the adsorption of water.

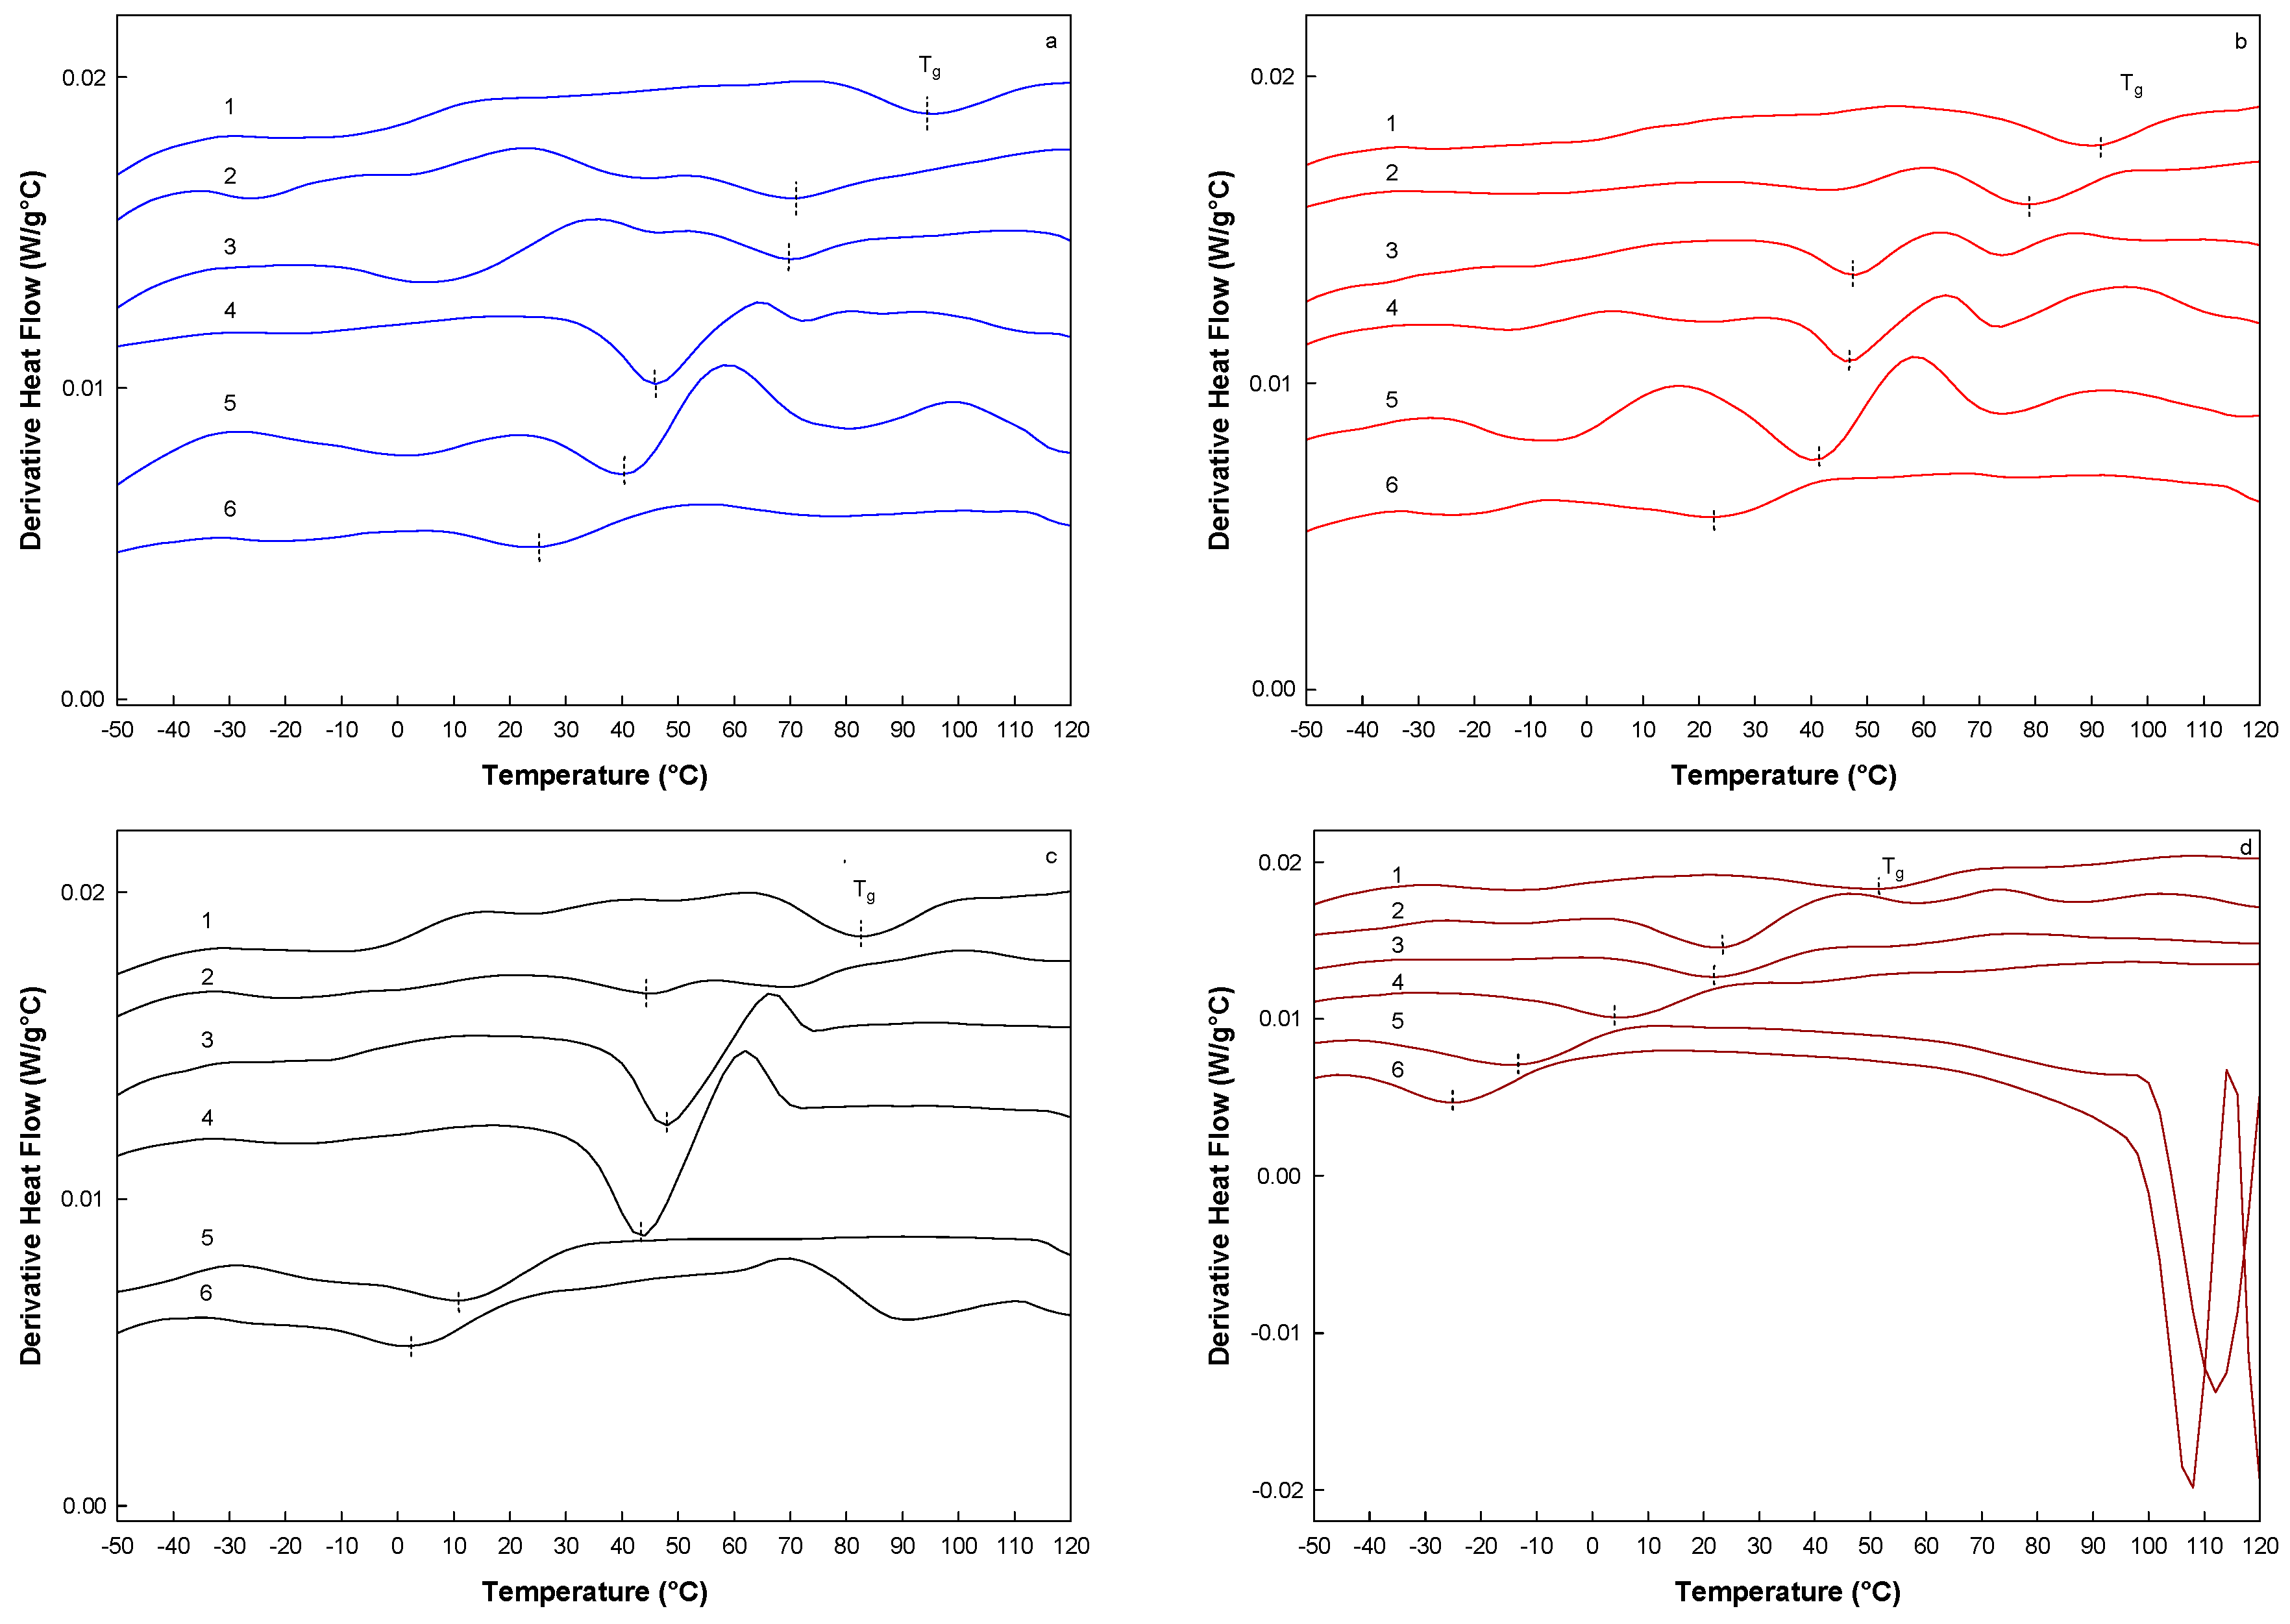
2.4. Modulated Differential Scanning Calorimetry (MDSC)

The glass transition temperature (Tg) was determined by modulated differential scanning calorimetry (MDSC), which is an extension of the conventional DSC, and it has been reported as a suitable technique for thermal characterization of biopolymers with complex thermal events [31,32]. Thus, due to the sinusoidal modulation of the temperature, MDSC is widely employed in detecting Tg. Figure 4 shows the MDSC thermograms of the MXs, which was determined by calculating the first derivative of the heat flow with respect to temperature. It was clearly observed that for a given MX, Tg decreased as aw increased. For each of the MXs the Tg decreased as 100–20 °C, 90–20 °C, 80–0 °C and 52–(−20) °C, for Mc, M10, M20 and M40, respectively. This is a normal behavior observed in sugar-rich systems such as inulin, attributed to the plasticizer effect of water promoted by the formation of hydrogen bonds on the hydrophilic groups [12]. This phenomenon causes an increase in the intermolecular free volume space, diminishing the viscosity of the system and increasing the molecular mobility [33]. Other feature observed was the decrease in the Tg with the DE. This trend was also observed by other authors [5,34]. Busin et al. [35] based on theoretical calculations proposed a linear relationship between the Tg and DE for maltodextrins within the DE range of 2–100. Our results indicated a deviation of about 68 °C below those values calculated by Busin et al. [35]. However, the MWD is a more appropriate parameter for predicting the Tg, which is associated with the mobility of the chains [36]. The results reported herein showed a linear decreasing tendency between both Mw and Mn, and the corresponding Tg value. Similar results were reported by Meuter et al. [17], for the Tg of the dextrose-maltodextrin system at different DP in the range of 1–7 and corresponding Mw of 180–1152 g/mole. They found that the highest Tg value was registered for the maltodextrin with DP of 5 and not for that with a DP of 7.
Figure 4. Thermograms of the first derivative of the MDSC for the MXs at the different aw. (a) Mc; (b) M10; (c) M20; and (d) M40. Water activities are indicated by the numbers: (1) 0.070, (2) 0.328, (3) 0.434, (4) 0.532, (5) 0.718, and (6) 0.75. The small dotted vertical line on each curve indicates the temperature at which Tg was determined.
Molecules 20 19746 g004
In addition, these results suggested a similar behavior observed in the glucose isomers such as sucrose, maltose and lactose, which present the same molecular weight but due to differences in the chemical structures, exhibit very different physical properties. Likewise, polysaccharides such as inulin (based on fructose chains) and maltodextrins (based on glucose chains) showed an opposite behavior between the MWD and the Tg. This difference may be caused by the way in which the polymer chains are arranged at the microstructure level and the position of the functional groups available to establish inter and intra-molecular interactions. The technological application of these results lies in the possibility to establish the use of a MX according to the MWD and physical properties such as the Tg. Thus, for a process where it is needed to keep the microstructural stability at temperatures below 90 °C, the low molecular weight MXs (Mc and M10) might be appropriate. An example of this, it is the spray drying process, where the structural rigidity is desired for avoiding particle agglomeration and sticking on the walls of the dryer. In the other hand, the high molecular weight MXs (M20 and M40) may be employed as additive in low temperature processes such as volume enhancers in confectionery and viscosity promoters in syrups.

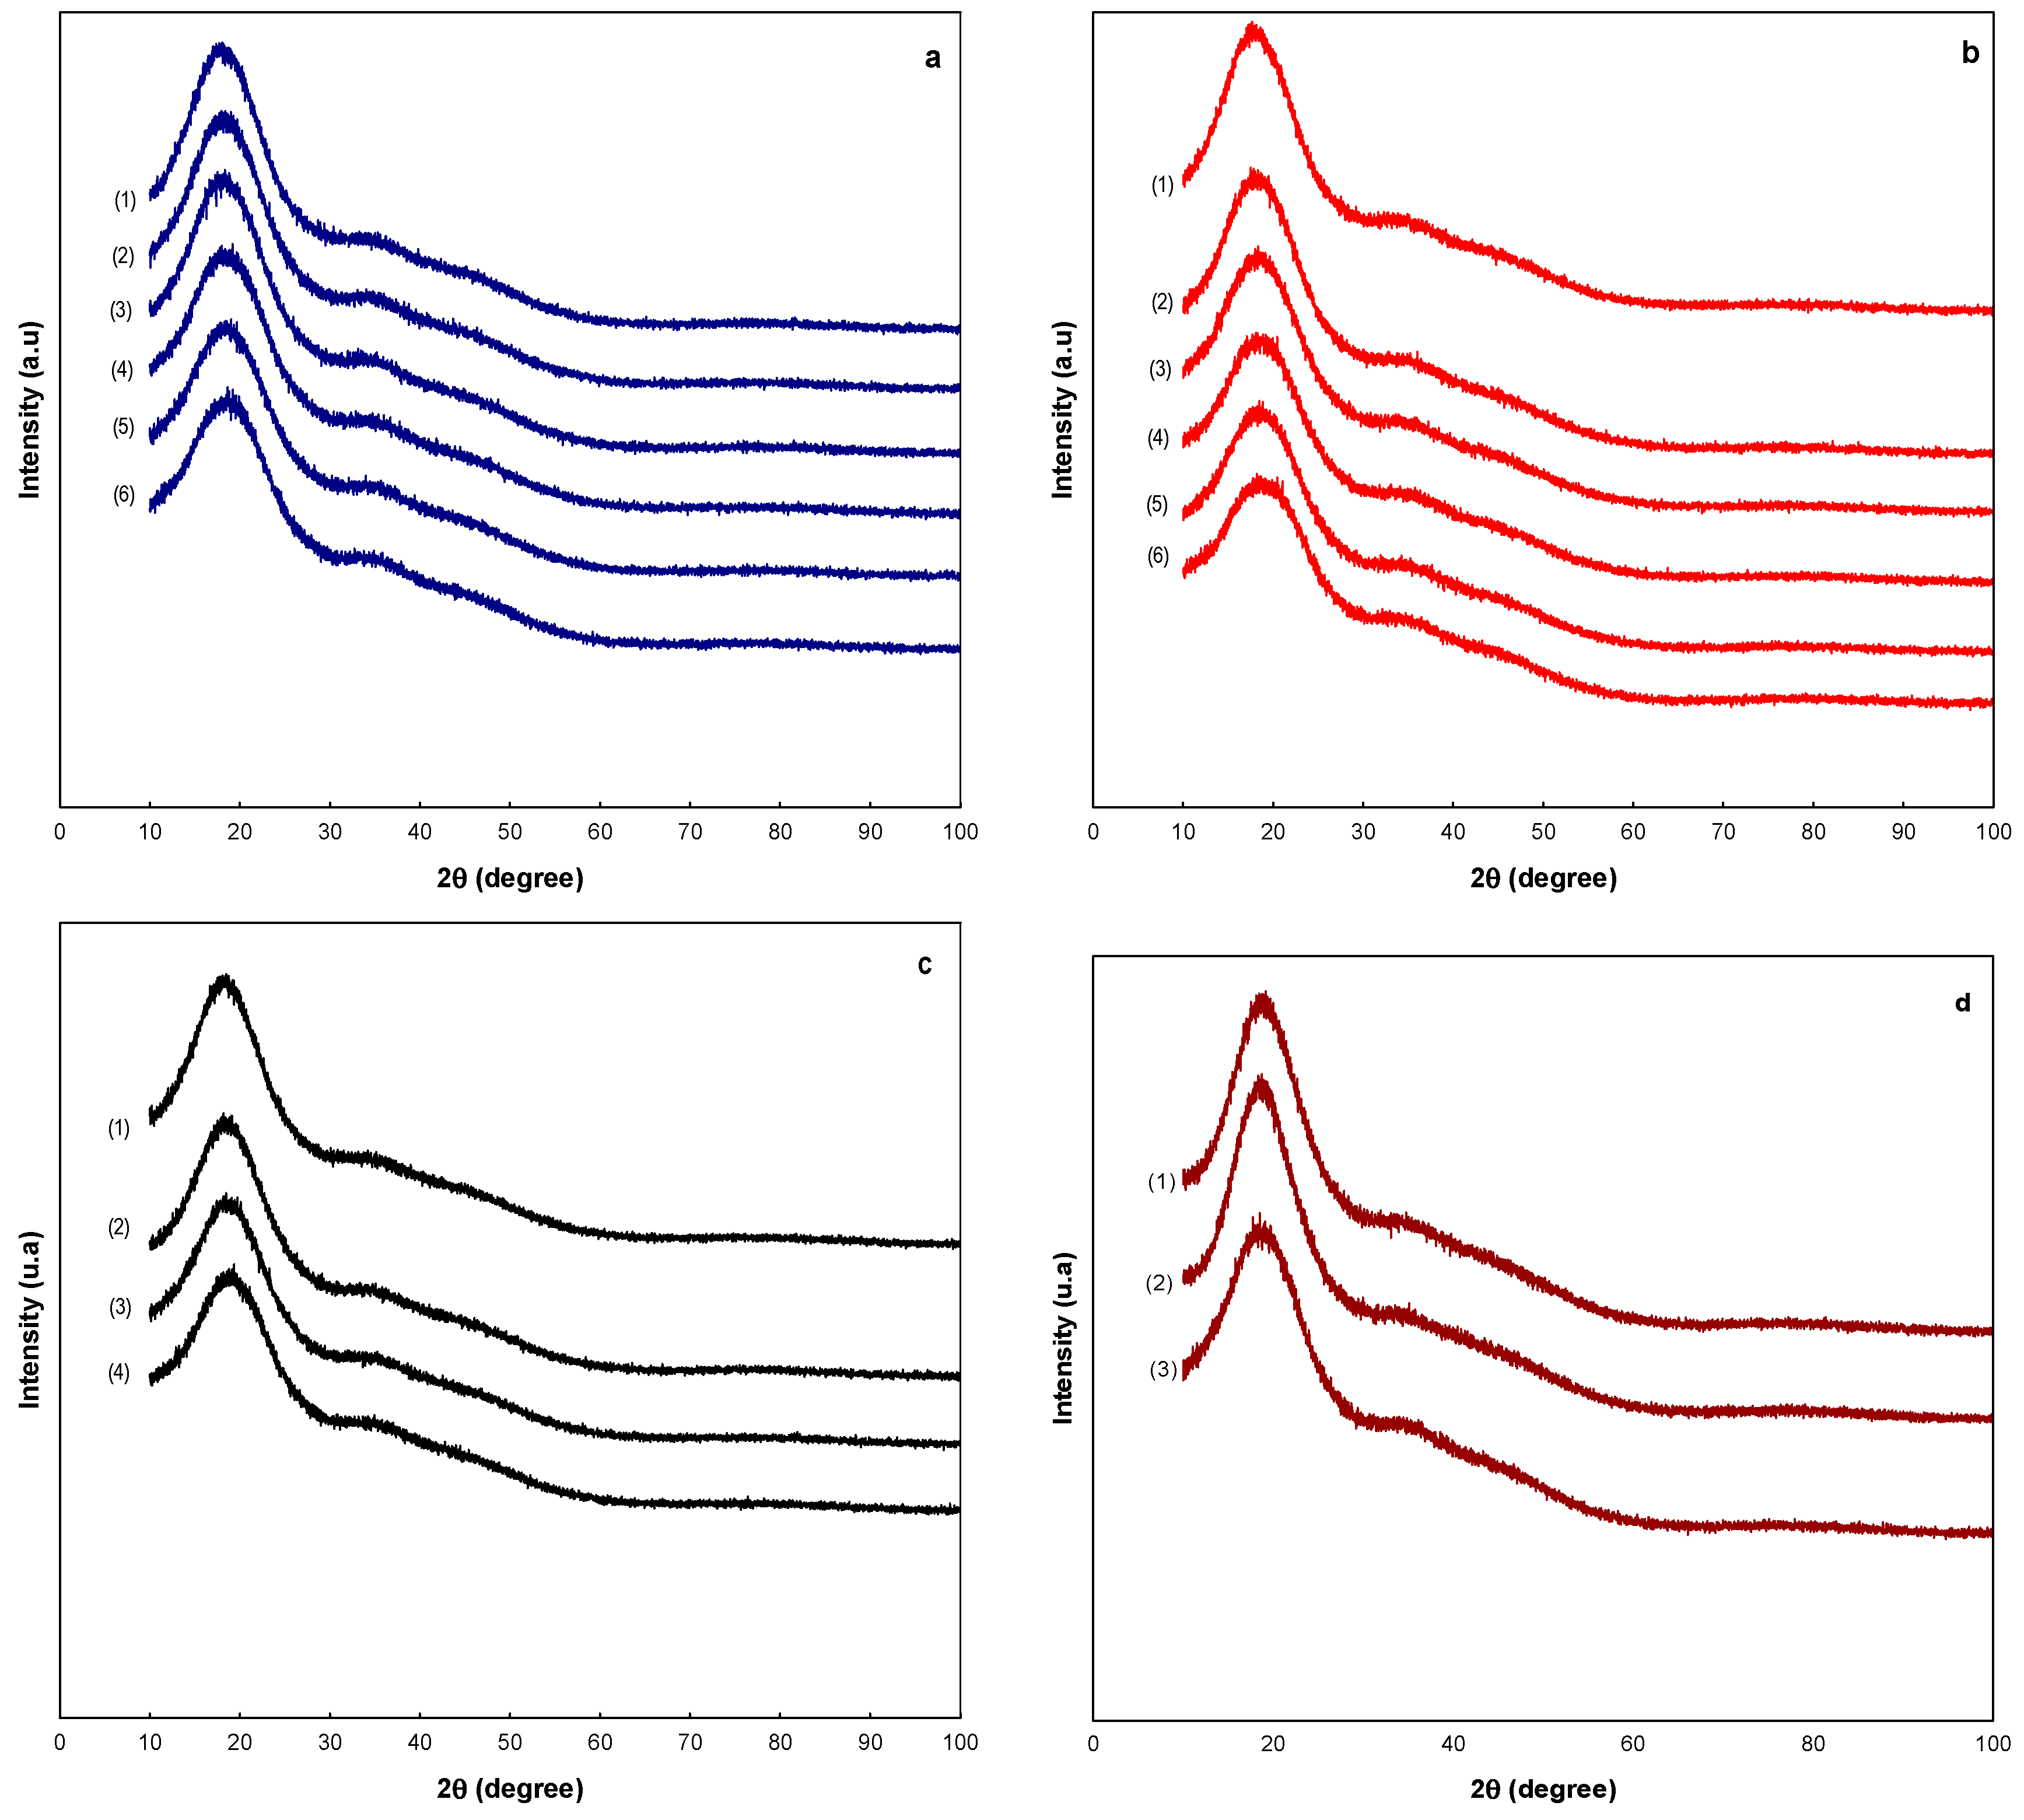
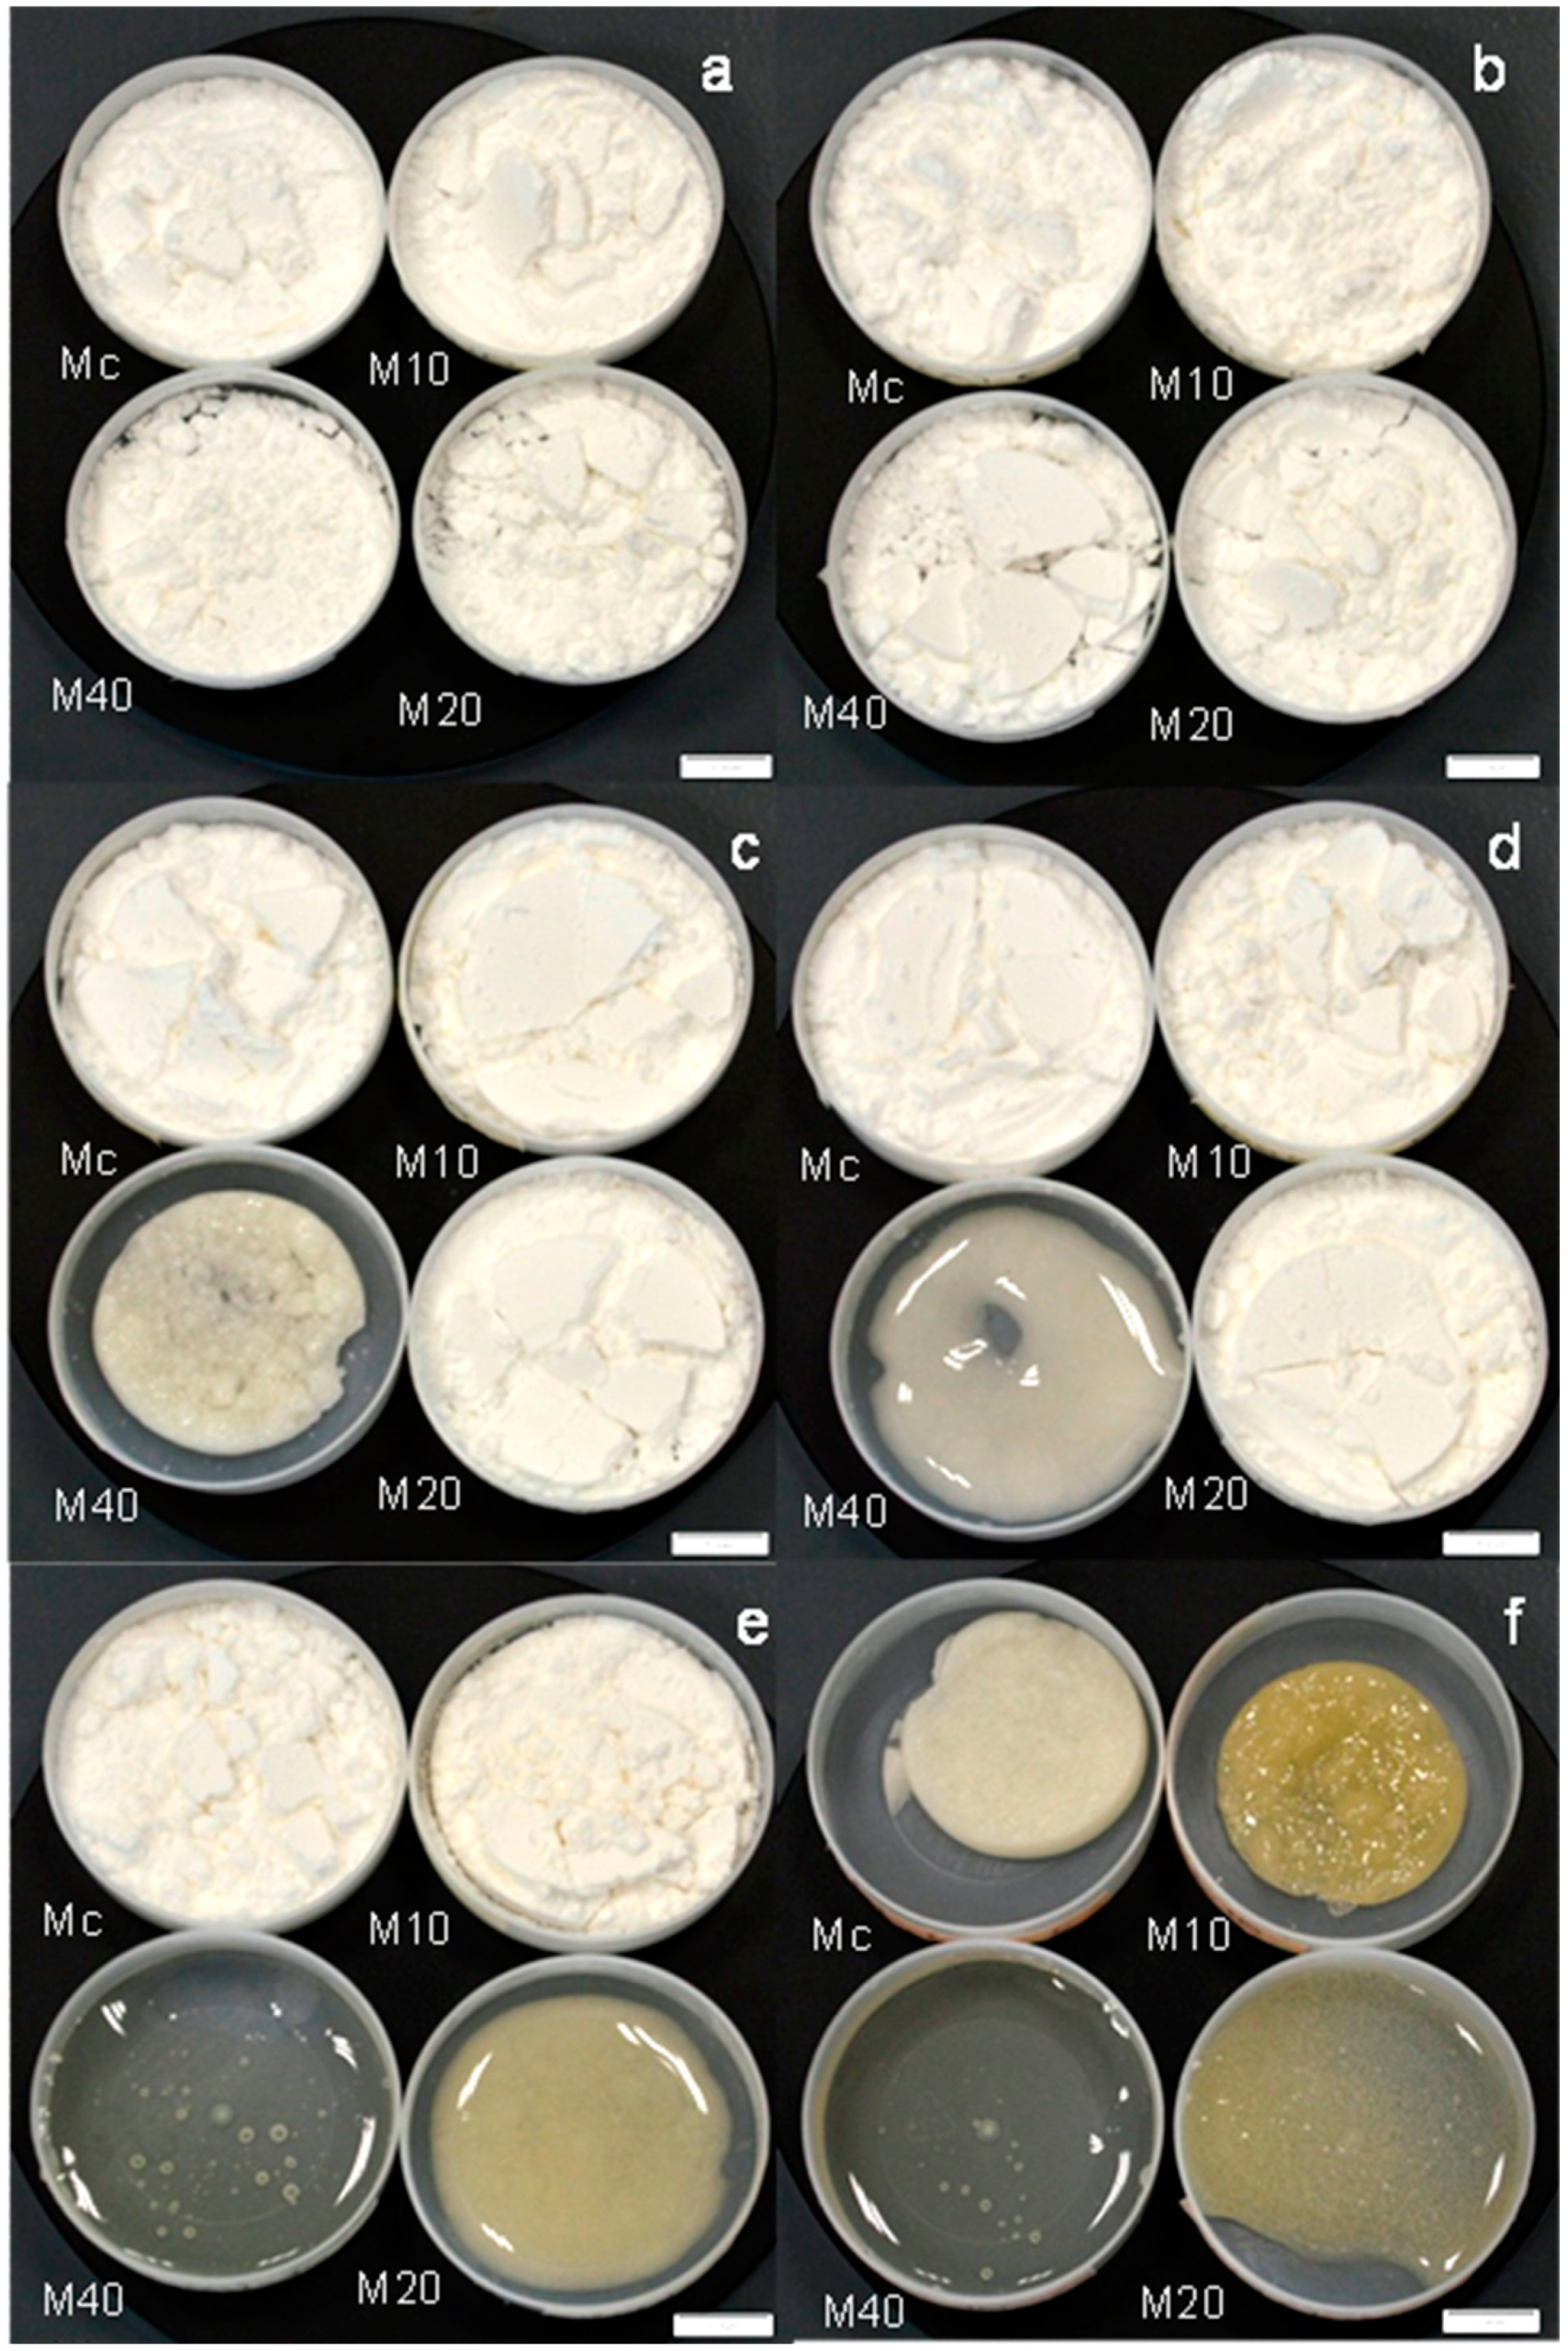
2.5. Microstructural Analysis

One of the techniques used to elucidate the state of the microstructure is by X-ray diffraction. Figure 5 shows the diffraction patterns for the MXs at the different aw. The Figure 5 includes only the diffraction patterns of the MXs samples that remained in the solid state after the adsorption of water at the given aw, i.e., only those samples where saturation of water was not presented. It was observed that all the diffraction patterns showed a broad peak about 2θ of 15° and the absence of well-defined peaks.
Figure 5. Analysis of the microstructure of the MXs by XRD: (a) Mc; (b) M10; (c) M20; and (d) M40. Water activities are indicated by the numbers: (1) 0.070, (2) 0.328, (3) 0.434, (4) 0.532, (5) 0.718, and (6) 0.75.
Molecules 20 19746 g005
These observations indicated the conservation of the amorphous microstructure in the samples at all the water activities. This is a very important finding because unlike inulin, which is composed of fructose chains and crystallizes with the adsorption of water [12], the MXs which are composed of glucose chains remained amorphous despite the amount of adsorbed water. The aforementioned changes in the microstructure were observed macroscopically as the evolution of the powder’s appearance. Figure 6 shows images of the MXs powders at the different water activities acquired with an optical microscope. Initially, the MXs were observed as well-dispersed powders i.e., non-agglomerated, and with a white color appearance. For the maltodextrins Mc, M10 and M20, this appearance remained unchanged up to a water activity about 0.532; above this value the overall appearance began to change. At aw of 0.718, the Mc sample was still observed as a dispersed powder but with a yellowish color, while at 0.75 the powder totally changed its appearance, observing the overall volume contraction and a gray color. For the M10 sample these changes were more notorious, particularly the change of color.
Figure 6. Optical micrographs of the MXs at the different water activities: Water activities are indicated by the letters: (a) 0.070; (b) 0.328; (c) 0.434; (d) 0.532; (e) 0.718; and (f) 0.75. The white scale bar is equal to 2 cm.
Molecules 20 19746 g006
The M20 sample presented the yellowish color at aw of 0.532, and then at aw of 0.718 the volume contraction was accompanied by the saturation of the powder with liquid water. The further increase of humidity at aw of 0.75 showed the dissolving of the solid and the presence of the liquid state. The M40 MX showed all these changes at earlier stages of water adsorption. At aw of 0.434 was observed the volume contraction and at aw of 0.532, the powder was fully saturated of water. Above this water activity, the M40 powder was dissolved, and the liquid phase was observed. According to the X-ray diffraction (XRD) and optical images results, the MXs did not show any changes in their microstructure i.e., crystallization, but just the transition from the solid state into a rubbery-like state. In this state, there is a high molecular movement and the powder samples may present several changes such as agglomeration, loss of volatiles, color changes, stickiness and accelerated chemical reactions. The rubbery state is seen at temperatures above the glass transition. The results from the MDSC measurements showed good agreement with the microstructural analysis results. Clearly, the adsorption of water decreased the Tg of the MXs systems, modifying the amorphous microstructure from the glass into the rubbery state, where the different changes in appearance were observed. All of these observations in the physical states could be correlated with the MWD of the MXs. For example, the low molecular weight MXs (Mc and M10) showed a lower adsorption of water and in consequence the conservation of the microstructure at relative high water activities. In the other hand, higher molecular weight MXs which presented more available sites for water adsorption, showed larger adsorptions of water. As a result, the changes in the physical state were observed at low water activities.
These results have provided great information about the changes in the physical state of the MXs, which may be helpful for selecting a maltodextrin for a particular technological application, based on the ease of being able to visually relate the evolution of the microstructure with the adsorption of water.

3. Experimental Section

3.1. Sample Preparation

Four maltodextrin powders extracted from corn starch and with different DE were employed in this work. The powders were identified as commercial maltodextrin (Mc), and according to the dextrose equivalent: DE 10 (M10), DE 20 (M20) and DE 40 (M40). Mc powder was acquired from INAMALT (Gualadajara, Mexico) and M10, M20 and M40 from INGREDION Mexico (Guadalajara, Mexico). DE was determined by triplicate according to a standard method based on titration with Fehling’s solution and methylene blue as indicator [37].

3.2. Mass Spectrometry Analysis

Molecular mass and molecular mass distributions were determined by mass spectrometry (MS) analyses in a high performance Matrix-assisted Laser desorption/ionization (MALDI) system equipped with a time-of-flight (TOF) mass spectrometer (Autoflex Speed, Bruker Corp., Billerica, MA, USA). MX powder (1 mg) was dissolved in chloroform (1 mL) and mixed with 1.5 μL of saturated solution of 2,5-dihydroxybenzoic acid. The solution was deposited onto the MALDI plate and irradiated with a pulsed nitrogen laser (337 nm) for desorption and ionization. 500 laser shots were averaged for each sample to obtain the representative mass to charge (m/z) spectra. Molecular weight distributions were determined from MALDI-TOF using the Polytoos v.10 software (Bruker). Each analysis was repeated three times.

3.3. Sorption Isotherms

From each dried sample, approximately 2 g MX powder were placed into a closed beaker containing different saturated reagents. The reagents employed for reaching the desired water activity (aw) at equilibrium were: NaOH (0.070), MgCl2 (0.328), K2CO3 (0.434), Mg (NO3)2 (0.528), SrCl (0.718) and NaCl (0.75). Incubation temperature was chosen based on an average storage temperature, considering the range of 25–35 °C as the room temperature commonly used in warehouses. Dried samples were left for incubation for 30 days at 30 °C [38]. After the incubation time was elapsed, aw was determined into an Aqualab Series 3 Water Activity Meter (Decagon Devices, Inc., Pullman, WA, USA). Water content was measured accordingly to the AOAC method, which requires drying the sample at an oven at 110 °C for 2 h. Each experiment was performed in triplicate.

3.4. Thermal Analysis

Thermogravimetric (TGA) and Differential Scanning Calorimetry (DSC) analyses were carried out in a simultaneous TGA-DSC SDT Q600 (TA Instruments, New Castle, DE USA). For DSC, baseline was calibrated with Indium (melting temperature of 156.6 °C and melting enthalpy of 28.47 J/g). Samples of 5–10 mg were encapsulated in standard aluminum pans. Thermograms were recorded at a heating rate of 5 °C/min over a range of 25–500 °C. Using the Universal Analysis 2000© software, different features from the curves were identified: mass loss (% w/w), initial and final peak melting temperatures (Tm onset, Tm peak and Tm final, respectively), and initial and final peak degradation temperatures (Td onset, Td peak and Td final, respectively).

3.5. Modulated Differential Scanning Calorimetry (MDSC)

A modulated DSC Q200 (TA Instruments, New Castle, DE, USA) equipped with an RCS90 cooling system was employed for accurately determining the glass transition temperature (Tg) of MXs samples. The instrument was also calibrated with Indium for melting temperature and enthalpy, meanwhile Sapphire was used as the standard for the heat capacity (Cp) calibration. Samples ranging in 5–10 mg were encapsulated in Tzero® aluminum pans. Thermograms were acquired at a temperature range of −90 to 250 °C, with a modulation period of 40 s and temperature amplitude of 1.5 °C. Each experiment was repeated three times.

3.6. Structural Analysis by X-Ray Diffraction (XRD)

The structure of maltodextrin samples was qualitatively determined by XRD analysis in an X’Pert Empyrean diffractometer (PANalytical, Almelo, The Netherlands) with Cu-Kα radiation (l = 1.5406 Å) operated at 45 kV, 40 mA and equipped with a X’Celerator detector in a Bragg-Brentano geometry. Scans were performed in the 2θ range of 10°–100°, with step size of 0.016° and 20 s per step.

3.7. Optical Microscopy

The overall morphology and appearance were evaluated by optical microscopy with a stereomicroscope SZX16 (Olympus©, Melville, NY, USA). Micrographs were acquired at 2X with a digital camera of 12 Mpx.

4. Conclusions

Four maltodextrin (MX) systems with different dextrose equivalents (DE) and degrees of polymerization (DP) were studied in this work. The technological application for each maltodextrin was provided based on the characterization of the physical properties. The results showed a direct relation between the DE and the DP. Of these two parameters, the DP provided a better understanding of the microstructure of the MXs. The adsorption performance of the MXs was similar at low water activities (aw), but varied very much at higher aw. These variations were attributed to the differences in the DP, where the larger DP presented the more available sites for water adsorption. The decomposition temperature (Td) was determined from the thermogravimetric analysis (TGA), finding that the combined effect of water adsorption and heat, induced the thermal hydrolysis of the low molecular weight species contained in the MXs. The glass transition temperature (Tg) was accurately determined by modulated differential scanning calorimetry (MDSC), observing a linear decreasing tendency between the molecular weights and the corresponding Tg. This behavior suggested differences in the way the polymer chains of glucose units were arranged at the microstructural level. The microstructural analysis by XRD showed the conservation of the amorphous structure at all aw. These results indicated that the glucose units in the DP range of 2–30 did not crystallize with the adsorption of water, which is an abnormal behavior observed in other sugar-rich systems. The evolution of the amorphous glassy structure into a rubbery state was macroscopically monitored by optical microscopy, clearly observing changes in the overall appearance of the MXs powders. All of these results allowed to set the potential applications for each MX based on the DP.

Acknowledgments

The technical support provided by Francisco Longoria and Marco Bravo, with the XRD and digital images acquisition, respectively, is gratefully acknowledged. The support provided from the Consejo Nacional de Ciencia y Tecnología (CONACyT) in Mexico, through the grant No. 247906.

Author Contributions

M.Z. Saavedra-Leos conceived and designed the experiments, and analyzed the data; C. Leyva-Porras, analyzed and discussed the data, and wrote the paper; S.B Araujo-Diaz, A. Toxqui-Terán and A.J. Borrás-Enríquez performed the experiments.

Conflicts of Interest

The authors declare no conflict of interest.

References

  1. Valenzuela, C.; Aguilera, J.M. Effects of maltodextrin on hygroscopicity and crispness of apple leathers. J. Food Eng. 2015, 144, 1–9. [Google Scholar] [CrossRef]
  2. Sun, J.; Zhao, R.; Zeng, J.; Li, G.; Li, X. Characterization of Destrins with Different Dextrose Equivalents. Molecules 2010, 15, 5162–5173. [Google Scholar] [CrossRef] [PubMed]
  3. Udomrati, S.; Gohtani, S. Tapioca maltodextrin fatty acid ester as a potential stabilizer for Tween 80-stabilized oil-in-water emulsions. Food Hydrocoll. 2015, 44, 23–31. [Google Scholar] [CrossRef]
  4. Rong, Y.; Sillick, M.; Gregson, C.M. Determination of Dextrose Equivalent Value and Number Average Molecular Weight of Maltodextrin by Osmometry. J. Food Sci. 2009, 74, C33–C40. [Google Scholar] [CrossRef] [PubMed]
  5. Descamps, N.; Palzer, S.; Roos, Y.H.; Fitzpatrick, J.J. Glass transition and flowability/caking behaviour of maltodextrin DE 21. J. Food Eng. 2013, 119, 809–813. [Google Scholar] [CrossRef]
  6. Santiago, A.R.; Medina, T.L.; Gallegos, I.J.A.; Calderas, F.; González, L.R.F.; Rocha, G.N.E.; Ochoa, M.L.A.; Bernard, B.M.J. Spray drying-microencapsulation of cinnamon infusions (Cinnamomum zeylanicum) with maltodextrin. LWT Food Sci. Technol. 2015, 64, 571–577. [Google Scholar] [CrossRef]
  7. Kao, T.H.; Chen, B.H. Effects of different carriers on the production of isoflavone powder from soybean cake. Molecules 2007, 12, 917–931. [Google Scholar] [CrossRef] [PubMed]
  8. Porras, S.J.; Palacios, G.E.; Lartundo, R.L.; Garibay, F.V.; Yáñez, F.J.; Hernández, S.H.; Gutiérrez, L.G.; Alamilla, B.L. Microstructural properties and distribution of components in microparticles obtained by spray-drying. J. Food Eng. 2015, 152, 105–112. [Google Scholar] [CrossRef]
  9. Solval, K.M.; Sundararajan, S.; Alfaro, L.; Sathivel, S. Development of cantaloupe (Cucumis melo) juice powders using spray drying technology. LWT Food Sci. Technol. 2012, 46, 287–293. [Google Scholar] [CrossRef]
  10. Paini, M.; Aliakbarian, B.; Casazza, A.A.; Lagazzo, A.; Botter, R.; Perego, P. Microencapsulation of phenolic compounds from olive pomace using spray drying: A study of operative parameters. LWT Food Sci. Technol. 2015, 62, 177–186. [Google Scholar] [CrossRef]
  11. Castro, M.R.; Barragán, H.B.E.; Yáñez, F.J. Use of gelatin-maltodextrin composite as an encapsulation support for clarified juice from purple cactus pear (Opuntia stricta). LWT Food Sci. Technol. 2015, 62, 242–248. [Google Scholar] [CrossRef]
  12. Saavedra, L.M.Z.; Leyva, P.C.; Martínez, G.E.; Pérez, G.S.A.; Aguilar, M.J.A.; Álvarez, S.C. Physical properties of inulin and inulin-orange juice: Physical characterization and technological application. Carbohydr. Polym. 2014, 105, 10–19. [Google Scholar] [CrossRef] [PubMed]
  13. Bhusari, S.N.; Muzaffar, K.; Kumar, P. Effect of carrier agents on physical and microstructural properties of spray dried tamarind pulp powder. Powder Technol. 2014, 266, 354–364. [Google Scholar] [CrossRef]
  14. Harvey, D.J. Analysis of carbohydrates and glycoconjugates by matrix-assisted laser desorption/ionization mass spectrometry: An update for the period 2005–2006. Mass Spectrom. Rev. 2011, 30, 1–100. [Google Scholar] [CrossRef] [PubMed]
  15. Kazmaier, T.; Roth, S.; Zapp, J.; Harding, M.; Kuhn, R. Quantitative analysis of malto-oligosaccharides by MALDI-TOF mass spectrometry, capillary electrophoresis and anion exchange chromatography. J. Anal. Chem. 1998, 361, 473–478. [Google Scholar] [CrossRef]
  16. Zhu, H.; Yalcin, T.; Li, L. Analysis of the Accuracy of Determining Polydispersity Polymers by Matrix-Assisted. Am. Soc. Mass Spectrom. 1998, 9, 275–281. [Google Scholar] [CrossRef]
  17. De Meuter, P.; Rahier, H.; van Mele, B. Recrystallisation of starch studied with MDSC. Nat. Biol. Syst. Reveal. Therm. Methods 2004, 2, 49–68. [Google Scholar]
  18. Kennedy, J.F.; Noy, R.J.; Stead, J.A.; White, C.A. Factors Affecting, and Prediction of, the Low Temperature Precipitation of Commercial Low DE Maltodextrins. Starch 1986, 38, 273–281. [Google Scholar] [CrossRef]
  19. Chronakis, I.S. On the molecular characteristics, compositional properties, and structural-functional mechanisms of maltodextrins: A review. Crit. Rev. Food Sci. Nutr. 1998, 38, 599–637. [Google Scholar] [CrossRef] [PubMed]
  20. Marchal, L.M.; Beeftink, H.H.; Tramper, J. Towards a rational design of commercial maltodextrins. Trends Food Sci. Technol. 1999, 10, 345–355. [Google Scholar] [CrossRef]
  21. Silva, M.D.; Nunes, C.; Pereira, I.; Moreira, A.S.P.; Domingues, M.M.R.; Coimbra, A.M.; Gama, M.F. Structural analysis of dextrins and characterization of dextrin-based biomedical hidrogels. Carbohydr. Polym. 2014, 114, 458–466. [Google Scholar] [CrossRef] [PubMed]
  22. Timmmermann, E.O. A BET-like three sorption stage isotherm. Journal of Chemical Society. J. Chem. Soc. 1989, 85, 1631–1645. [Google Scholar]
  23. Brunauer, S.; Deming, L.S.; Deming, W.E.; Teller, E. On a theory of Van der Waals adsorption of gases. J. Am. Chem. Soc. 1940, 62, 23–1732. [Google Scholar] [CrossRef]
  24. Fabra, M.J.; Talens, P.; Moraga, G.; Martínez, N.N. Sorption isotherm and state diagram of grapefruit as a tool to improve product processing and stability. J. Food Eng. 2009, 93, 52–58. [Google Scholar] [CrossRef]
  25. Mosquera, L.H.; Moraga, G.; Martínez, N.N. Critical water activity and critical water content of freeze-dried strawberry powder as affected by maltodextrin and arabic gum. Food Res. Int. 2012, 47, 201–206. [Google Scholar] [CrossRef]
  26. Prieto, F.; Gordillo, A.; Prieto, J.; Aldapa, C.; Román, A. Evaluación de las isotermas de sorción en cereales para desayuno. Superf. Vacío 2006, 19, 12–19. [Google Scholar]
  27. Lewicki, P.P. The applicability of the GAB model to food water sorption isotherms. Int. J. Food Sci. Technol. 1997, 32, 553–557. [Google Scholar] [CrossRef]
  28. Pérez, A.C.; Beristain, C.I.; Lobato, C.C.; Rodríguez, H.M.E.; Vernon, C.E.J. Thermodynamic analysis of the sorption isotherms of pure and blended carbohydrate polymers. J. Food Eng. 2006, 77, 753–760. [Google Scholar] [CrossRef]
  29. Martínez, N.N.; Andrés, G.A.M.; Boix, C.; Fito, M.P. Termodinámica Y Cinética de Sistemas Alimento Entorno; Universitat Politècnica de València: Valencia, Spain, 1998; pp. 8–66. [Google Scholar]
  30. Jiang, B.; Liu, Y.T.; Bhandari, B.; Zhou, W.B. Impact of caramelization on the glass transition temperature of several caramelized sugars. Part 1: Chemical analyses. J. Agric. Food Chem. 2008, 56, 5148–5152. [Google Scholar] [CrossRef] [PubMed]
  31. Rahman, M.S. Food stability determination by macro-micro region concept in the state diagram and by defining a critical temperature. J. Food Eng. 2010, 99, 402–416. [Google Scholar] [CrossRef]
  32. Kumar, L.; Popat, D.; Bansal, A.K. Investigation of the Atypical Glass Transition and Recrystallization Behavior of Amorphous Prazosin Salts. Pharmaceutics 2011, 3, 525–537. [Google Scholar] [CrossRef] [PubMed]
  33. Collares, F.P.; Kieckbusch, T.G.; Finzer, J.R.D. Revisão : A Transição Vítrea em Produtos Alimentícios Review : Glass Transition in Food Products. Braz. J. Food Technol. 2002, 5, 117–130. [Google Scholar]
  34. Peng, Z.; Li, J.; Guan, Y.; Zhao, G. Effect of carriers on physicochemical properties, antioxidant activities and biological components of spray-dried purple sweet potato flours. LWT Food Sci. Technol. 2013, 51, 348–355. [Google Scholar] [CrossRef]
  35. Busin, L.; Buisson, P.; Bimbenet, J.J. Notion de transition vitreuse appliqué au sechage par pulverisation de solutions glucidiques. Sci. Aliment. 1996, 16, 443–459. [Google Scholar]
  36. Wang, Y.J.; Wang, L. Structures and Properties of Commercial Maltodextrins from Corn, Potato, and Rice Starches. Starch 2000, 52, 296–304. [Google Scholar] [CrossRef]
  37. Lane, J.H.; Eynon, L. Volumetric determination of reducing sugars by means of Fehling’s solution, with methylene as internal indicator. J. Chem. Soc. Trans. 1923, 42, 32–36. [Google Scholar]
  38. Kiranoudis, C.T.; Maroulis, Z.B.; Tsami, E.; Marinos, K.D. Equilibrium moisture content and heat of desorption of some vegetables. J. Food Eng. 1993, 20, 55–74. [Google Scholar] [CrossRef]
  • Sample Availability: Samples are available from the authors.

