
miRNA Stability in Frozen Plasma Samples

 ,
,  , ,
, ,  and
and
Abstract
:1. Introduction
2. Results and Discussion

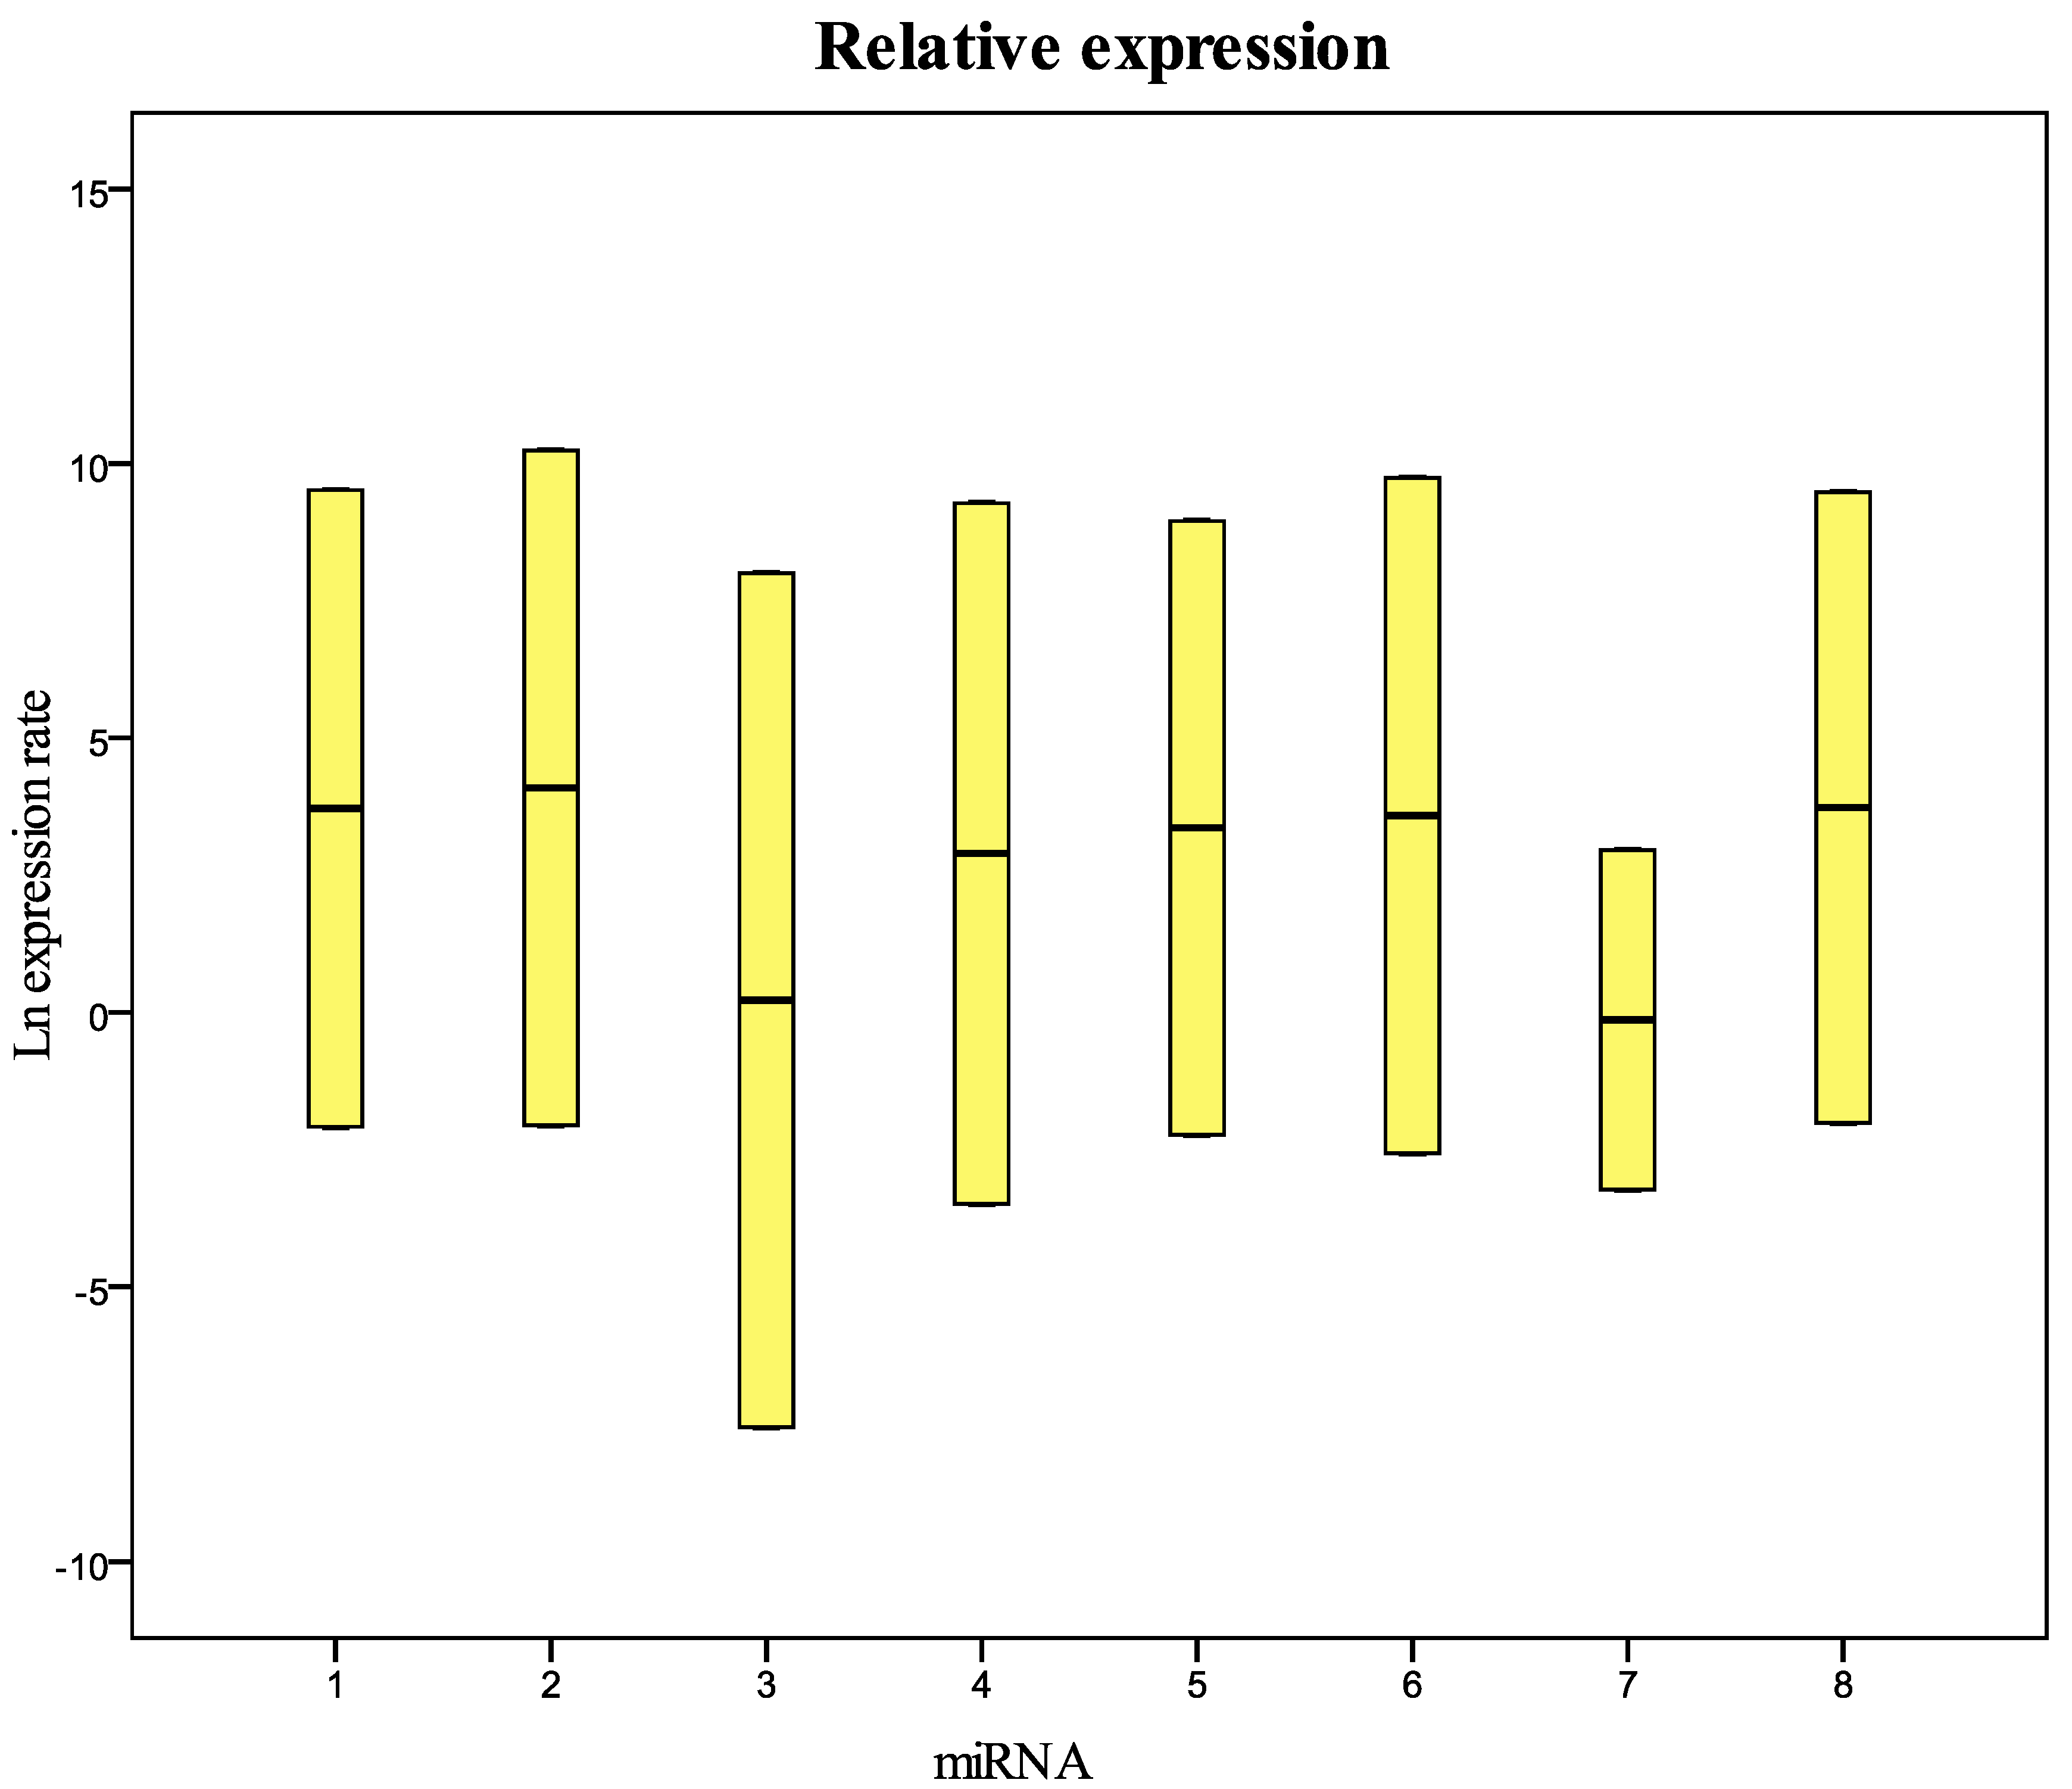
| miRNA | Type | Reaction Efficiency | Expression | Std. Error | 95% C.I. | P(H1) |
|---|---|---|---|---|---|---|
| 1 | TRG | 1 | 2.210 | 0.181–16.260 | 0.080–246.143 | 0.468 |
| 2 | TRG | 1 | 2.141 | 0.388–76.793 | 0.039–683.002 | 0.592 |
| 3 | TRG | 1 | 0.271 | 0.016–1.566 | 0.007–38.257 | 0.331 |
| 4 | TRG | 1 | 2.039 | 0.563–22.424 | 0.051–170.211 | 0.497 |
| 5 | TRG | 1 | 6.907 | 0.377–496.960 | 0.020–27.857 | 0.365 |
| 6 | TRG | 1 | 1.247 | 0.024–128.740 | 0.011–4.842 | 0.951 |
| 7 | TRG | 1 | 1.211 | 0.380–6.831 | 0.043–34.196 | 0.765 |
| 8 | TRG | 1 | 0.342 | 0.061–3.016 | 0.001–73.104 | 0.502 |
| U6snRNA | REF | 1 | 1 |
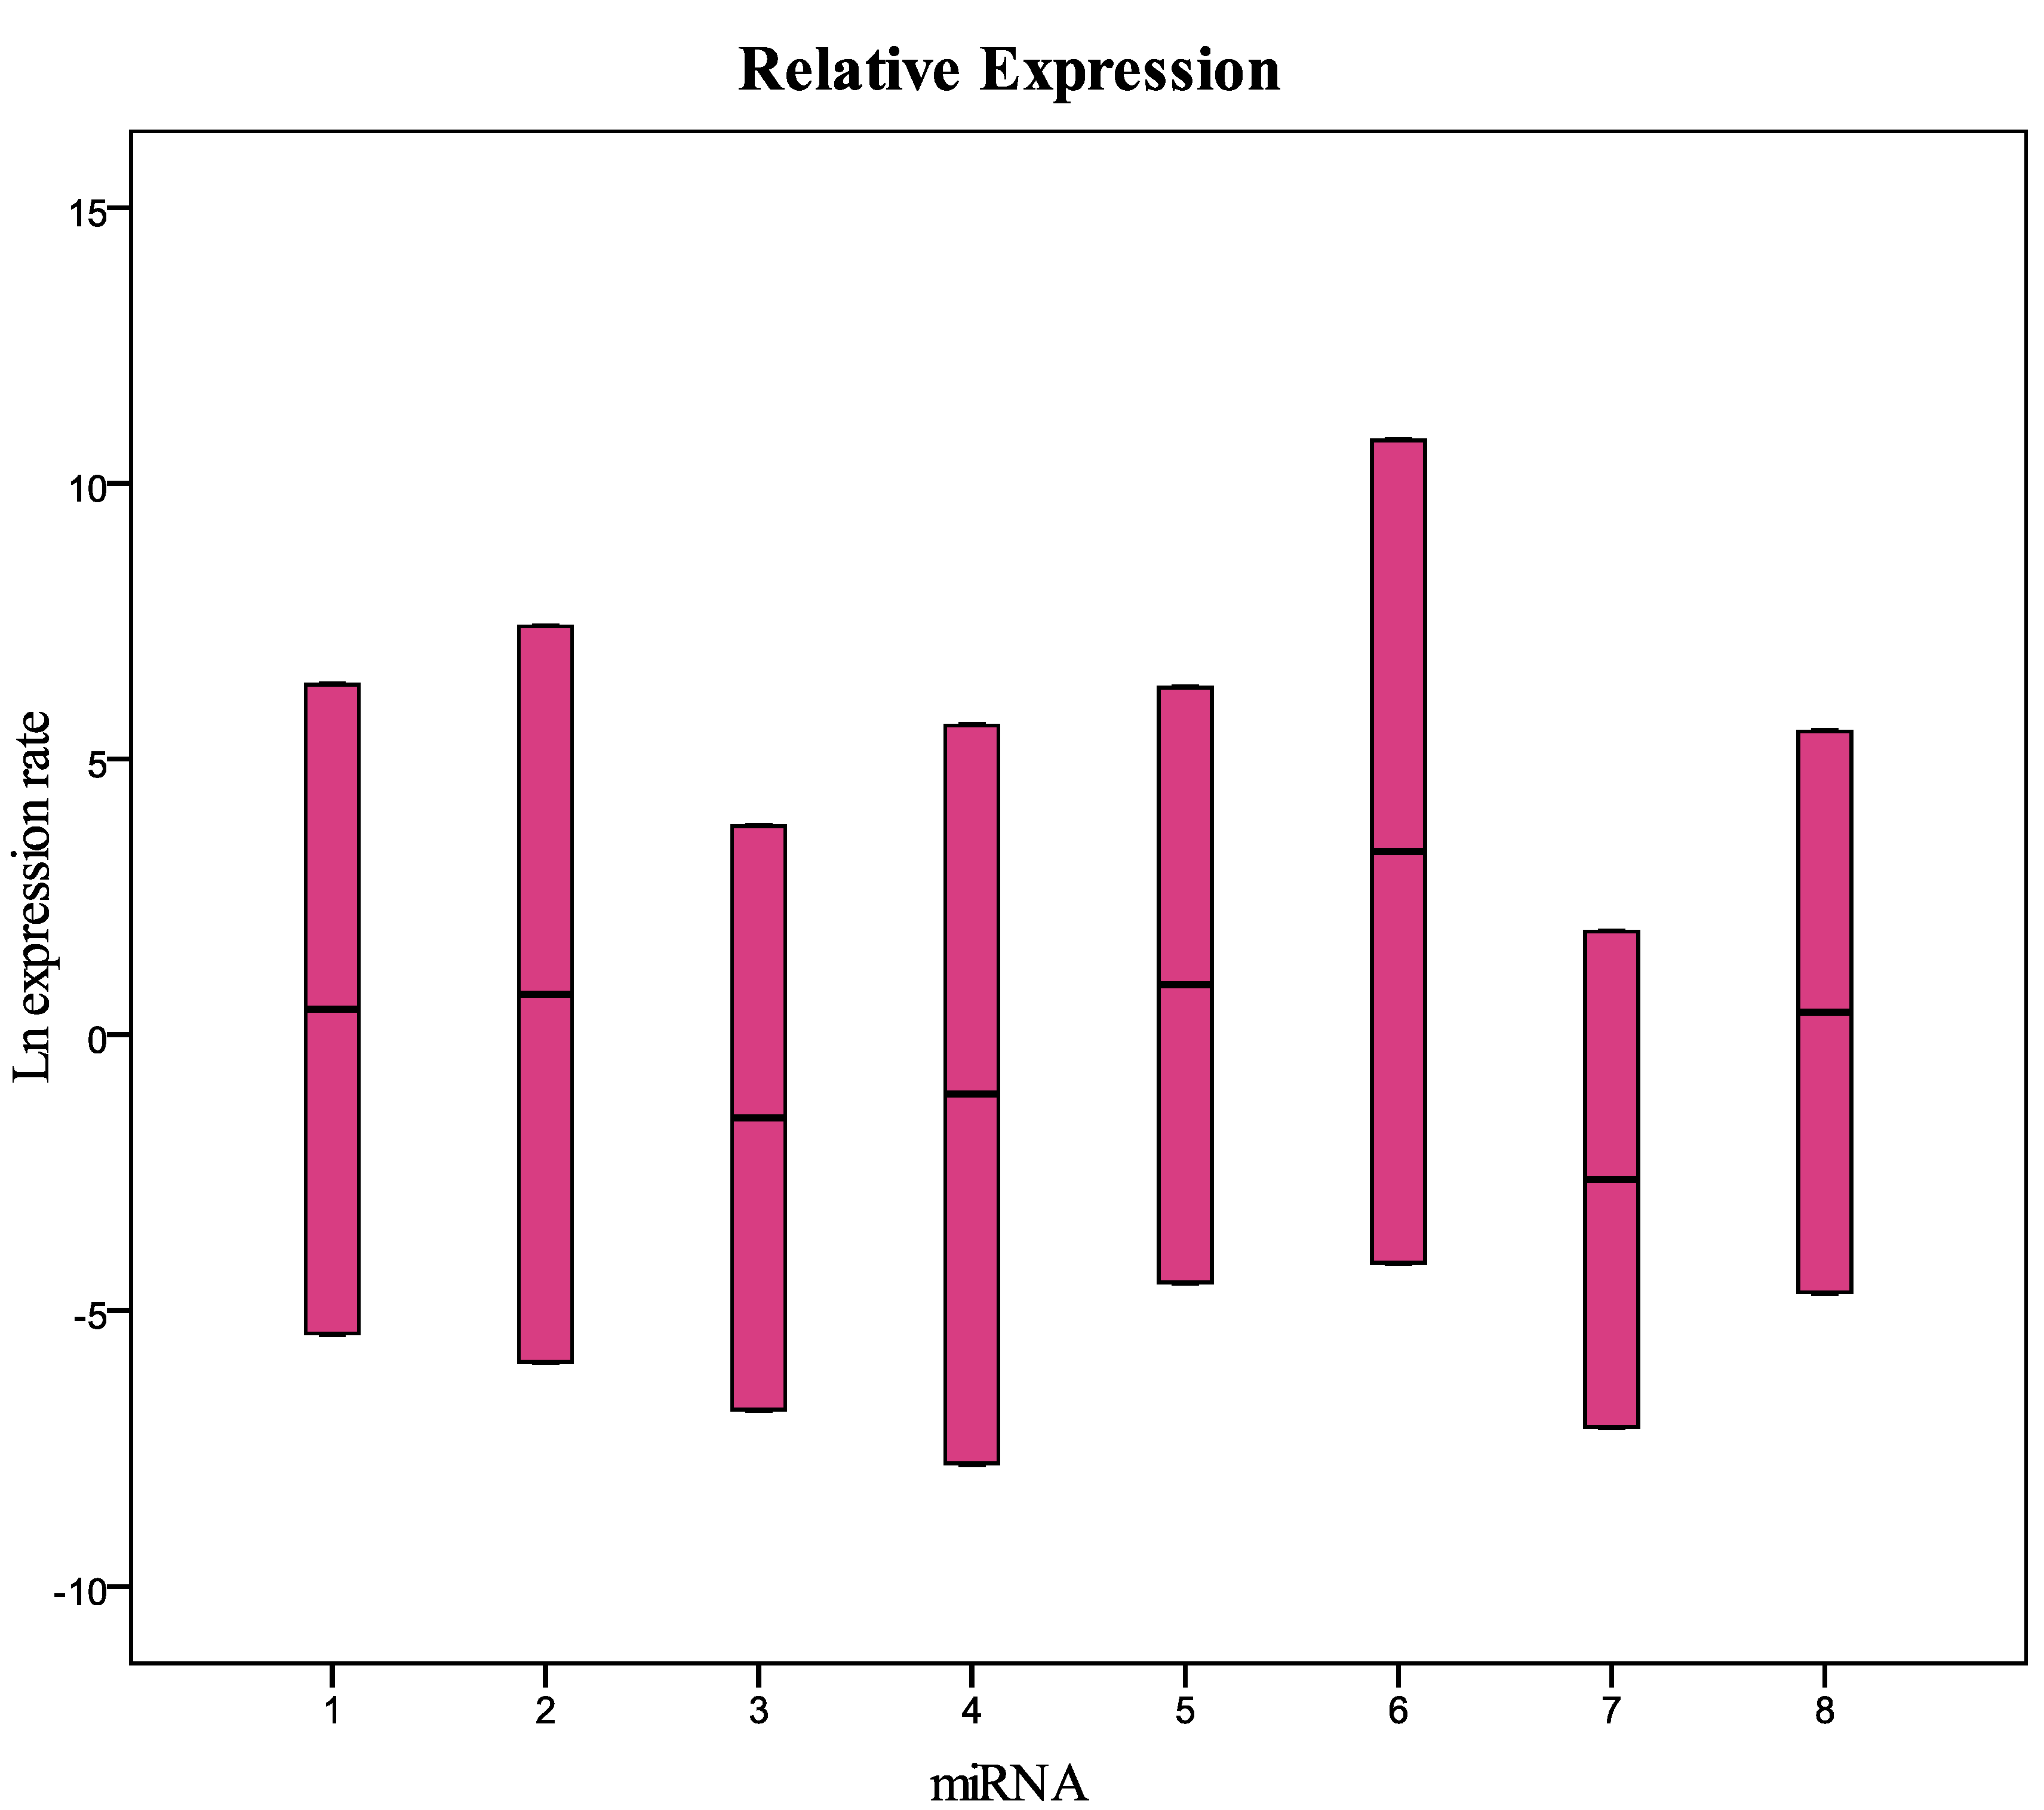
| miRNA | Type | Reaction Efficiency | Expression | Std. Error | 95% C.I. | P(H1) |
|---|---|---|---|---|---|---|
| 1 | TRG | 1 | 6.088 | 0.376–118.479 | 0.169–5.649 | 0.300 |
| 2 | TRG | 1 | 3.430 | 0.237–96.389 | 0.132–11.035 | 0.543 |
| 3 | TRG | 1 | 0.205 | 0.001–58.136 | 0.001–1.239 | 0.496 |
| 4 | TRG | 1 | 1.273 | 0.060–76.914 | 0.031–4.285 | 0.915 |
| 5 | TRG | 1 | 2.900 | 0.205–55.911 | 0.125–3.116 | 0.526 |
| 6 | TRG | 1 | 7.825 | 0.441–1.673.136 | 0.115–14.474 | 0.315 |
| 7 | TRG | 1 | 0.373 | 0.089–2.646 | 0.050–11.195 | 0.254 |
| 8 | TRG | 1 | 3.317 | 0.210–148.920 | 0.144–5.319 | 0.536 |
| U6snRNA | REF | 1 | 1.000 |

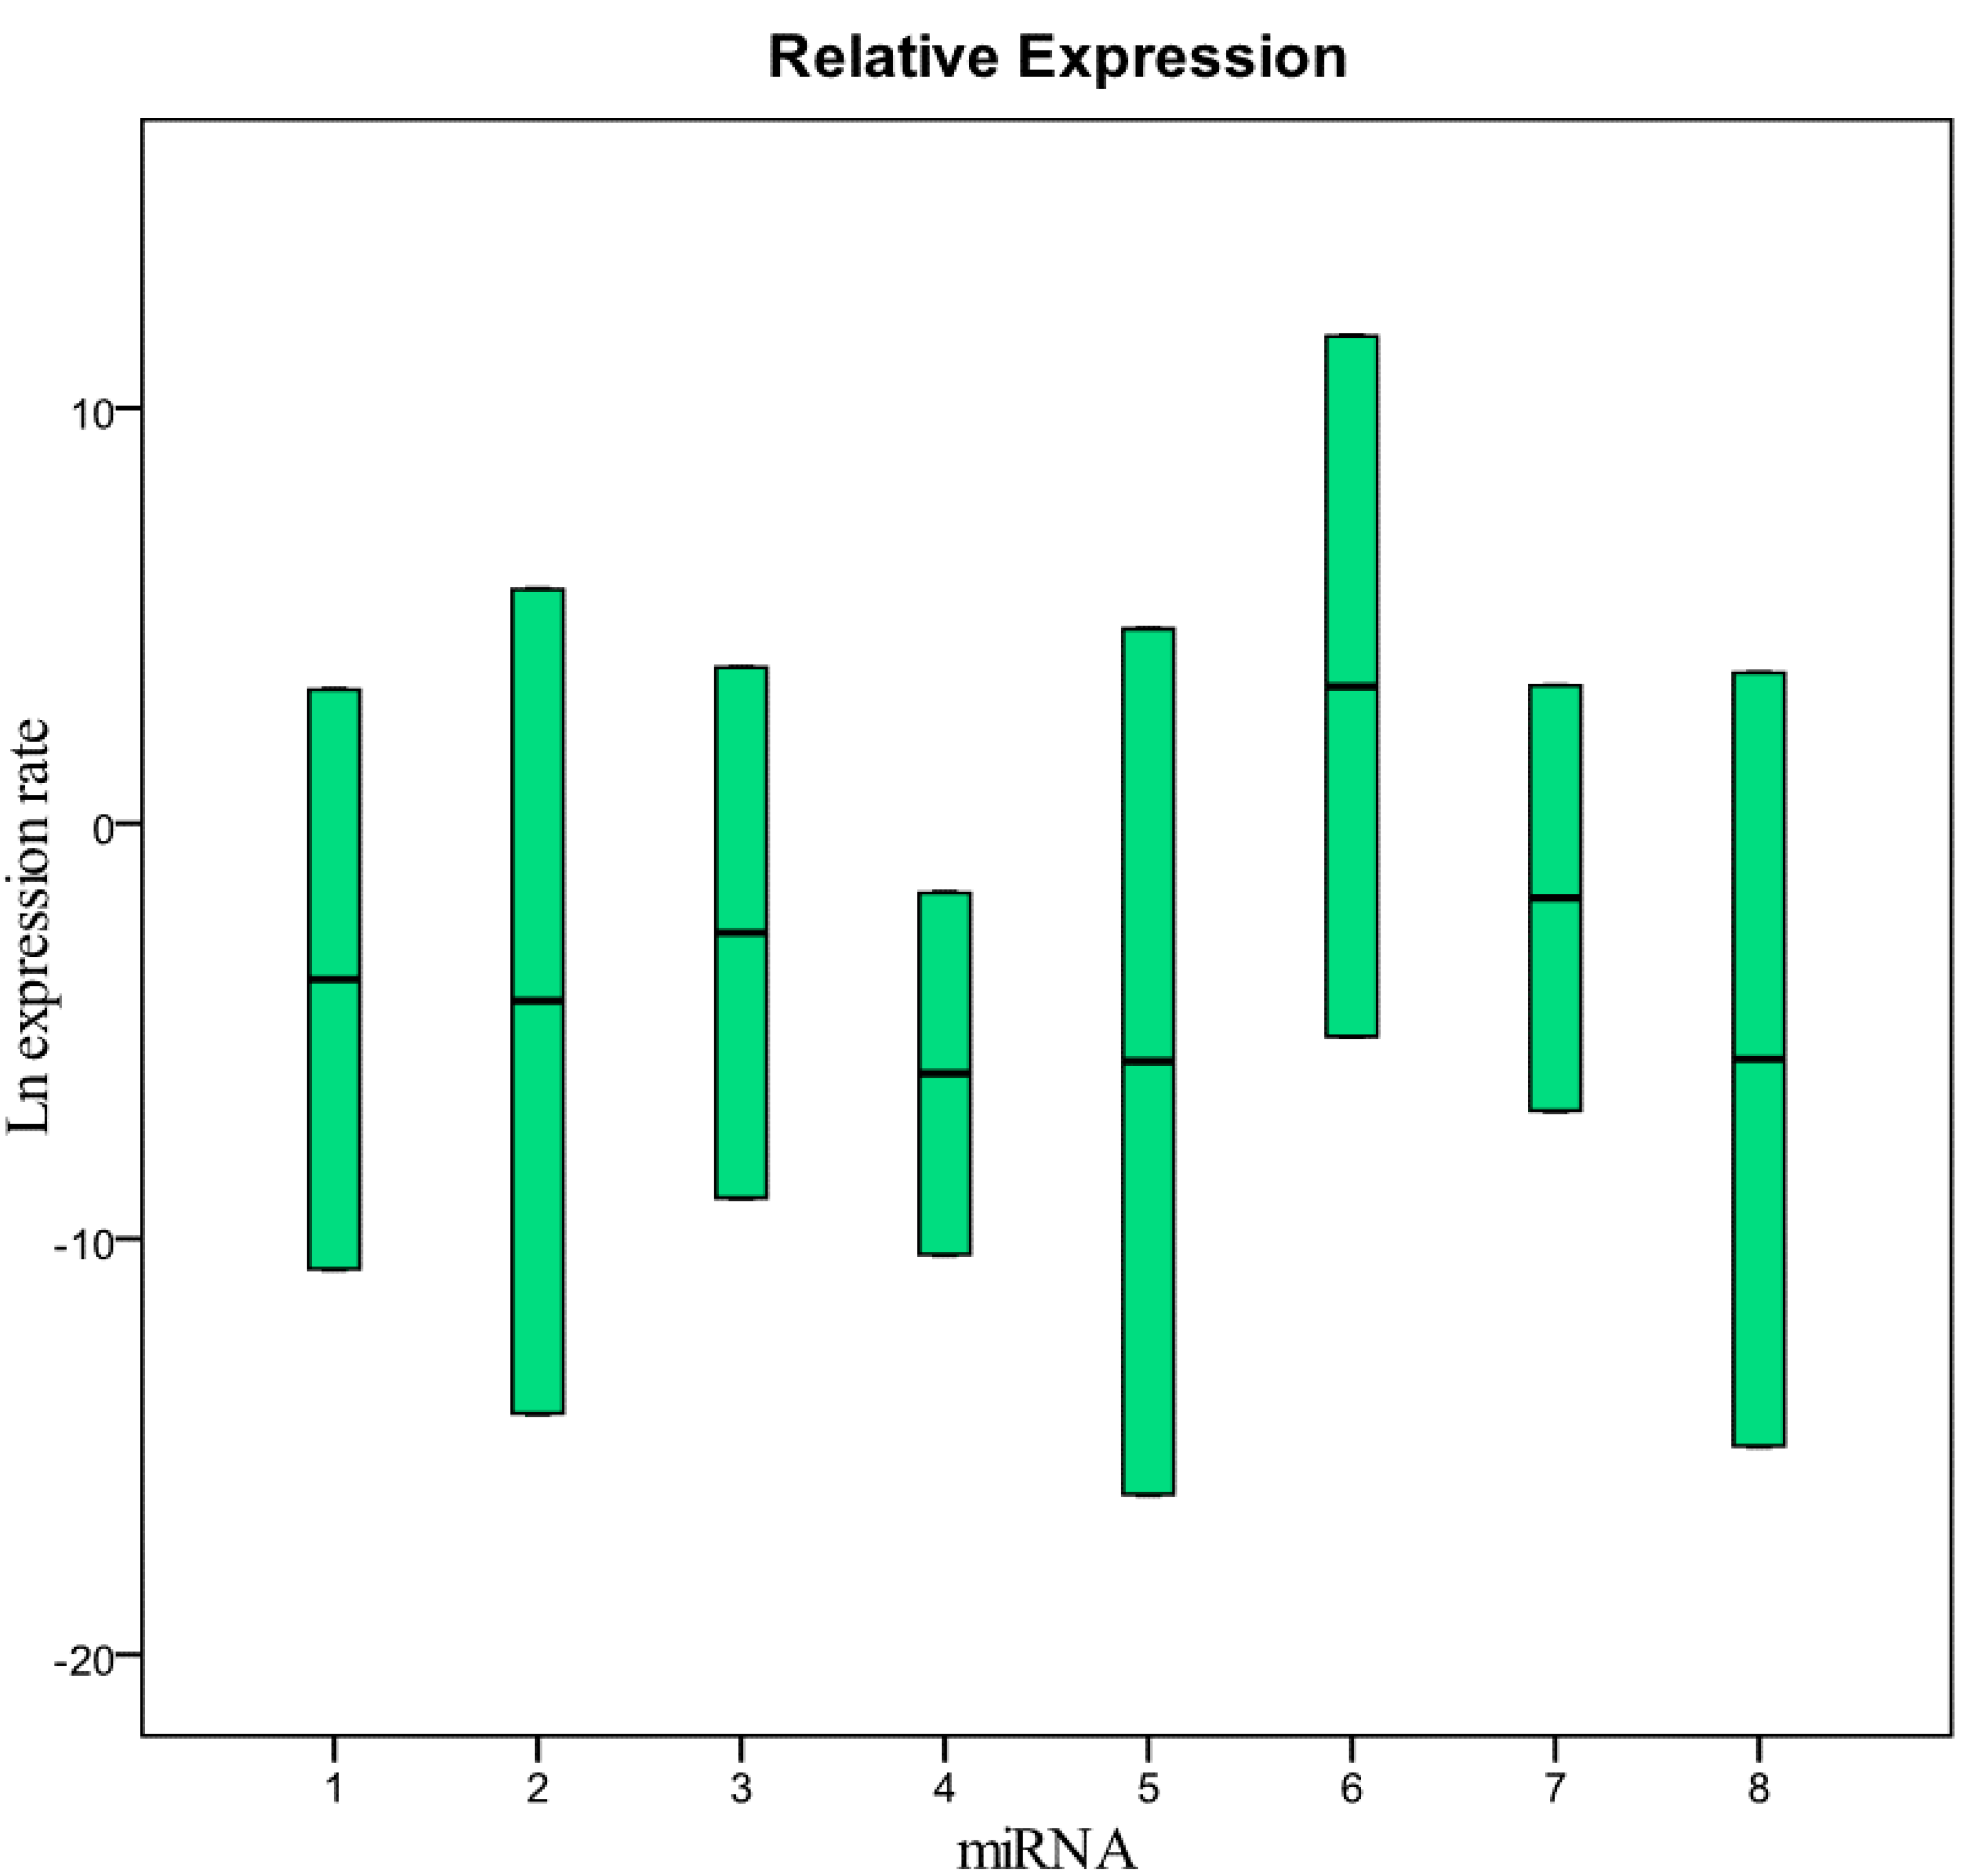
| miRNA | Type | Reaction Efficiency | Expression | Std. Error | 95% C.I. | P(H1) | Result |
|---|---|---|---|---|---|---|---|
| 1 | TRG | 1 | 1.446 | 0.075–22.084 | 0.005–399.228 | 0.762 | |
| 2 | TRG | 1 | 0.355 | 0.027–5.061 | 0.003–131.362 | 0.418 | |
| 3 | TRG | 1 | 0.110 | 0.002–2.424 | 0.002–79.778 | 0.120 | |
| 4 | TRG | 1 | 0.099 | 0.005–2.367 | 0.000–36.781 | 0.065 | |
| 5 | TRG | 1 | 0.308 | 0.014–7.950 | 0.000–156.536 | 0.468 | |
| 6 | TRG | 1 | 9.120 | 0.817–168.704 | 0.030–18.989 | 0.159 | |
| 7 | TRG | 1 | 0.093 | 0.020–0.479 | 0.001–5.080 | 0.008 | DOWN |
| 8 | TRG | 1 | 1.229 | 0.104–16.032 | 0.012–505.934 | 0.858 | |
| U6snRNA | REF | 1 | 1.000 |

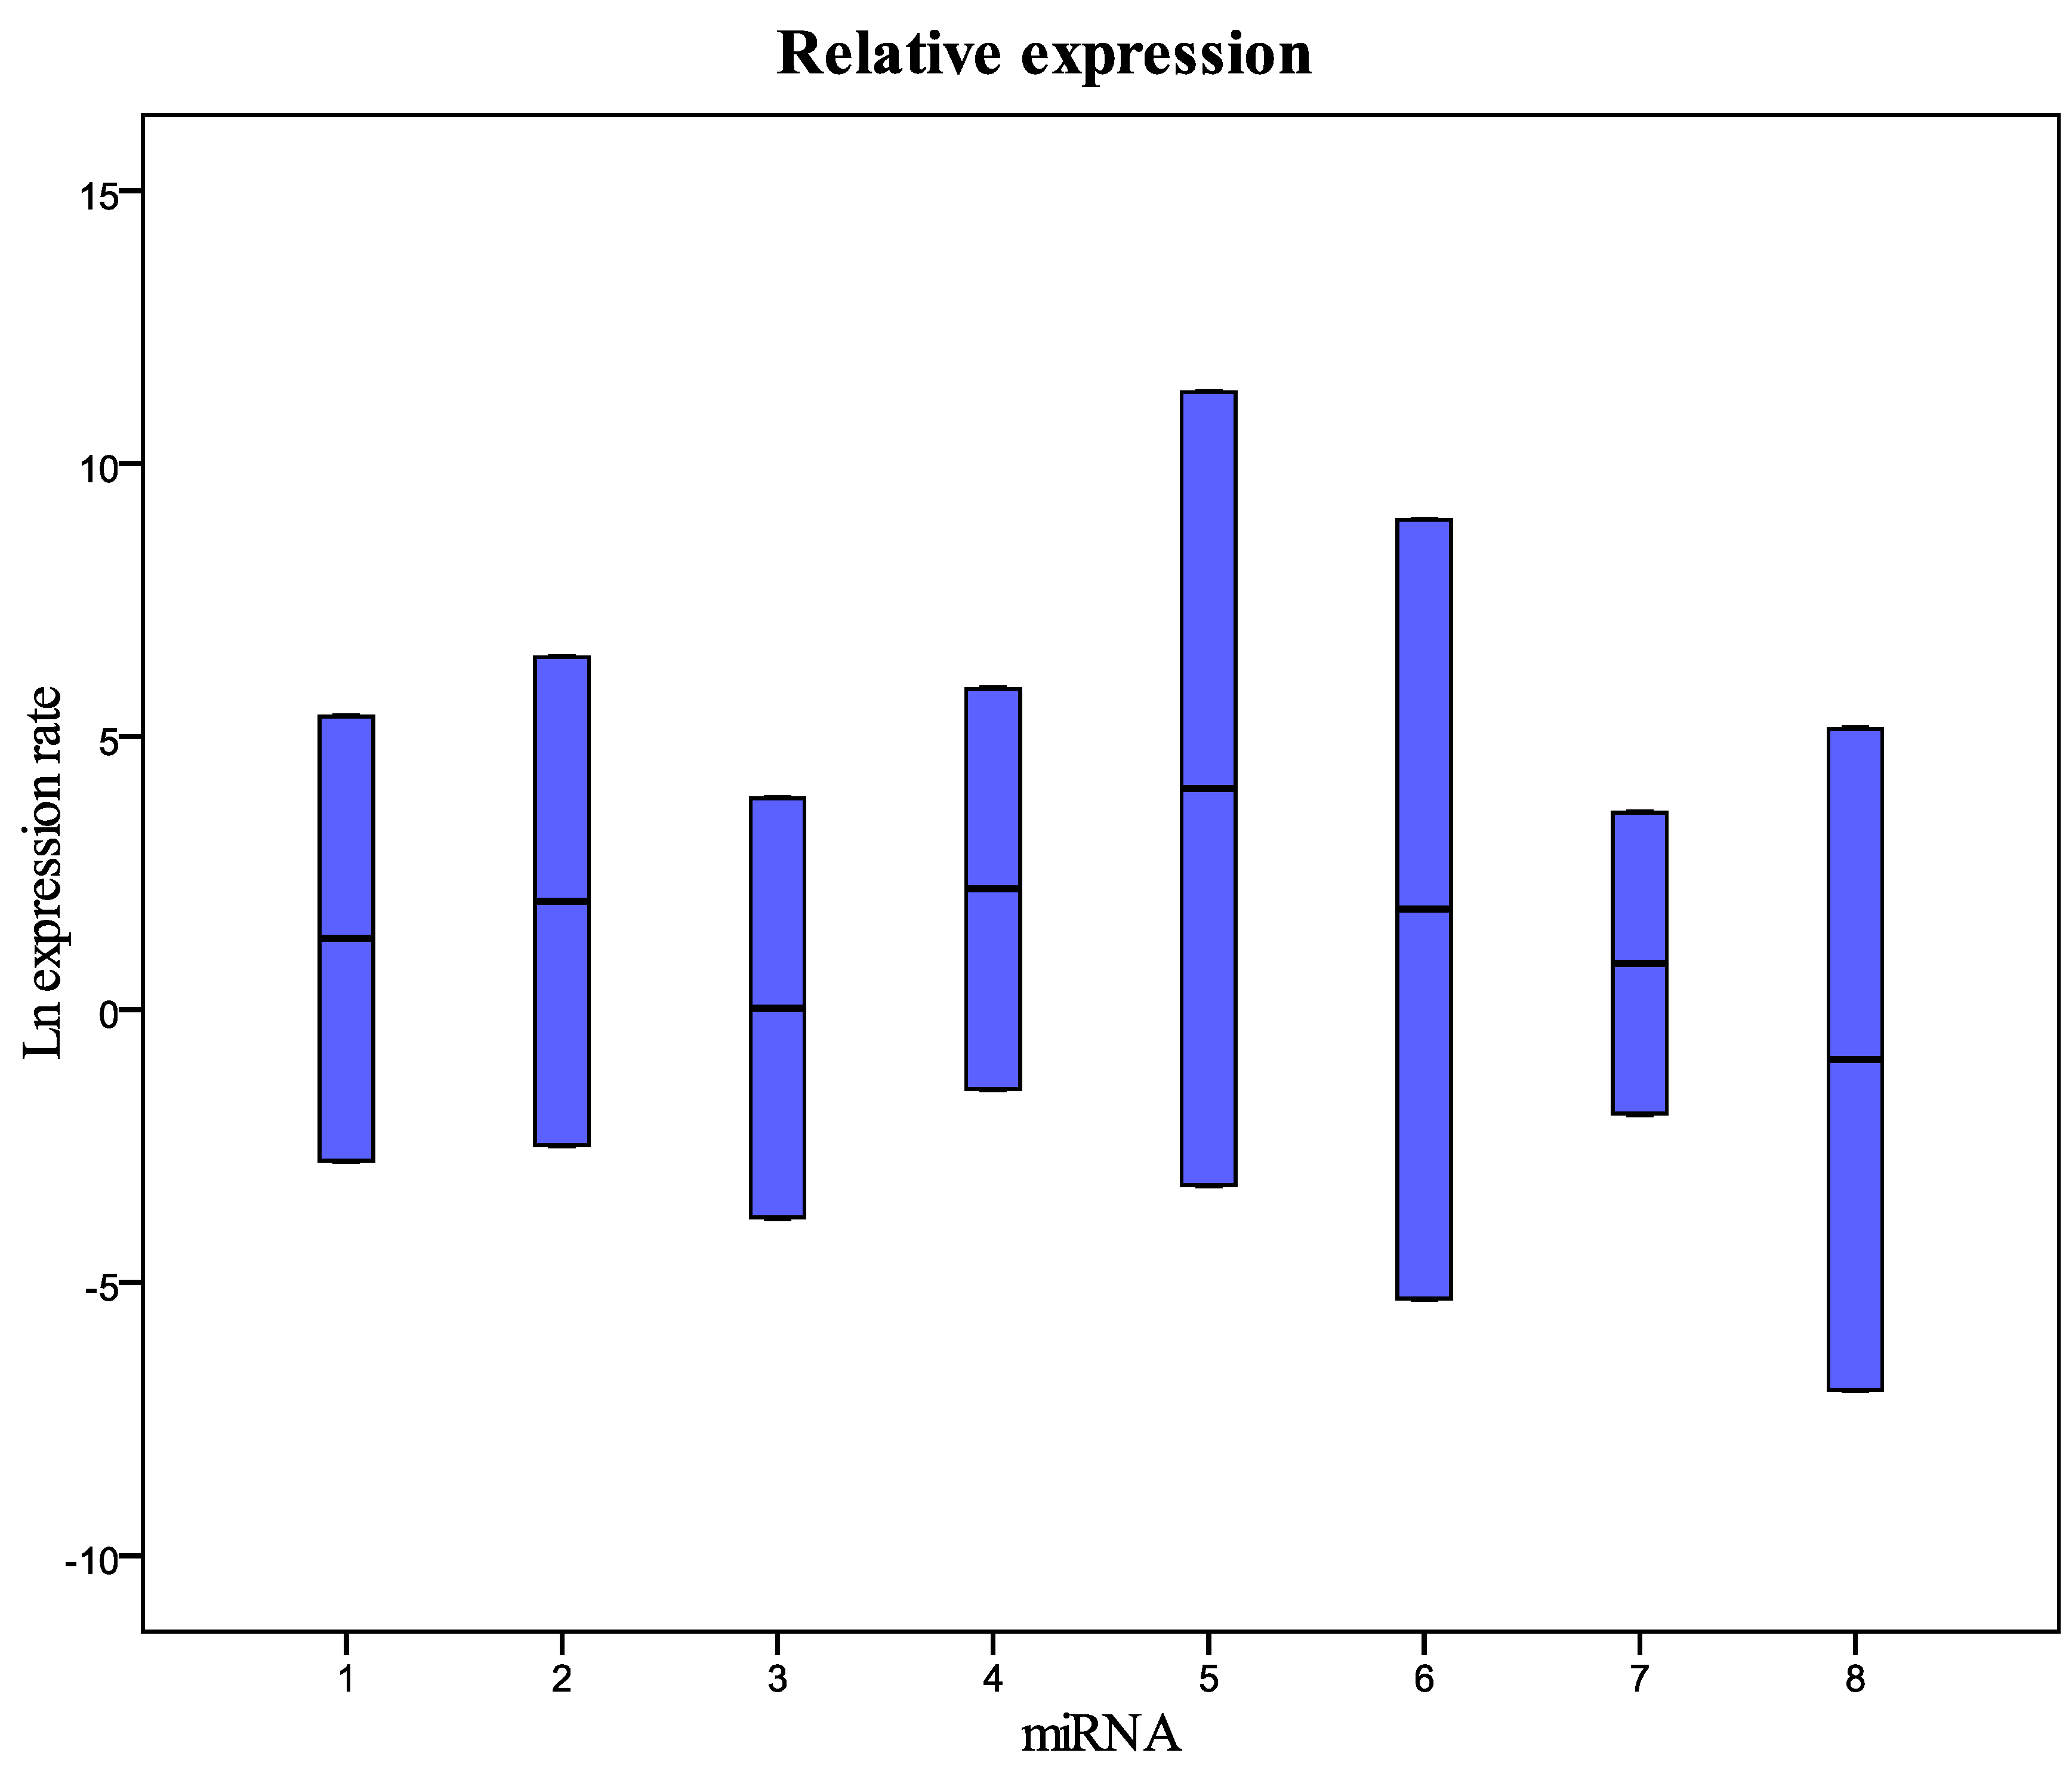
| miRNA | Type | Reaction Efficiency | Expression | Std. Error | 95% C.I. | P(H1) | Result |
|---|---|---|---|---|---|---|---|
| 1 | TRG | 1 | 0.009 | 0.000–0.326 | 0.000–15.647 | 0.007 | DOWN |
| 2 | TRG | 1 | 0.010 | 0.000–0.739 | 0.000–56.166 | 0.017 | DOWN |
| 3 | TRG | 1 | 0.024 | 0.003–0.372 | 0.000–10.244 | 0.008 | DOWN |
| 4 | TRG | 1 | 0.001 | 0.000–0.009 | 0.000–0.145 | 0.000 | DOWN |
| 5 | TRG | 1 | 0.008 | 0.000–0.838 | 0.000–39.763 | 0.021 | DOWN |
| 6 | TRG | 1 | 2.095 | 0.041–90.056 | 0.011–2.538 | 0.652 | |
| 7 | TRG | 1 | 0.059 | 0.005–0.882 | 0.002–10.576 | 0.007 | DOWN |
| 8 | TRG | 1 | 0.002 | 0.000–0.095 | 0.000–11.618 | 0.002 | DOWN |
| U6snRNA | REF | 1 | 1.000 |

3. Experimental Section
3.1. Human Plasma Samples
| Plasma Samples Number | Sample Status | Collection Year |
|---|---|---|
| 5 | Fresh | 2013 |
| 5 | Stored 6 months at −80 °C | 2013 |
| 5 | Stored 12 months at −80 °C | 2013 |
| 5 | Stored at −80 °C | 2010 |
| 5 | Stored at −80 °C | 2009 |
| 5 | Stored at −80 °C | 2003 |
| 4 | Stored at −80 °C | 2002 |
| 5 | Stored at −80 °C | 1999 |
3.2. RNA Extraction
3.3. qPCR Analysis
| Accession | Symbol | Sequence ID Number |
|---|---|---|
| IMAT0000423 | hsa-miR-125b-5p | UCCCUGAGACCCUAACUUGUGA 1 |
| MIMAT0003393 | hsa-miR-425-5p | AAUGACACGAUCACUCCCGUUGA 2 |
| MIMAT0004571 | hsa-miR-200b-5p | CAUCUUACUGGGCAGCAUUGGA 3 |
| MIMAT0000617 | hsa-miR-200c-3p | UAAUACUGCCGGGUAAUGAUGGA 4 |
| MIMAT0003244 | hsa-miR-579-3p | UUCAUUUGGUAUAAACCGCGAUU 5 |
| MIMAT0000269 | hsa-miR-212-3p | UAACAGUCUCCAGUCACGGCC 6 |
| MIMAT0000445 | hsa-miR-126-3p | UCGUACCGUGAGUAAUAAUGCG 7 |
| MIMAT0000076 | hsa-miR-21-5p | UAGCUUAUCAGACUGAUGUUGA 8 |
3.4. Statistical Analysis and Real-Time PCR Data Analysis
4. Conclusions
Supplementary Materials
Acknowledgments
Author Contributions
Conflicts of Interest
References
- Bartel, D.P. MicroRNAs: Genomics, biogenesis, mechanism, and function. Cell 2004, 116, 281–297. [Google Scholar] [CrossRef]
- Mattick, J.S.; Makunin, I.V. Non-coding RNA. Hum. Mol. Genet. 2006, 1, 17–29. [Google Scholar] [CrossRef] [PubMed]
- Lund, E.; Guttinger, S.; Calado, A.; Dahlberg, J.E.; Kutay, U. Nuclear export of microRNA precursors. Science 2004, 303, 95–98. [Google Scholar] [CrossRef] [PubMed]
- Filipowicz, W.; Bhattacharyya, S.N.; Sonenberg, N. Mechanisms of post-transcriptional regulation by microRNAs: Are the answers in sight? Nat. Rev. Genet. 2008, 9, 102–114. [Google Scholar] [CrossRef] [PubMed]
- Lim, L.P.; Glasner, M.E.; Yekta, S.; Burge, C.B.; Bartel, D.P. Vertebrate microRNA genes. Science 2003, 299, 1540. [Google Scholar] [CrossRef] [PubMed]
- Ambros, V. The functions of animal microRNAs. Nature 2004, 431, 350–355. [Google Scholar] [CrossRef] [PubMed]
- Friedman, R.C.; Farh, K.K.; Burge, C.B.; Bartel, D.P. Most mammalian mRNAs are conserved targets of microRNAs. Genome Res. 2009, 19, 92–105. [Google Scholar] [CrossRef] [PubMed]
- Bartel, D.P.; Chen, C.Z. Micromanagers of gene expression: the potentially widespread influence of metazoan microRNAs. Nat. Rev. Genet. 2004, 5, 396–400. [Google Scholar] [CrossRef] [PubMed]
- Valencia-Sanchez, M.A.; Liu, J.; Hannon, G.J.; Parker, R. Control of translation and mRNA degradation by miRNAs and siRNAs. Genes Dev. 2006, 20, 515–524. [Google Scholar] [CrossRef] [PubMed]
- Plasterk, R.H. MicroRNAs in animal development. Cell 2006, 124, 877–881. [Google Scholar] [CrossRef] [PubMed]
- Weber, D.G.; Casjens, S.; Rozynek, P.; Lehnert, M.; Zilch-Schoneweis, S.; Bryk, O.; Taeger, D.; Gomolka, M.; Kreuzer, M.; Otten, H.; et al. Assessment of mRNA and microRNA stabilization in peripheral human blood for multicenter studies and biobanks. Biomark. Insights 2010, 5, 95–102. [Google Scholar] [CrossRef] [PubMed]
- Aijt, S.K. Circulating microRNA as biomarkers, therapeutic targets, and signaling. Mol. Sens. 2012, 12, 3359–3369. [Google Scholar] [CrossRef] [PubMed]
- Ge, Q.; Zhou, Y.; Lu, J.; Bai, Y.; Xie, X.; Lu, Z. miRNA in Plasma Exosome is Stable under Different Storage Conditions. Molecules 2014, 19, 1568–1575. [Google Scholar] [CrossRef] [PubMed]
- Creemers, E.E.; Tijsen, A.J.; Pinto, Y.M. Circulating MicroRNAs Novel Biomarkers and Extracellular Communicators in Cardiovascular Disease? Circ. Res. 2012, 110, 483–495. [Google Scholar] [CrossRef] [PubMed]
- Deiana, L.; Ferrucci, L.; Pes, G.M.; Carru, C.; Delitala, G.; Ganau, A.; Mariotti, S.; Nieddu, A.; Pettinato, S.; Putzu, P.; et al. AKEntAnnos. The Sardinia Study of Extreme Longevity. Aging 1999, 11, 142–149. [Google Scholar] [PubMed]
- Deiana, L.; Pes, G.M.; Carru, C.; Ferrucci, L.; Franceschi, C.; Baggio, G. The “Oldest Man on the Planet”. J. Am. Geriatr. Soc. 2002, 50, 2098–2099. [Google Scholar] [CrossRef] [PubMed]
- Sethi, P.; Lukiw, W.J. Micro-RNA abundance and stability in human brain: Specific alterations in Alzheimer’s disease temporal lobe neocortex. Neurosci. Lett. 2009, 459, 100–104. [Google Scholar] [CrossRef] [PubMed]
- Scholer, N.; Langer, C.; Dohner, H.; Buske, C.; Kuchenbauer, F. Serum microRNAs as a novel class of biomarkers: A comprehensive review of the literature. Exp. Hematol. 2010, 38, 1126–1130. [Google Scholar] [CrossRef] [PubMed]
- Scholer, N.; Langer, C.; Kuchenbauer, F. Circulating microRNAs as biomarkers—True Blood? Genome Med. 2011, 3, 72–74. [Google Scholar] [CrossRef] [PubMed]
- Benz, F.; Roderburg, C.; Vargas Cardenas, D.; Vucur, M.; Gautheron, J.; Koch, A.; Zimmermann, H.; Janssen, J.; Nieuwenhuijsen, L.; Luedde, M.; et al. U6 is unsuitable for normalization of serum miRNA levels in patients with sepsis or liver fibrosis. Exp. Mol. Med. 2013, 45, e42. [Google Scholar] [CrossRef] [PubMed]
- Rice, J.; Roberts, H.; Rai, S.N.; Galandiuk, S. Housekeeping genes for studies of plasma microRNA: A need for more precise standardization. Surgery 2015, 158, 1345–1351. [Google Scholar] [CrossRef] [PubMed]
- miRbase. Available online: http://www.mirbase.org/ (accessed on 24 September 2015).
- Pfaffl, M.W.; Horgan, G.W.; Dempfle, L. Relative expression software tool (REST©) forgroup-wise comparison and statistical analysis of relative expression results in real-time PCR. Nucleic Acids Res. 2002, 30, 9. [Google Scholar] [CrossRef]
- Pasquinelli, A.E. MicroRNAs and their targets: Recognition, regulation and an emerging reciprocal relationship. Nat. Genet. 2012, 13, 271–282. [Google Scholar] [CrossRef] [PubMed]
- Sample Availability: Plasma samples are not available from the authors.
© 2015 by the authors. Licensee MDPI, Basel, Switzerland. This article is an open access article distributed under the terms and conditions of the Creative Commons Attribution license ( http://creativecommons.org/licenses/by/4.0/).
Share and Cite
Balzano, F.; Deiana, M.; Dei Giudici, S.; Oggiano, A.; Baralla, A.; Pasella, S.; Mannu, A.; Pescatori, M.; Porcu, B.; Fanciulli, G.; et al. miRNA Stability in Frozen Plasma Samples. Molecules 2015, 20, 19030-19040. https://doi.org/10.3390/molecules201019030
Balzano F, Deiana M, Dei Giudici S, Oggiano A, Baralla A, Pasella S, Mannu A, Pescatori M, Porcu B, Fanciulli G, et al. miRNA Stability in Frozen Plasma Samples. Molecules. 2015; 20(10):19030-19040. https://doi.org/10.3390/molecules201019030
Chicago/Turabian StyleBalzano, Francesca, Marta Deiana, Silvia Dei Giudici, Annalisa Oggiano, Angela Baralla, Sara Pasella, Andrea Mannu, Mario Pescatori, Baingio Porcu, Giuseppe Fanciulli, and et al. 2015. "miRNA Stability in Frozen Plasma Samples" Molecules 20, no. 10: 19030-19040. https://doi.org/10.3390/molecules201019030
APA StyleBalzano, F., Deiana, M., Dei Giudici, S., Oggiano, A., Baralla, A., Pasella, S., Mannu, A., Pescatori, M., Porcu, B., Fanciulli, G., Zinellu, A., Carru, C., & Deiana, L. (2015). miRNA Stability in Frozen Plasma Samples. Molecules, 20(10), 19030-19040. https://doi.org/10.3390/molecules201019030