FACE Analysis as a Fast and Reliable Methodology to Monitor the Sulfation and Total Amount of Chondroitin Sulfate in Biological Samples of Clinical Importance


Abstract
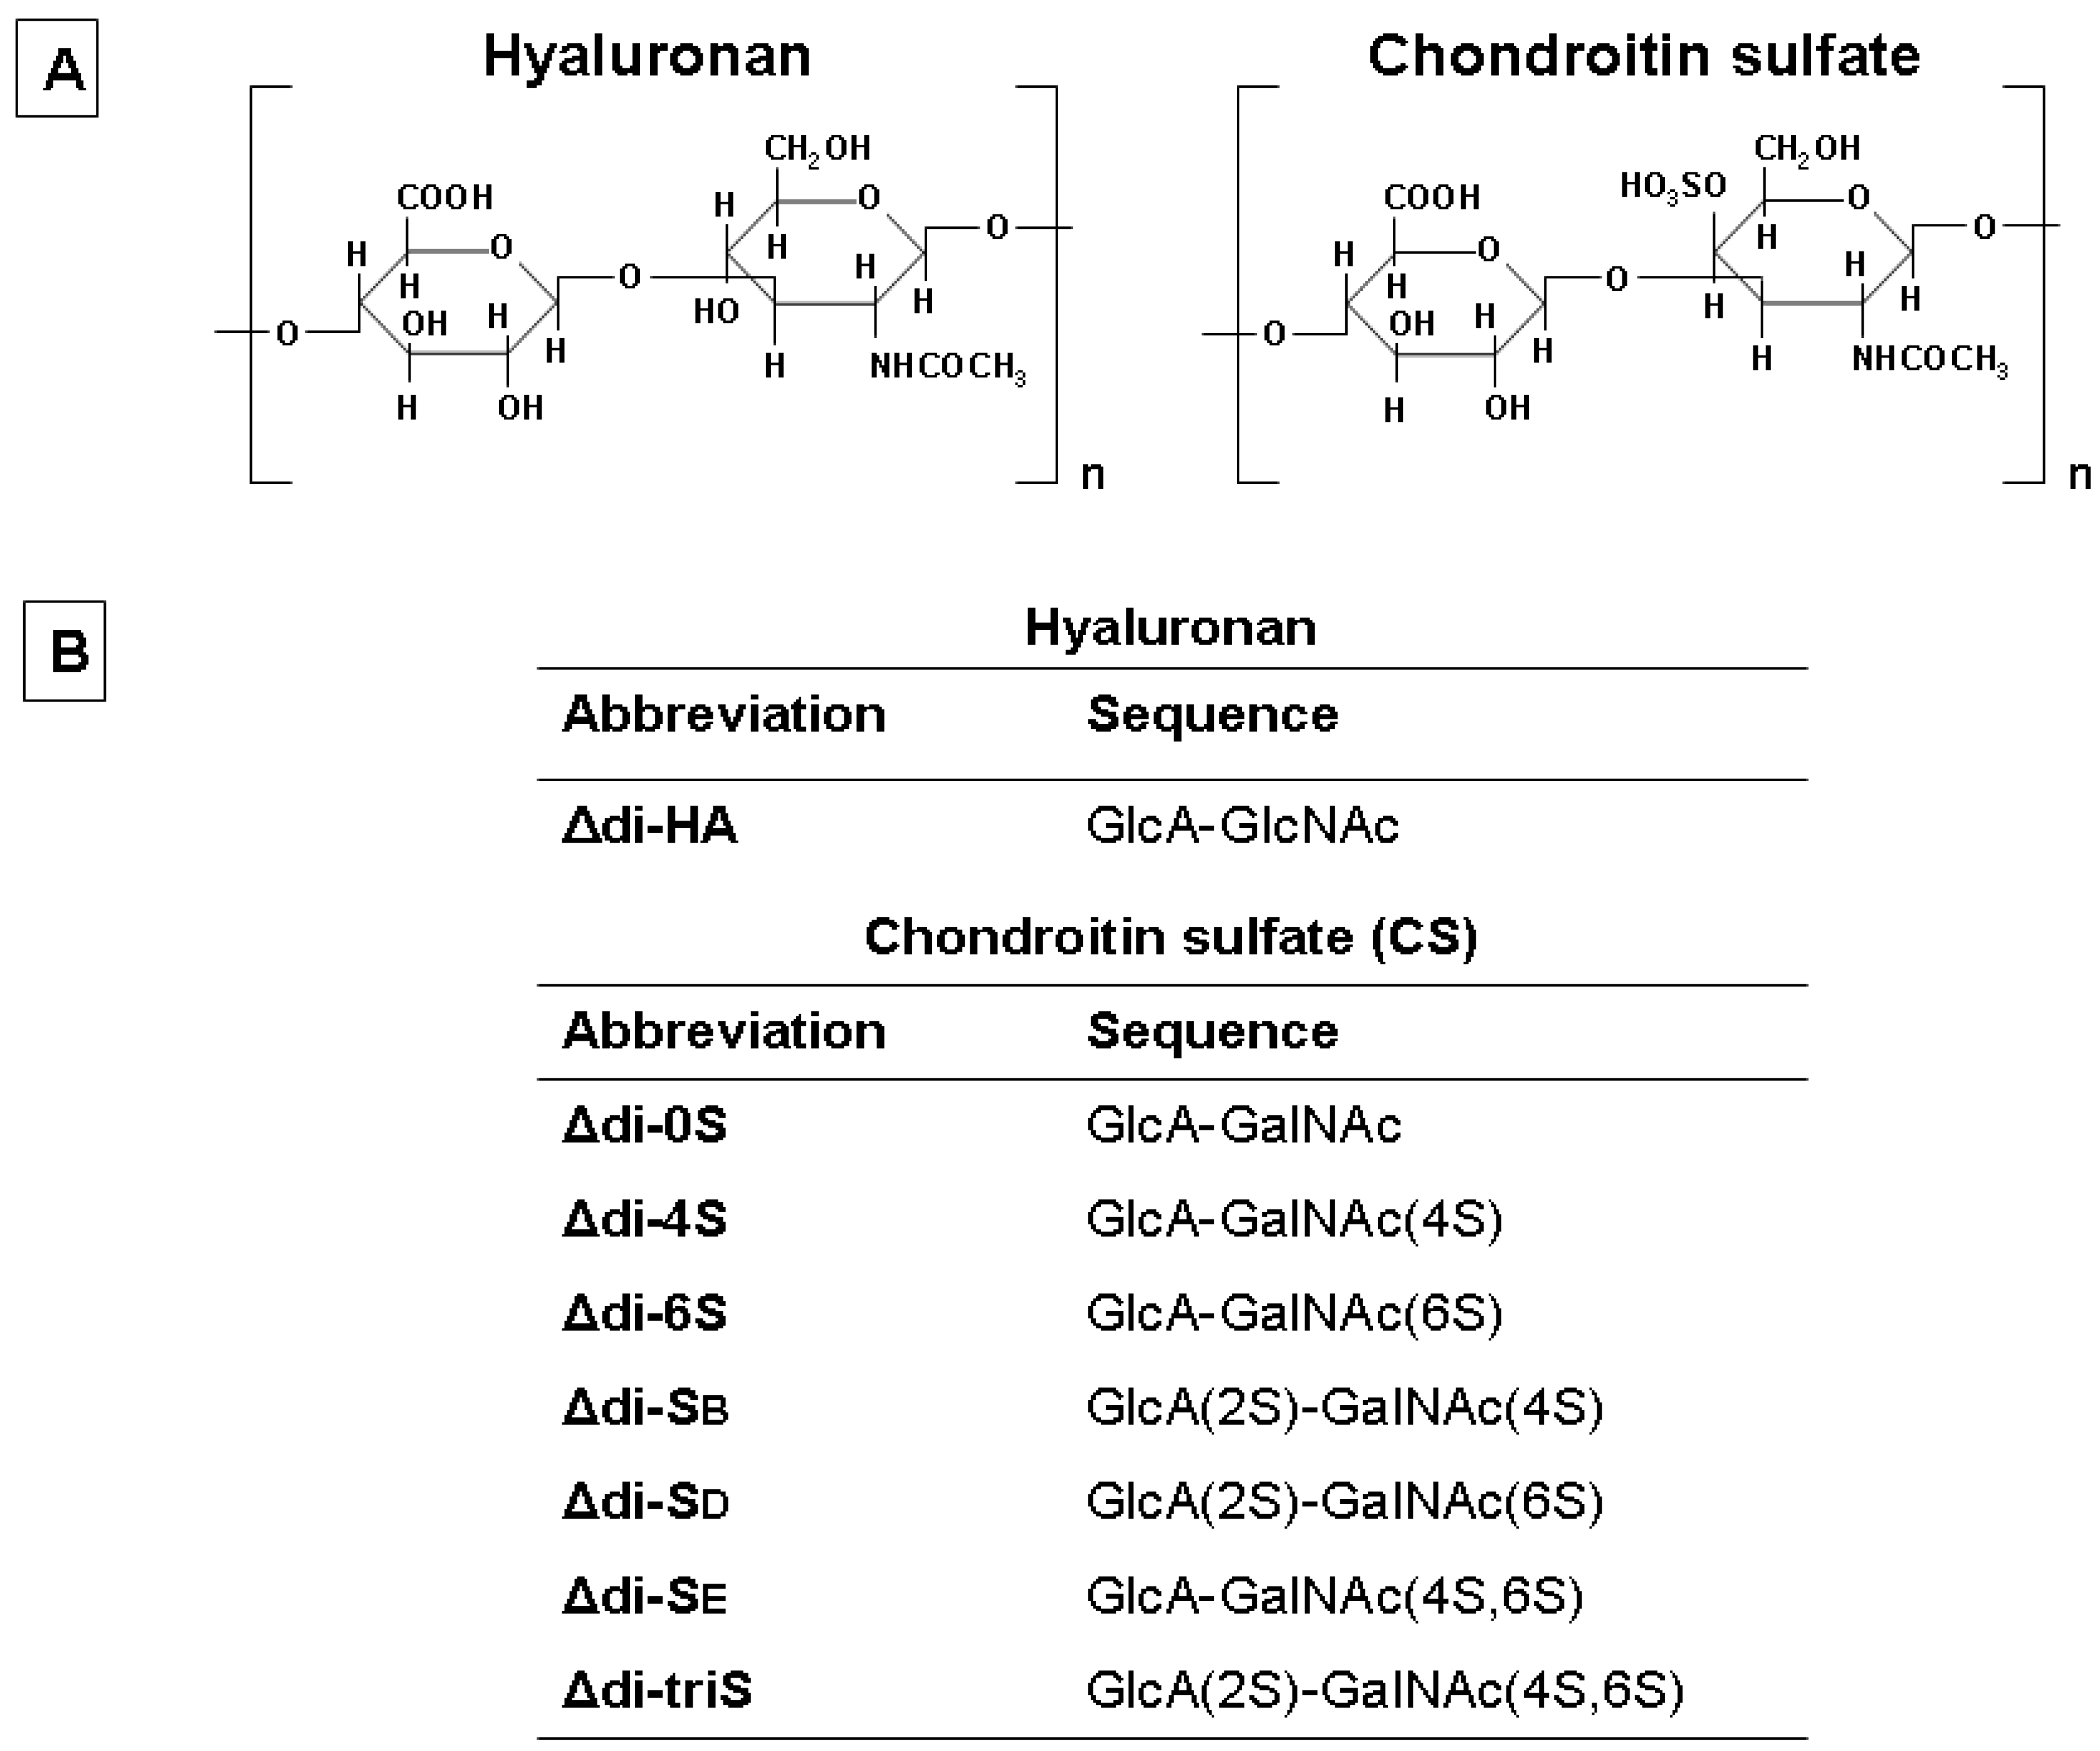
:1. Introduction
2. Results and Discussion
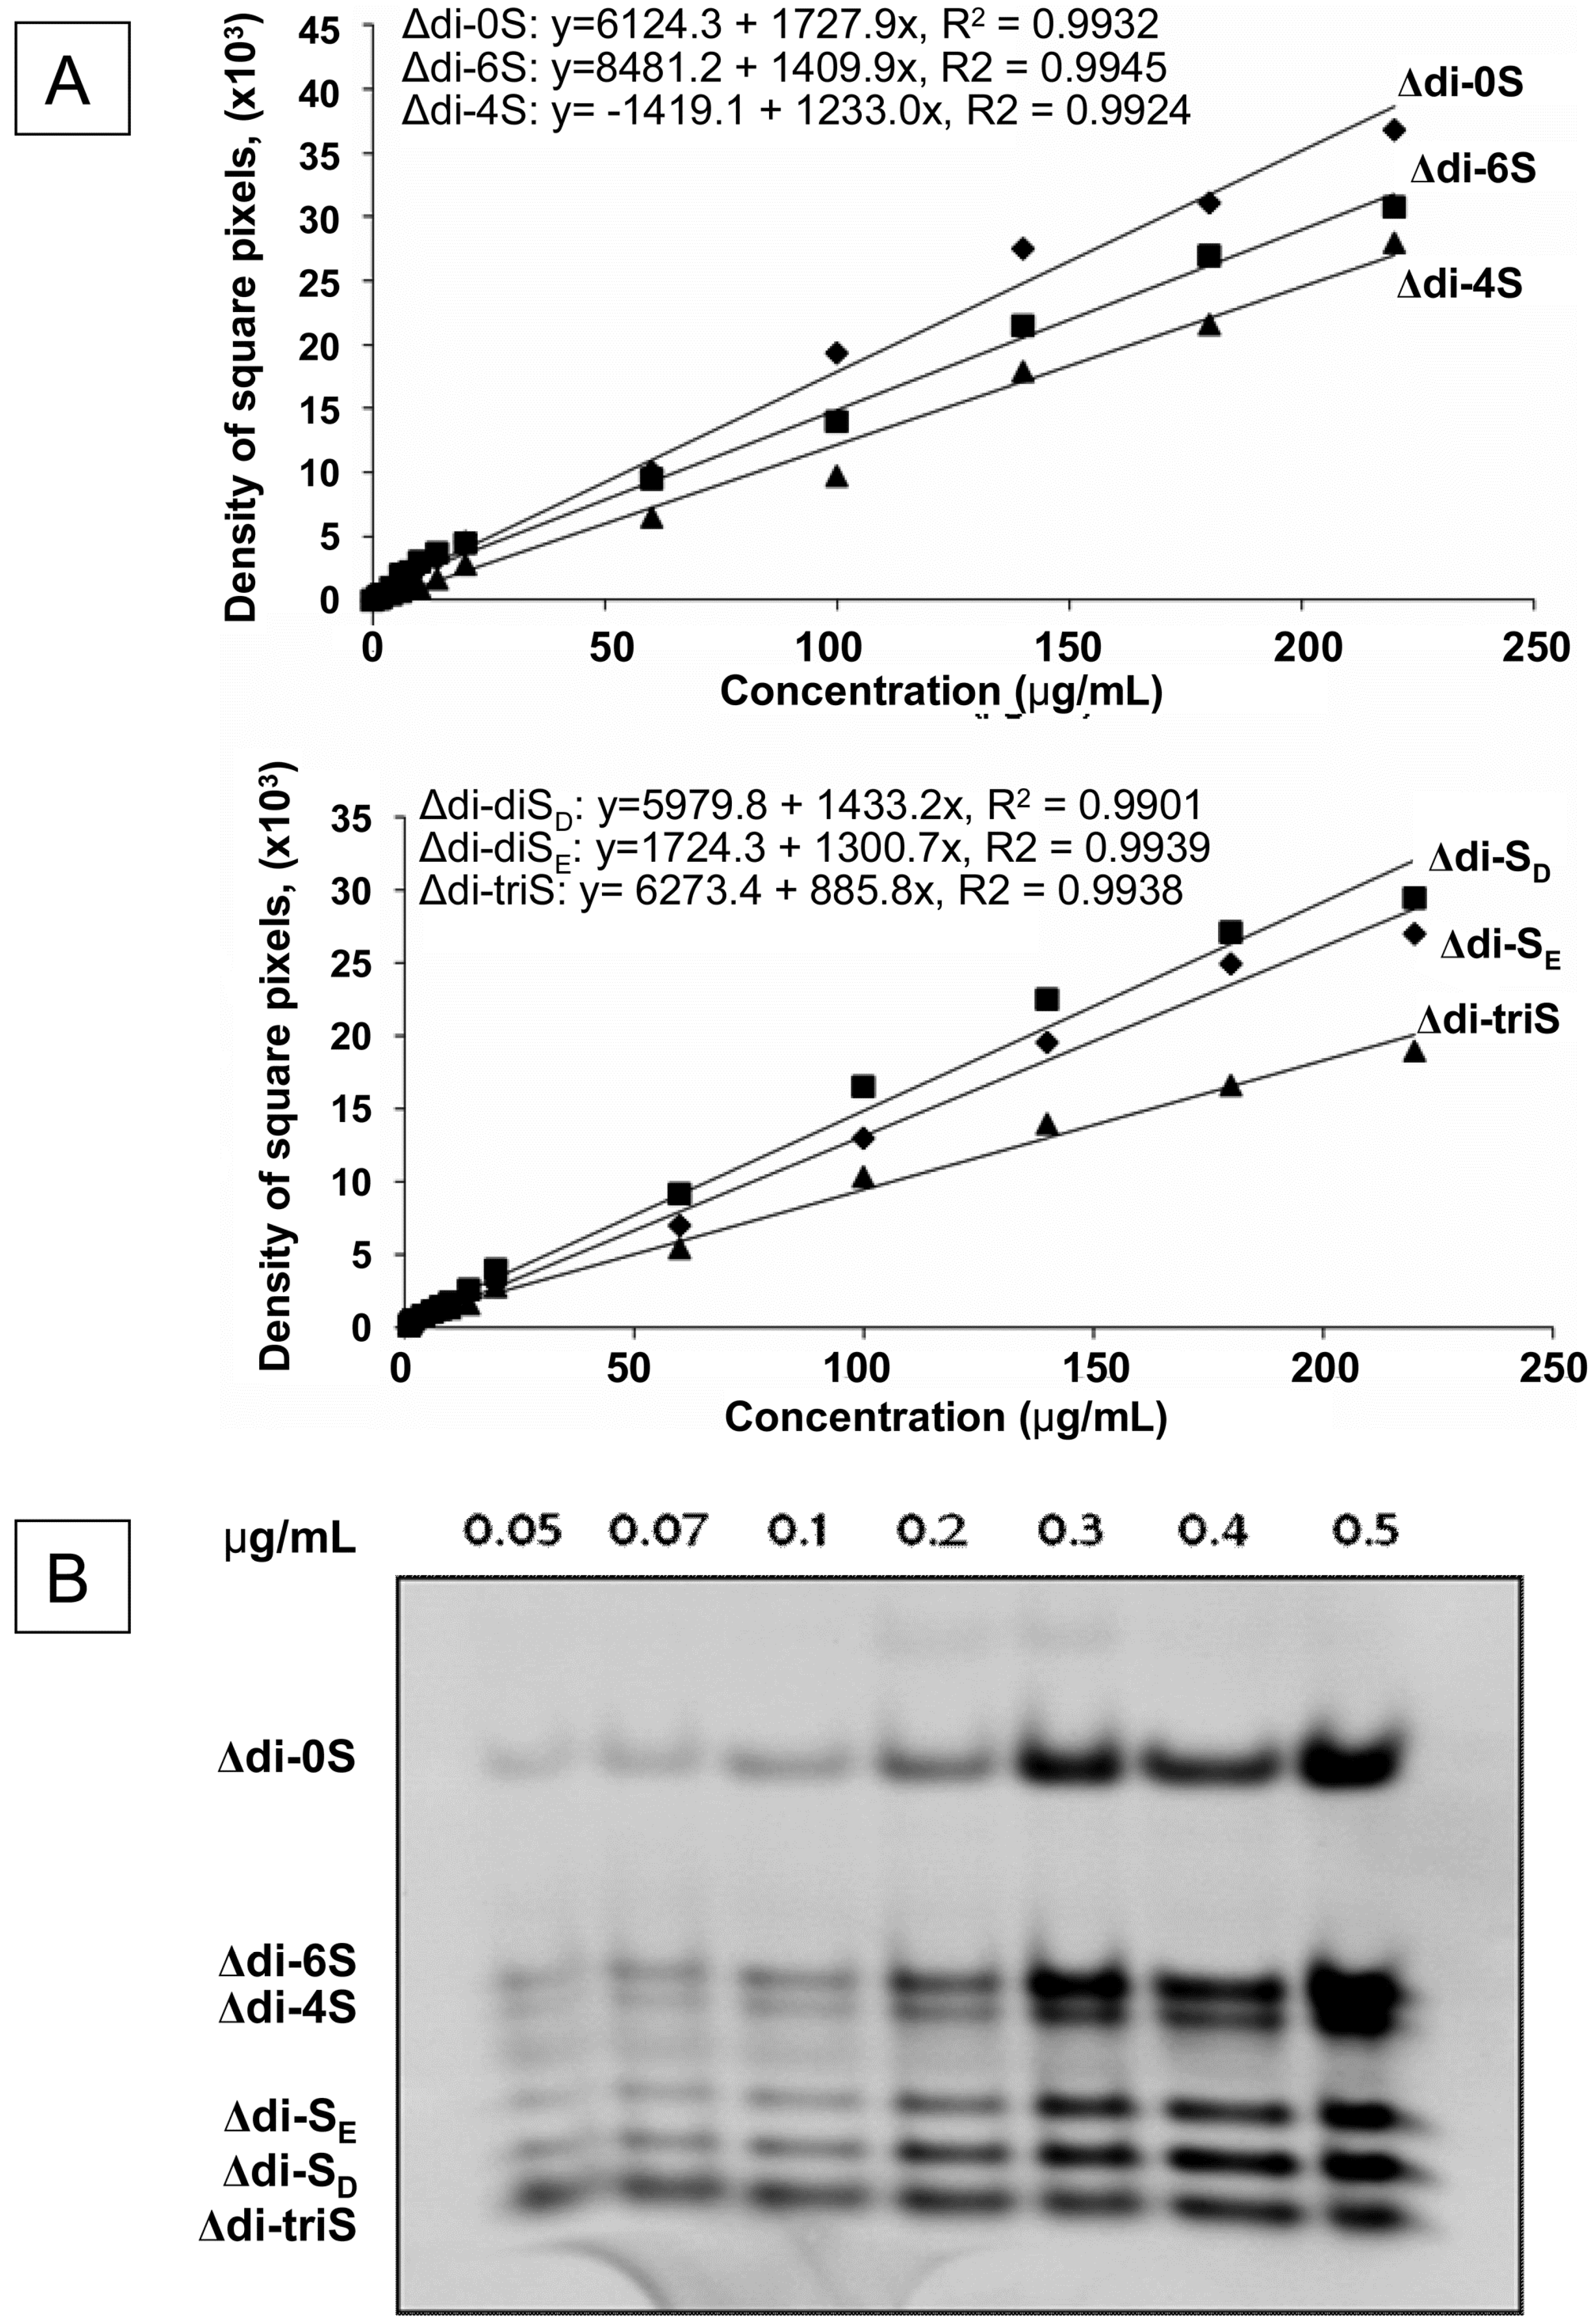
2.1. Sensitivity and Linearity of CS Analysis by FACE

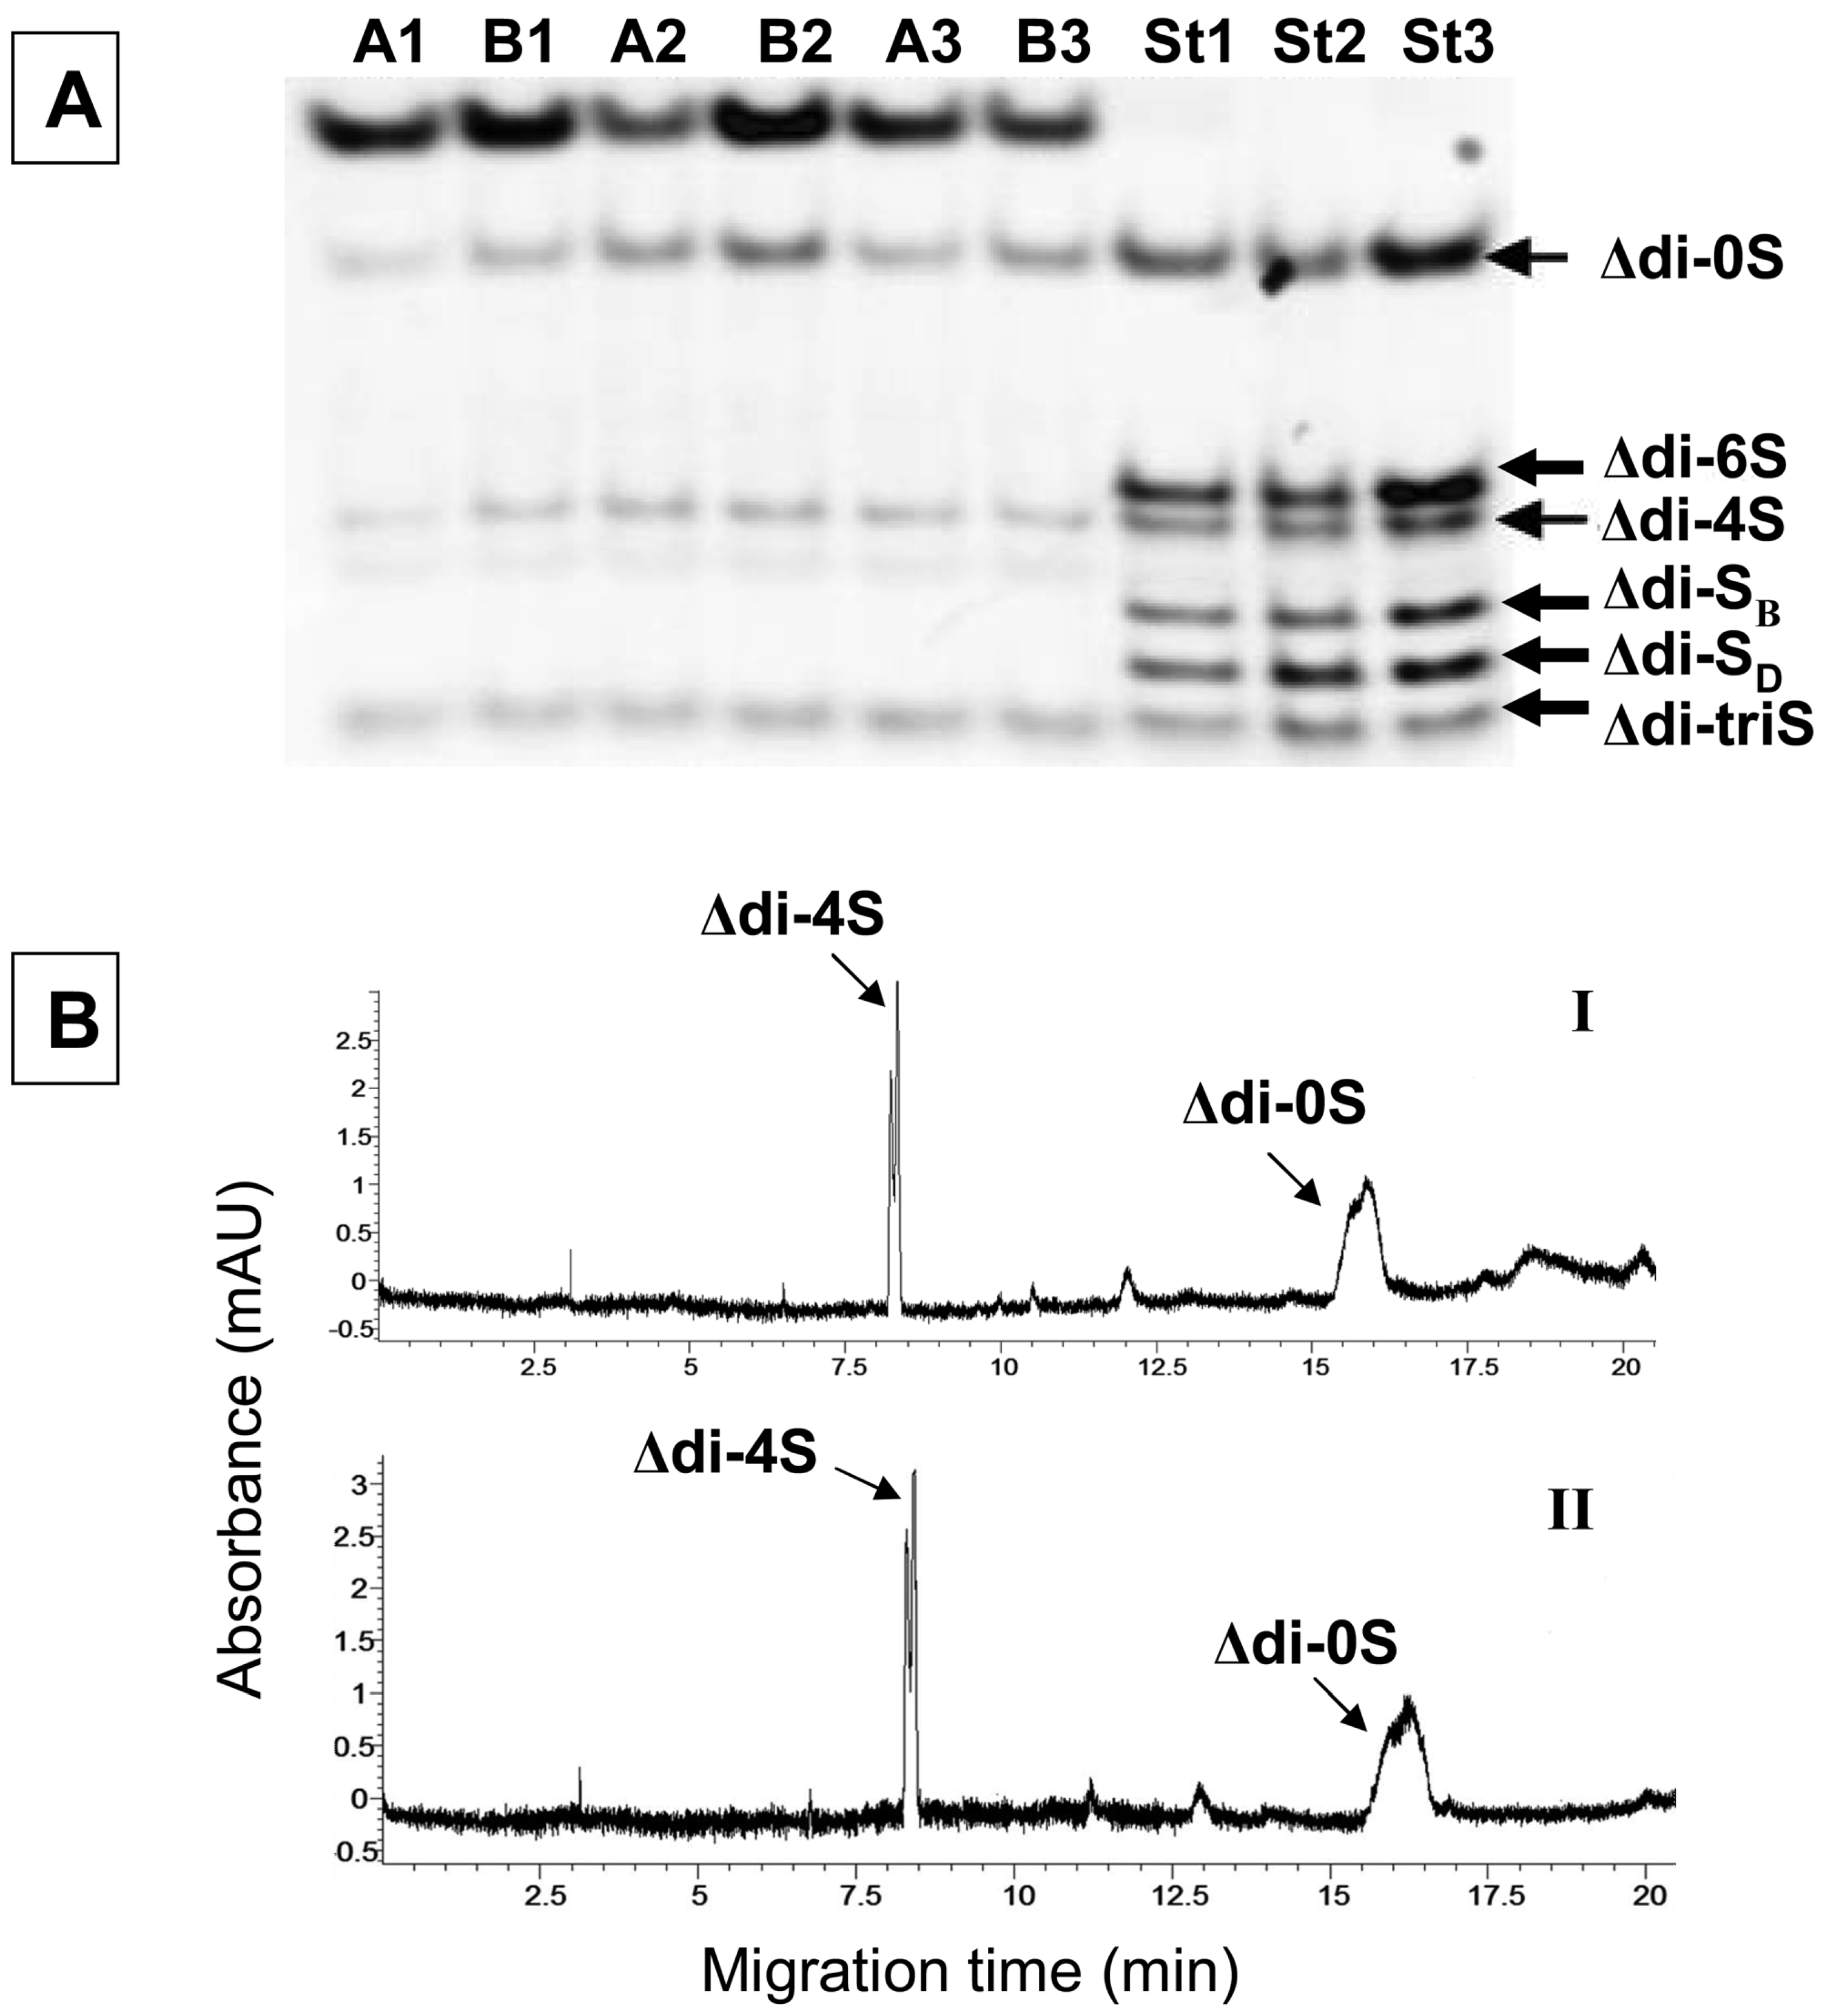
2.2. Determination of Blood Serum CS in Patients before and after Coronary Bypass with FACE and CE Analysis


| Healthy Donors | ||||||
|---|---|---|---|---|---|---|
| FACE | CE | |||||
| Δ-disaccharide | Δdi-0S | Δdi-4S | Total CS | Δdi-0S | Δdi-4S | Total CS |
| Mean concentration (μg/mL) ± SD | 4.22 ± 0.10 | 6.22 ± 0.13 | 10.44 ± 0.17 | 4.42 ± 0.10 | 6.44 ± 0.07 | 10.86 ± 0.14 |
| CV (%) | 2.37 | 2.09 | 1.63 | 2.26 | 1.09 | 1.29 |
| Percentage (%) | 40.4 | 59.6 | 40.7 | 59.3 | ||
| Before artery coronary bypass surgery | ||||||
| Mean concentration (μg/mL) ± SD | 4.24 ± 0.12 | 5.38 ± 0.29 | 9.62 ± 0.38 | 4.33 ± 0.12 | 5.53 ± 0.18 | 9.86 ± 0.27 |
| CV (%) | 2.83 | 5.39 | 3.95 | 2.77 | 3.25 | 2.74 |
| Percentage (%) | 44.07 | 55.93 | 43.91 | 56.09 | ||
| After artery coronary bypass surgery | ||||||
| Mean concentration (μg/mL) ± SD | 5.38 ± 0.21 | 5.62 ± 0.21 | 10.99 ± 0.30 | 5.55 ± 0.20 | 5.85 ± 0.37 | 11.39 ± 0.46 |
| CV (%) | 3.90 | 3.74 | 2.73 | 3.60 | 6.32 | 4.04 |
| Percentage (%) | 48.95 | 51.05 | 48.73 | 51.27 | ||
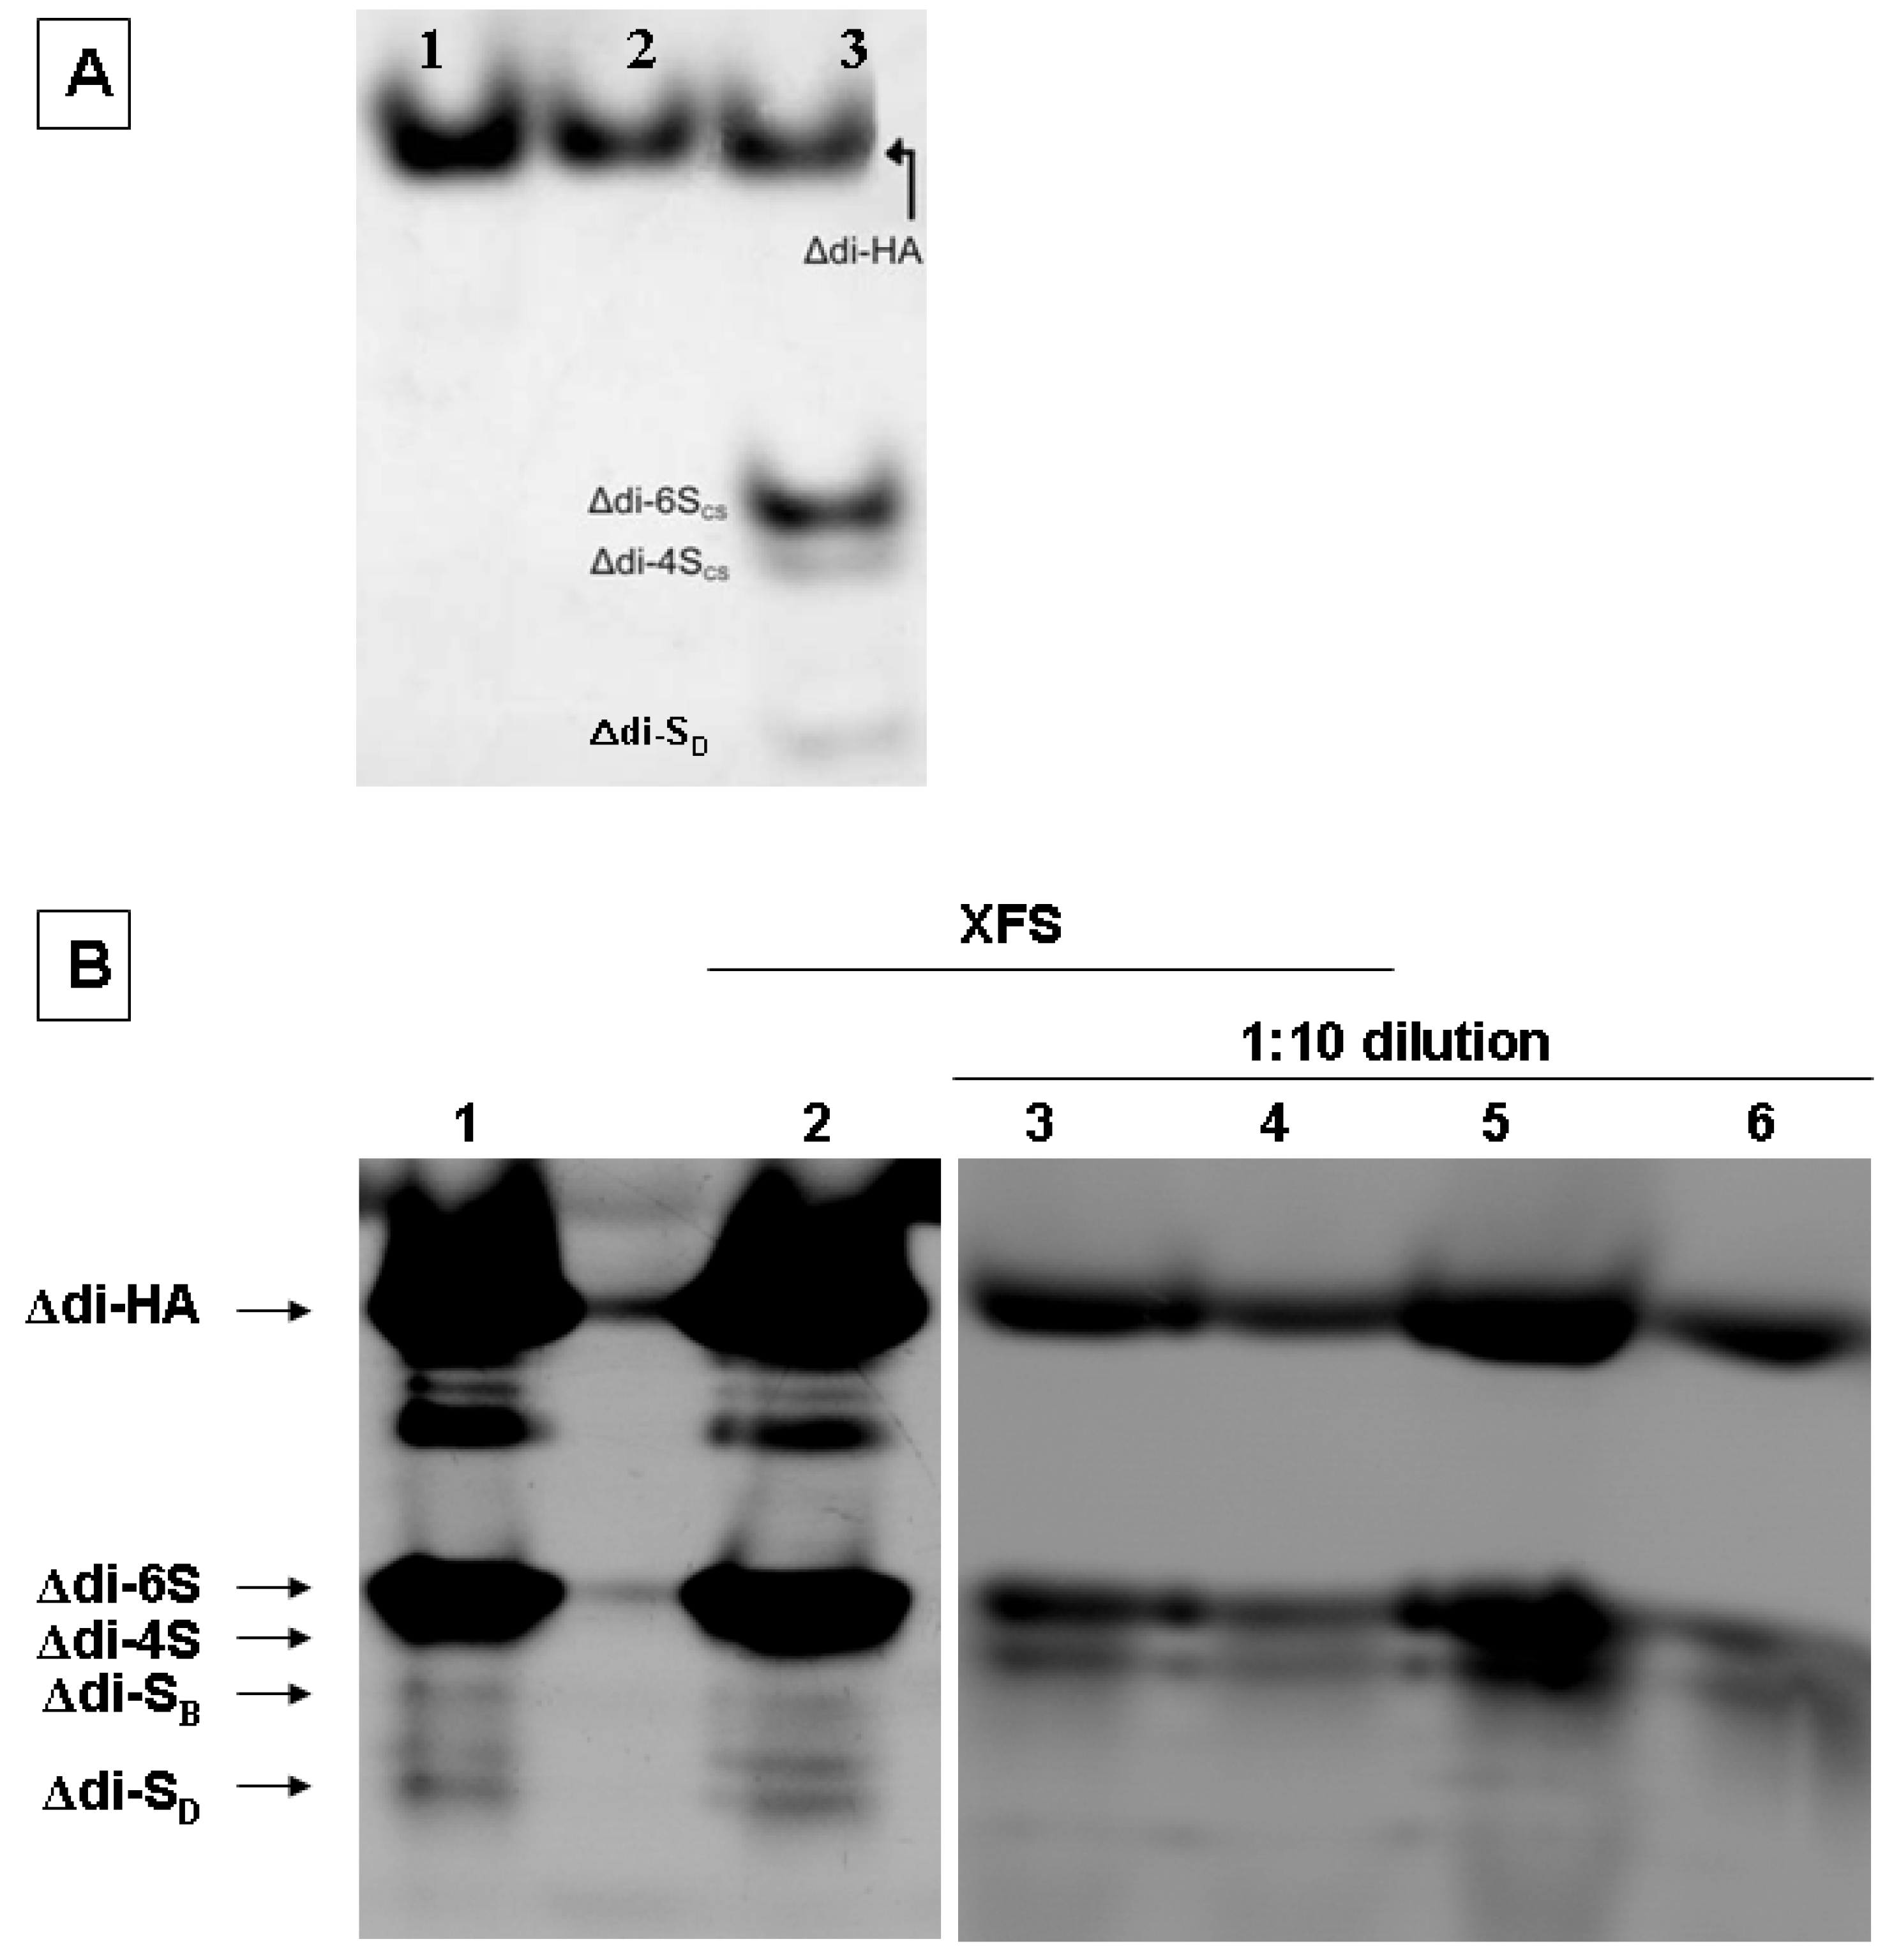
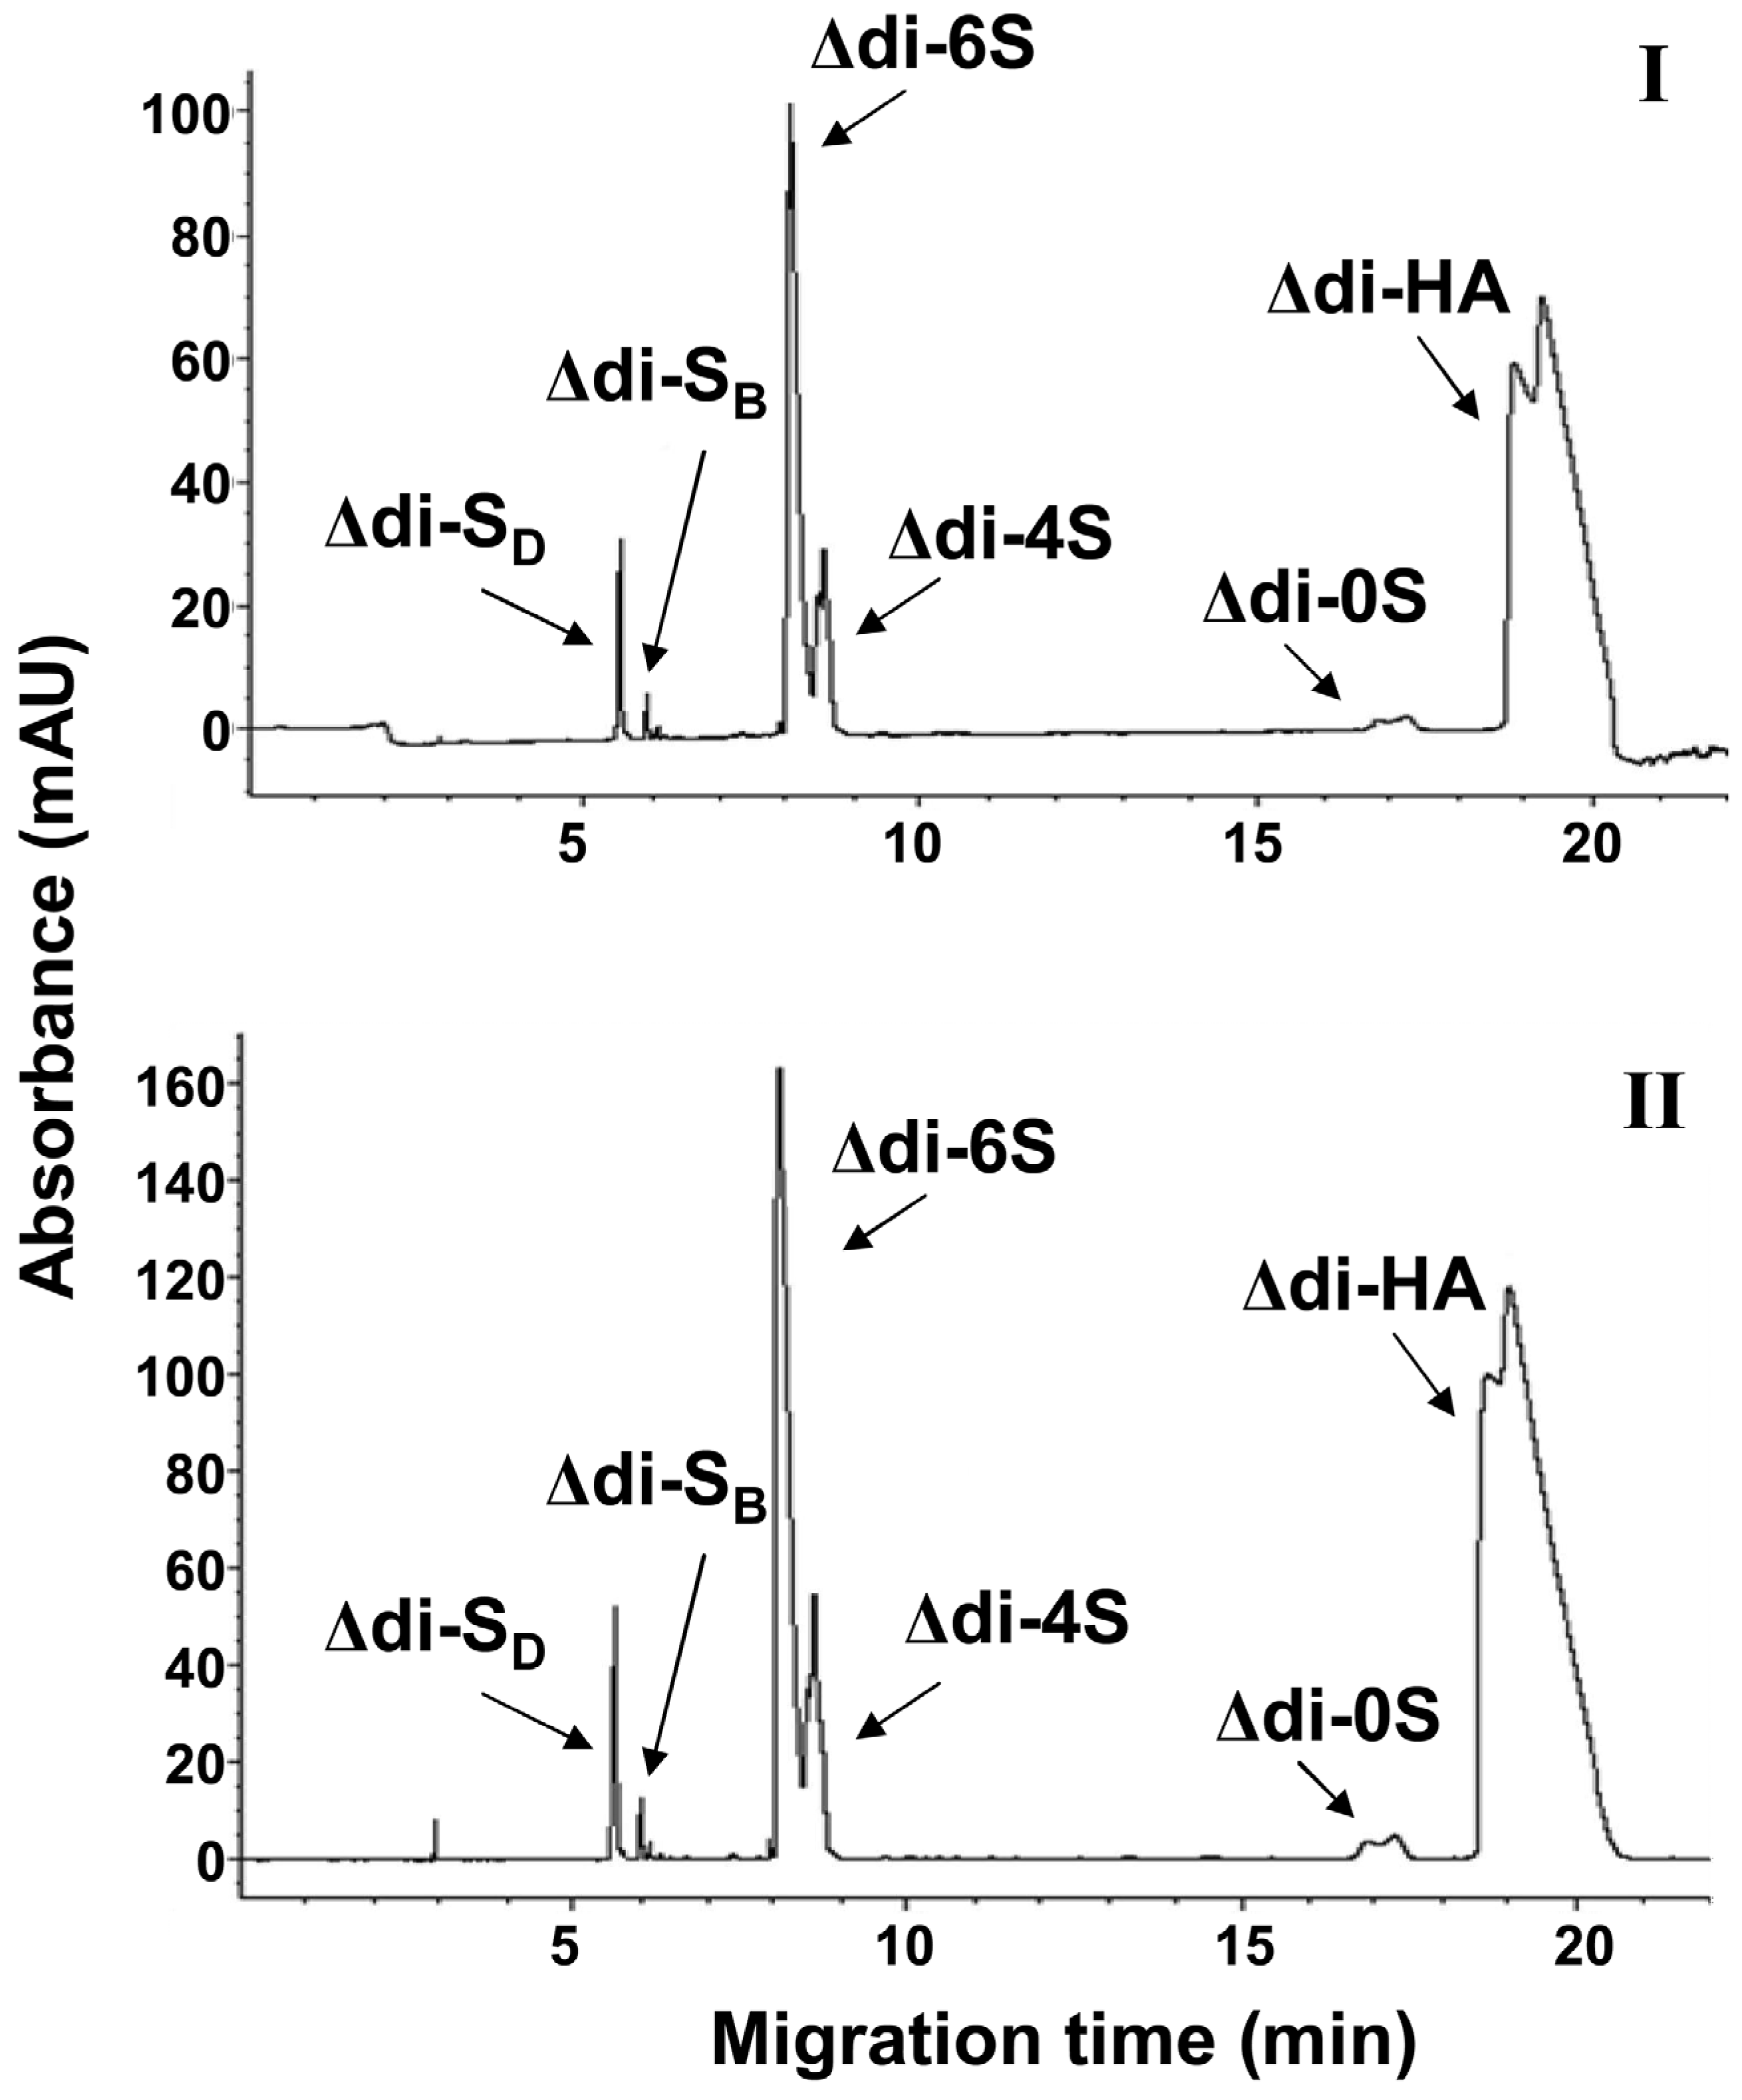
2.3. Determination of CS in Lens Capsules in Patients with XFS


| Control | ||||||
|---|---|---|---|---|---|---|
| Δ-disaccharide | Δdi-HA | Δdi-0S | Δdi-4S | Δdi-6S | Δdi-diSB | Δdi-diSD |
| Percentage (%) | 34.7 ± 3.18 | 2.0 ± 0.21 | 19.9 ± 1.34 | 64.0 ± 2.69 | 1.7 ± 0.28 | 9.4 ± 0.49 |
| CV (%) | 9.16 | 10.50 | 6.73 | 4.20 | 16.47 | 5.21 |
| Patients with XFS | ||||||
| Percentage (%) | 35.6 ± 2.33 | 1.7 ± 0.21 | 22.5 ± 2.12 | 61.3 ± 1.63 | 1.7 ± 0.21 | 9.8 ± 0.35 |
| CV (%) | 6.54 | 12.35 | 9.42 | 2.66 | 12.35 | 3.57 |
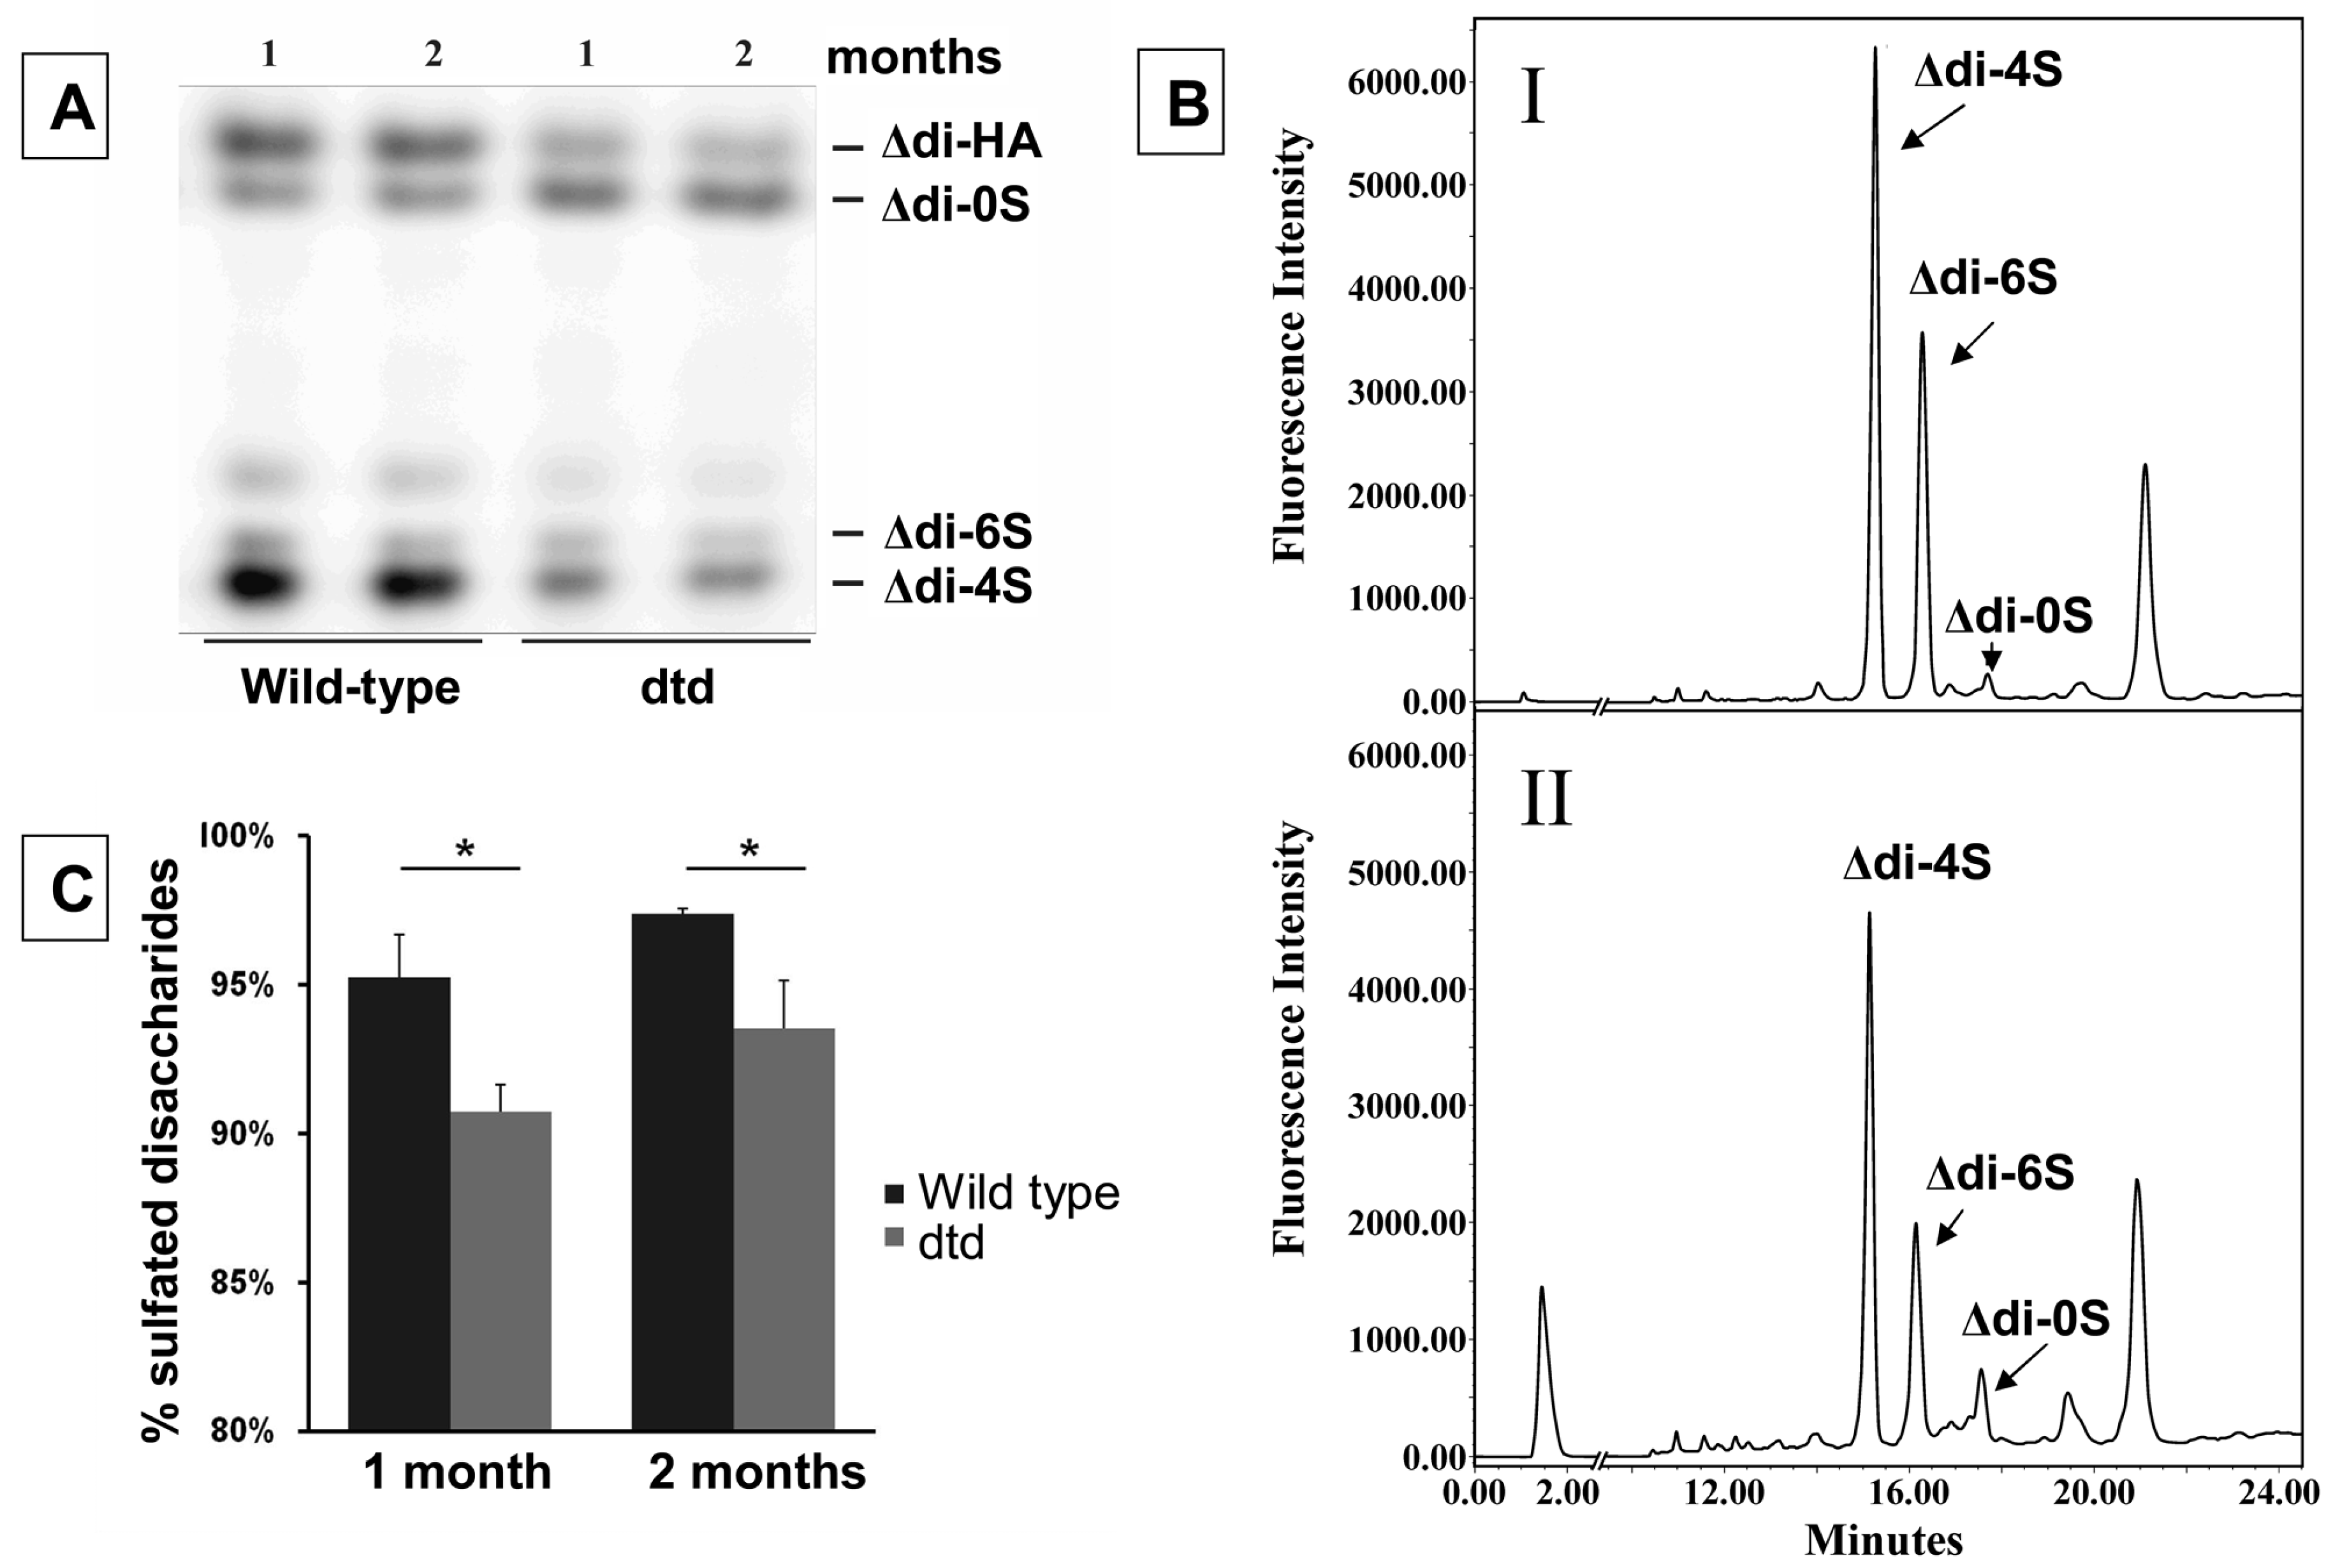
2.4. Determination of CS in Murine Urine

3. Experimental
3.1. Chemicals and Biological Materials
3.2. Procedure for Isolation of Blood Serum CS before and after Coronary Bypass
3.3. Isolation of CS and HA from Lens Capsules
3.4. CS Extraction from Mouse Urine
3.5. Derivatization
3.6. FACE Analysis
3.7. CE Analysis
3.8. HPLC Analysis
3.9. Statistical Analysis
4. Conclusions
Acknowledgments
Author Contributions
Conflicts of Interest
References
- Malavaki, C.; Mizumoto, S.; Karamanos, N.; Sugahara, K. Recent advances in the structural study of functional chondroitin sulfate and dermatan sulfate in health and disease. Connect Tissue Res. 2008, 49, 133–139. [Google Scholar]
- Kang, I.; Yoon, D.W.; Braun, K.R.; Wight, T.N. Expression of versican V3 by arterial smooth muscle cells alters tGFbeta-, EGF-, and NFkappaB-dependent signaling pathways, creating a microenvironment that resists monocyte adhesion. J. Biol. Chem. 2014. [Google Scholar] [CrossRef]
- Snow, A.D.; Kinsella, M.G.; Parks, E.; Sekiguchi, R.T.; Miller, J.D.; Kimata, K.; Wight, T.N. Differential binding of vascular cell-derived proteoglycans (perlecan, biglycan, decorin, and versican) to the beta-amyloid protein of Alzheimer’s disease. Arch. Biochem. Biophys. 1995, 320, 84–95. [Google Scholar] [CrossRef]
- Karangelis, D.E.; Kanakis, I.; Asimakopoulou, A.P.; Karousou, E.; Passi, A.; Theocharis, A.D.; Triposkiadis, F.; Tsilimingas, N.B.; Karamanos, N.K. Glycosaminoglycans as key molecules in atherosclerosis: The role of versican and hyaluronan. Curr. Med. Chem. 2010, 17, 4018–4026. [Google Scholar]
- Skandalis, S.S.; Labropoulou, V.T.; Ravazoula, P.; Likaki-Karatza, E.; Dobra, K.; Kalofonos, H.P.; Karamanos, N.K.; Theocharis, A.D. Versican but not decorin accumulation is related to malignancy in mammographically detected high density and malignant-appearing microcalcifications in non-palpable breast carcinomas. BMC Cancer 2011, 11, 314. [Google Scholar] [CrossRef]
- Fransson, L.A.; Belting, M.; Jonsson, M.; Mani, K.; Moses, J.; Oldberg, A. Biosynthesis of decorin and glypican. Matrix Biol. 2000, 19, 367–376. [Google Scholar]
- Ogawa, H.; Shionyu, M.; Sugiura, N.; Hatano, S.; Nagai, N.; Kubota, Y.; Nishiwaki, K.; Sato, T.; Gotoh, M.; Narimatsu, H.; et al. Chondroitin sulfate synthase-2/chondroitin polymerizing factor has two variants with distinct function. J. Biol. Chem. 2010, 285, 34155–34167. [Google Scholar] [CrossRef]
- Karamanos, N.K.; Vanky, P.; Syrokou, A.; Hjerpe, A. Identity of dermatan and chondroitin sequences in dermatan sulfate chains determined by using fragmentation with chondroitinases and ion-pair high-performance liquid chromatography. Anal. Biochem. 1995, 225, 220–230. [Google Scholar] [CrossRef]
- Karamanos, N.K.; Syrokou, A.; Vanky, P.; Nurminen, M.; Hjerpe, A. Determination of 24 variously sulfated galactosaminoglycan- and hyaluronan-derived disaccharides by high-performance liquid chromatography. Anal. Biochem. 1994, 221, 189–199. [Google Scholar] [CrossRef]
- Van Roij, M.H.; Mizumoto, S.; Yamada, S.; Morgan, T.; Tan-Sindhunata, M.B.; Meijers-Heijboer, H.; Verbeke, J.I.; Markie, D.; Sugahara, K.; Robertson, S.P. Spondyloepiphyseal dysplasia, Omani type: Further definition of the phenotype. Am. J. Med. Genet. A 2008, 146A, 2376–2384. [Google Scholar] [CrossRef]
- Uyama, T.; Ishida, M.; Izumikawa, T.; Trybala, E.; Tufaro, F.; Bergstrom, T.; Sugahara, K.; Kitagawa, H. Chondroitin 4-O-sulfotransferase-1 regulates E disaccharide expression of chondroitin sulfate required for herpes simplex virus infectivity. J. Biol. Chem. 2006, 281, 38668–38674. [Google Scholar] [CrossRef]
- Mizumoto, S.; Sugahara, K. Glycosaminoglycans are functional ligands for receptor for advanced glycation end-products in tumors. FEBS J. 2013, 280, 2462–2470. [Google Scholar] [CrossRef]
- Theocharis, A.D.; Theocharis, D.A.; de Luca, G.; Hjerpe, A.; Karamanos, N.K. Compositional and structural alterations of chondroitin and dermatan sulfates during the progression of atherosclerosis and aneurysmal dilatation of the human abdominal aorta. Biochimie 2002, 84, 667–674. [Google Scholar] [CrossRef]
- Karangelis, D.; Asimakopoulou, A.; Kanakis, I.; Tagarakis, G.I.; Koufakis, T.; Triposkiadis, F.; Tsilimingas, N.; Karamanos, N.K. Monitoring serum chondroitin sulfate levels in patients submitted to coronary artery bypass surgery. Biomed. Chromatogr. 2011, 25, 748–750. [Google Scholar] [CrossRef]
- Stone, J.E. Urine analysis in the diagnosis of mucopolysaccharide disorders. Ann. Clin. Biochem. 1998, 35, 207–225. [Google Scholar] [CrossRef]
- Mitsuhashi, H.; Tsukada, Y.; Ono, K.; Yano, S.; Naruse, T. Urine glycosaminoglycans and heparan sulfate excretions in adult patients with glomerular diseases. Clin. Nephrol. 1993, 39, 231–238. [Google Scholar]
- Sindelka, G.; Skrha, J.; Stibor, V.; Stolba, P. Glycosaminoglycans in urine of type 1 diabetic patients. Sb. Lek. 1993, 94, 77–80. [Google Scholar]
- Mavrikakis, M.E.; Kontoyannis, D.; Karli, J.; Kittas, C.; Giagiakou, E.; Moulopoulou, A.; Koutras, D.A. Glycosaminoglycans in urine, articular and periarticular tissues in streptozotocin diabetes in rats. Endocrinol. Exp. 1989, 23, 295–304. [Google Scholar]
- Luikart, S.D.; Fosdick, L.; Ogle, K.M.; Peterson, B.A.; Bloomfield, C.D. Serum and urine glycosaminoglycans in myeloid leukemia and myelodysplasia. Leukemia 1989, 3, 48–50. [Google Scholar]
- Thiele, H.; Sakano, M.; Kitagawa, H.; Sugahara, K.; Rajab, A.; Hohne, W.; Ritter, H.; Leschik, G.; Nurnberg, P.; Mundlos, S. Loss of chondroitin 6-O-sulfotransferase-1 function results in severe human chondrodysplasia with progressive spinal involvement. Proc. Natl. Acad. Sci. USA 2004, 101, 10155–10160. [Google Scholar] [CrossRef]
- Hastbacka, J.; de la Chapelle, A.; Mahtani, M.M.; Clines, G.; Reeve-Daly, M.P.; Daly, M.; Hamilton, B.A.; Kusumi, K.; Trivedi, B.; Weaver, A.; et al. The diastrophic dysplasia gene encodes a novel sulfate transporter: Positional cloning by fine-structure linkage disequilibrium mapping. Cell 1994, 78, 1073–1087. [Google Scholar] [CrossRef]
- Mertz, E.L.; Facchini, M.; Pham, A.T.; Gualeni, B.; de Leonardis, F.; Rossi, A.; Forlino, A. Matrix disruptions, growth, and degradation of cartilage with impaired sulfation. J. Biol. Chem. 2012, 287, 22030–22042. [Google Scholar]
- Forlino, A.; Piazza, R.; Tiveron, C.; Torre, D.S.; Tatangelo, L.; Bonafe, L.; Gualeni, B.; Romano, A.; Pecora, F.; Superti-Furga, A.; et al. A diastrophic dysplasia sulfate transporter (SLC26A2) mutant mouse: Morphological and biochemical characterization of the resulting chondrodysplasia phenotype. Hum. Mol. Genet. 2005, 14, 859–871. [Google Scholar] [CrossRef]
- Karamanos, N.K.; Lamari, F.; Katsimpris, J.; Gartaganis, S. Development of an HPLC method for determining the alpha 2-adrenergic receptor agonist brimonidine in blood serum and aqueous humor of the eye. Biomed. Chromatogr. 1999, 13, 86–88. [Google Scholar] [CrossRef]
- Lamari, F.; Katsimpris, J.; Gartaganis, S.; Karamanos, N.K. Profiling of the eye aqueous humor in exfoliation syndrome by high-performance liquid chromatographic analysis of hyaluronan and galactosaminoglycans. J. Chromatogr. B Biomed. Sci. Appl. 1998, 709, 173–178. [Google Scholar] [CrossRef]
- Karamanos, N.K.; Vanky, P.; Tzanakakis, G.N.; Tsegenidis, T.; Hjerpe, A. Ion-pair high-performance liquid chromatography for determining disaccharide composition in heparin and heparan sulphate. J. Chromatogr. A 1997, 765, 169–179. [Google Scholar] [CrossRef]
- Tomatsu, S.; Montano, A.M.; Oguma, T.; Dung, V.C.; Oikawa, H.; Gutierrez, M.L.; Yamaguchi, S.; Suzuki, Y.; Fukushi, M.; Barrera, L.A.; et al. Validation of disaccharide compositions derived from dermatan sulfate and heparan sulfate in mucopolysaccharidoses and mucolipidoses II and III by tandem mass spectrometry. Mol. Genet. MeTable 2010, 99, 124–131. [Google Scholar] [CrossRef]
- Oguma, T.; Tomatsu, S.; Montano, A.M.; Okazaki, O. Analytical method for the determination of disaccharides derived from keratan, heparan, and dermatan sulfates in human serum and plasma by high-performance liquid chromatography/turbo ionspray ionization tandem mass spectrometry. Anal. Biochem. 2007, 368, 79–86. [Google Scholar] [CrossRef]
- Karamanos, N.K.; Hjerpe, A. Disaccharide composition in glycosaminoglycans/proteoglycans analyzed by capillary zone electrophoresis. Methods Mol. Biol. 2001, 171, 181–192. [Google Scholar]
- Karamanos, N.K.; Lamari, F. State-of-the-art of capillary electrophoresis with application to the area of glycoconjugates. Biomed. Chromatogr. 1999, 13, 501–506. [Google Scholar] [CrossRef]
- Mitropoulou, T.N.; Lamari, F.; Syrokou, A.; Hjerpe, A.; Karamanos, N.K. Identification of oligomeric domains within dermatan sulfate chains using differential enzymic treatments, derivatization with 2-aminoacridone and capillary electrophoresis. Electrophoresis 2001, 22, 2458–2463. [Google Scholar] [CrossRef]
- Calabro, A.; Benavides, M.; Tammi, M.; Hascall, V.C.; Midura, R.J. Microanalysis of enzyme digests of hyaluronan and chondroitin/dermatan sulfate by fluorophore-assisted carbohydrate electrophoresis (FACE). Glycobiology 2000, 10, 273–281. [Google Scholar] [CrossRef]
- Karousou, E.G.; Viola, M.; Vigetti, D.; Genasetti, A.; Rizzi, M.; Clerici, M.; Bartolini, B.; de Luca, G.; Passi, A. Analysis of glycosaminoglycans by electrophoretic approach. Curr. Pharm. Anal. 2008, 4, 78–89. [Google Scholar] [CrossRef]
- Karousou, E.G.; Militsopoulou, M.; Porta, G.; de Luca, G.; Hascall, V.C.; Passi, A. Polyacrylamide gel electrophoresis of fluorophore-labeled hyaluronan and chondroitin sulfate disaccharides: Application to the analysis in cells and tissues. Electrophoresis 2004, 25, 2919–2925. [Google Scholar] [CrossRef]
- Viola, M.; Karousou, E.G.; Vigetti, D.; Genasetti, A.; Pallotti, F.; Guidetti, G.F.; Tira, E.; de Luca, G.; Passi, A. Decorin from different bovine tissues: Study of glycosaminoglycan chain by PAGEFS. J. Pharm. Biomed. Anal. 2006, 41, 36–42. [Google Scholar] [CrossRef]
- Viola, M.; Vigetti, D.; Karousou, E.; Bartolini, B.; Genasetti, A.; Rizzi, M.; Clerici, M.; Pallotti, F.; de Luca, G.; Passi, A. New electrophoretic and chromatographic techniques for analysis of heparin and heparan sulfate. Electrophoresis 2008, 29, 3168–3174. [Google Scholar] [CrossRef]
- Ritch, R. The management of exfoliative glaucoma. Prog. Brain Res. 2008, 173, 211–224. [Google Scholar] [CrossRef]
- Gartaganis, S.P.; Georgakopoulos, C.D.; Assouti, M.; Mela, E.K.; Exarchou, A.; Giannelou, I.; Gotsis, S.S.; Ziouti, N.; Vynios, D.H.; Tripathi, B.J.; et al. Changes in HNK-1 epitope and collagen type IX in the aqueous humour of patients with pseudoexfoliation syndrome. Curr. Eye Res. 2004, 28, 5–10. [Google Scholar] [CrossRef]
- Karousou, E.G.; Viola, M.; Genasetti, A.; Vigetti, D.; Luca, G.D.; Karamanos, N.K.; Passi, A. Application of polyacrylamide gel electrophoresis of fluorophore-labeled saccharides for analysis of hyaluronan and chondroitin sulfate in human and animal tissues and cell cultures. Biomed. Chromatogr. 2005, 19, 761–765. [Google Scholar] [CrossRef]
- Ambrosius, M.; Kleesiek, K.; Gotting, C. Quantitative determination of the glycosaminoglycan Delta-disaccharide composition of serum, platelets and granulocytes by reversed-phase high-performance liquid chromatography. J. Chromatogr. A 2008, 1201, 54–60. [Google Scholar]
- Coulier, L.; Zha, Y.; Bas, R.; Punt, P.J. Analysis of oligosaccharides in lignocellulosic biomass hydrolysates by high-performance anion-exchange chromatography coupled with mass spectrometry (HPAEC-MS). Bioresour. Technol. 2013, 133, 221–231. [Google Scholar] [CrossRef]
- Malavaki, C.J.; Asimakopoulou, A.P.; Lamari, F.N. Capillary electrophoresis for the quality control of chondroitin sulfates in raw materials and formulations. Anal. Biochem. 2008, 374, 213–220. [Google Scholar] [CrossRef]
- Lamari, F.N.; Militsopoulou, M.; Mitropoulou, T.N.; Hjerpe, A.; Karamanos, N.K. Analysis of glycosaminoglycan-derived disaccharides in biologic samples by capillary electrophoresis and protocol for sequencing glycosaminoglycans. Biomed. Chromatogr. 2002, 16, 95–102. [Google Scholar] [CrossRef]
- Winsz-Szczotka, K.; Komosinska-Vassev, K.; Kuznik-Trocha, K.; Olczyk, K. Antioxidant activity and structural modifications of serum chondroitin sulfate in Graves’ disease. Clin. Biochem. 2014, 47, 19–24. [Google Scholar] [CrossRef]
- Lu, H.; McDowell, L.M.; Studelska, D.R.; Zhang, L. Glycosaminoglycans in Human and Bovine Serum: Detection of Twenty-Four Heparan Sulfate and Chondroitin Sulfate Motifs Including a Novel Sialic Acid-modified Chondroitin Sulfate Linkage Hexasaccharide. Glycobiol. Insights 2010, 2010, 13–28. [Google Scholar]
- Lamari, F.N.; Theocharis, A.D.; Asimakopoulou, A.P.; Malavaki, C.J.; Karamanos, N.K. Metabolism and biochemical/physiological roles of chondroitin sulfates: Analysis of endogenous and supplemental chondroitin sulfates in blood circulation. Biomed. Chromatogr. 2006, 20, 539–550. [Google Scholar] [CrossRef]
- Mine, S.; Okada, Y.; Kawahara, C.; Tabata, T.; Tanaka, Y. Serum hyaluronan concentration as a marker of angiopathy in patients with diabetes mellitus. Endocr. J. 2006, 53, 761–766. [Google Scholar] [CrossRef]
- Delpech, B.; Chevallier, B.; Reinhardt, N.; Julien, J.P.; Duval, C.; Maingonnat, C.; Bastit, P.; Asselain, B. Serum Hyaluronan (Hyaluronic-Acid) in Breast-Cancer Patients. Int. J. Cancer 1990, 46, 388–390. [Google Scholar] [CrossRef]
- Komosinska-Vassev, K.; Winsz-Szczotka, K.; Olczyk, K.; Kozma, E.M. Alterations in serum glycosaminoglycan profiles in Graves’ patients. Clin. Chem. Lab. Med. 2006, 44, 582–588. [Google Scholar]
- Kozma, E.M.; Olczyk, K.; Glowacki, A.; Komosinska, K.; Sonecki, P.; Najmiec, T.; Jazwiec, M. Glycosaminoglycans of human serum and their alterations in diabetes mellitus. Acta Biochim. Pol. 1996, 43, 567–574. [Google Scholar]
- Hata, R.I.; Ohkawa, S.I.; Nagai, Y. Low-sulfated chondroitin sulfate in human blood and urine. Biochim. Biophys. Acta 1978, 543, 156–166. [Google Scholar] [CrossRef]
- Baba, H. Histochemical and polarization optical investigation for glycosaminoglycans in exfoliation syndrome. Graefes Arch. Clin. Exp. Ophthalmol. 1983, 221, 106–109. [Google Scholar] [CrossRef]
- Gartaganis, S.P.; Georgakopoulos, C.D.; Exarchou, A.M.; Mela, E.K.; Lamari, F.; Karamanos, N.K. Increased aqueous humor basic fibroblast growth factor and hyaluronan levels in relation to the exfoliation syndrome and exfoliative glaucoma. Acta Ophthalmol. Scand. 2001, 79, 572–575. [Google Scholar] [CrossRef]
- Calabro, A.; Midura, R.; Wang, A.; West, L.; Plaas, A.; Hascall, V.C. Fluorophore-assisted carbohydrate electrophoresis (FACE) of glycosaminoglycans. Osteoarthr. Cartil. 2001, 9 (Suppl. 1), S16–S22. [Google Scholar]
- Karamanos, N.K.; Axelsson, S.; Vanky, P.; Tzanakakis, G.N.; Hjerpe, A. Determination of hyaluronan and galactosaminoglycan disaccharides by high-performance capillary electrophoresis at the attomole level. Applications to analyses of tissue and cell culture proteoglycans. J. Chromatogr. A 1995, 696, 295–305. [Google Scholar] [CrossRef]
- Sample Availability: Not available.
© 2014 by the authors. licensee MDPI, Basel, Switzerland. This article is an open access article distributed under the terms and conditions of the Creative Commons Attribution license ( http://creativecommons.org/licenses/by/3.0/).
Share and Cite
Karousou, E.; Asimakopoulou, A.; Monti, L.; Zafeiropoulou, V.; Afratis, N.; Gartaganis, P.; Rossi, A.; Passi, A.; Karamanos, N.K. FACE Analysis as a Fast and Reliable Methodology to Monitor the Sulfation and Total Amount of Chondroitin Sulfate in Biological Samples of Clinical Importance. Molecules 2014, 19, 7959-7980. https://doi.org/10.3390/molecules19067959
Karousou E, Asimakopoulou A, Monti L, Zafeiropoulou V, Afratis N, Gartaganis P, Rossi A, Passi A, Karamanos NK. FACE Analysis as a Fast and Reliable Methodology to Monitor the Sulfation and Total Amount of Chondroitin Sulfate in Biological Samples of Clinical Importance. Molecules. 2014; 19(6):7959-7980. https://doi.org/10.3390/molecules19067959
Chicago/Turabian StyleKarousou, Evgenia, Athanasia Asimakopoulou, Luca Monti, Vassiliki Zafeiropoulou, Nikos Afratis, Panagiotis Gartaganis, Antonio Rossi, Alberto Passi, and Nikos K. Karamanos. 2014. "FACE Analysis as a Fast and Reliable Methodology to Monitor the Sulfation and Total Amount of Chondroitin Sulfate in Biological Samples of Clinical Importance" Molecules 19, no. 6: 7959-7980. https://doi.org/10.3390/molecules19067959