Exploiting Illumina Sequencing for the Development of 95 Novel Polymorphic EST-SSR Markers in Common Vetch (Vicia sativa subsp. sativa)


Abstract
:1. Introduction
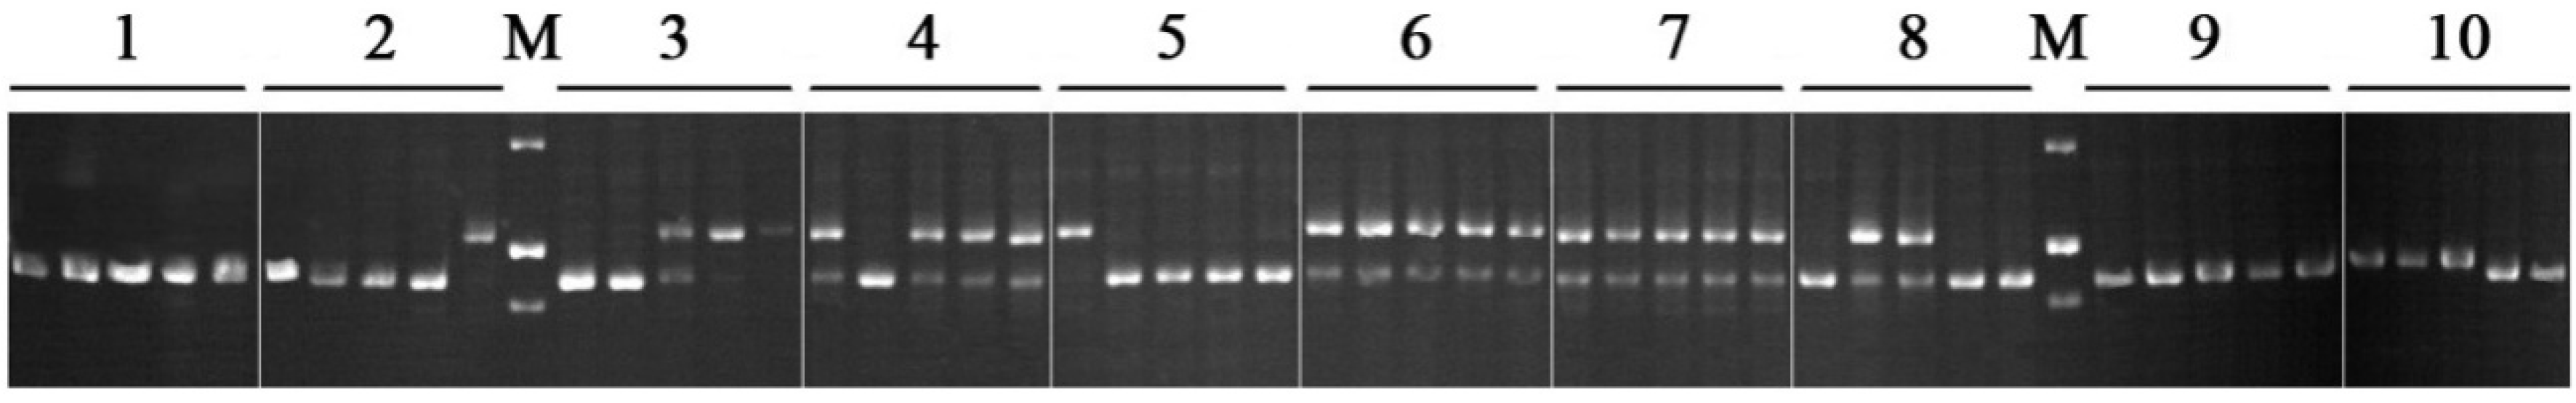
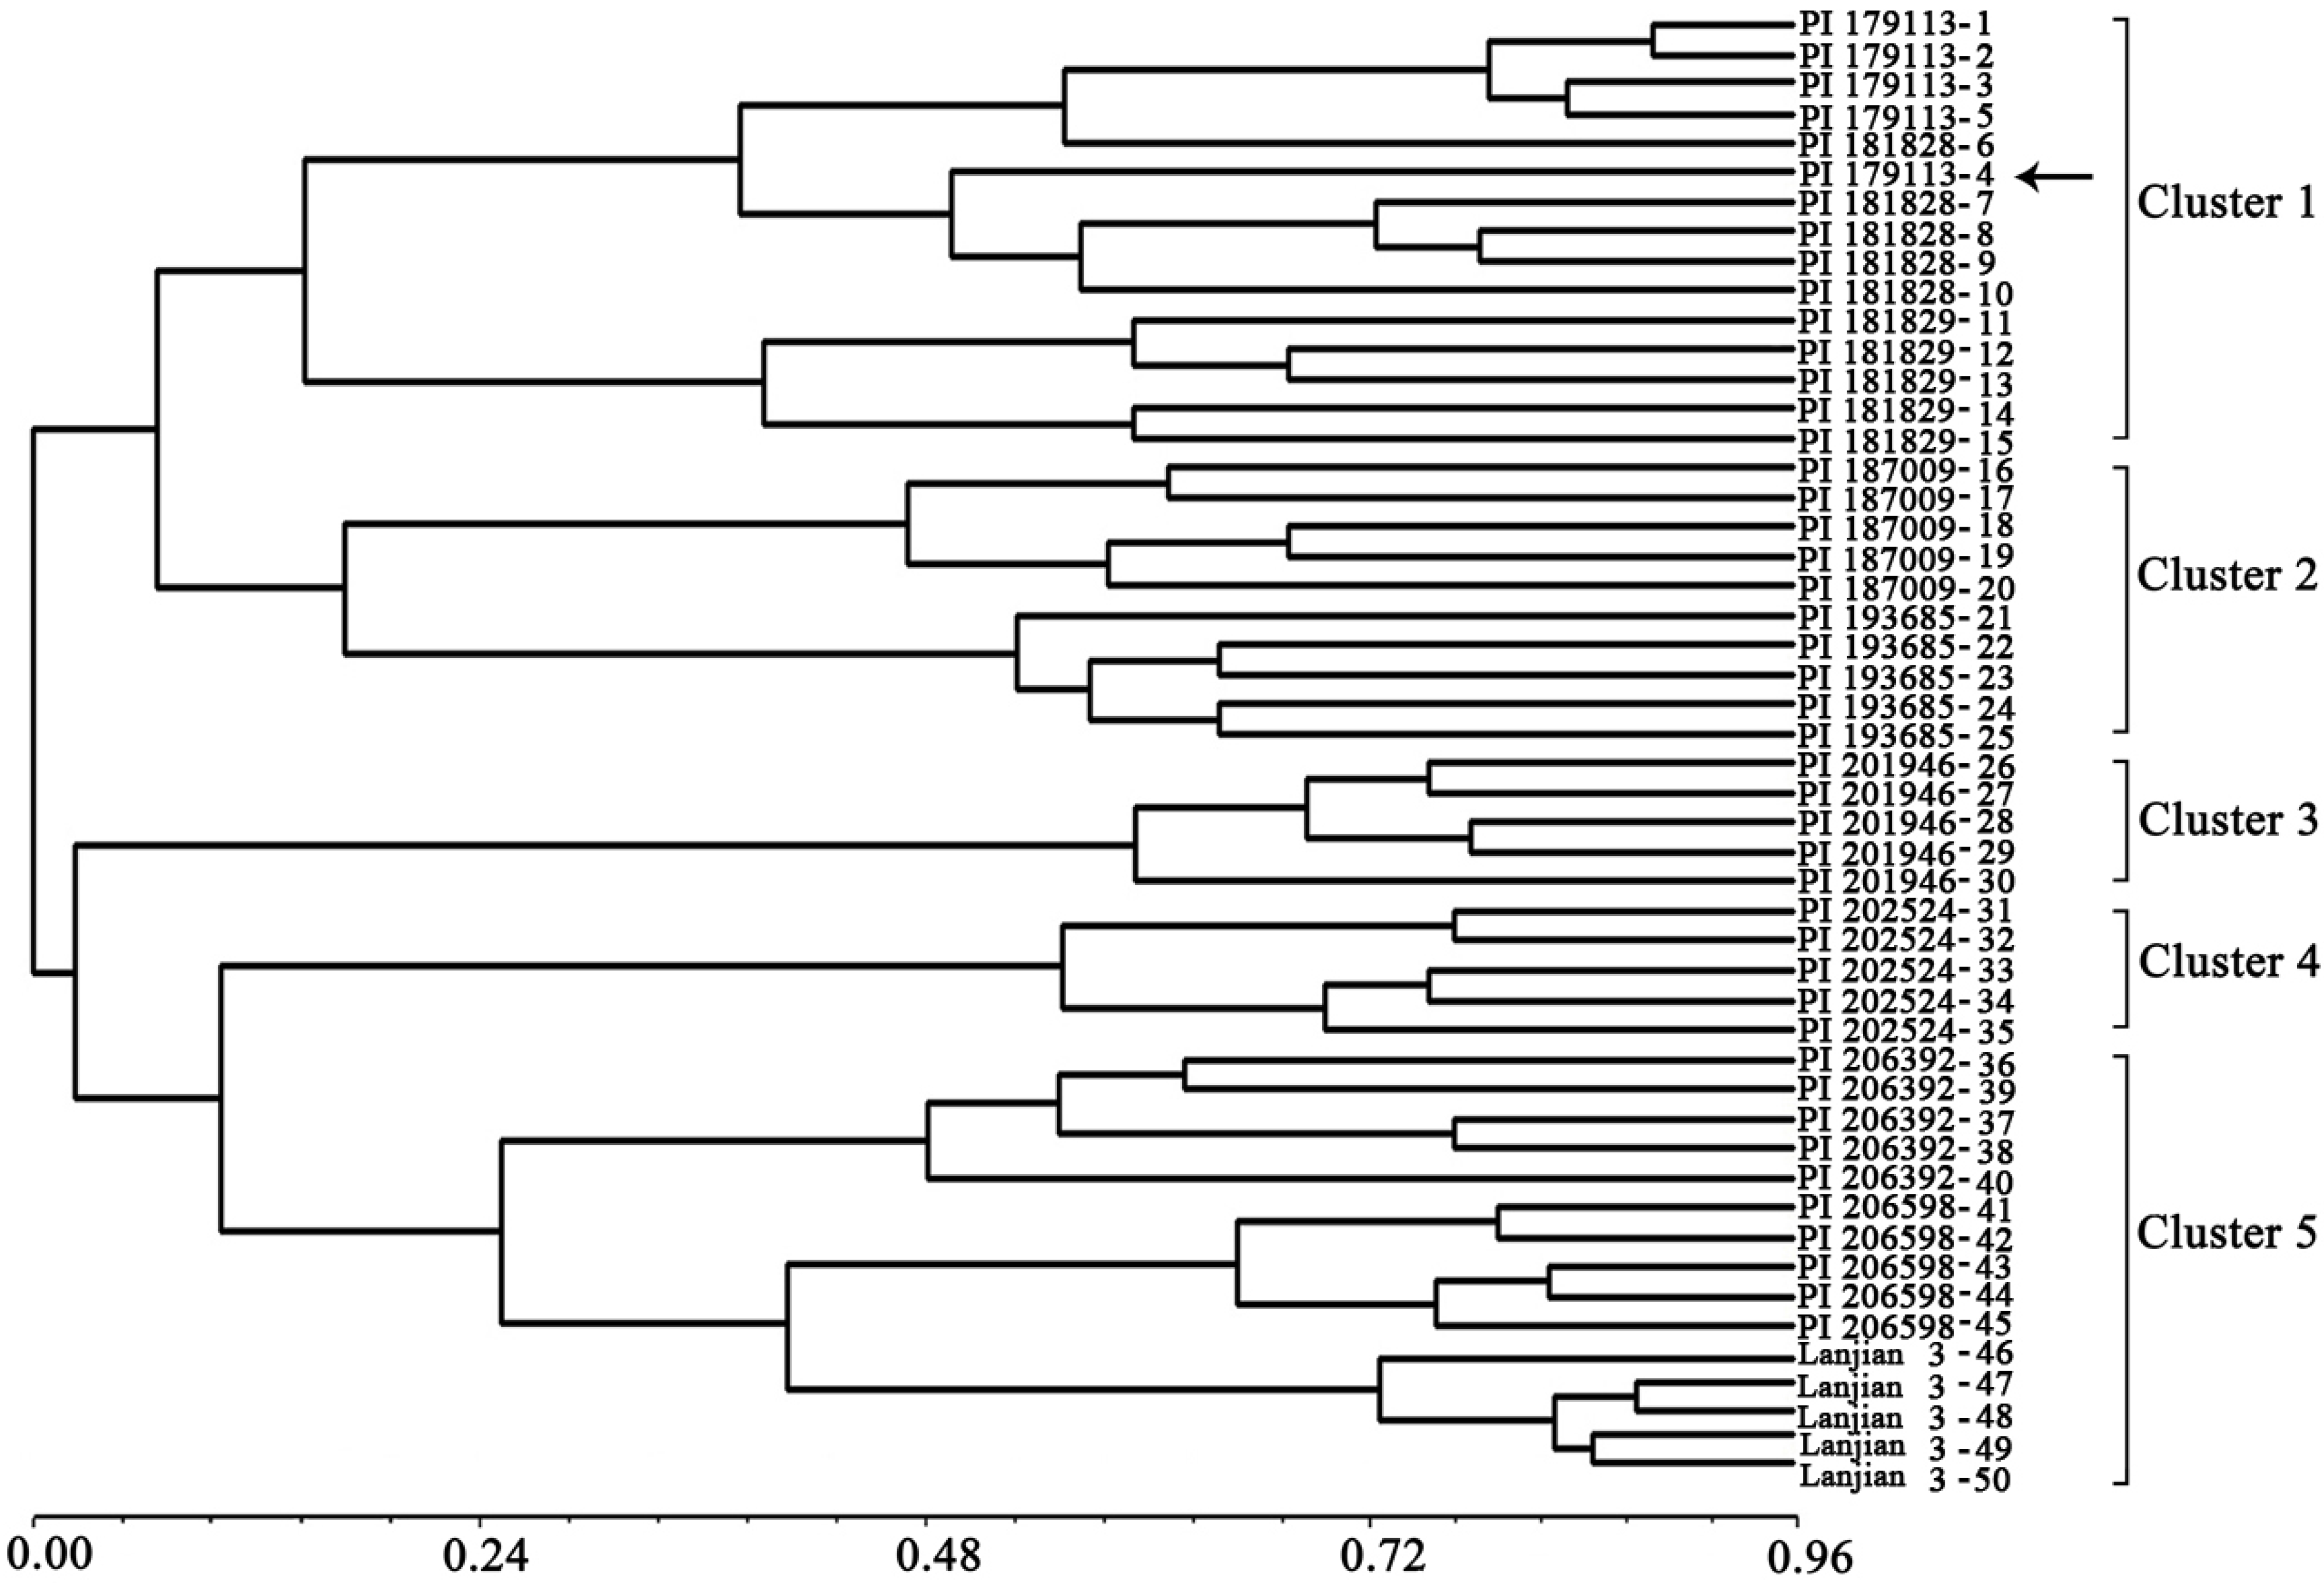
2. Results and Discussion

| No. of Repeat Units | Di- | Tri- | Tetra- | Penta- | Total |
|---|---|---|---|---|---|
| 3 | 0 | 1 | 0 | 0 | 1 |
| 4 | 0 | 0 | 0 | 0 | 0 |
| 5 | 0 | 679 | 0 | 2 | 681 |
| 6 | 12 | 243 | 0 | 1 | 256 |
| 7 | 5 | 70 | 0 | 0 | 75 |
| 8 | 1 | 7 | 0 | 0 | 8 |
| 9 | 3 | 0 | 0 | 0 | 3 |
| 10 | 1 | 0 | 0 | 0 | 1 |
| 11 | 1 | 0 | 0 | 2 | 3 |
| 12 | 0 | 0 | 1 | 1 | 2 |
| ≥13 | 0 | 41 | 0 | 0 | 41 |
| Total | 23 | 1,041 | 1 | 6 | 1,071 |
| No. | Accession No. | Origin |
|---|---|---|
| 1 | PI 179113 | Turkey |
| 2 | PI 181828 | Lebanon |
| 3 | PI 181829 | Syria |
| 4 | PI 187009 | Hungary |
| 5 | PI 193685 | Belgium |
| 6 | PI 201946 | Israel |
| 7 | PI 202524 | Morocco |
| 8 | PI 206392 | Cyprus |
| 9 | PI 206598 | Greece |
| 10 | Lanjian 3 | China |
| Primer | Primer sequence (5'-3') | Tm (°C) | Size range (bp) | NA | HO | HE | PIC |
| VS-006 | F:GTTGTTCTTAATGGTAAGTTGCTG R:TCCACCATTTTCAGTAGTAGCA | 52 | 137–167 | 5 | 0.2 | 0.11 | 0.09 |
| VS-009 | F:CCCATAACAACTTCATCTTCATC R:GGAAGAGAGTAAGTGCATGTGTGT | 54 | 123–153 | 7 | 0 | 0.69 | 0.63 |
| VS-015 | F:TTCGGGTGATGAAGAAGCT R:CAATTAAGCGTCTATATTCATCGG | 54 | 164–194 | 7 | 0 | 0.81 | 0.78 |
| VS-017 | F:AACCTAGAATCCAAGACGACGA R:GAGGAAATGCGTCACAGTGAT | 54 | 132–162 | 7 | 0 | 0.82 | 0.8 |
| VS-018 | F:AGAGAGAGAAGCTGCGATGTT R:TATGACTGTCTGGCTTTCTTGA | 52 | 149–179 | 9 | 0.08 | 0.82 | 0.8 |
| VS-020 | F:TTTGAAGCAGCTTGTTGATGC R:TAACAAACAATTAGAGTCCAAGG | 55 | 153–183 | 5 | 0.02 | 0.74 | 0.7 |
| VS-025 | F:TTGTTCGAATCATAATCACCG R:AAGAAGAGGATGATGAAGGAGA | 52 | 168–204 | 6 | 0.05 | 0.25 | 0.24 |
| VS-027 | F:TCAGGTATCAAACTGGTTCATAAA R:TTGTGGTTGTGGTGGTGG | 52 | 172–220 | 13 | 0.1 | 0.89 | 0.88 |
| VS-029 | F:GAACTAAGAATGGGAGGAGAAGA R:TCCGAATCCTCCCTGATGA | 55 | 171–219 | 7 | 0 | 0.83 | 0.81 |
| VS-030 | F:AACCAAGACCACGATTCATC R:GACGCTCGGGTGTCTTTACATTT | 58 | 181–211 | 5 | 0 | 0.66 | 0.59 |
| VS-032 | F:AGCCCCCTTCTATTGACC R:CCAGGAGGTATGTTTGCATT | 54 | 167–227 | 7 | 0 | 0.69 | 0.65 |
| VS-044 | F:GAAGAAGCCATACAAGGACCTA R:ATGGGCAATCTAGTGGTGGTAA | 55 | 136–166 | 7 | 1 | 0.83 | 0.81 |
| VS-048 | F:TGGGAAGTTGCTGGAGTTCT R:AGAATGAAATGCTCCTGCA | 53 | 150–190 | 7 | 0.72 | 0.77 | 0.74 |
| VS-053 | F:AGTGATAGCGGCAGTGGCA R:ATAATCAATCCAAATTCTCTGGTC | 56 | 136–166 | 7 | 0 | 0.82 | 0.79 |
| VS-057 | F:ACCCAAACAAGAGAACAAAGCATG R:CTTGCACCCATTTTTCTCTTGG | 58 | 175–205 | 7 | 0 | 0.74 | 0.7 |
| VS-060 | F:AAGAGAACTCATTGCCCAGT R:CTTTACCTCACCCCTTTCACCTT | 56 | 195–215 | 5 | 0 | 0.73 | 0.69 |
| VS-063 | F:TCAATCAGAAGCGACGTAAACG R:TAACAGCTCAGCCGTGCCT | 56 | 168–198 | 5 | 0 | 0.53 | 0.5 |
| VS-065 | F:GGAGATTTATGTGTATCATGGTCT R:CCAAATTCCTTCAACTAAAAGAGG | 54 | 184–214 | 7 | 0 | 0.78 | 0.75 |
| VS-068 | F:AGCATCCTTAGGAGAGGAATCC R:GCCTCGTGTTAGGGGACAGTTT | 58 | 133–163 | 7 | 0 | 0.79 | 0.76 |
| VS-075 | F:GTCAACAGAAGGAACCTCGCAT R:GGAGCAAAAACATAAGCTAGGG | 57 | 125–161 | 4 | 0.04 | 0.72 | 0.67 |
| VS-086 | F:CCATGATTAACTGAACCGCCTA R:ATCTGGAGGAGGAAAGGGA | 55 | 141–171 | 7 | 0 | 0.82 | 0.8 |
| VS-113 | F:GACAGAATTGGTGATGCTAATGG R:TTTGTGCTTGAACTAGACGTACC | 55 | 170–206 | 7 | 0 | 0.59 | 0.57 |
| VS-115 | F:TTTCCAAGATGACAGAATTGGTG R:AGACGTACCATTCACAGCATTT | 55 | 166–202 | 7 | 0 | 0.68 | 0.66 |
| VS-128 | F:TTCAAGAGCGATTCGACGAT R:GCTTTTGGAGGGTATGGCTGTTT | 59 | 184–214 | 5 | 0.04 | 0.76 | 0.72 |
| VS-131 | F:AAGTCTGGTCGGTAAAGGAACCT R:GAATGAGAAAACATGGCAAAGT | 56 | 101–134 | 7 | 0 | 0.6 | 0.58 |
| VS-134 | F:TTCCCATCAAATGCAAGGTG R:CGCAAATAACTATCGTCTCTGAC | 55 | 157–187 | 5 | 0.93 | 0.76 | 0.72 |
| VS-138 | F:CTTCTTCGGATTTACGGAGAGTGA R:ATGGCTGCTTCGGGTATC | 57 | 154–190 | 4 | 0 | 0.55 | 0.45 |
| VS-139 | F:ACCACCCTTTTTCTTGAGCAG R:ATGGCAGTCGTGAGAGCTTT | 54 | 155–185 | 7 | 0.06 | 0.76 | 0.72 |
| VS-140 | F:CTTTTTCTTCAACAGGCTTCCA R:GTAATAGAACGAGAAGAATCATT | 55 | 168–198 | 7 | 0.08 | 0.78 | 0.74 |
| VS-142 | F:ATGCCCGACTCTTCAAGAAGTTT R:TACAATGCATAGGAGAGGAGACCT | 57 | 160–202 | 7 | 0 | 0.65 | 0.59 |
| VS-147 | F:ACGGCTCGATGGACAGTAGTT R:TCAGTGTTTCTAAGGTTTTGCAT | 55 | 172–208 | 11 | 0.48 | 0.62 | 0.55 |
| VS-168 | F:GACGACCTCCTTGACTTCTC R:CGGTGGAATTGGAGTTACTA | 56 | 124–154 | 5 | 0.83 | 0.67 | 0.61 |
| VS-169 | F:GACGACCTCCTTGACTTCTC R:CGGTGGAATTGGAGTTACTA | 56 | 124–154 | 7 | 0 | 0.78 | 0.75 |
| VS-175 | F:CTTTCCCCAAATCGAGTATC R:ACCTAGGTTGTGAGCTTGG | 56 | 120–140 | 3 | 0.12 | 0.67 | 0.61 |
| VS-183 | F:TACCAACCTTGGCAGTTACA R:AAGGTGGAGATGTCCGATTA | 57 | 143–173 | 4 | 0.89 | 0.75 | 0.71 |
| VS-204 | F:GGTTCCACAAACGACAATAC R:GTTCCCTCAACATCCAAATC | 56 | 125–155 | 9 | 0.01 | 0.85 | 0.83 |
| VS-206 | F:TCACGAAGGAACTGATCAAC R:CTTCCACCAAAGATTCCAAG | 57 | 124–160 | 6 | 0.02 | 0.79 | 0.76 |
| VS-207 | F:TCACGAAGGAACTGATCAAC R:CTTCCACCAAAGATTCCAAG | 57 | 124–160 | 5 | 0 | 0.68 | 0.64 |
| VS-251 | F:ATTTCTTTAGAGCGGTGGAG F:CGAGCCATCAACAAACTC | 56 | 115–151 | 12 | 0.07 | 0.98 | 0.98 |
| VS-252 | F:CTATGGTTATGAGCGTCCTG R:TAGTTCTTGCGATGGTGACT | 55 | 141–171 | 9 | 0.25 | 0.69 | 0.67 |
| VS-255 | F:ATCATCCCCATCATAACCAC R:AGTTGCTGGGGTTCTAGGT | 56 | 124–154 | 4 | 0.02 | 0.67 | 0.6 |
| VS-257 | F:TACTCCGTGTGGTGAAGTTT R:GGAGGCGGAGAGTAATAAGT | 55 | 135–165 | 8 | 0 | 0.79 | 0.76 |
| VS-258 | F:CTCATCATGCACCTCAGATT R:GACTGATGCTGAAAAAGCAC | 56 | 145–175 | 4 | 0 | 0.66 | 0.6 |
| VS-259 | F:GGAGGGATGTTGAAGTTTCT R:CAACCTTTGTTCAAGCTGAC | 55 | 160–190 | 3 | 0.02 | 0.61 | 0.53 |
| VS-267 | F:GTGCAGAGAAATGCAAAGAG R:ACCACCACCACCTTGATAA | 56 | 137–190 | 7 | 0.06 | 0.79 | 0.76 |
| VS-272 | F:GGAACTTGTCGATGTGATTG R:AAGATGAAGAAGACGGTGGT | 56 | 124–154 | 4 | 0 | 0.72 | 0.67 |
| VS-274 | F:CATGAAGGAGTCAAAGGACA R:TAGCTCAAACTGCCTCAAAG | 56 | 141–169 | 5 | 0.1 | 0.64 | 0.59 |
| VS-276 | F:CTCCGAAACATGGTTCATC R:TTCTCACTCTCACACTTTGC | 56 | 146–176 | 7 | 0.96 | 0.86 | 0.84 |
| VS-279 | F:GATTGCCAGATATGCATGAG R:GCCGGGTTAAAGAGATTGT | 56 | 116–146 | 9 | 0.08 | 0.94 | 0.94 |
| VS-280 | F:GATTGCCAGATATGCATGAG R:GCCGGGTTAAAGAGATTGT | 56 | 116–146 | 3 | 0.96 | 0.5 | 0.38 |
| VS-282 | F:CGGAATATCAGAACTCAACG R:GATTGATGGTGAGGATGAGA | 55 | 133–175 | 4 | 0 | 0.7 | 0.65 |
| VS-286 | F:CGTTAGCGGTATTTGTGGTA R:GAAGATACCTTGACCCTGCT | 56 | 126–168 | 5 | 0 | 0.56 | 0.53 |
| VS-292 | F:AGATGATTGTGAGGAGACCA R:CTGTTGAGCACACTGTACC | 55 | 127–157 | 7 | 0 | 0.81 | 0.78 |
| VS-293 | F:TCCACACTCAGTCTTCGTTT R:GCTCTCATCACAATCTGTCC | 55 | 128–164 | 8 | 0.89 | 0.83 | 0.81 |
| VS-295 | F:ACACCACCAAGTGATCAAAG R:GGTAACCGTAGATGCTGAGA | 55 | 133–163 | 7 | 0 | 0.81 | 0.78 |
| VS-296 | F:CAAAATCACCACTCCCACTA R:CTGTGACAAGGTTGTTGTTG | 56 | 119–149 | 4 | 0.34 | 0.69 | 0.63 |
| VS-297 | F:TCATCACCCTGAGTATGACC R:CAACGTAAGGAACACTTGCT | 55 | 137–167 | 4 | 0 | 0.66 | 0.6 |
| VS-302 | F:ACAACACCTCCCGTATCTTC R:CACTGTTTGTTGGGGAGTAA | 56 | 123–159 | 5 | 0 | 0.77 | 0.73 |
| VS-303 | F:TGGCTCATATGGTGGTAATC R:GCATCTGTTCCATAACTTGC | 55 | 126–156 | 10 | 0 | 0.78 | 0.75 |
| VS-304 | F:CAGTTGGGTCTTGTTTGTCT R:AAGCTCTCCTCATCAAAACC | 56 | 136–166 | 6 | 0.25 | 0.76 | 0.72 |
| VS-305 | F:CTTTGCCTGTTCATCTTCTG R:GAACCTTGTTTCTTCCAAGC | 56 | 173–203 | 5 | 0.18 | 0.78 | 0.74 |
| VS-308 | F:GAGTCTCGCTTCTCCATCTT R:GGGAGAGGGTATTTTGGTAA | 56 | 123–153 | 7 | 0 | 0.78 | 0.76 |
| VS-314 | F:TCTGGGAGTAATTCACATGG R:GAGAAAGAAAACGCAGAAGG | 56 | 150–192 | 7 | 0 | 0.75 | 0.71 |
| VS-315 | F:GCAAAGGTGTGAGAGTGAGA R:CTTCTGTTGTCGTGCAATG | 56 | 151–181 | 5 | 0 | 0.65 | 0.57 |
| VS-317 | F:TGGAAGCACAGAAGATGAAG R:CTGATGTTGGTGACTTTGGT | 56 | 131–161 | 9 | 0.16 | 0.74 | 0.7 |
| VS-326 | F:CCAAATGGAGGACCTATGAT R:GAGGATGAATTTGGAGCTGT | 56 | 124–154 | 11 | 0 | 0.83 | 0.81 |
| VS-333 | F:CCTTCACGTCTTCATACCAA R:ACCTGATTCAAGTTCAGTGG | 56 | 108–138 | 7 | 0 | 0.81 | 0.79 |
| VS-343 | F:TTGGAGTAGCATTCGATGTC R:GGGTCTGGTTGTTGAAGTTG | 58 | 165–195 | 5 | 0 | 0.64 | 0.57 |
| VS-358 | F:GAGAAAGAGGTGGGTTTTTC R:CCGCTAGTACCAAACCCTAT | 55 | 142–172 | 7 | 0 | 0.81 | 0.78 |
| VS-363 | F:CCTCTCATCCGTAGGATTTT R:GAGGTGGATTCCGGTAAAG | 57 | 129–159 | 5 | 0 | 0.78 | 0.75 |
| VS-373 | F:GTGATTTCAACCACCAACAC R:GAGGTGGAGGGTATGAGTTT | 56 | 126–162 | 5 | 0 | 0.76 | 0.72 |
| VS-378 | F:AGGTTCAATGCATCACTCC R:CCAACAACAGCAACAACAG | 56 | 129–165 | 7 | 0 | 0.85 | 0.83 |
| VS-379 | F:TGATGGAGTTGGAGAAGATG R:TCCGCAGAAGTATCAGTGTC | 56 | 136–166 | 9 | 0.44 | 0.82 | 0.8 |
| VS-382 | F:GGTCACGATTATCTCAACCA R:GTACCGGAGGAAGTGAAAAC | 56 | 139–154 | 7 | 0 | 0.81 | 0.78 |
| VS-406 | F:GTTTGCAGCCATAGGAGGT R:CACCATCACAAGCTCCATT | 57 | 125–155 | 5 | 0 | 0.77 | 0.73 |
| VS-408 | F:ACTTCCCCCAACTCTACAAA R:GGAAAAAGTCCAGACGAGAC | 56 | 133–169 | 7 | 0 | 0.77 | 0.74 |
| VS-415 | F:GGTCCTTTCCTTTGTTCTTC R:GGTAACGCACATAGAAGCTG | 56 | 126–156 | 4 | 0 | 0.74 | 0.69 |
| VS-417 | F:CGTTCATCAAAGCTTCCTC R:CATAGTTAAAGGCAGGCTCA | 55 | 139–169 | 7 | 0 | 0.76 | 0.71 |
| VS-418 | F:TAGCTATTGTGCCTTGGGTA R:CGATGCTTCATCTTCTTCTC | 56 | 122–152 | 8 | 0 | 0.86 | 0.84 |
| VS-422 | F:GAGTTCAGAAACTTCCCAGT R:CACCACTCTCCTTTCCTCTT | 55 | 144–186 | 8 | 0.02 | 0.79 | 0.76 |
| VS-423 | F:CTCCTGAGTCTTGGCAAAT R:GGTTTACCAAACCAGCTACA | 55 | 124–161 | 7 | 0 | 0.79 | 0.76 |
| VS-425 | F:GAGGAAGCATAAGAGGCACT R:CTCACCATGGAAGATTTCAG | 56 | 125–155 | 7 | 0 | 0.82 | 0.8 |
| VS-426 | F:TTAGCACACAACACAACAGC R:GATCATTGACTTGGAGCAGA | 56 | 165–195 | 7 | 0 | 0.84 | 0.82 |
| VS-428 | F:CCGTTCTGAATTATGTAGCC R:CATTTGAACTCCTTCACTGC | 55 | 135–165 | 9 | 0 | 0.66 | 0.59 |
| VS-429 | F:GAGACTGGACAGATTGTTGG R:ACAACCCTTCTCTTCTGCTT | 55 | 146–182 | 9 | 0 | 0.87 | 0.86 |
| VS-430 | F:GTCATTCCCATGGTTCTCAT R:GTCAGTCACTCGACTGGAAA | 57 | 125–155 | 7 | 0 | 0.62 | 0.6 |
| VS-431 | F:CAGGATAATGTTCTCCACCA R:GAGCTTCTTGGGATGGTTAT | 55 | 147–183 | 4 | 0.02 | 0.67 | 0.61 |
| VS-433 | F:TACTTAGTTCGGCCGGTATT R:GGCCCACCTACATTGATACT | 56 | 136–166 | 6 | 0.56 | 0.79 | 0.76 |
| VS-437 | F:ACAACAACATCACCCTTCAG R:TATCTGGACCAACTGATTGC | 56 | 137–167 | 6 | 0 | 0.83 | 0.81 |
| VS-439 | F:AGCATCATTCAGGAGACAAG R:TGCTCCAGCTGATCTACTTC | 55 | 139–169 | 7 | 0 | 0.81 | 0.78 |
| VS-440 | F:ATCCCTCAACCTTGATCTGT R:ATATTGGGATCTGGGTTCC | 56 | 125–161 | 5 | 0 | 0.76 | 0.72 |
| VS-441 | F:CTTGGTTAGATTGCAACGAC R:ACGCGACAGTAGCATAGAAA | 55 | 136–166 | 6 | 0 | 0.83 | 0.81 |
| VS-442 | F:CAACGGCTTAAAGAGAAGGT R:TACATCATAAACCGGTACGC | 56 | 150–180 | 6 | 0 | 0.8 | 0.77 |
| VS-445 | F:AGAAGCGCAACAGTCTTGTA R:AGAAGACGCACTTTACCTGA | 56 | 137–170 | 5 | 0.52 | 0.64 | 0.59 |
| VS-447 | F:GAGACCAAGGGAACTGAATC R:CAGATTGATTAGGCAGCAAG | 56 | 157–187 | 9 | 0.21 | 0.85 | 0.83 |


3. Experimental
3.1. Plant Material
3.2. Detection of EST-SSR Markers and Primer Design
3.3. PCR Amplification and Diversity Analysis
4. Conclusions
Supplementary Materials
Acknowledgments
Author Contributions
Conflicts of Interest
References
- Chung, J.W.; Kim, T.S.; Suresh, S.; Lee, S.Y.; Cho, G.T. Development of 65 novel polymorphic cDNA-SSR markers in common vetch (Vicia sativa subsp. sativa) using next generation sequencing. Molecules 2013, 18, 8376–8392. [Google Scholar] [CrossRef]
- Mirzapour, M.; Nofouzi, F.; Mokhtarzadeh, S.; Kendir, H.; Khawar, K.M. Effects of BAP-NAA on plant regeneration from half cotyledon explants of Turkish common vetch (Vicia sativa L.) cultivar Kubilay. Curr. Opin. Biotechnol. 2013, 24, 121. [Google Scholar] [CrossRef]
- Neumann, P.; Koblízková, A.; Navrátilová, A.; Macas, J. Significant expansion of Vicia pannonica genome size mediated by amplification of a single type of giant retroelement. Genetics 2006, 173, 1047–1056. [Google Scholar] [CrossRef]
- Castiglione, M.R.; Frediani, M.; Gelati, M.T.; Ravalli, C.; Venora, G.; Caputo, P.; Cremonini, R. Cytology of Vicia species. X. karyotype evolution and phylogenetic implication in Vicia species of the sections Atossa, Microcarinae, Wiggersia and Vicia. Protoplasma 2011, 248, 707–716. [Google Scholar] [CrossRef]
- Iniguez-Luy, F.L.; Voort, A.V.; Osborn, T.C. Development of a set of public SSR markers derived from genomic sequence of a rapid cycling Brassica oleracea L. genotype. Theor. Appl. Genet. 2008, 117, 977–985. [Google Scholar] [CrossRef]
- Thiel, T.; Michalek, W.; Varshney, R.K.; Graner, A. Exploiting EST databases for the development and characterization of gene-derived SSR-markers in barley (Hordeum vulgare L.). Theor. Appl. Genet. 2003, 106, 411–422. [Google Scholar]
- Gupta, S.; Prasad, M. Development and characterization of genic SSR markers in Medicago truncatula and their transferability in leguminous and non-leguminous species. Genome 2009, 52, 761–771. [Google Scholar] [CrossRef]
- Zalapa, J.E.; Cuevas, H.; Zhu, H.; Steffan, S.; Senalik, D.; Zeldin, E.; Mccown, B.; Harbut, R.; Simon, P. Using next-generation sequencing approaches to isolate simple sequence repeat (SSR) loci in the plant sciences. Am. J. Bot. 2012, 99, 193–208. [Google Scholar] [CrossRef]
- Chung, J.W.; Kim, T.S.; Sundan, S.; Lee, G.A.; Park, J.H.; Cho, G.T.; Lee, H.S.; Lee, J.Y.; Lee, M.C.; Baek, H.J.; et al. New cDNA-SSR markers in the narrow-leaved vetch (Vicia sativa subsp. nigra) using 454 pyrosequencing. Mol. Breed. 2004, 33, 749–754. [Google Scholar]
- Li, D.J.; Deng, Z.; Qin, B.; Liu, X.H.; Men, Z.H. De novo assembly and characterization of bark transcriptome using Illumina sequencing and development of EST-SSR markers in rubber tree (Hevea brasiliensis Muell. Arg.). BMC Genomics 2012, 13, 192–206. [Google Scholar] [CrossRef]
- Liu, M.Y.; Qiao, G.R.; Jiang, J.; Yang, H.Q.; Xie, L.H.; Xie, J.Z.; Zhuo, R.Y. Transcriptome sequencing and de novo analysis for ma bamboo (Dendrocalamus latiflorus Munro) using the Illumina platform. PLoS One 2012, 7, e46766. [Google Scholar]
- Liu, Z.P.; Chen, T.L.; Ma, L.C.; Zhao, Z.G.; Zhao, P.; Nan, Z.B.; Wang, Y.R. Global transcriptome sequencing using the Illumina platform and the development of EST-SSR markers in autotetraploid alfalfa. PLoS One 2013, 8, e83549. [Google Scholar]
- Liu, Z.P.; Ma, L.C.; Nan, Z.B.; Wang, Y.R. Comparative transcriptional profiling provides insights into the evolution and development of the zygomorphic flower of Vicia sativa (Papilionoideae). PLoS One 2013, 8, e57338. [Google Scholar]
- Suresh, S.; Park, J.H.; Cho, G.T.; Lee, H.S.; Baek, H.J.; Lee, S.Y.; Chung, J.W. Development and molecular characterization of 55 novel polymorphic cDNA-SSR markers in faba bean (Vicia faba L.) using 454 pyrosequencing. Molecules 2013, 18, 1844–1856. [Google Scholar]
- Wang, Z.Y.; Fang, B.P.; Chen, J.Y.; Zhang, X.J.; Luo, Z.X.; Huang, L.F.; Chen, X.L.; Li, Y.J. De novo assembly and characterization of root transcriptome using Illumina paired-end sequencing and development of cSSR markers in sweetpotato (Ipomoea batatas). BMC Genomics 2010, 11, 726–740. [Google Scholar]
- Wei, W.L.; Qi, X.Q.; Wang, L.H.; Zhang, Y.X.; Hua, W.; Li, D.H.; Lv, H.X.; Zhang, X.R. Characterization of the sesame (Sesamum indicum L.) global transcriptome using Illumina paired-end sequencing and development of EST-SSR markers. BMC Genomics 2011, 12, 451–464. [Google Scholar]
- Koilkonda, P.; Sato, S.; Tabata, S.; Shirasawa, K.; Hirakawa, H.; Sakai, H.; Sasamoto, S.; Watanabe, A.; Wada, T.; Kishida, Y.; et al. Large-scale development of expressed sequence tag-derived simple sequence repeat markers and diversity analysis in Arachis spp. Mol. Breed. 2012, 30, 125–138. [Google Scholar] [CrossRef]
- Li, Y.C.; Korol, A.B.; Fahima, T.; Nevo, E. Microsatellites within genes: Structure, function, and evolution. Mol. Biol. Evol. 2004, 21, 991–1007. [Google Scholar] [CrossRef]
- Metzgar, D.; Bytof, J.; Wills, C. Selection against frameshift mutations limits microsatellite expansion in coding DNA. Genome Res. 2000, 10, 72–80. [Google Scholar]
- Doyle, J.J.; Doyle, J.L. A rapid DNA isolation procedure for small quantities of fresh leaf tissue. Phytochem. Bull. 1987, 19, 11–15. [Google Scholar]
- Nei, M. Estimation of average heterozygosity and genetic distance from a small number of individuals. Genetics 1978, 89, 583–590. [Google Scholar]
- Sample Availability: Samples of the 10 V. sativa subsp. sativa accessions are available from the authors.
© 2014 by the authors. Licensee MDPI, Basel, Switzerland. This article is an open access article distributed under the terms and conditions of the Creative Commons Attribution license ( http://creativecommons.org/licenses/by/3.0/).
Share and Cite
Liu, Z.; Liu, P.; Luo, D.; Liu, W.; Wang, Y. Exploiting Illumina Sequencing for the Development of 95 Novel Polymorphic EST-SSR Markers in Common Vetch (Vicia sativa subsp. sativa). Molecules 2014, 19, 5777-5789. https://doi.org/10.3390/molecules19055777
Liu Z, Liu P, Luo D, Liu W, Wang Y. Exploiting Illumina Sequencing for the Development of 95 Novel Polymorphic EST-SSR Markers in Common Vetch (Vicia sativa subsp. sativa). Molecules. 2014; 19(5):5777-5789. https://doi.org/10.3390/molecules19055777
Chicago/Turabian StyleLiu, Zhipeng, Peng Liu, Dong Luo, Wenxian Liu, and Yanrong Wang. 2014. "Exploiting Illumina Sequencing for the Development of 95 Novel Polymorphic EST-SSR Markers in Common Vetch (Vicia sativa subsp. sativa)" Molecules 19, no. 5: 5777-5789. https://doi.org/10.3390/molecules19055777