Chemically Synthesized Glycosides of Hydroxylated Flavylium Ions as Suitable Models of Anthocyanins: Binding to Iron Ions and Human Serum Albumin, Antioxidant Activity in Model Gastric Conditions

Abstract
:
1. Introduction

2. Results and Discussion
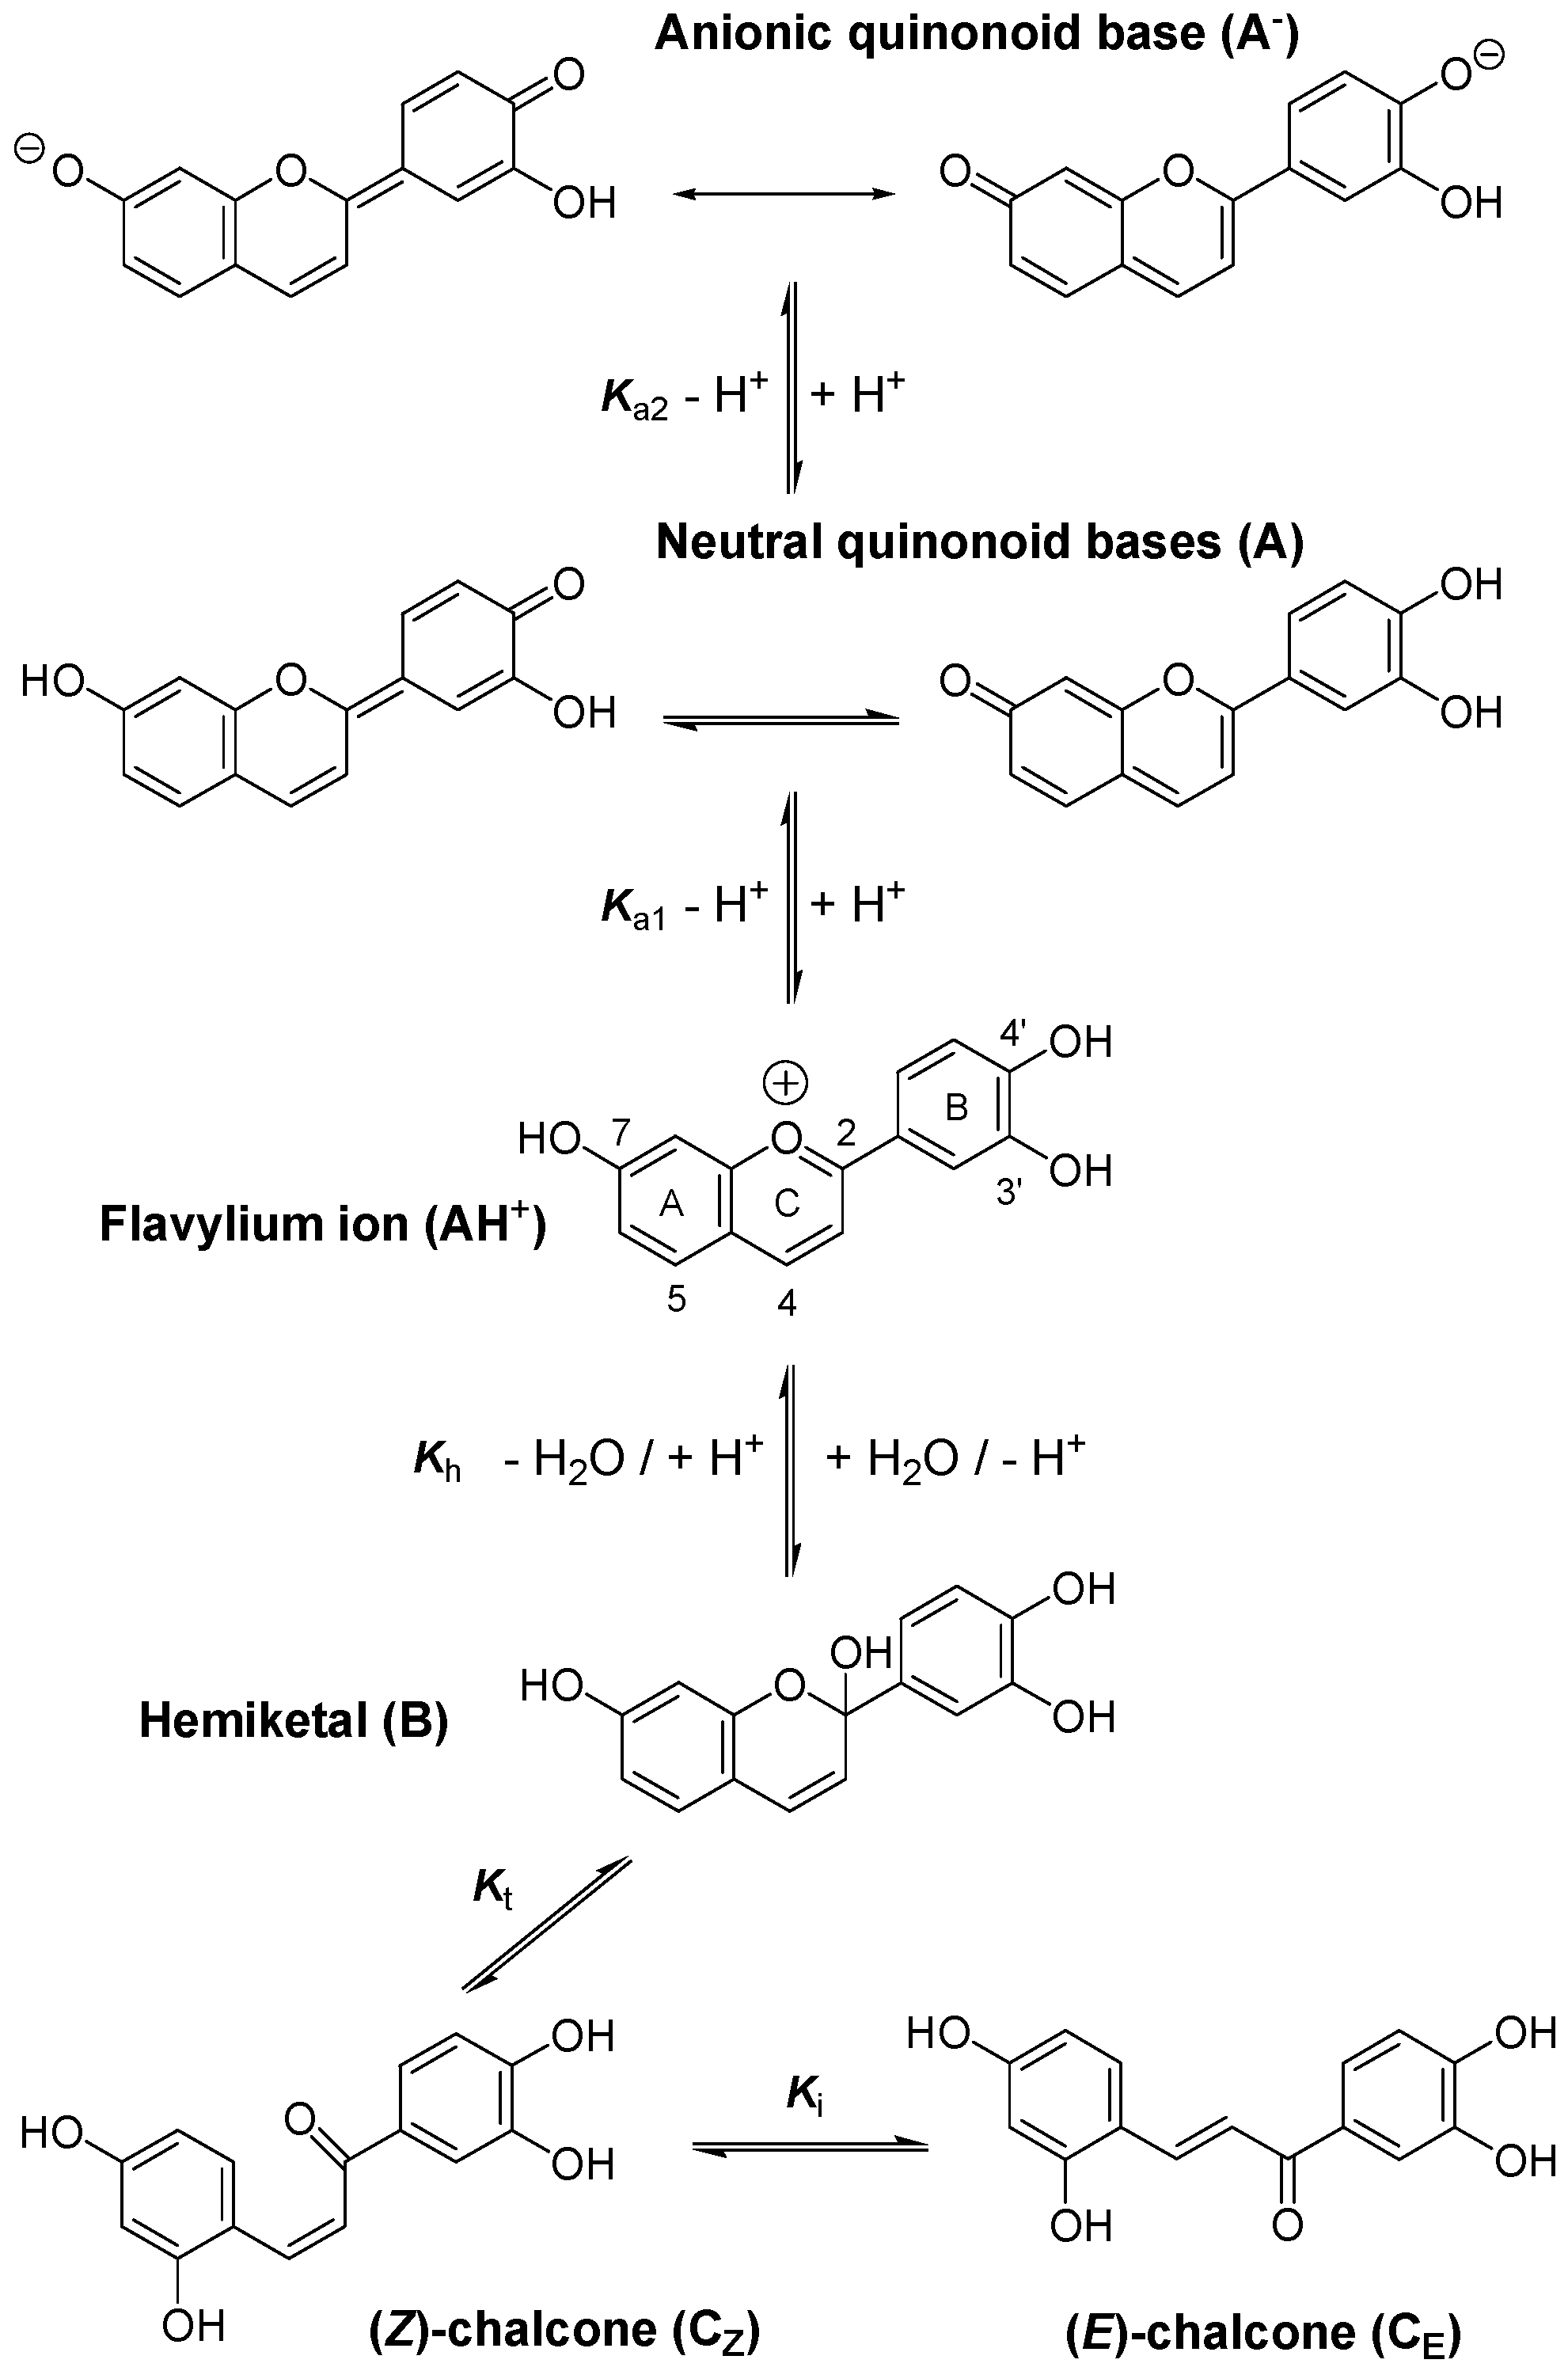
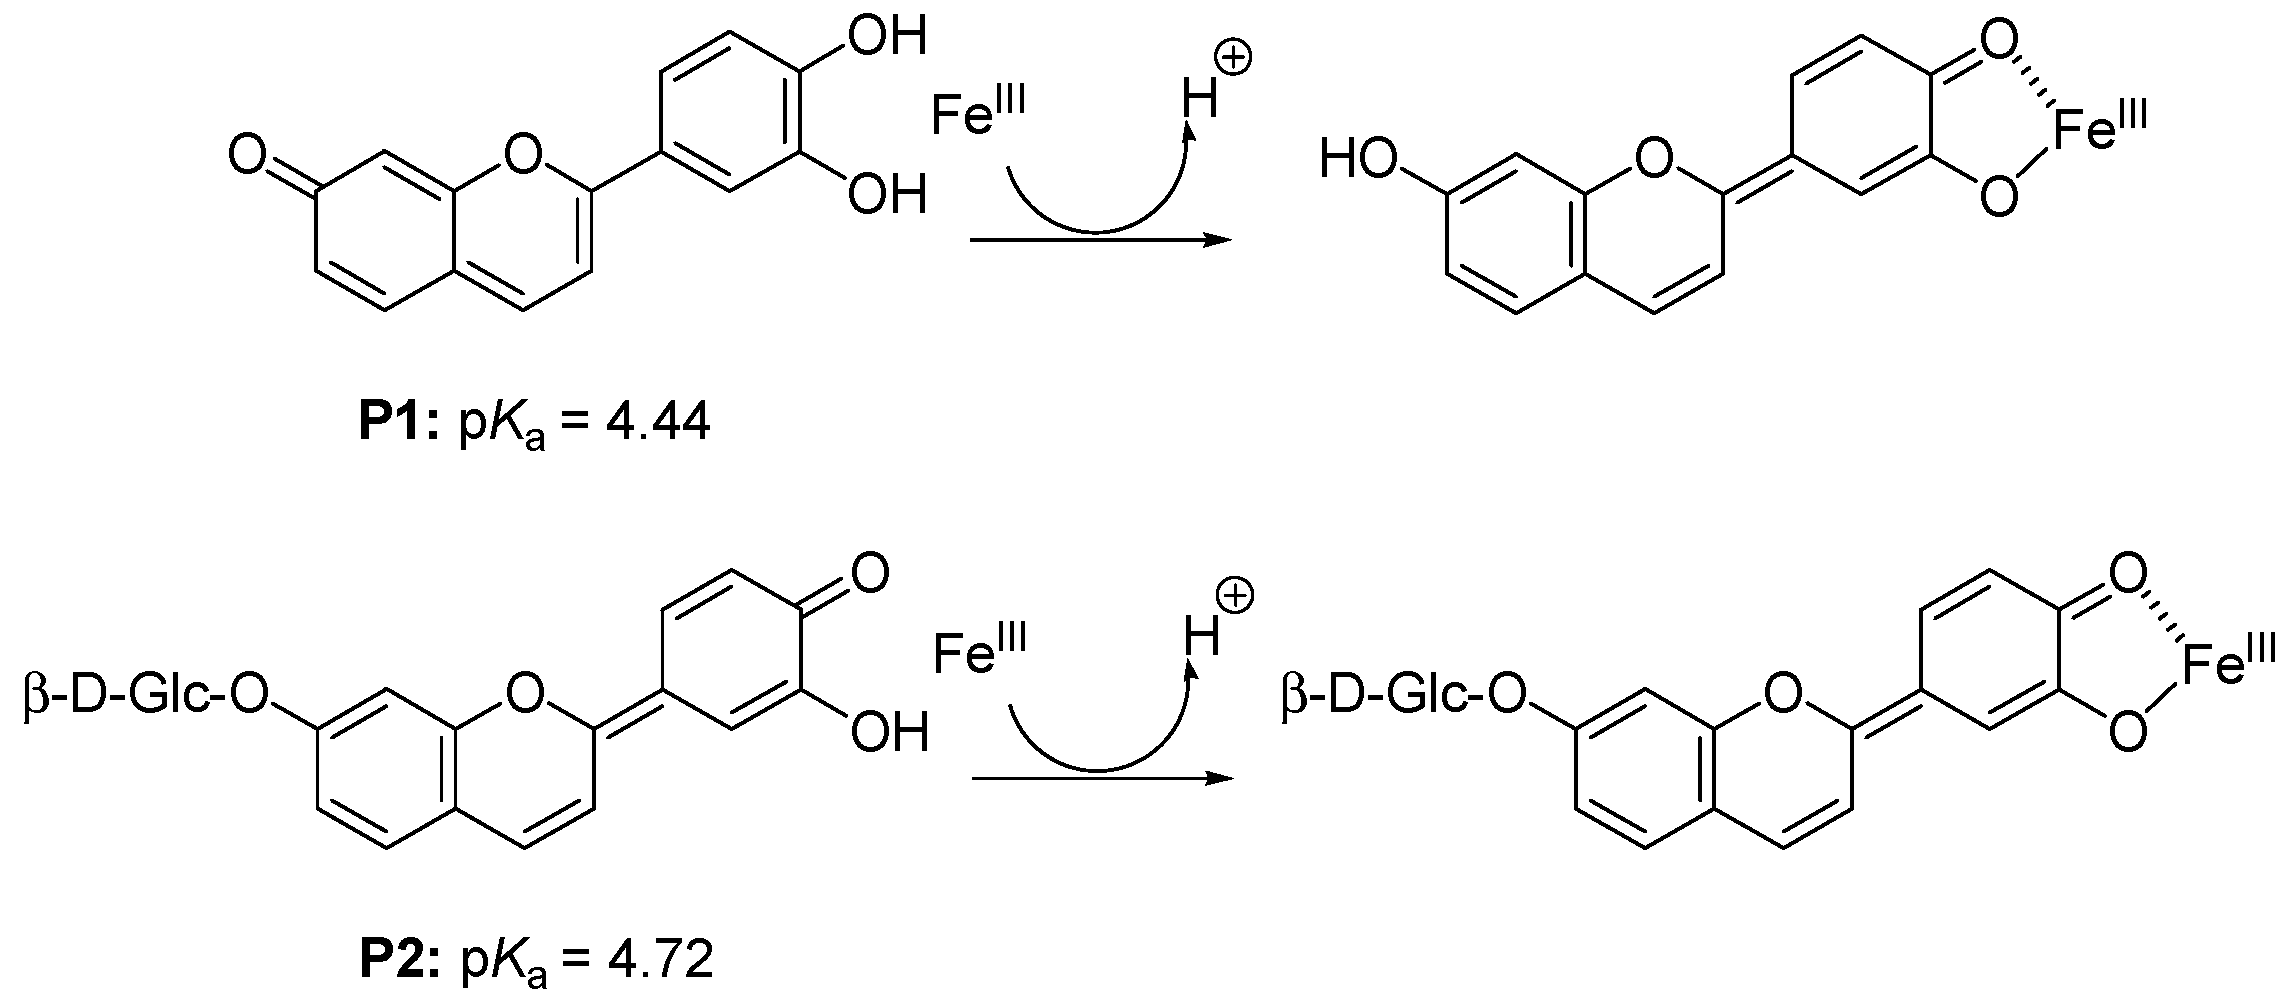
2.1. Iron-Pigment Binding
2.1.1. Pigment P1
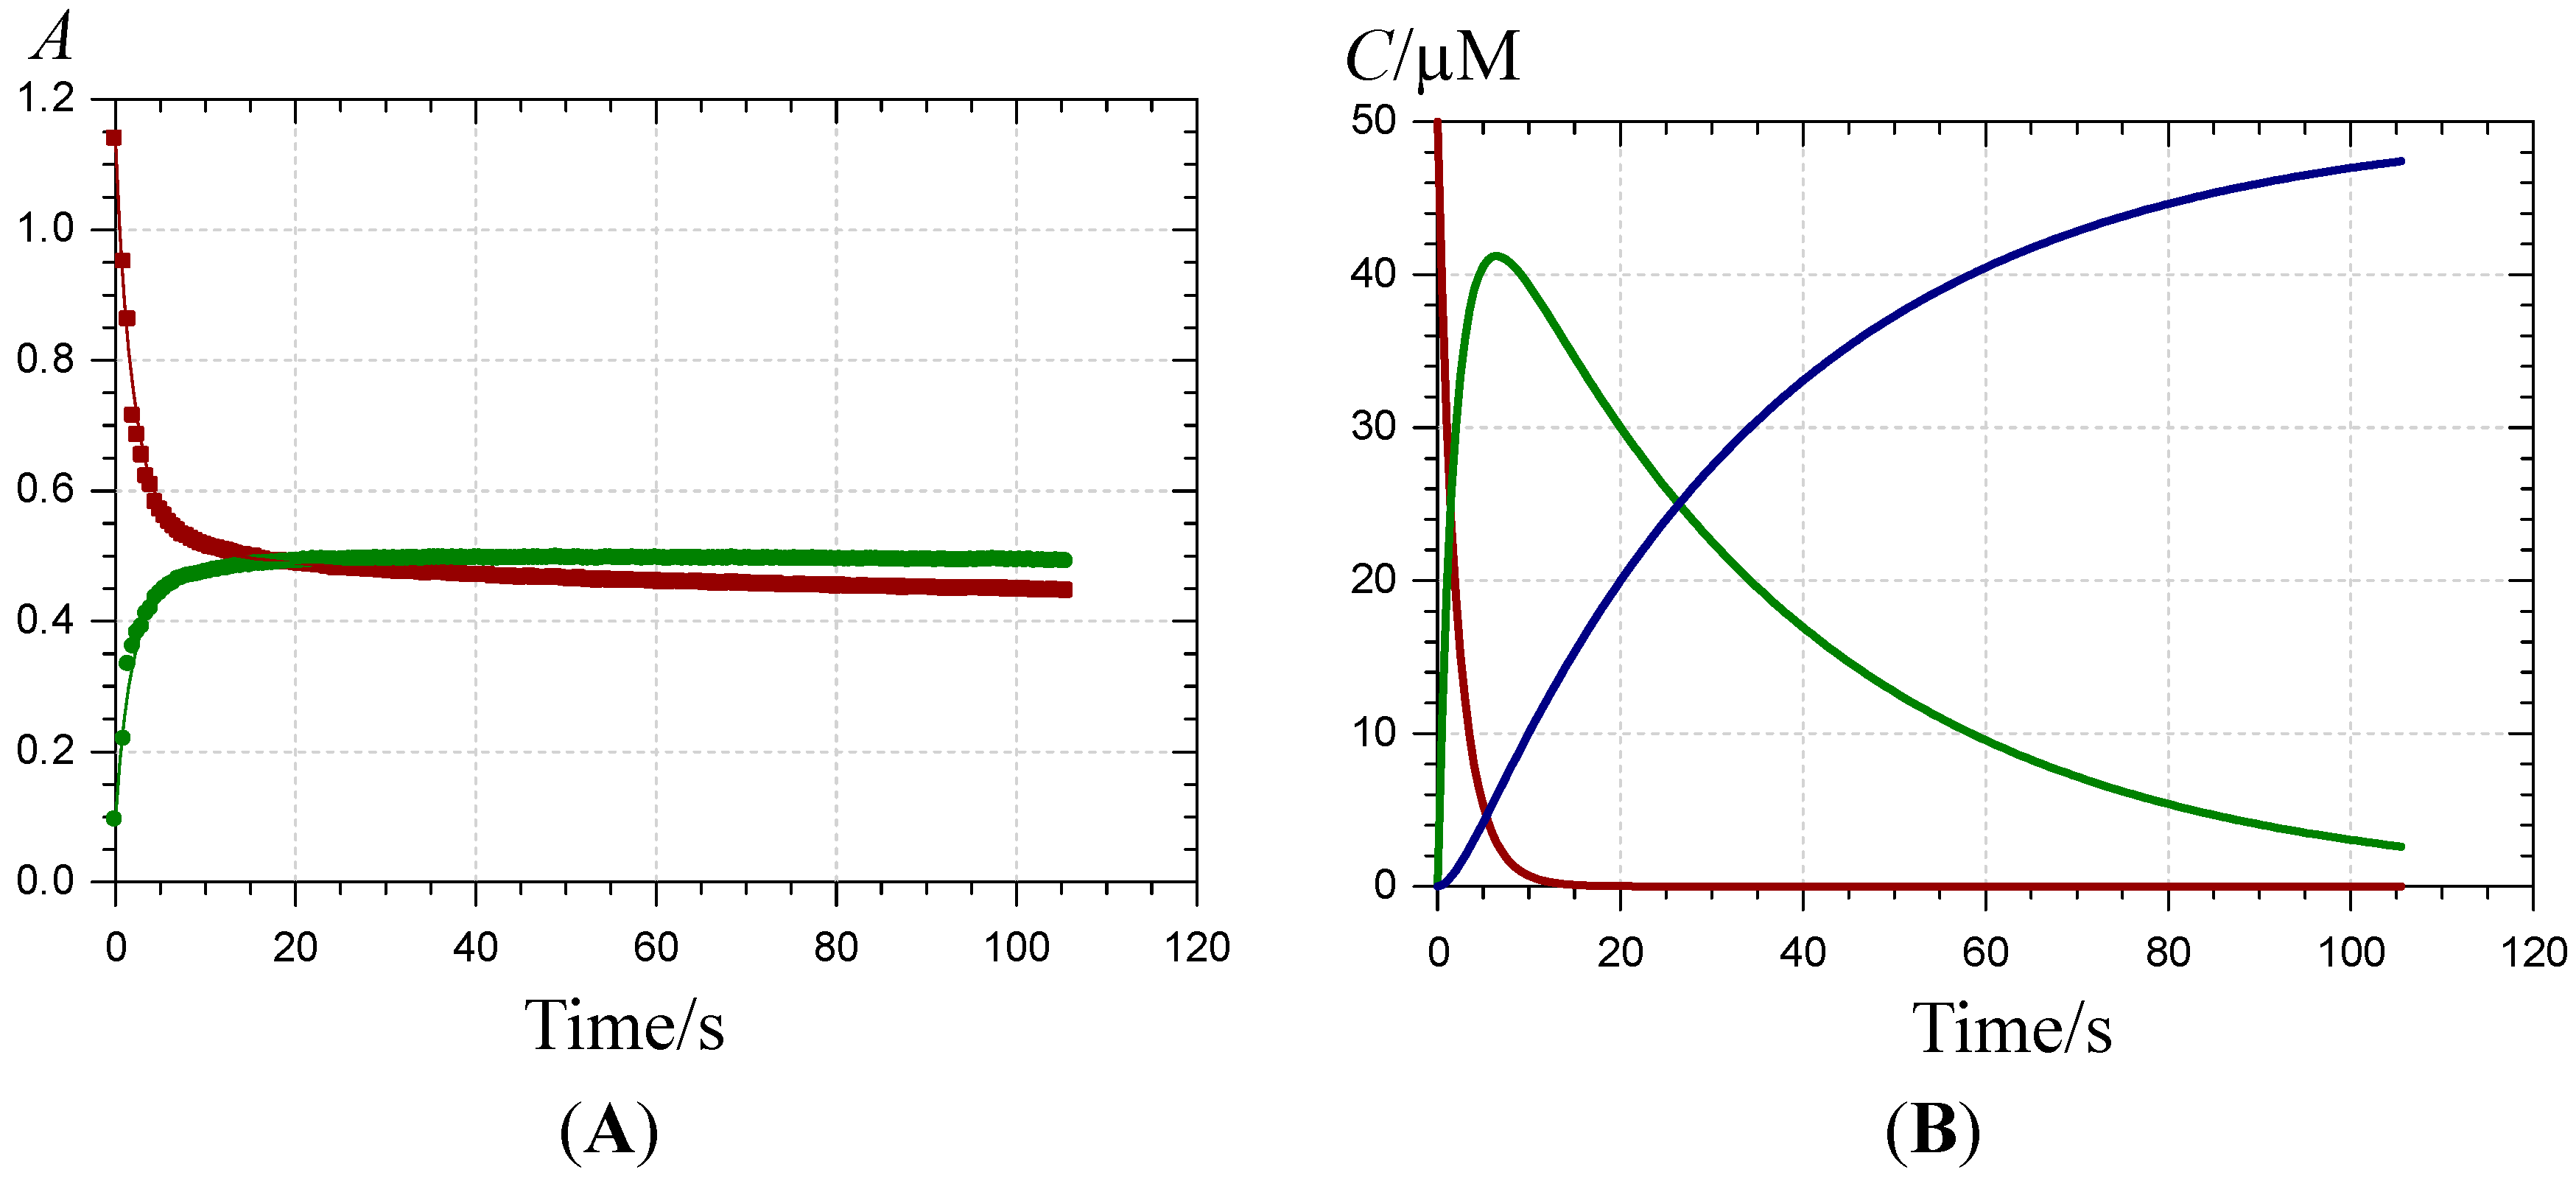
 ) and 620 nm (
  ); (B) time-dependence of the free pigment (
  ) and the kinetic (
  ) and thermodynamic (
  ) complexes.
) and 620 nm ( ); (B) time-dependence of the free pigment ( ) and the kinetic ( ) and thermodynamic ( ) complexes.
) complexes.
) and 620 nm ( ); (B) time-dependence of the free pigment ( ) and the kinetic ( ) and thermodynamic ( ) complexes. ), the P1-FeIII complex ( , ca. 30 s after addition of 2 equiv. FeIII) and the complex formed ca. 400 s after addition of 5 equiv. FeII ( ) (pH 4 acetate buffer, 25 °C, pigment concentration = 50 µM).
), the P1-FeIII complex ( , ca. 30 s after addition of 2 equiv. FeIII) and the complex formed ca. 400 s after addition of 5 equiv. FeII ( ) (pH 4 acetate buffer, 25 °C, pigment concentration = 50 µM).
), the P1-FeIII complex ( , ca. 30 s after addition of 2 equiv. FeIII) and the complex formed ca. 400 s after addition of 5 equiv. FeII ( ) (pH 4 acetate buffer, 25 °C, pigment concentration = 50 µM).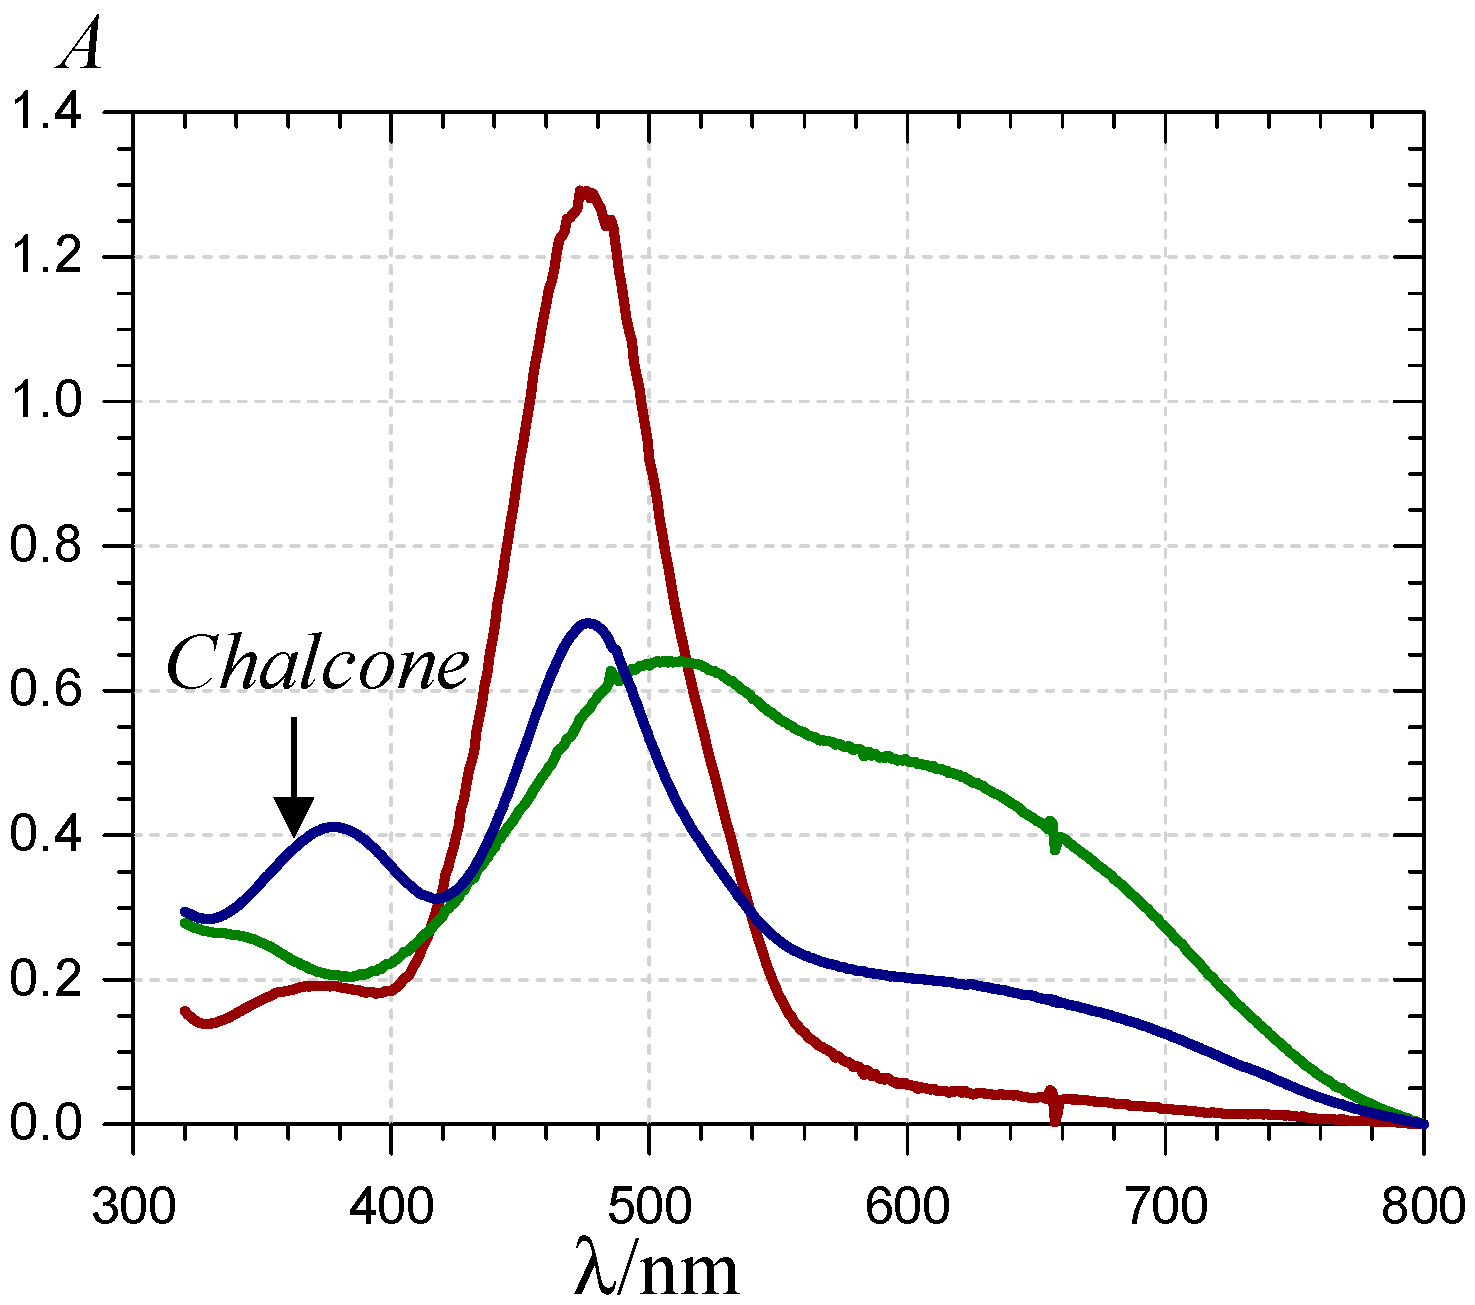

| Mt/Lt, λ/nm | kb/M−1·s−1 | 103kr/s−1 | ɛ1/M−1·cm−1 | ɛ2/M−1·cm−1 |
|---|---|---|---|---|
| 1, 470 | 17,890 (±180) | 4 (±2) | 10,340 | 7910 |
| 620 | 12,270 | 10,810 | ||
| 2, 470 | 7190 (±250) | 44 (±4) | 13,190 | 10,320 |
| 620 | 12,180 | 12,780 | ||
| 3, 470 | 4450 (±60) | 16 (±3) | 12,010 | 10,300 |
| 620 | 13,160 | 13,060 | ||
| 4, 470 | 2670 (±30) | 29 (±2) | 10,360 | 8900 |
| 620 | 9710 | 9930 | ||
| 5, 470 | 3370 (±50) | 59 (±2) | 12,830 | 10,300 |
| 620 | 10,680 | 11,580 | ||
| 5, 470 a | 250 (±30) | - | 10,700 | - |
| 630 | 11,800 | |||
| 375 | 4200 |
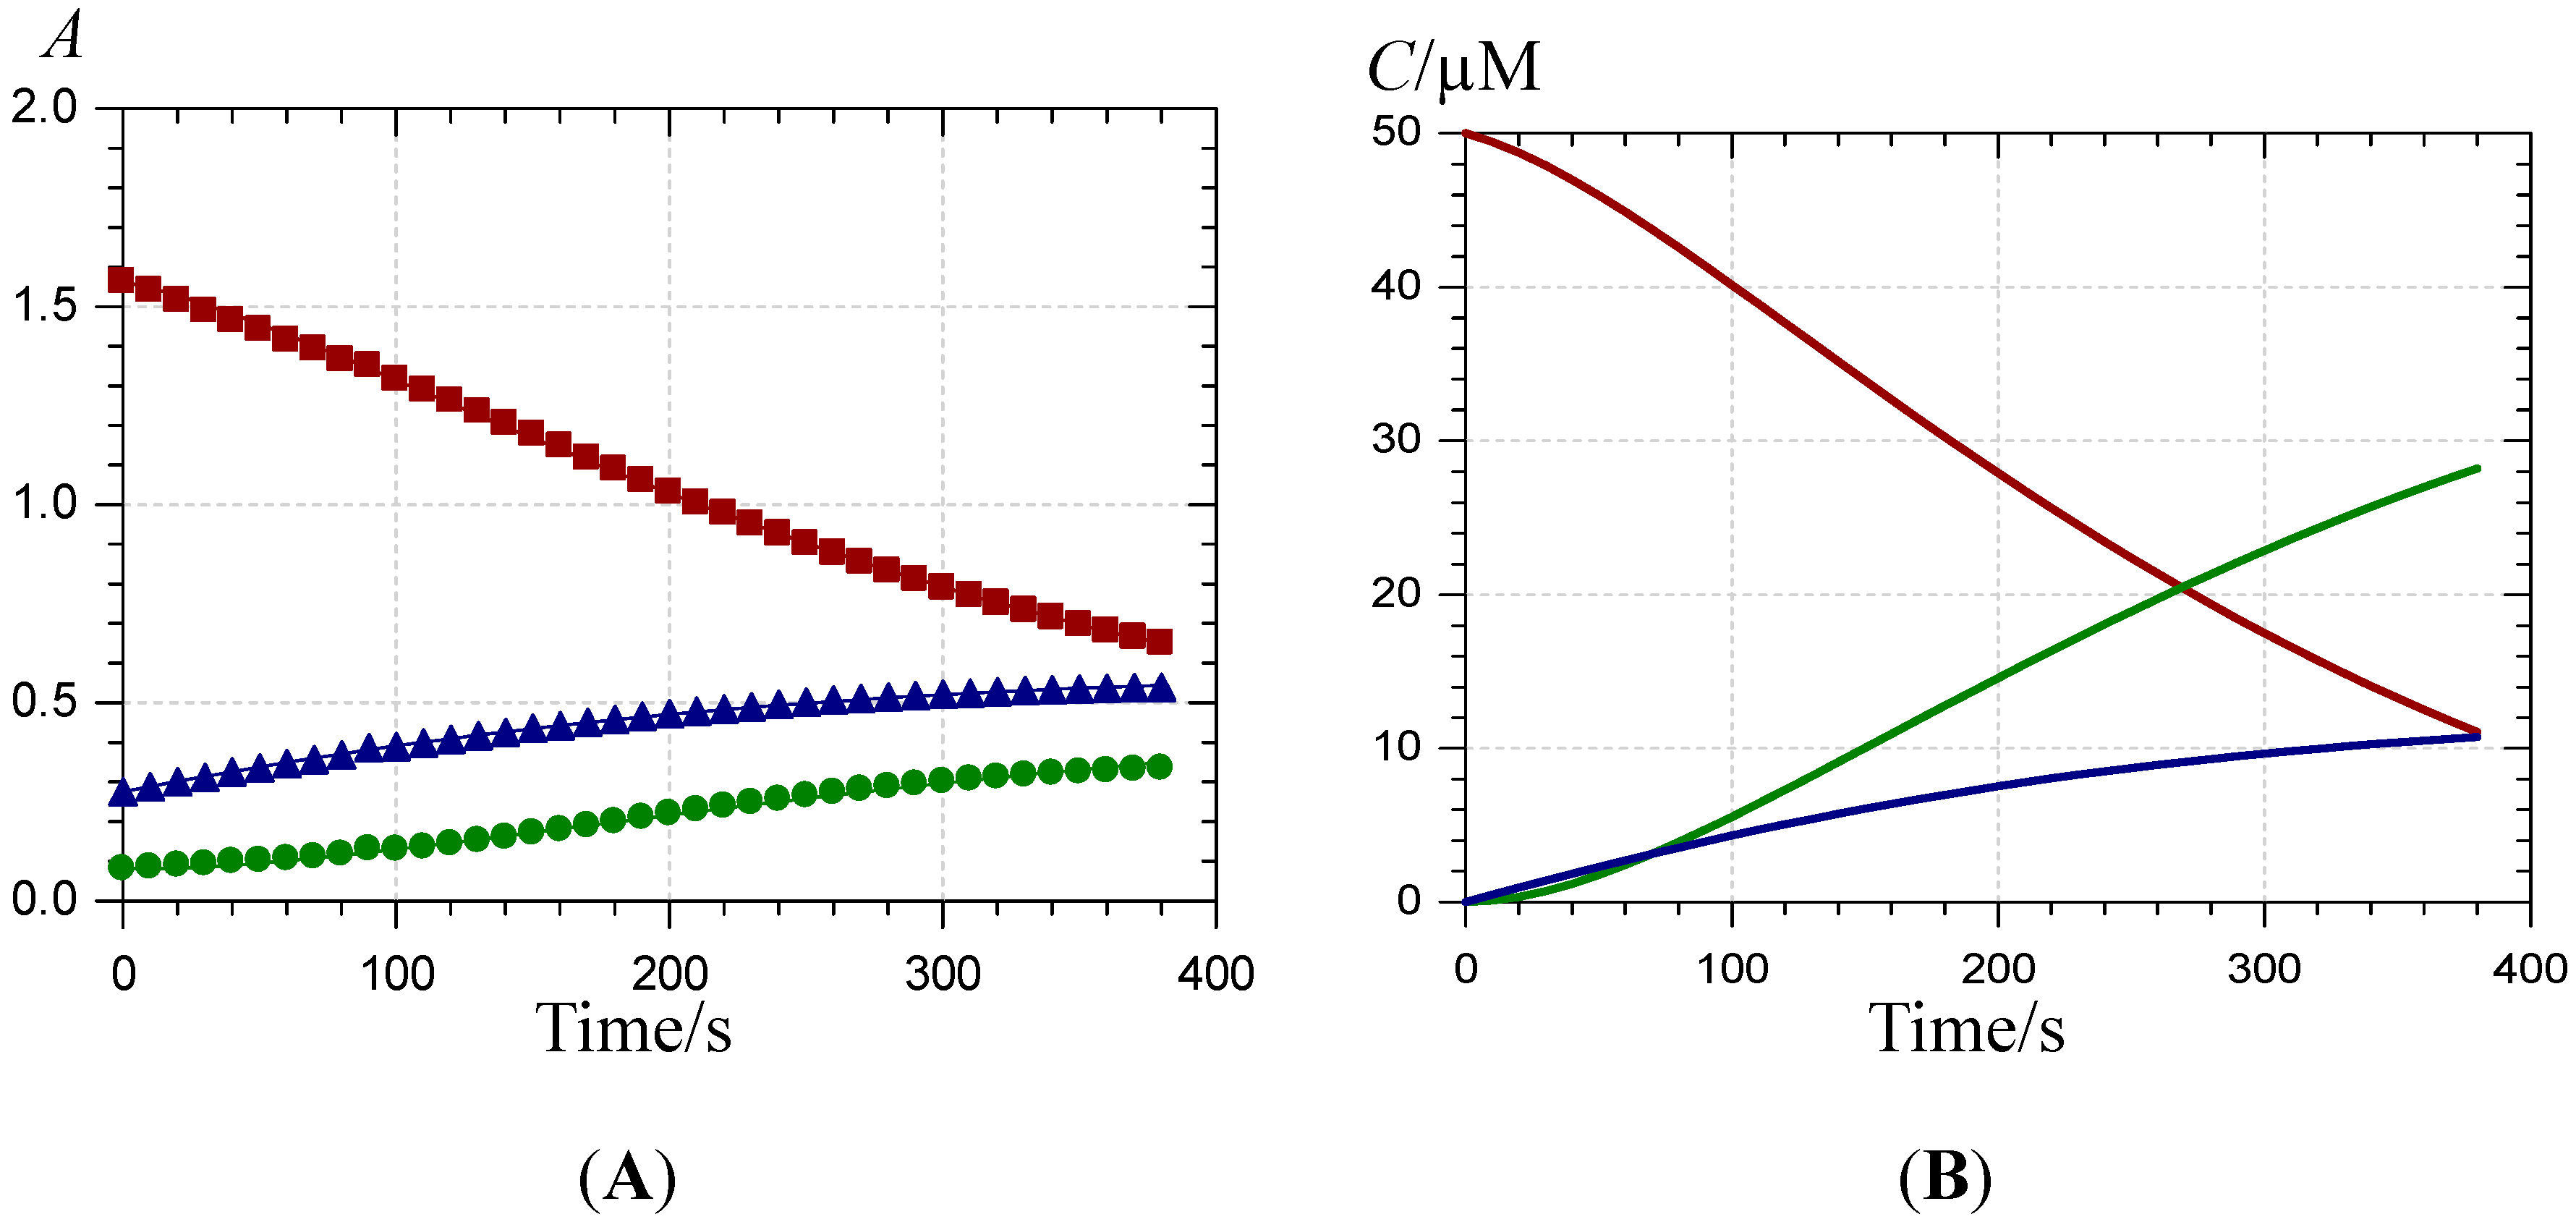
), 620 ( ) and 375 nm (  ); (B) time-dependence of the free pigment ( ), the metal complex ( ) and the free chalcone ( ).
), 620 ( ) and 375 nm ( ); (B) time-dependence of the free pigment ( ), the metal complex ( ) and the free chalcone ( ).
); (B) time-dependence of the free pigment ( ), the metal complex ( ) and the free chalcone ( ).
), 620 ( ) and 375 nm ( ); (B) time-dependence of the free pigment ( ), the metal complex ( ) and the free chalcone ( ).
2.1.2. Pigment P2
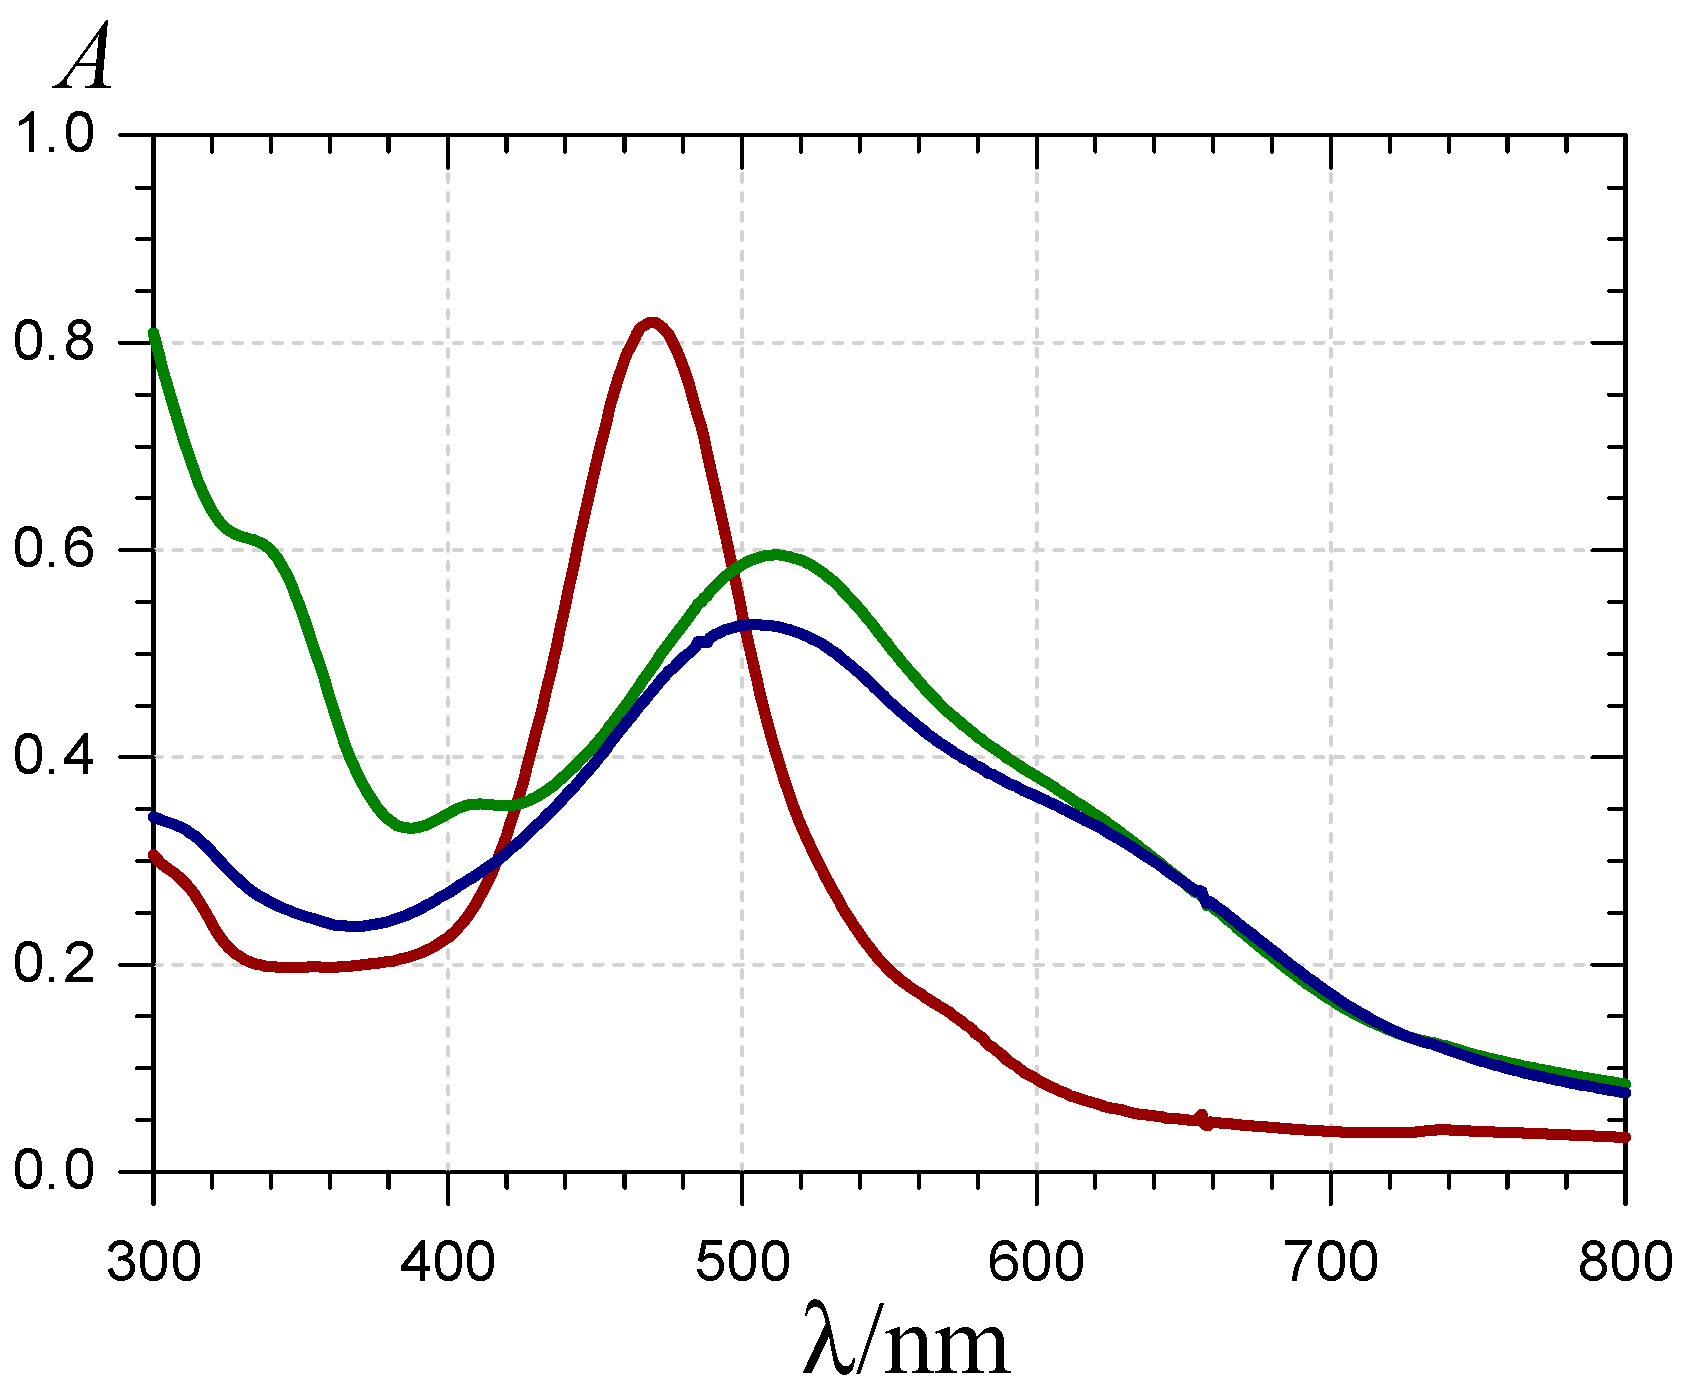
), the P2-FeIII complex ( , ca. 10 s after FeIII addition) and the complex formed ca. 10 min after addition of FeII ( ) (pH 4 acetate buffer, 25 °C, pigment concentration = 50 µM, iron-P2 molar ratio = 5).
), the P2-FeIII complex ( , ca. 10 s after FeIII addition) and the complex formed ca. 10 min after addition of FeII ( ) (pH 4 acetate buffer, 25 °C, pigment concentration = 50 µM, iron-P2 molar ratio = 5).
| Mt/Lt, λ/nm a | 105kautox/s−1 | kb/M−1·s−1 | ɛML/M−1·cm−1 |
|---|---|---|---|
| 0.5, 470 (r = 0.9978) | 215 (±2) | n.d. b | 8800 c |
| 650 (r = 0.9975) | 13.7 (±0.2) d | 7200 c | |
| 1, 470 (r = 0.9985) | 169 (±1) | n.d. b | 8800 c |
| 650 (r = 0.9985) | 13.3 (±0.4) d | 7200 c | |
| 2, 470 (r = 0.9992) | 181 (±5) | 473 (±34) | 8870 |
| 650 (r = 0.9993) | 7320 | ||
| 3, 470 (r = 0.9998) | 154 (±2) | 663 (±29) | 8850 |
| 650 (r = 0.9996) | 7110 | ||
| 4, 470 (r = 0.9998) | 141 (±2) | 593 (±23) | 8670 |
| 650 (r = 0.9999) | 7070 | ||
| 5, 470 (r = 0.9988) | 163 (±7) | 785 (±75) | 8810 |
| 650 (r = 0.9994) | 7340 |
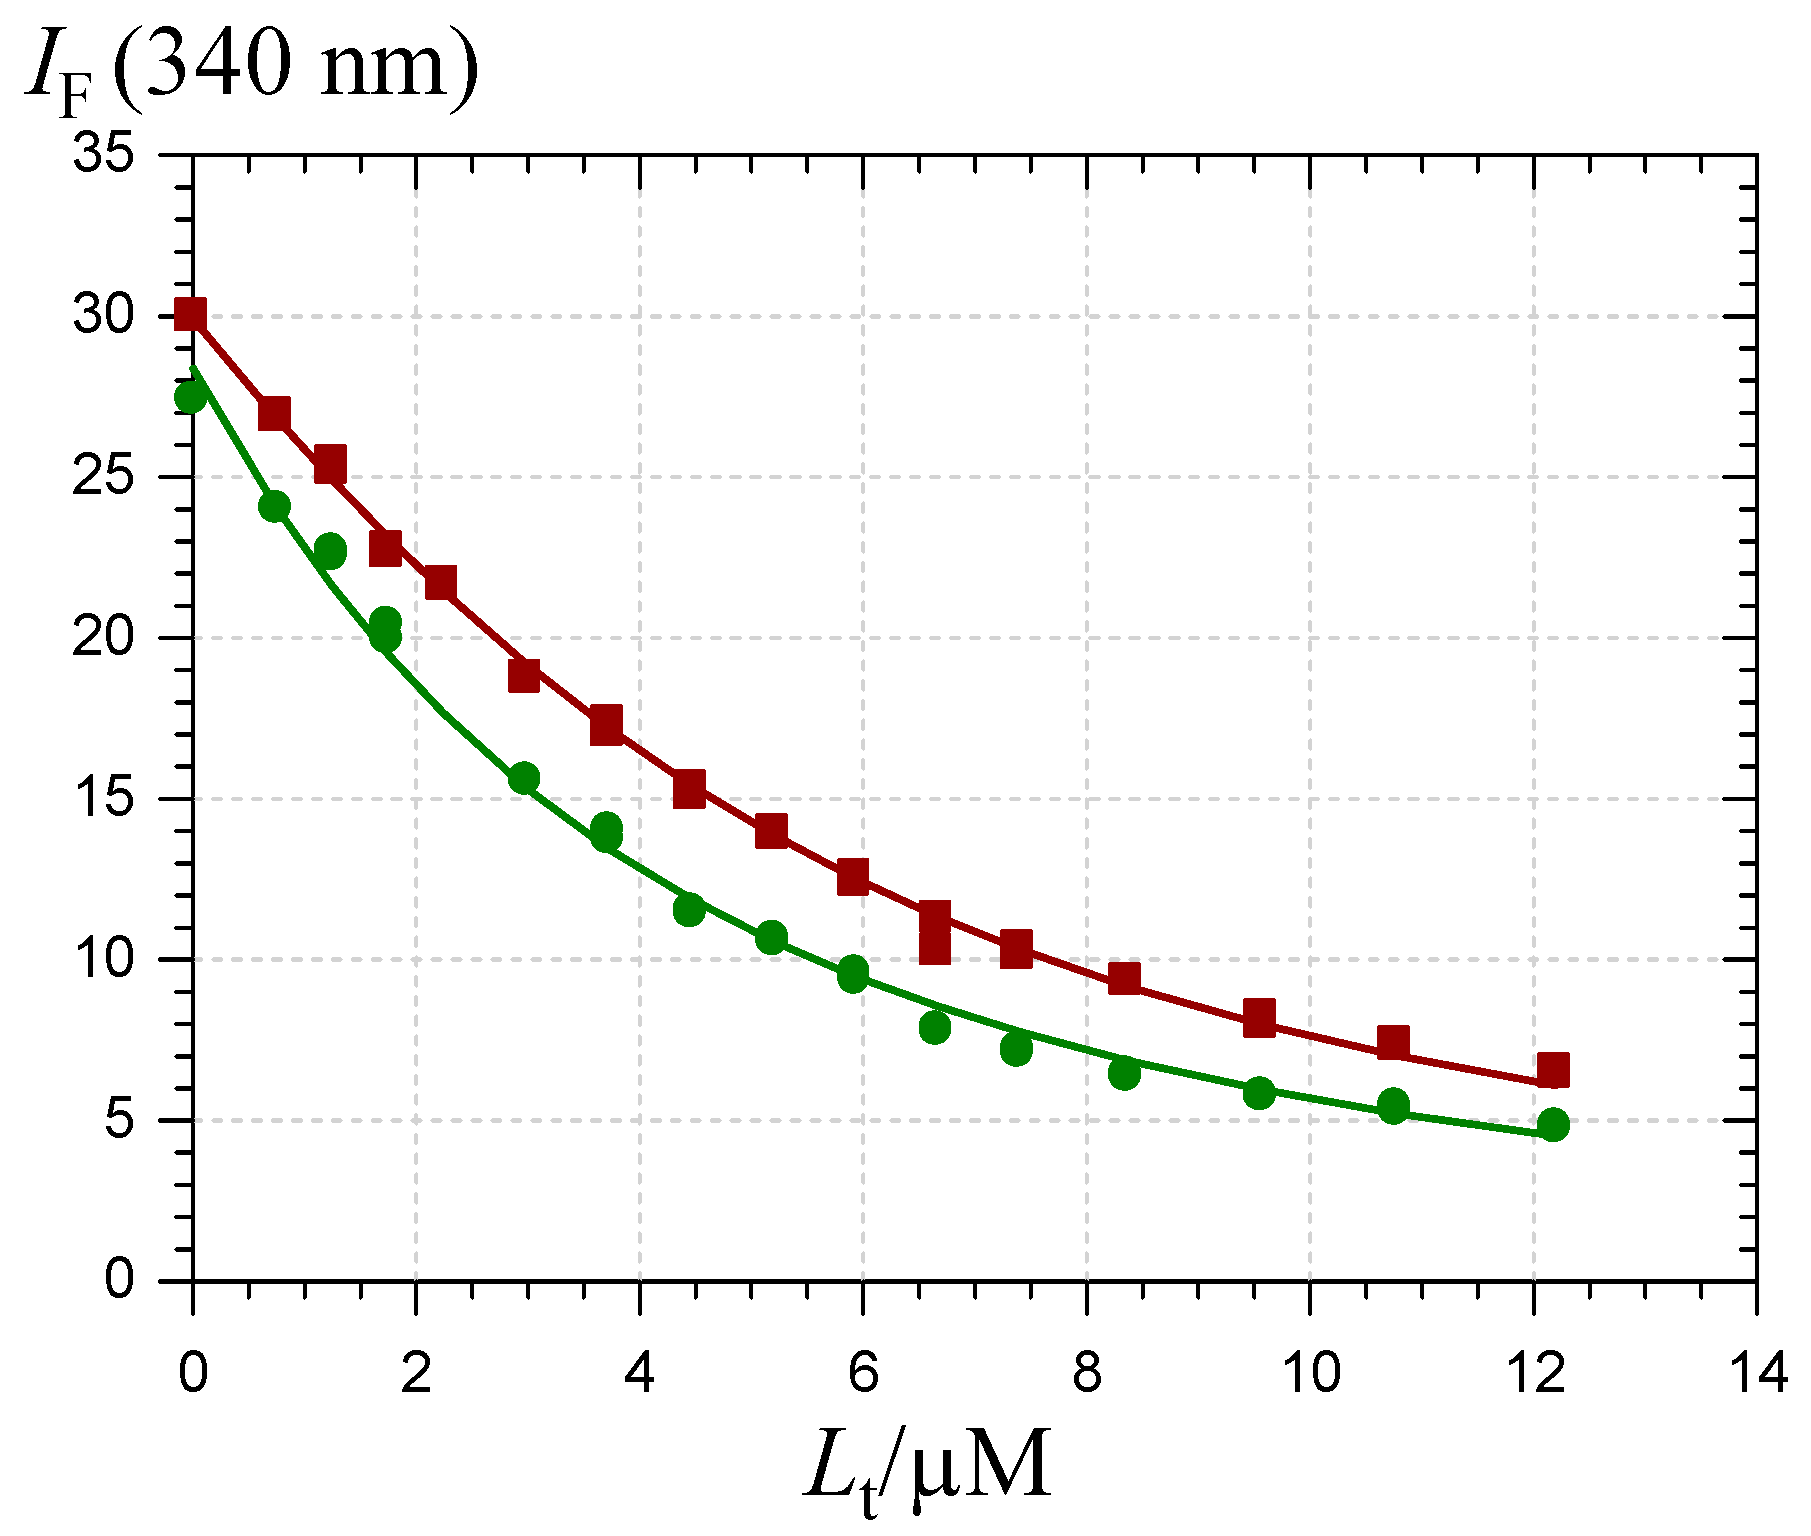
2.2. Pigment-Serum Albumin Binding
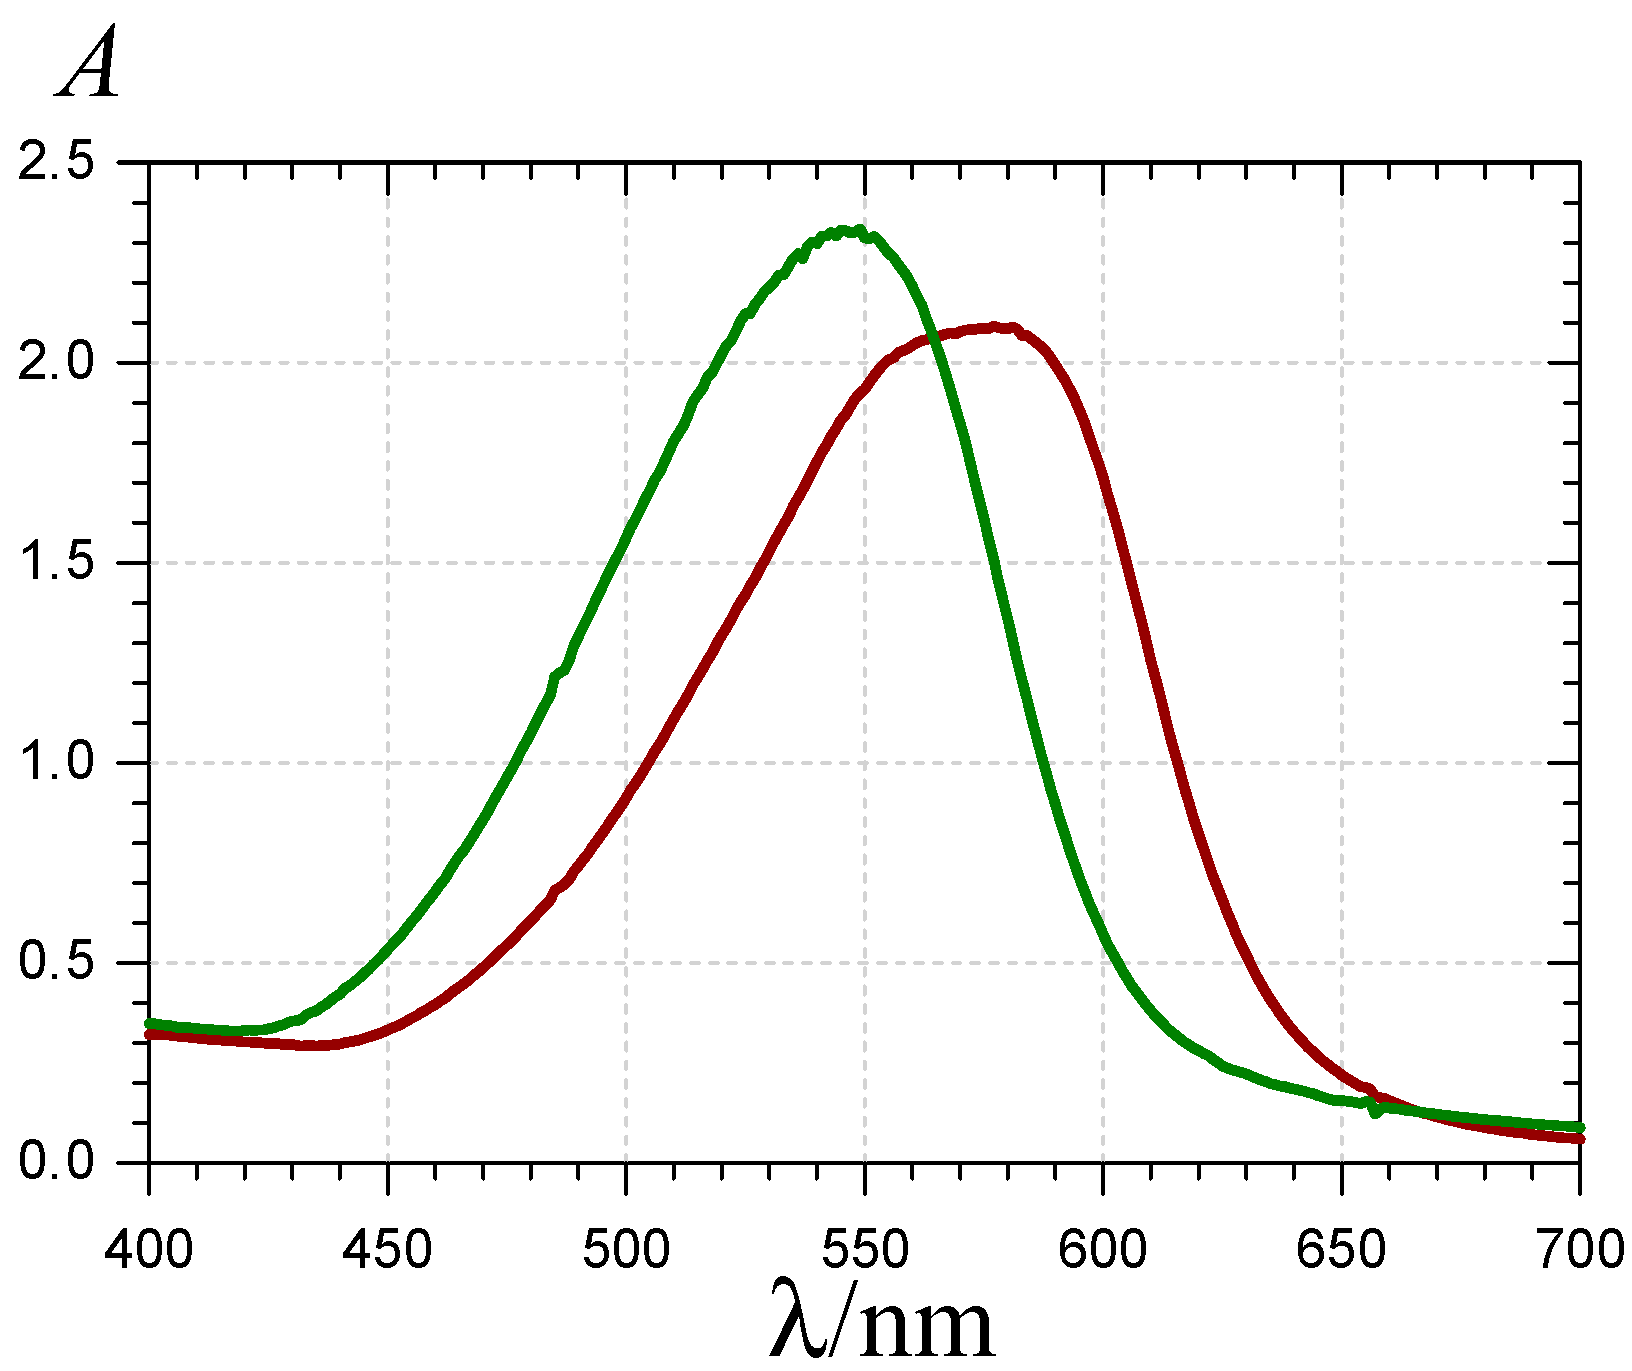
) and the P1-HSA complex ( ) (pH 7.4 phosphate buffer, 25 °C, pigment concentration = 50 µM, HSA-P1 molar ratio = 2).
) and the P1-HSA complex ( ) (pH 7.4 phosphate buffer, 25 °C, pigment concentration = 50 µM, HSA-P1 molar ratio = 2).
| P1 | P2 | |
|---|---|---|
| pKa2, ra (550 nm), no HSA | 7.12 (±0.05), 6.3 (±0.6) a | n.a. b |
| pKa2, rA (580 nm), 5 equiv. HSA | 7.11 (±0.04), 3.1 (±0.1) a | n.a. b |
| khobs (s−1), 530 nm, no HSA | n.a., too slow ca. −10% color loss after 45 min | 88 (±1) × 10−5 c |
| khobs (s−1), 530 nm, 2 equiv. HSA | n.a., too slow ca. −10% color loss after 45 min | 81 (±1) × 10−5 c |
) and chalcone ( ). HSA concentration = 2 µM, pH 7.4 phosphate buffer, 37 °C, excitation at 295 nm.
) and chalcone ( ). HSA concentration = 2 µM, pH 7.4 phosphate buffer, 37 °C, excitation at 295 nm.
- (1)
- The Glc moiety strongly destabilizes the complexes, especially for the colored forms (Kb value reduced by a factor 15–16).
- (2)
- The chalcones, with their open more linear structure, display a higher affinity for HSA (Kb raised by a factor ca. 3 for P2) than the corresponding colored forms, although this increase is marginal with P1 in agreement with the investigation by UV-visible spectroscopy. This suggests that the very low circulating concentration of anthocyanins (in comparison to other flavonoids) [10,15] could be partly due to their conversion in colorless forms that may have escaped detection.
| 103Kb/M−1 | 106fP/M−1 | εL/M−1 cm−1 a | r | |
|---|---|---|---|---|
| P1 colored forms | 273 (±7) | 15.5 (±0.1) | 8900 + 5800 | 0.998 |
| P1 chalcone | 344 (±12) b | 14.2 (±0.1) | 15,800 + 16,400 b | 0.997 |
| P2 colored forms | 17.5 (±0.5) | 14.1 (±0.1) | 3800 + 2800 | 0.999 |
| P2 chalcone | 58.4 (±1.9) | 13.5 (±0.1) | 7200 + 7000 | 0.998 |
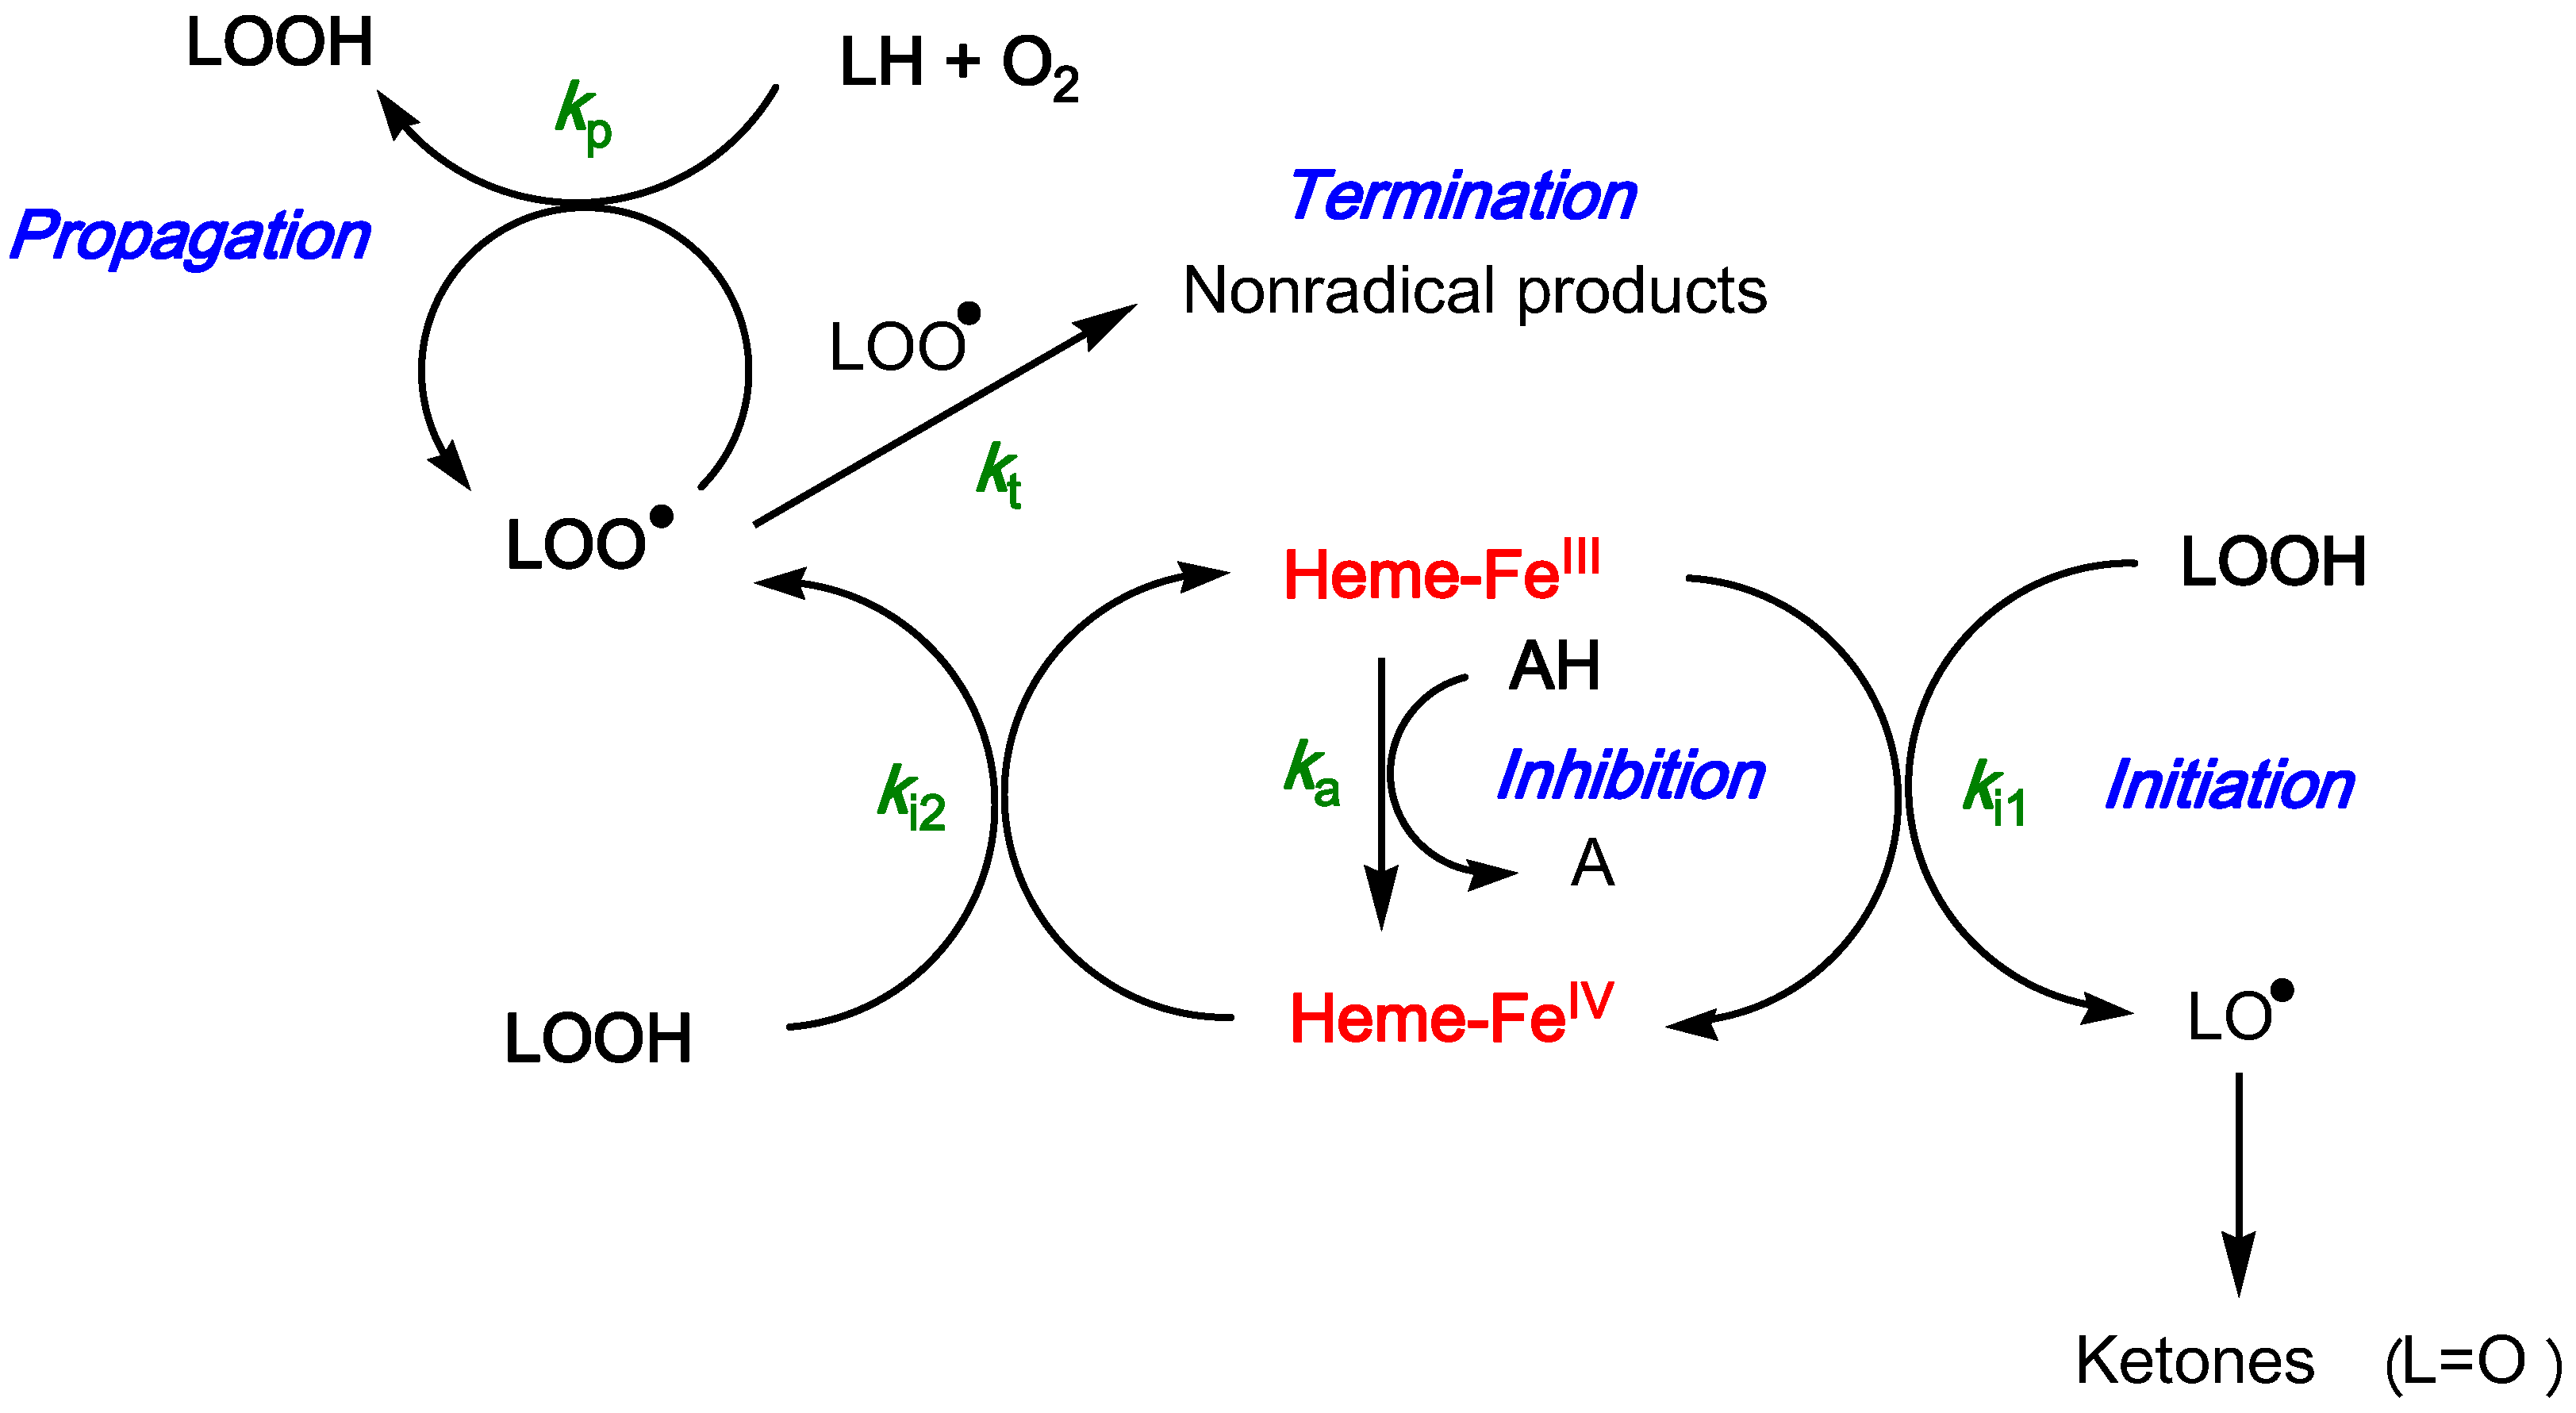
2.3. Inhibition of the Heme-Induced Peroxidation of Linoleic Acid
: P1 colored forms,  : P2 colored forms,
  : P1 chalcone, : P2 chalcone (pH 5.8 phosphate buffer + Brij®35, 37 °C).
: P1 colored forms, : P2 colored forms, : P1 chalcone, : P2 chalcone (pH 5.8 phosphate buffer + Brij®35, 37 °C).
: P1 chalcone, : P2 chalcone (pH 5.8 phosphate buffer + Brij®35, 37 °C).
: P1 colored forms, : P2 colored forms, : P1 chalcone, : P2 chalcone (pH 5.8 phosphate buffer + Brij®35, 37 °C).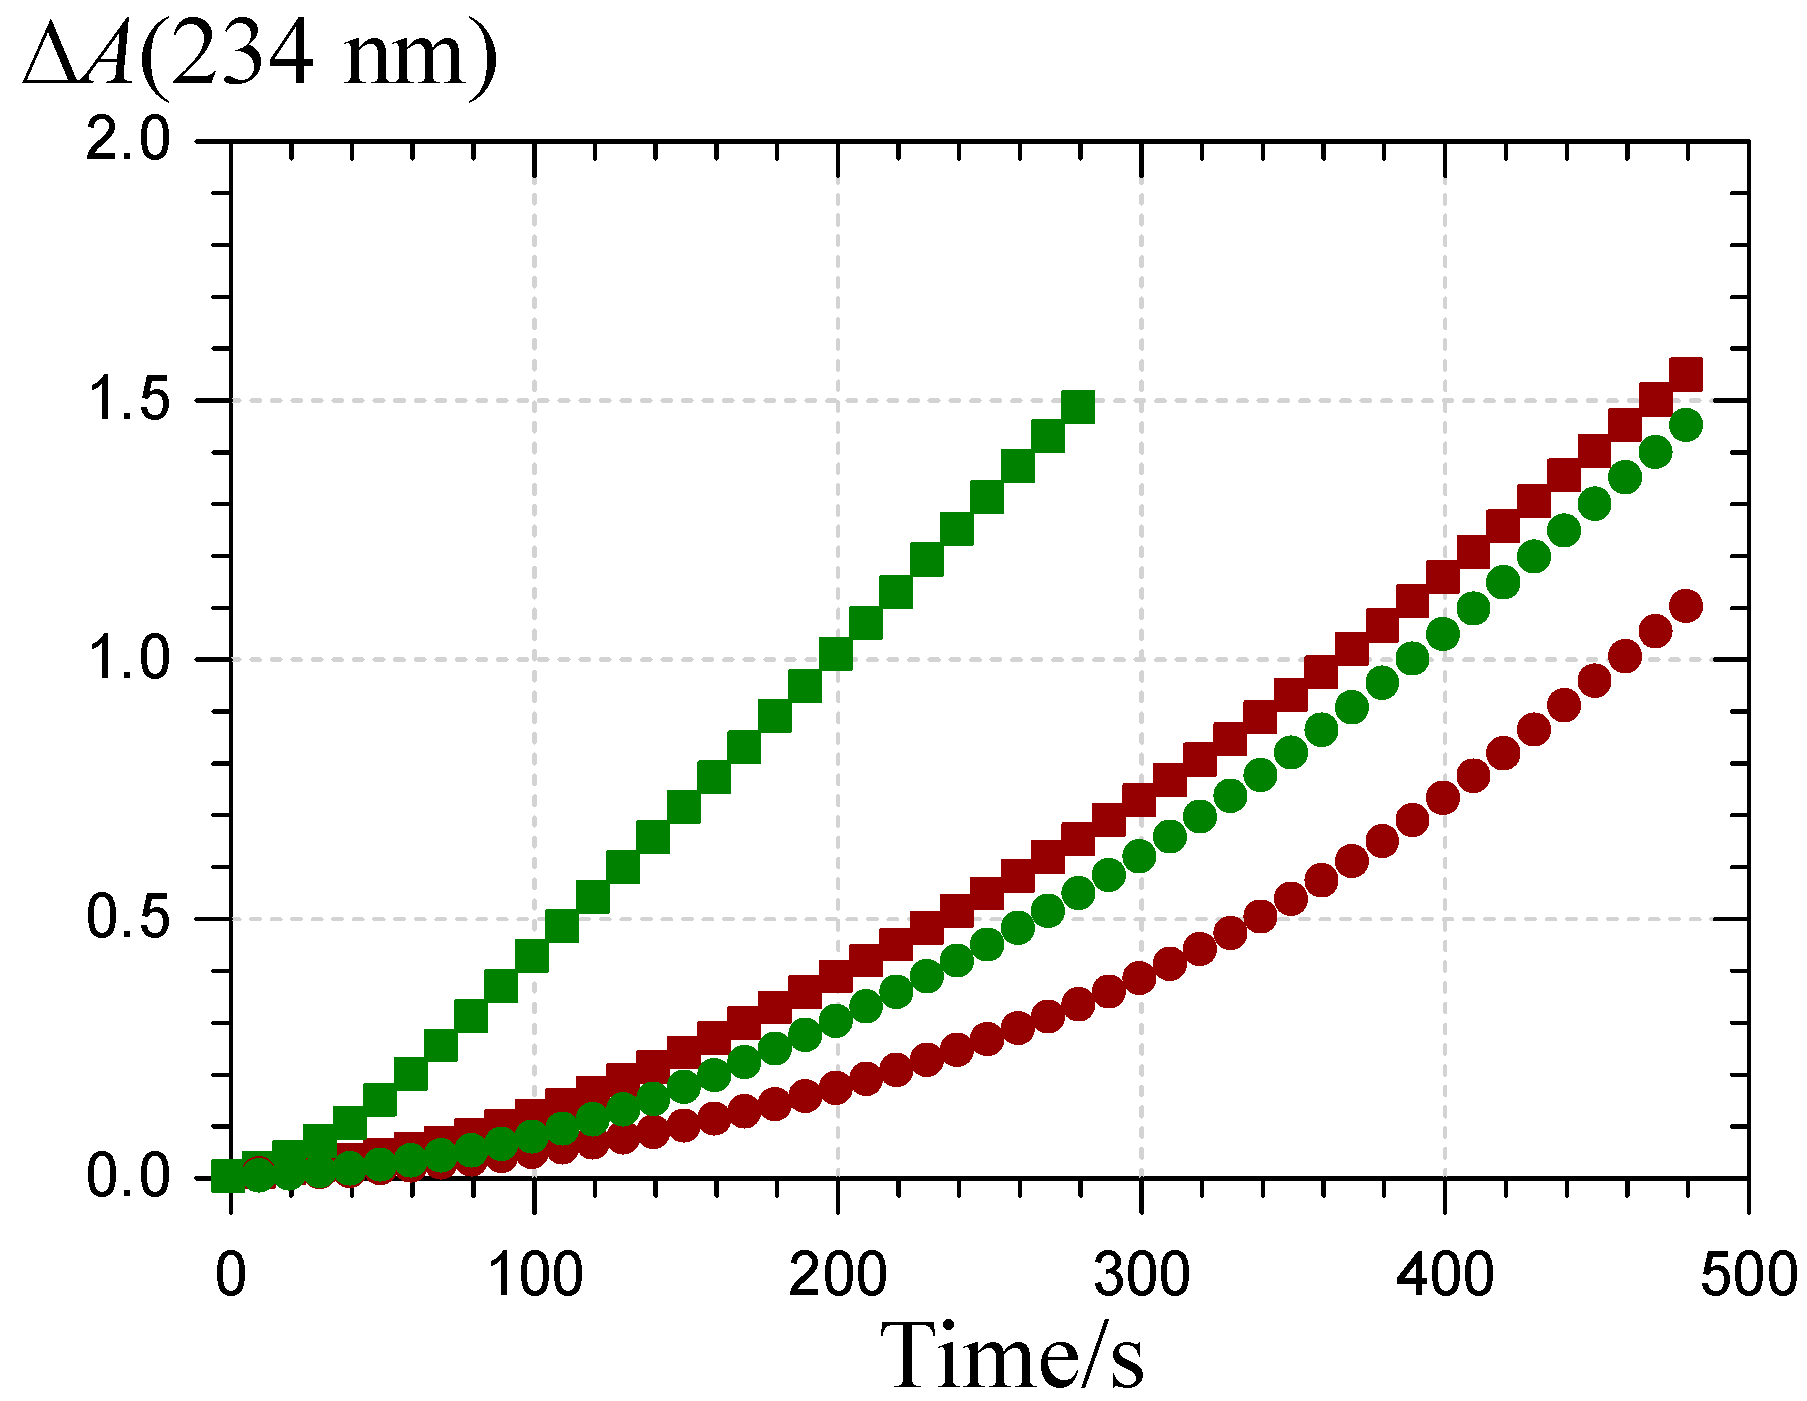
- (1)
- the antioxidant efficiency, which lies in the range 10–100, does not allow a clear discrimination between antioxidants. Its drift toward lower values when the antioxidant concentration increases suggests that modelling an antioxidant (stoichiometry n) as n independent sub-units, each capable of transferring one electron to FeIV with the same rate constant (ka), may be too crude and/or that antioxidant–metmyoglobin binding can take place (resulting in two populations of free and bound antioxidant molecules with distinct reactivities).
- (2)
- the antioxidant stoichiometry suggests that a catechol B-ring favors repeated electron transfer to FeIV (probably through o-quinone intermediates) and thus prolonged inhibition. By contrast, the P2 quinonoid base displays a B-ring that is deactivated by the keto group at C4'.
- (3)
- at high antioxidant concentration, the lipid oxidizability tends to decrease. This drift is ascribed to partial heme degradation and to the accumulation of phenolic oxidation products retaining a weak antioxidant character. The latter point is consistent with the structure of P1 oxidation products already determined by us [47].
| Pigment/μM | r2/M−1/2 s−1/2 | AE | n |
|---|---|---|---|
| P1, 0.5 | 2.8 (±0.1) | 137 (±16) | 3.0 (±0.1) |
| 1 | 2.6 (±0.1) | 40 (±2) | 2.5 (±0.1) |
| 1.5 | 2.3 (±0.1) | 38 (±5) | 2.5 (±0.1) |
| 2 | 2.2 (±0.1) | 29 (±3) | 3.2 (±0.2) |
| 2.5 | 2.1 (±0.1) | 11 (±1) | 4.0 (±0.3) |
| P1-CE, 0.5 | 2.7 (±0.1) | 108 (±6) | 4.4 (±0.1) |
| 1 | 2.4 (±0.1) | 59 (±3) | 5.6 (±0.1) |
| 1.5 | 2.3 (±0.1) | 40 (±2) | 4.3 (±0.1) |
| 2 | 2.1 (±0.1) | 29 (±1) | 5.2 (±0.1) |
| 2.5 | 1.9 (±0.1) | 28 (±1) | 3.9 (±0.1) |
| P2, 1.5 | 2.4 (±0.1) | 95 (±6) | 0.9 (±0.1) |
| 2.5 | 2.3 (±0.1) | 76 (±14) | 0.5 (±0.1) |
| 5 | 1.9 (±0.1) | 15 (±2) | 1.4 (±0.1) |
| 6.25 | 1.6 (±0.1) | 17 (±2) | 1.2 (±0.1) |
| 7.5 | 1.0 (±0.1) | 24 (±1) | 0.9 (±0.1) |
| P2-CE, 1.25 | 2.5 (±0.1) | 31 (±3) | 3.1 (±0.1) |
| 2.5 | 2.1 (±0.1) | 19 (±1) | 3.5 (±0.2) |
| 3.75 | 1.6 (±0.1) | 21 (±2) | 1.9 (±0.1) |
| 5 | 1.2 (±0.1) | 29 (±2) | 1.3 (±0.1) |
3. Experimental Section
3.1. Chemicals
3.2. UV-Spectroscopy
3.3. Fluorescence Spectroscopy
3.4. Iron-Pigment Binding
3.5. Inhibition of the Heme-Induced Peroxidation of Linoleic Acid
3.6. Influence of HSA on the Structural Transformations of Pigments
3.7. Pigment-HSA Binding
3.8. Data Analysis
4. Conclusions
Supplementary Materials
Author Contributions
Appendix
Mathematical Treatment for the Inhibition of Heme-Induced Lipid Peroxidation
Conflicts of Interest
References
- Yoshida, K.; Mori, M.; Kondo, T. Blue flower color development by anthocyanins: From chemical structure to cell physiology. Nat. Prod. Rep. 2009, 26, 857–964. [Google Scholar] [CrossRef]
- Cavalcanti, R.N.; Santos, D.T.; Meireles, M.A.A. Non-thermal stabilization mechanisms of anthocyanins in model and food systems—An overview. Food Res. Int. 2011, 44, 499–509. [Google Scholar] [CrossRef]
- Gonzalez-Manzano, S.; Duenas, M.; Rivas-Gonzalo, J.C.; Escribano-Bailon, M.T.; Santos-Buelga, C. Studies on the copigmentation between anthocyanins and flavan-3-ols and their influence in the colour expression of red wine. Food Chem. 2009, 114, 649–656. [Google Scholar] [CrossRef]
- Malien-Aubert, C.; Dangles, O.; Amiot, M.J. Color stability of commercial anthocyanin-based extracts in relation to the phenolic composition. Protective effects by intra- and intermolecular copigmentation. J. Agric. Food Chem. 2001, 49, 170–176. [Google Scholar] [CrossRef] [PubMed]
- Galland, S.; Mora, N.; Abert-Vian, M.; Rakotomanomana, N.; Dangles, O. Chemical synthesis of hydroxycinnamic acid glucosides and evaluation of their ability to stabilize natural colors via anthocyanin copigmentation. J. Agric. Food Chem. 2007, 55, 7573–7579. [Google Scholar] [CrossRef] [PubMed]
- Tsuda, T. Dietary anthocyanin-rich plants: Biochemical basis and recent progress in health benefits studies. Mol. Nutr. Food Res. 2012, 56, 159–170. [Google Scholar] [CrossRef]
- Goupy, P.; Bautista-Ortin, A.-B.; Fulcrand, H.; Dangles, O. Antioxidant activity of wine pigments derived from anthocyanins: Hydrogen transfer reactions to the DPPH radical and inhibition of the heme-induced peroxidation of linoleic acid. J. Agric. Food Chem. 2009, 57, 5762–5770. [Google Scholar] [CrossRef] [PubMed]
- Deng, J.; Cheng, J.; Liao, X.; Zhang, T.; Leng, X.; Zhao, G. Comparative study on iron release from soybean (glycine max) seed ferritin induced by anthocyanins and ascorbate. J. Agric. Food Chem. 2010, 58, 635–641. [Google Scholar] [CrossRef] [PubMed]
- Fernandes, I.; de Freitas, V.; Reis, C.; Mateus, N. A new approach on the gastric absorption of anthocyanins. Food Funct. 2012, 3, 508–516. [Google Scholar] [CrossRef] [PubMed]
- Kay, C.D. Aspects of anthocyanin absorption, metabolism and pharmacokinetics in humans. Nutr. Res. Rev. 2006, 19, 137–146. [Google Scholar] [CrossRef] [PubMed]
- Bouayed, J.; Hoffmann, L.; Bohn, T. Total phenolics, flavonoids, anthocyanins and antioxidant activity following simulated gastro-intestinal digestion and dialysis of apple varieties: Bioaccessibility and potential uptake. Food Chem. 2011, 128, 14–21. [Google Scholar] [CrossRef] [PubMed]
- Fleschhut, J.; Kratzer, F.; Rechkemmer, G.; Kulling, S.E. Stability and biotransformation of various dietary anthocyanins in vitro. Eur. J. Nutr. 2006, 45, 7–18. [Google Scholar] [CrossRef]
- Vitaglione, P.; Donnarumma, G.; Napolitano, A.; Galvano, F.; Gallo, A.; Scalfi, L.; Fogliano, V. Protocatechuic acid is the major human metabolite of cyanidin-glucosides. J. Nutr. 2007, 137, 2043–2048. [Google Scholar] [PubMed]
- Kay, C.; Kroon, P.; Cassidy, A. The major intestinal metabolites of anthocyanins are unlikely to be conjugates of their parent compounds but metabolites of their degradation products. Proc. Nutr. Soc. 2008, 67, E309. [Google Scholar] [CrossRef]
- Del Rio, D.; Rodriguez-Mateos, A.; Spencer, J.P.E.; Tognolini, M.; Borges, G.; Crozier, A. Dietary (poly)phenolics in human health: Structures, bioavailability, and evidence of protective effects against chronic diseases. Antioxid. Redox Signal. 2013, 18, 1818–1892. [Google Scholar] [CrossRef] [PubMed]
- Edwards, M.; Czank, C.; Cassidy, A.; Kay, C.D. Vascular bioactivity of anthocyanin degradants: Inhibition of endothelial superoxide production. Proc. Nutr. Soc. 2013, 72, E228. [Google Scholar] [CrossRef]
- Kanner, J.; Lapidot, T. The stomach as a bioreactor: Dietary lipid peroxidation in the gastric fluid and the effects of plant-derived antioxidants. Free Radic. Biol. Med. 2001, 31, 1388–1395. [Google Scholar] [CrossRef] [PubMed]
- Lapidot, T.; Granit, R.; Kanner, J. Lipid peroxidation by “free” iron ions and myoglobin as affected by dietary antioxidants in simulated gastric fluids. J. Agric. Food Chem. 2005, 53, 3293–3390. [Google Scholar]
- Dangles, O. Antioxidant activity of plant phenols: Chemical mechanisms and biological significance. Curr. Org. Chem. 2012, 16, 1–23. [Google Scholar] [CrossRef]
- Lorrain, B.; Dangles, O.; Loonis, M.; Armand, M.; Dufour, C. Dietary iron-initiated lipid oxidation and its inhibition by polyphenols in gastric conditions. J. Agric. Food Chem. 2012, 60, 9074–9081. [Google Scholar] [CrossRef] [PubMed]
- Goupy, P.; Vulcain, E.; Caris-Veyrat, C.; Dangles, O. Dietary antioxidants as inhibitors of the heme-induced peroxidation of linoleic acid: Mechanism of action and synergism. Free Radic. Biol. Med. 2007, 43, 933–946. [Google Scholar] [CrossRef] [PubMed]
- Gobert, M.; Remond, D.; Loonis, M.; Buffiere, C.; Sante-Lhoutellier, V.; Dufour, C. Fruits, vegetables and their polyphenols protect dietary lipids from oxidation during gastric digestion. Food Funct. 2014, 5, 2166–2174. [Google Scholar] [CrossRef] [PubMed]
- Khan, M.K.; Rakotomanomana, N.; Dufour, C.; Dangles, O. Binding of flavanones and their glucuronides and chalcones to human serum albumin. Food Funct. 2011, 2, 617–626. [Google Scholar] [CrossRef] [PubMed]
- Galland, S.; Rakotomanomana, N.; Dufour, C.; Mora, N.; Dangles, O. Synthesis of hydroxycinnamic acid glucuronides and investigation of their affinity for human serum albumin. Org. Biomol. Chem. 2008, 6, 4253–4260. [Google Scholar] [CrossRef]
- Awika, J.M.; Rooney, L.W.; Waniska, R.D. Anthocyanins from black sorghum and their antioxidant properties. Food Chem. 2004, 90, 293–301. [Google Scholar] [CrossRef]
- Yang, L.; Dykes, L.; Awika, J.M. Thermal stability of 3-deoxyanthocyanidin pigments. Food Chem. 2014, 160, 246–254. [Google Scholar] [CrossRef] [PubMed]
- Awika, J.M.; Rooney, L.W. Sorghum phytochemicals and their potential impact on human health. Phytochemistry 2004, 65, 1199–1221. [Google Scholar] [CrossRef] [PubMed]
- Carbonneau, M.-A.; Cisse, M.; Mora-Soumille, N.; Dairi, S.; Rosa, M.; Michel, F.; Lauret, C.; Cristol, J.-P.; Dangles, O. Antioxidant properties of 3-deoxyanthocyanidins and polyphenolic extracts from Cote d’Ivoire’s red and white sorghums assessed by ORAC and in vitro LDL oxidizability tests. Food Chem. 2014, 145, 701–709. [Google Scholar] [CrossRef] [PubMed]
- Taylor, J.R.N.; Belton, P.S.; Beta, T.; Duodu, K.G. Increasing the utilisation of sorghum, millets and pseudocereals: Developments in the science of their phenolic phytochemicals, biofortification and protein functionality. J. Cereal Sci. 2014, 59, 257–275. [Google Scholar] [CrossRef]
- Petti, C.; Kushwaha, R.; Tateno, M.; Harman-Ware, A.E.; Crocker, M.; Awika, J.; DeBolt, S. Mutagenesis breeding for increased 3-deoxyanthocyanidin accumulation in leaves of sorghum bicolor (L.) moench: A source of natural food pigment. J. Agric. Food Chem. 2014, 62, 1227–1232. [Google Scholar] [CrossRef] [PubMed]
- Mora-Soumille, N.; al Bittar, S.; Rosa, M.; Dangles, O. Analogs of anthocyanins with a 3',4'-dihydroxy substitution: Synthesis and investigation of their acid-base, hydration, metal binding and hydrogen-donating properties in aqueous solution. Dyes Pigments 2013, 96, 7–15. [Google Scholar] [CrossRef]
- Petrov, V.; Gavara, R.; Dangles, O.; al Bittar, S.; Mora-Soumille, N.; Pina, F. Flash photolysis and stopped-flow UV-visible spectroscopy study of 3',4'-dihydroxy-7-O-β-d-glucopyranosyloxyflavylium chloride, an anthocyanin analogue exhibiting efficient photochromic properties. Photochem. Photobiol. Sci. 2013, 12, 576–581. [Google Scholar] [CrossRef] [PubMed]
- Pina, F. Chemical applications of anthocyanins and related compounds. A source of bioinspiration. J. Agric. Food Chem. 2014, 62, 6885–6897. [Google Scholar] [CrossRef] [PubMed]
- Moran, J.F.; Klucas, R.V.; Grayer, R.J.; Abian, J.; Becana, M. Complexes of iron with phenolic compounds from soybean nodules and other legume tissues: Prooxidant and antioxidant properties . Free Radic. Biol. Med. 1997, 22, 861–870. [Google Scholar]
- Tokalioglu, S.; Gurbuz, F. Selective determination of copper and iron in various food samples by the solid phase extraction. Food Chem. 2010, 123, 183–187. [Google Scholar] [CrossRef]
- Nkhili, E.; Loonis, M.; Mihai, S.; el Hajji, H.; Dangles, O. Reactivity of food phenols with iron and copper ions: Binding, dioxygen activation and oxidation mechanisms. Food Funct. 2014, 5, 1186–1202. [Google Scholar] [CrossRef] [PubMed]
- Perron, N.R.; Wang, H.C.; DeGuire, S.N.; Jenkins, M.; Lawson, M.; Brumaghim, J.L. Kinetics of iron oxidation upon polyphenol binding. Dalton Trans. 2010, 39, 9982–9987. [Google Scholar]
- Varshney, A.; Sen, P.; Ahmad, E.; Rehan, M.; Subbarao, N.; Khan, R.H. Ligand binding strategies of human serum albumin: How can the cargo be utilized? Chirality 2010, 22, 77–87. [Google Scholar] [CrossRef] [PubMed]
- Dufour, C.; Dangles, O. Flavonoid-serum albumin complexation: Determination of binding constants and binding sites by fluorescence spectroscopy. Biochim. Biophys. Acta 2005, 1721, 164–173. [Google Scholar] [CrossRef] [PubMed]
- Tang, L.; Zuo, H.; Shu, L. Comparison of the interaction between three anthocyanins and human serum albumin by spectroscopy. J. Lumin. 2014, 153, 54–63. [Google Scholar] [CrossRef]
- Vulcain, E.; Goupy, P.; Caris-Veyrat, C.; Dangles, O. Inhibition of the metmyoglobin-induced peroxidation of linoleic acid by dietary antioxidants: Action in the aqueous vs. lipid phase. Free Radic. Res. 2005, 39, 547–563. [Google Scholar] [CrossRef] [PubMed]
- Sy, C.; Caris-Veyrat, C.; Dufour, C.; Boutaleb, M.; Borel, P.; Dangles, O. Inhibition of iron-induced lipid peroxidation by newly identified bacterial carotenoids in model gastric conditions. Comparison with common carotenoids. Food Funct. 2013, 4, 698–712. [Google Scholar] [CrossRef] [PubMed]
- Roginsky, V.; Zheltukhina, G.A.; Nebolsin, V.E. Efficacy of metmyoglobin and hemin as a catalyst of lipid peroxidation determined by using a new testing system. J. Agric. Food Chem. 2007, 55, 6798–6806. [Google Scholar] [CrossRef] [PubMed]
- Reeder, B.J.; Wilson, M.T. The effects of pH on the mechanism of hydrogen peroxide and lipid hydroperoxide consumption by myoglobin: A role for the protonated ferryl species. Free Radic. Biol. Med. 2001, 30, 1311–1318. [Google Scholar] [CrossRef] [PubMed]
- Baron, C.P.; Skibsted, L.H. Prooxidative activity of myoglobin species in linoleic acid emulsions. J. Agric. Food Chem. 1997, 45, 1704–1710. [Google Scholar] [CrossRef]
- Hu, M.; Skibsted, L.H. Kinetics of reduction of ferrylmyoglobin by (−)-epigallocatechin gallate and green tea extract. J. Agric. Food Chem. 2002, 50, 2998–3003. [Google Scholar] [CrossRef]
- Dangles, O.; Fargeix, G.; Dufour, C. Antioxidant properties of anthocyanins and tannins: A mechanistic investigation with catechin and the 3’,4’,7-trihydroxyflavylium ion. J. Chem. Soc. Perkin Trans. 2000, 2, 1653–1663. [Google Scholar] [CrossRef]
- Buchweitz, M.; Brauch, J.; Carle, R.; Kammerer, D.R. Application of ferric anthocyanin chelates as natural blue food colorants in polysaccharide and gelatin based gels. Food Res. Int. 2013, 51, 274–282. [Google Scholar] [CrossRef]
- Pereira, V.A.; de Queiroz Arruda, I.N.; Stefani, R. Active chitosan/PVA films with anthocyanins from Brassica oleraceae (red cabbage) as time-temperature indicators for application in intelligent food packaging. Food Hydrocoll. 2015, 43, 180–188. [Google Scholar] [CrossRef]
- Sample Availability: Samples of compounds P1 and P2 are available from the authors.
© 2014 by the authors. Licensee MDPI, Basel, Switzerland. This article is an open access article distributed under the terms and conditions of the Creative Commons Attribution license ( http://creativecommons.org/licenses/by/4.0/).
Share and Cite
Al Bittar, S.; Mora, N.; Loonis, M.; Dangles, O. Chemically Synthesized Glycosides of Hydroxylated Flavylium Ions as Suitable Models of Anthocyanins: Binding to Iron Ions and Human Serum Albumin, Antioxidant Activity in Model Gastric Conditions. Molecules 2014, 19, 20709-20730. https://doi.org/10.3390/molecules191220709
Al Bittar S, Mora N, Loonis M, Dangles O. Chemically Synthesized Glycosides of Hydroxylated Flavylium Ions as Suitable Models of Anthocyanins: Binding to Iron Ions and Human Serum Albumin, Antioxidant Activity in Model Gastric Conditions. Molecules. 2014; 19(12):20709-20730. https://doi.org/10.3390/molecules191220709
Chicago/Turabian StyleAl Bittar, Sheiraz, Nathalie Mora, Michèle Loonis, and Olivier Dangles. 2014. "Chemically Synthesized Glycosides of Hydroxylated Flavylium Ions as Suitable Models of Anthocyanins: Binding to Iron Ions and Human Serum Albumin, Antioxidant Activity in Model Gastric Conditions" Molecules 19, no. 12: 20709-20730. https://doi.org/10.3390/molecules191220709