Comparison of Two Methods, UHPLC-UV and UHPLC-MS/MS, for the Quantification of Polyphenols in Cider Apple Juices

Abstract
:1. Introduction
2. Results and Discussion
2.1. Sample Preparation
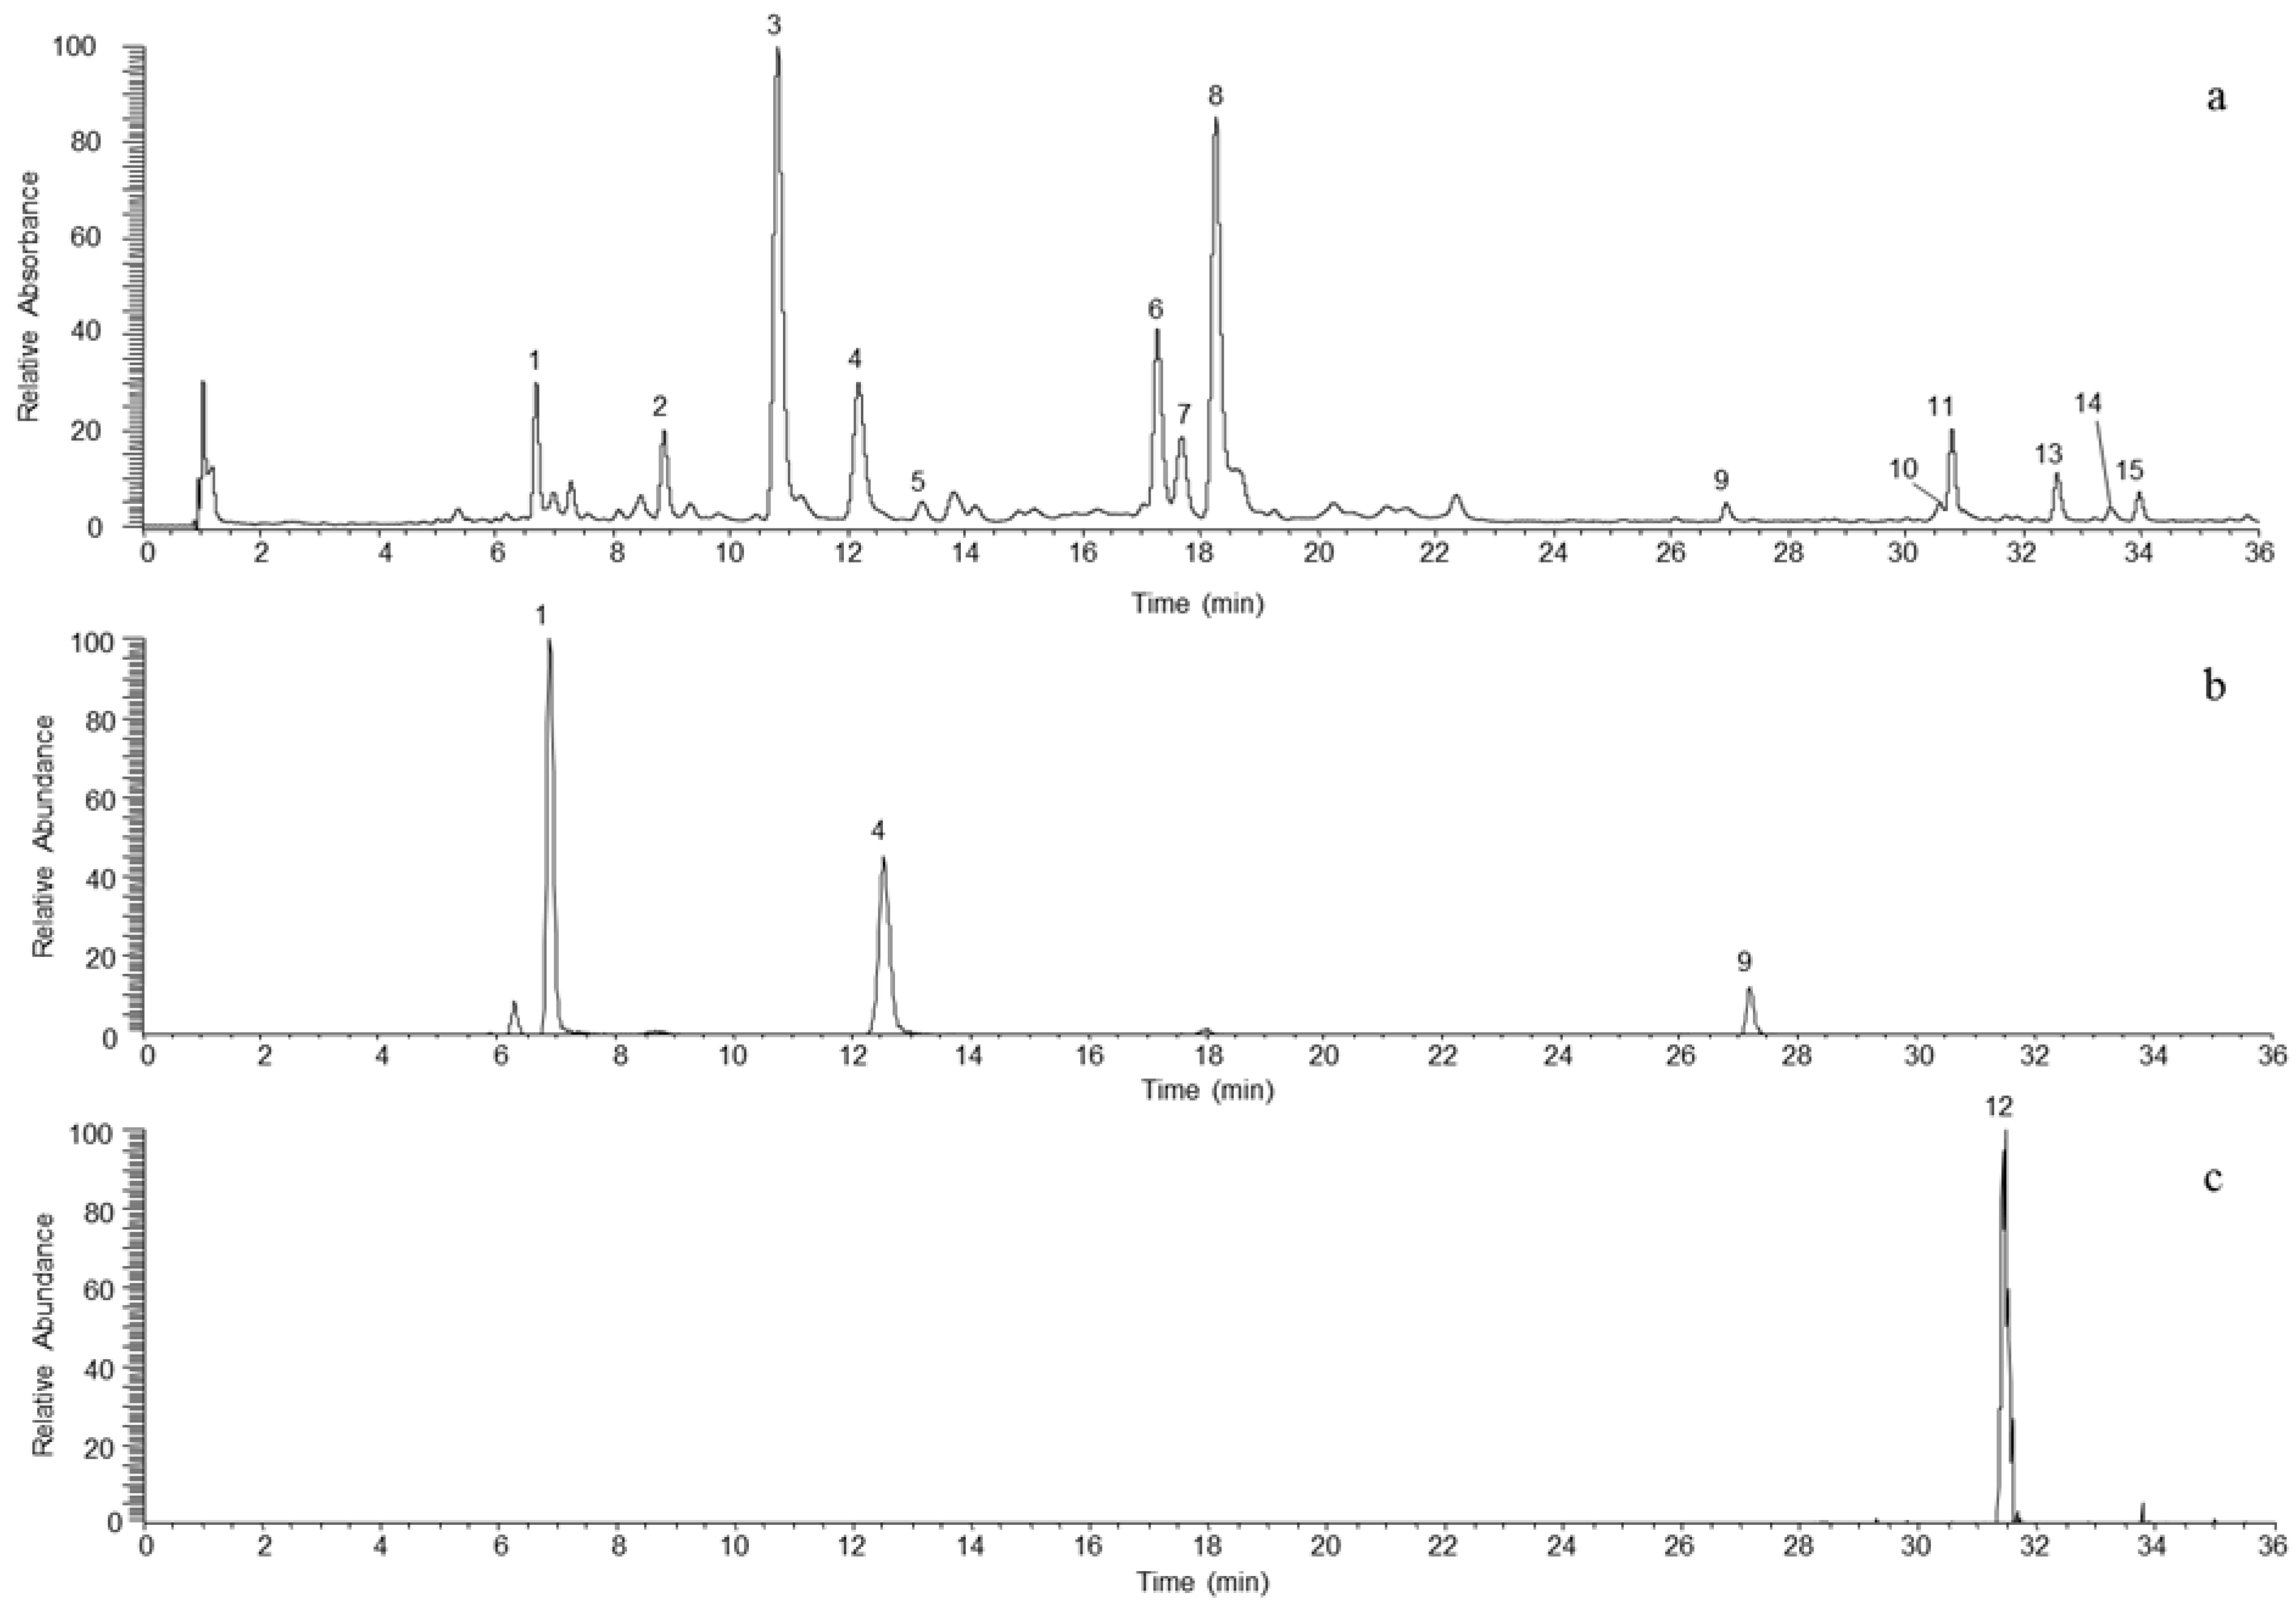
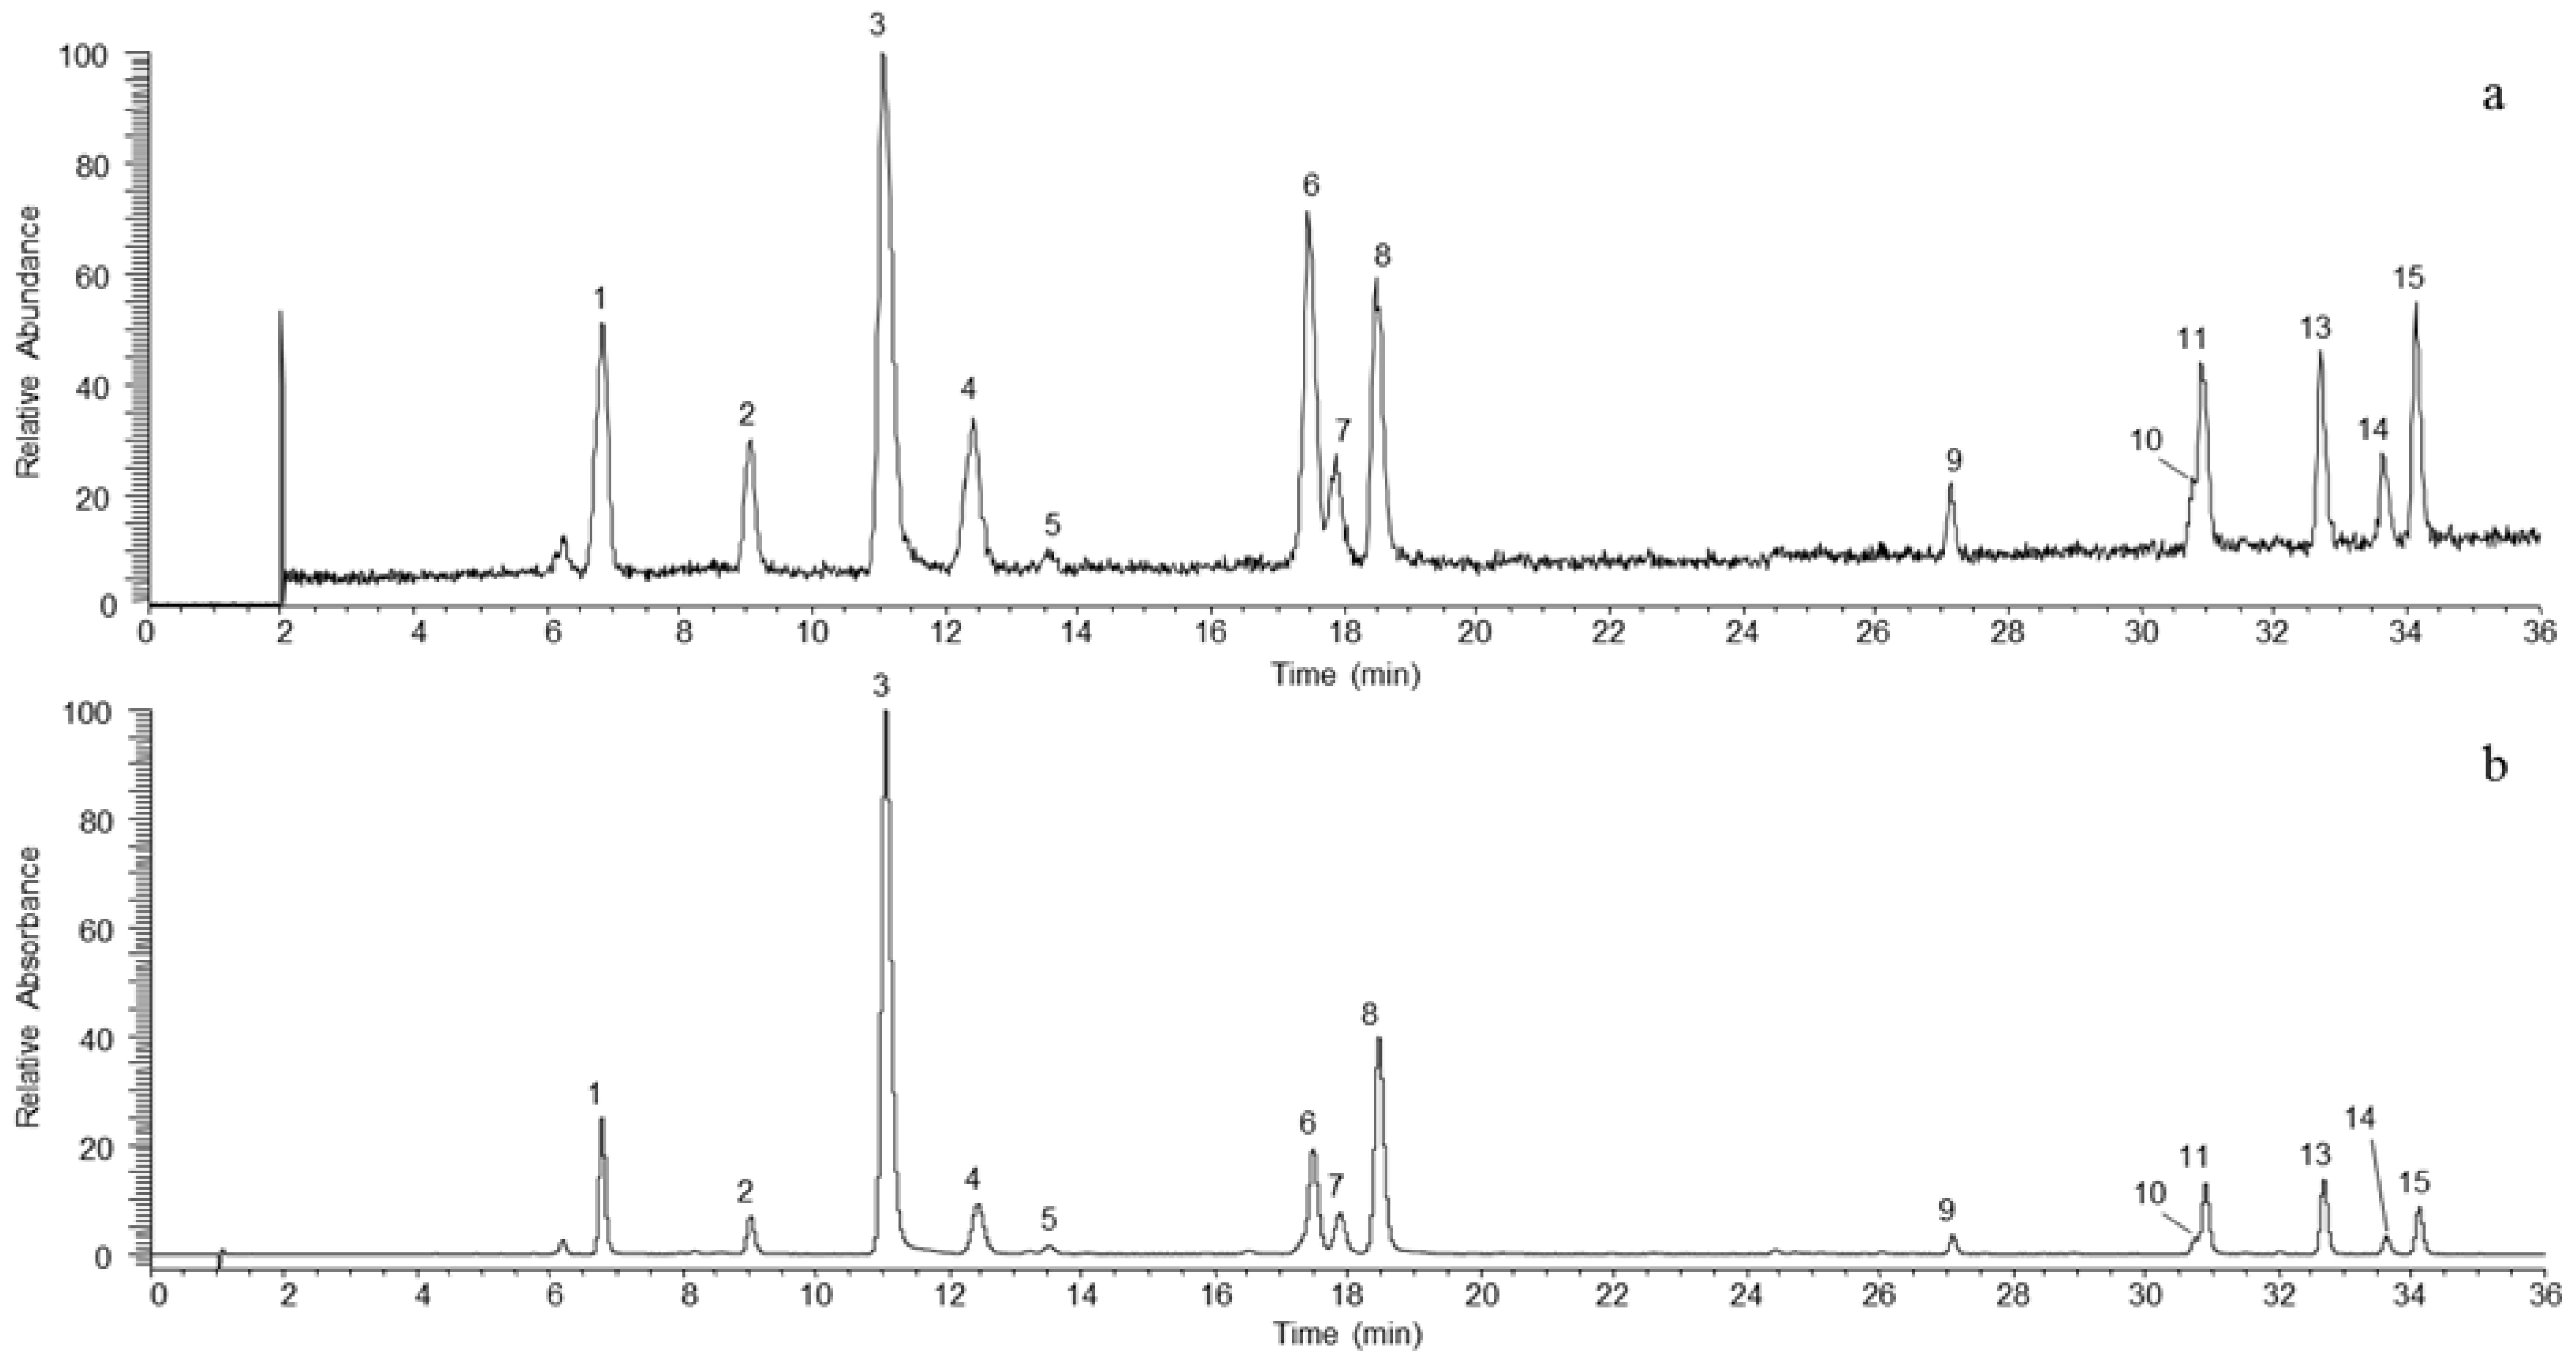
2.2. UHPLC-UV & UHPLC-MS/MS Conditions

2.3. Method Validation

| Compounds a | Regression equation b | Correlation coefficient (r) | Linear range c | LOD c | LOQ c | Juice c | Precision RSD (%) | Added c | Measured c | RSD (%) | Recovery f (%) | |
|---|---|---|---|---|---|---|---|---|---|---|---|---|
| Intra d | Inter e | |||||||||||
| UHPLC-UV | ||||||||||||
| PB1 | Y = 21689 + 2153.2X | 0.9923 | 13.30–500 | 0.3 | 1.7 | 24.76 | 3.3 | 4.1 | 10.0 | 36.26 | 1.0 | 95.9 |
| Ca | Y = −489.51 + 3086.7X | 0.9989 | 4.0–150 | 0.5 | 2.0 | 18.63 | 1.8 | 4.1 | 3.0 | 20.83 | 2.3 | 103.8 |
| CA | Y = 45046 + 9890.3X | 0.9997 | 20–1500 | <0.5 | 0.5 | 110.39 | 2.6 | 2.6 | 30.0 | 138.14 | 1.7 | 101.6 |
| PB2 | Y = 13047 + 1674.0X | 0.9944 | 13.3–500 | 0.7 | 6.7 | 76.82 | 2.6 | 2.6 | 10.0 | 92.1 | 2.7 | 94.3 |
| 4CA | Y = 8413 + 8554.6X | 0.9912 | 1.67–25 | 0.3 | 1.7 | 2.44 | 5.3 | 11.6 | 0.5 | 3.00 | 9.5 | 98.0 |
| ECa | Y = −23692 + 3783.4X | 0.9971 | 33.3–500 | 0.7 | 1.7 | 67.18 | 3.4 | 2.9 | 10.0 | 73.37 | 1.1 | 105.2 |
| PC1 | Y = 12620 + 1922.0X | 0.9900 | 20–300 | 1.0 | 4.0 | 51.58 | 3.7 | 3.2 | 10.0 | 57.29 | 5.8 | 107.5 |
| 4PCQA | Y = 9224.5 + 10112X | 0.9999 | 1.67–500 | 0.3 | 0.7 | 22.16 | 2.2 | 2.6 | 10.0 | 32.23 | 2.2 | 99.8 |
| PB5 | Y = −390.79 + 3058.7X | 0.9995 | 1.78–66.5 | 0.9 | 1.8 | 4.51 | 4.0 | 4.2 | 1.3 | 5.74 | 2.1 | 101.7 |
| QGa | Y = −1292.4 + 7250.6X | 0.9994 | 1.33–50 | 3.3 | 10.0 | 5.18 | 1.3 | 2.9 | 1.0 | 5.78 | 4.7 | 106.9 |
| PLXG | Y = 935.15 + 5226.0X | 0.9997 | 2.0–150 | 0.5 | 1.0 | 18.65 | 2.1 | 2.8 | 3.0 | 22.19 | 4.5 | 97.6 |
| QR | nd | nd | nd | nd | nd | nd | nd | nd | 0.1 | nd | nd | nd |
| PLG | Y = −782.23 + 8112.4X | 0.9998 | 1.33–100 | 0.3 | 1.3 | 6.86 | 1.8 | 3.2 | 2.0 | 8.54 | 2.1 | 103.8 |
| QA | Y = −665.42 + 7232.9X | 0.9991 | 3.33–50 | 3.3 | 10.0 | 3.35 | 2.2 | 3.8 | 1.0 | 3.94 | 3.0 | 110.4 |
| QRh | Y = −2177.8 + 5159.0X | 0.9994 | 4.0–150 | 4.0 | 10.0 | 3.32 | 1.7 | 6.2 | 3.0 | 6.04 | 1.4 | 104.6 |
| Compounds a | Regression equation b | Correlation coefficient (r) | Linear range c | LOD c | LOQ c | Juice c | Precision RSD (%) | Added c | Measured c | RSD (%) | Recovery f (%) | |
|---|---|---|---|---|---|---|---|---|---|---|---|---|
| Intra d | Inter e | |||||||||||
| UHPLC-MS/MS | ||||||||||||
| PB1 | Y = −42711 + 39800X | 0.9970 | 6.67–500 | 0.2 | 0.17 | 23.89 | 2.6 | 10.7 | 10.0 | 34.14 | 2.7 | 99.3 |
| Ca | Y = −92586 + 46791X | 0.9938 | 4.0–150 | 2.0 | 4.0 | 15.31 | 4.4 | 9.8 | 3.0 | 18.44 | 5.7 | 99.3 |
| CA | Y = 7634200 + 302370X | 0.9922 | 20–1500 | 0.5 | 1.0 | 126.16 | 3.2 | 6.8 | 30.0 | 171.18 | 2.9 | 91.2 |
| PB2 | Y = −3107.7 + 29137X | 0.9968 | 1.67–500 | 0.2 | 0.33 | 66.06 | 3.7 | 8.1 | 10.0 | 77.18 | 3.1 | 98.6 |
| 4CA | Y = 39949 + 297480X | 0.994 | 0.33–25 | 0.08 | 0.33 | 1.99 | 6.8 | 9.0 | 0.5 | 2.42 | 2.8 | 102.7 |
| ECa | Y = −328880 + 53294X | 0.9957 | 13.3–500 | 1.7 | 6.7 | 69.88 | 5.1 | 8.8 | 10.0 | 80.03 | 3.7 | 99.8 |
| PC1 | Y = 12323 + 20204X | 0.9976 | 4.0–300 | <0.1 | 0.2 | 34.01 | 0.3 | 4.9 | 10.0 | 41.00 | 1.4 | 107.4 |
| 4PCQA | Y = −1655300 + 131390X | 0.9893 | 0.67–500 | 0.17 | 0.67 | 21.46 | 2.5 | 3.0 | 10.0 | 27.76 | 2.6 | 113.3 |
| PB5 | Y = −9772.9 + 37935X | 0.9961 | 0.89–66.5 | 0.08 | 0.2 | 3.24 | 2.3 | 5.07 | 1.3 | 4.46 | 4.9 | 102.4 |
| QGa | Y = −66428 + 333280X | 0.9977 | 0.67–50 | <0.02 | 0.02 | 4.9 | 2.8 | 3.5 | 1.0 | 5.76 | 3.8 | 102.4 |
| PLXG | Y = 565330 + 480430X | 0.9981 | 2.0–150 | <0.05 | 1.0 | 21.46 | 3.9 | 5.0 | 3.0 | 24.81 | 3.0 | 98.6 |
| QR | Y = −10222 + 570740X | 0.9991 | 0.070–5 | 0.003 | 0.007 | 0.1 | 7.2 | 3.7 | 0.1 | 0.19 | 5.7 | 102.8 |
| PLG | Y = −4619.6 + 198410X | 0.997 | 0.33–100 | <0.03 | 0.03 | 6.68 | 5.4 | 5.2 | 2.0 | 8.33 | 3.1 | 104.1 |
| QA | Y = −61100 + 84940X | 0.9973 | 1.33–50 | 0.17 | 1.3 | 2.84 | 5.8 | 4.0 | 1.0 | 3.46 | 2.7 | 110.9 |
| QRh | Y = −218580 + 174400X | 0.9972 | 2.0–150 | <0.05 | 0.05 | 3.68 | 4.2 | 3.9 | 3.0 | 5.96 | 1.4 | 112.1 |
2.4. Comparison of the UHPLC-UV & UHPLC-MS/MS Methods
| Compounds a | UHPLC-UV | UHPLC-MS/MS | ||
|---|---|---|---|---|
| Min b | Max b | Min b | Max b | |
| PB1 | 16.7 | 231.7 | 39.1 | 326.7 |
| Ca | 5.6 | 138.2 | 11.9 | 105.5 |
| CA | 89.3 | 2240.9 | 97.3 | 741.1 |
| PB2 | 120.1 | 650.3 | nq | nq |
| 4CA | 3.4 | 17.8 | 1.8 | 12.4 |
| ECa | 54.3 | 298.5 | 49.4 | 246.8 |
| PC1 | 54.9 | 269.7 | 54.1 | 242.8 |
| 4PCQA | 2.9 | 394.1 | 12.2 | 126.3 |
| PB5 | 6 | 35.7 | nq | nq |
| QGa | 6.7 | 23.7 | 2.3 | 12.0 |
| PLXG | 13.3 | 113.9 | 14.6 | 126.9 |
| QR | nd | nd | 0.2 | 1.7 |
| PLG | 7.5 | 74.1 | 6.3 | 44.3 |
| QA | 6.8 | 20.6 | 2.8 | 10.3 |
| QRh | 9.2 | 76.6 | 3.8 | 37.2 |

3. Experimental
3.1. Standards and Chemicals
3.2. UHPLC-UV-MS Instrumentation and Conditions
| Compounds a | Rt (min) | Precursor ion [M−H]− (m/z) | Fragments [M−H]− (m/z) | CE (V) | TLO (a.u.) |
|---|---|---|---|---|---|
| PB1 | 6.8 | 577 | 289 | 30 | 159 |
| Ca | 9.1 | 289 | 245 | 16 | 159 |
| CA | 11.2 | 353 | 191 | 22 | 62 |
| PB2 | 12.5 | 577 | 289 | 30 | 159 |
| 4CA | 13.5 | 353 | 173 | 20 | 58 |
| ECa | 17.6 | 289 | 245 | 16 | 159 |
| PC1 | 18.0 | 865 | 289 | 45 | 159 |
| 4PCQA | 18.6 | 337 | 173 | 16 | 159 |
| PB5 | 27.2 | 577 | 289 | 30 | 159 |
| QGa | 30.8 | 463 | 300 | 32 | 159 |
| PLXG | 31.0 | 567 | 273 | 20 | 139 |
| QR | 31.6 | 609 | 300 | 40 | 159 |
| PLG | 32.8 | 435 | 167 | 32 | 159 |
| QA | 33.7 | 433 | 300 | 15 | 160 |
| QRh | 34.2 | 447 | 300 | 32 | 159 |
3.3. Preparation of Standard Solutions
3.4. Sample Preparation
3.5. Validation Study
4. Conclusions
Acknowledgments
Conflicts of Interest
References
- Song, Y.; Yao, Y.-X.; Zhai, H.; Du, Y.; Chen, F.; Wei, S.-W. Polyphenolic Compound and the Degree of Browning in Processing Apple Varieties. J. Integr. Agric. 2007, 6, 607–612. [Google Scholar]
- Alonso-Salces, R.M.; Herrero, C.; Barronco, A.; Berrueta, L.A.; Gallo, B.; Vicente, F. Technological classification of basque cider apple cultivars according to their polyphenolic profiles by pattern recognition analysis. J. Agric. Food Chem. 2004, 105, 8006–8061. [Google Scholar]
- Herrero, M.; Cuesta, I.; Garcia, L.A.; Diaz, M. Changes in organic acids during malolactic fermentation at different temperatures in yeast-fermented apple juice. J. Inst. Brew. 1999, 105, 191–195. [Google Scholar] [CrossRef]
- Lin, J.-K.; Weng, M.-S. Flavonoids as Nutraceuticals. In The Science of Flavonoids; Grotewold, E., Ed.; Springer: Columbus, OH, USA, 2006; p. 26. [Google Scholar]
- Maldonado-Cellis, M.-E.; Bousserouel, S.; Gosse, F.; Minker, C.; Lobstein, A.; Raul, F. Differential Induction of Apoptosis by Apple Procyanidins in TRAIL-Sensitive Human Colon Tumor Cells and Derived TRAIL-Resistant Metastatic Cells. J. Cancer Mol. 2009, 5, 21–30. [Google Scholar]
- Gosse, F.; Guyot, S.; Roussi, S.; Lobstein, A.; Fischer, B.; Seiler, N.; Raul, F. Chemopreventive properties of apple procyanidins on human colon cancerderived metastatic SW620 cells and in a rat model of colon carcinogenesis. Carcinogenesis 2005, 6, 1291–1295. [Google Scholar]
- Le Marchand, L.; Murphy, S.P.; Hankin, J.H.; Wilkens, L.R.; Kolonel, L.N. Intake of Flavonoids and Lung Cancer. J. Natl. Cancer I 2000, 92, 154–160. [Google Scholar] [CrossRef]
- Mink, P.J.; Scrafford, C.G.; Barraj, L.M.; Harnack, L.; Hong, C.P.; Nettleton, J.A.; Jacobs, D.R. Flavonoid intake and cardiovascular disease mortality: a prospective study in postmenopausal women. Am. J. Clin. Nutr. 2007, 85, 895–909. [Google Scholar]
- Boyer, J.; Liu, R.H. Apple phytochemicals and their health benefits. Nutr. J. 2004, 3, 5. [Google Scholar] [CrossRef] [Green Version]
- Crozier, A.; Jaganath, I.B.; Clifford, M.N. Dietary phenolics: chemistry, bioavailability and effects on health. Roy. Soc. Chem. 2009, 26, 1001–1043. [Google Scholar]
- Lee, K.W.; Kim, Y.J.; Kim, D.O.; Lee, H.J.; Lee, C.Y. Major Phenolics in Apple and Their Contribution to the Total Antioxidant Capacity. J. Agric. Food Chem. 2003, 51, 6516–6520. [Google Scholar] [CrossRef]
- Lotito, S.B.; Frei, B. Consumption of flavonoid-rich foods and increased plasma antioxidant capacity in humans: Cause, consequence, or epiphenomenon? Free Radical Bi. Med. 2006, 41, 1727–1746. [Google Scholar] [CrossRef]
- Threapleton, D.E.; Greenwood, D.C.; Evans, C.E.L.; Cleghorn, C.L.; Nykjaer, C.; Woodhead, C.; Cade, J.E.; Gale, C.P.; Burley, V.J. Dietary fiber intake and risk of first stroke: a systematic review and meta-analysis. Stroke 2013, 44, 1360–1368. [Google Scholar] [CrossRef]
- Tsao, R.; Yang, R.; Young, J.; Zhu, H. Polyphenolic Profiles in Eight Apple Cultivars Using High-Performance Liquid Chromatography. J. Agric. Food Chem. 2003, 51, 6347–6353. [Google Scholar] [CrossRef]
- Novakova, L.; Spacil, Z.; Seifrtova, M.; Opletal, L.; Solich, P. Rapid qualitative and quantitative ultra high performance liquid chromatography method for simultaneous analysis of twenty nine common phenolic compounds of various structures. Talanta 2010, 80, 1970–1979. [Google Scholar] [CrossRef]
- Ortega, N.; Romero, M.-P.; Macia, A.; Reguant, J.; Angles, N.; Morello, J.R.; Motilva, M.J. Comparative study of UPLC-MS/MS and HPLC-MS/MS to determine procyanidins and alkaloids in cocoa samples. J. Food Compos. Anal. 2010, 23, 298–305. [Google Scholar] [CrossRef]
- Ceymann, M.; Arrigoni, E.; Scharer, H.; Baumgartner, D.; Nising, A.B.; Hurrell, R.F. Rapid high performance screening method using UHPLC-MS to quantify 12 polyphenol compounds in fresh apples. Anal. Method 2011, 3, 1774–1778. [Google Scholar] [CrossRef]
- Weingerl, V.; Strlic, M.; Kocar, D. Comparison of Methods for Determination of Polyphenols in Wine by HPLC-UV/VIS, LC/MS/MS and Spectrophotometry. Acta Chim. Slov. 2009, 56, 698–703. [Google Scholar]
- Sallustio, B.C.; Noll, B.D.; Morris, R.G. Comparison of blood sirolimus, tacrolimus and everolimus concentrations measured by LC-MS/MS, HPLC-UV and immunoassay methods. Clin. Biochem. 2011, 44, 231–236. [Google Scholar] [CrossRef]
- Kahle, K.; Krauss, M.; Richling, E. Polyphenol profiles of apple juices. Mol. Nutr. Food Res. 2005, 49, 797–806. [Google Scholar] [CrossRef]
- Cappiello, A.; Famiglini, G.; Palma, P.; Pierini, E.; Termopoli, V.; Trufelli, H. Overcoming Matrix Effects in Liquid Chromatography-Mass Spectrometry. Anal. Chem. 2008, 80, 9343–9348. [Google Scholar] [CrossRef]
- Caporossi, L.; Tranfo, G.; Paci, E.; Rosa, M.; Capanna, S.; Tidei, F.; Papaleo, B. LC Determination of the Skin Exposure to Oxamyl on Greenhouse Workers and Comparison Between DAD and MS-MS Detection. Chromatographia 2010, 72, 281–287. [Google Scholar] [CrossRef]
- Hernando, M.D.; Ferrer, C.; Ulaszewska, M.; Garcia-Reyes, J.F.; Molina-Diaz, A.; Fernandez-Alba, A.R. Application of high-performance liquid chromatography-tandem mass spectrometry with a quadrupole/linear ion trap instrument for the analysis of pesticide residues in olive oil. Anal. Bioanal. Chem. 2007, 389, 1815–1831. [Google Scholar] [CrossRef]
- Sample Availability: Not available.
© 2013 by the authors; licensee MDPI, Basel, Switzerland. This article is an open access article distributed under the terms and conditions of the Creative Commons Attribution license (http://creativecommons.org/licenses/by/3.0/).
Share and Cite
Verdu, C.F.; Gatto, J.; Freuze, I.; Richomme, P.; Laurens, F.; Guilet, D. Comparison of Two Methods, UHPLC-UV and UHPLC-MS/MS, for the Quantification of Polyphenols in Cider Apple Juices. Molecules 2013, 18, 10213-10227. https://doi.org/10.3390/molecules180910213
Verdu CF, Gatto J, Freuze I, Richomme P, Laurens F, Guilet D. Comparison of Two Methods, UHPLC-UV and UHPLC-MS/MS, for the Quantification of Polyphenols in Cider Apple Juices. Molecules. 2013; 18(9):10213-10227. https://doi.org/10.3390/molecules180910213
Chicago/Turabian StyleVerdu, Cindy F., Julia Gatto, Ingrid Freuze, Pascal Richomme, François Laurens, and David Guilet. 2013. "Comparison of Two Methods, UHPLC-UV and UHPLC-MS/MS, for the Quantification of Polyphenols in Cider Apple Juices" Molecules 18, no. 9: 10213-10227. https://doi.org/10.3390/molecules180910213