Article

1H-MAS-NMR Chemical Shifts in Hydrogen-Bonded Complexes of Chlorophenols (Pentachlorophenol, 2,4,6-Trichlorophenol, 2,6-Dichlorophenol, 3,5-Dichlorophenol, and p-Chlorophenol) and Amine, and H/D Isotope Effects on 1H-MAS-NMR Spectra

Graduate School of Nanobioscience, Yokohama City University, Kanazawa-ku, Yokohama 236-0027, Japan
Molecules 2013, 18(4), 4786-4802; https://doi.org/10.3390/molecules18044786
Submission received: 1 March 2013 / Revised: 12 April 2013 / Accepted: 18 April 2013 / Published: 22 April 2013
(This article belongs to the Collection Isotope Effects)

Abstract

:
Chemical shifts (CS) of the 1H nucleus in N···H···O type hydrogen bonds (H-bond) were observed in some complexes between chlorophenols [pentachlorophenol (PCP), 2,4,6-tricholorophenol (TCP), 2,6-dichlorophenol (26DCP), 3,5-dichlorophenol (35DCP), and p-chlorophenol (pCP)] and nitrogen-base (N-Base) by solid-state high-resolution 1H-NMR with the magic-angle-spinning (MAS) method. Employing N-Bases with a wide range of pKa values (0.65–10.75), 1H-MAS-NMR CS values of bridging H atoms in H-bonds were obtained as a function of the N-Base’s pKa. The result showed that the CS values were increased with increasing pKa values in a range of ΔpKa < 0 [ΔpKa = pKa(N-Base) - pKa(chlorophenols)] and decreased when ΔpKa > 2: The maximum CS values was recorded in the PCP (pKa = 5.26)–4-methylpyridine (6.03), TCP (6.59)–imidazole (6.99), 26DCP (7.02)–2-amino-4-methylpyridine (7.38), 35DCP (8.04)–4-dimethylaminopyridine (9.61), and pCP (9.47)–4-dimethylaminopyridine (9.61) complexes. The largest CS value of 18.6 ppm was recorded in TCP–imidazole crystals. In addition, H/D isotope effects on 1H-MAS-NMR spectra were observed in PCP–2-amino-3-methylpyridine. Based on the results of CS simulation using a B3LYP/6-311+G** function, it can be explained that a little changes of the N–H length in H-bond contribute to the H/D isotope shift of the 1H-MAS-NMR peaks.

Graphical Abstract

1. Introduction

X-ray diffraction (XRD) measurements have been used to detect A···B length changes by deuterium substitution in A-H···B type H-bonds [1,2,3,4]. Determining the accurate position of H atoms, however, has been difficult by this method. Nuclear quadrupole resonance (NQR) methods are often employed to investigate H/D isotope effects. 35Cl NQR measurements have shown frequency shifts of dozens of kHz for covalently-attached Cl atoms and up to several hundred kHz (occasionally reaching MHz order) for ionic Cl atoms by deuterium substitution [5,6,7,8,9,10,11,12,13,14,15,16]. In a case of piperidinium and pyrrolidinium p-chlorobenzoate crystals, large 35Cl NQR frequency shifts of ca. 300 kHz have been detected by deuterium substitution of H atoms forming H-bonds, although the Cl atom doesn’t contribute to H-bonds in the crystals [17,18]. In contrast, 79Br NQR have exhibited small H/D shifts in piperidinium and pyrrolidinium p-bromobenzoate solids [19], despite the fact that these p-chloro-benzoate and p-bromobenzoate have the similar crystal structures [17,18,20,21]. Nuclear magnetic resonance (NMR) measurements have been sometimes used to detect electron density changes of constructive molecules upon deuteration. 13C-CP/MAS-NMR spectra (CP: cross polarization, MAS: magic-angle-spinning) have been employed to study H/D isotope effects [22,23,24,25,26], however, such lines generally show slight shift after deuterium substitution. 1H-MAS-NMR spectra of piperidinium and pyrrolidinium p-chlorobenzoate have displayed significant envelope changes by deuterium substitution, while the 13C-CP/MAS-NMR spectra show only small changes [18,27]. In these crystals, small changes of molecular arrangements by deuteration contribute to anomalous H/D isotope shift of the 1H-MAS-NMR spectra and 35Cl NQR frequencies. In the case of piperidinium and pyrrolidinium p-bromobenzoate, small H/D isotope effects on the 1H-MAS-NMR spectral lines are reported [19].
In a case of pentachlorophenol (abbreviated to PCP) complexes, it has been reported that PCP forms salts with nitrogen-bases (N-Base) covering a broad pKa range (0.65–11.20). These crystals have been employed to detect proton-transfer equilibrium between O–H···N (covalent form) and O···H–N+ (ionic form) [28,29,30,31,32,33,34,35,36,37,38,39,40,41,42,43,44,45]. 35Cl NQR frequency measurements have reported that the NQR frequencies give constant values of ca. 37.6 MHz in the small pKa ranges of N-Base, and successively decreased with increasing pKa values in the middle pKa range of 5–7, and take a constant of 36.9 MHz in pKa > 7 [28]. An inversion point of the frequency slope is shown at around pKa of 6. In addition, large H/D isotope shift of 250 kHz is detected in 35Cl NQR frequencies of PCP–4-methylpyridine (4MP; pKa = 6.06). In contrast, other PCP–N-Base complexes show little H/D isotope shifts [12]. These investigations have expected to proton transfer exhibiting in the PCP-4MP complex, and XRD and neutron diffraction measurements have revealed proton transfers between O–H···N and O···H-N+ states [29,30,31,32,33,34,35,36]. In addition, it has been reported that PCP and 4MP molecules are linked by the strongest known intermolecular O··H··N type H-bond in solids [33]. This crystal (triclinic) changes to a monoclinic structure exhibiting a weak H-bond after deuteration of the H-bond. The origin of the isotopic polymorphism is explained by dipole moment changes [33]: Since the O–D length is shorter than the O-H separation, the O···N distance becomes long upon deuteration. This change effects onto the local dipole moment and the dipole−dipole interaction between adjacent coupled H-bonds is reduced.
In contrast of PCP–4MP, a few studies of PCP complexes with other N-Bases have been reported [41,42,43,44,45], and are rare for 2,4,6-trichlorophenol (TCP), 2,6-dichlorophenol (26DCP), 3,5-dichlorophenaol (35DCP), and p-chlorophenol (pCP) complexes with N-Bases. In the present study, 1H-MAS-NMR spectra were observed in PCP, TCP, 26DCP, 35DCP, and pCP complexes with N-Bases listed in Table 1 (left column), and in order to detect H/D isotope effects on 1H-MAS-NMR spectra, some deuterium substituted salts in which H atoms contributing H-bond was exchanged by D atoms were introduced.
Table 1. 1H chemical shifts (ppm) of bridging H atoms observed in phenols and N-Bases complexes. Here, pKa values [28] of phenols and N-Bases are shown in parenthesis.
Pentachloro-
phenol
2,4,6-Trichloro
phenol
2,6-Dichloro
phenol
3,5-Dichloro
phenol
p-Chloro
phenol
SymbolsPCP (5.26)TCP (6.59)26DCP (7.02)35DCP (8.04)p-CP (9.47)
PyridinePYR (0.65)10.85 9.20 8.31 8.00 9.80
3-Cyanopyridine3CP (1.35)12.18
4-Cyanopyridine4CP (1.86)11.40 9.63 9.14 9.20 10.80
3-Bromopyridine3BP (2.85)12.54 9.87
4-Acethylpyridine4AP (12.02)12.02 11.51 12.59
QuinolineQL (14.11)14.11 11.13
IsoquinolineIQL (5.40)13.35
2-Methylpyridine2MP (5.94)15.49, 12.69
4-Methylpyridine4MP (6.03)17.85, 12.91
ImidazoleIMID (16.92)16.92 18.62, 15.84
2-Amino-3-methyl-pyridine2A3MP (7.21)16.10 13.97
2-Amino-4-methyl-pyridine2A4MP (7.38) 15.06 15.71, 9.77 14.14
TriethylenediamineTEDA (8.82)14.36 13.73 12.74 14.05 11.90
4-Dimethlamino-pyridine4DMAP (9.61)13.18 15.64 14.29
TriethylamineTEA (10.75)13.11, 10.49 10.40

2. Results and Discussion

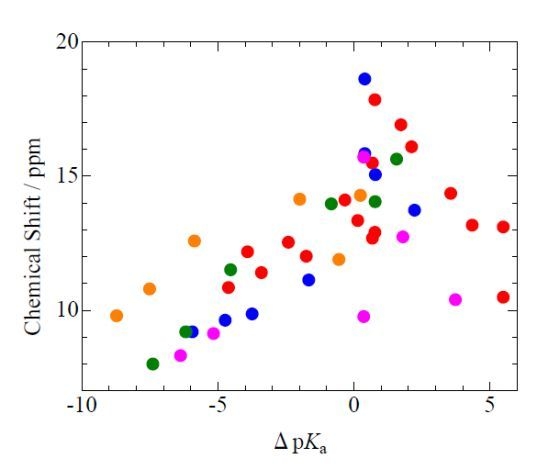
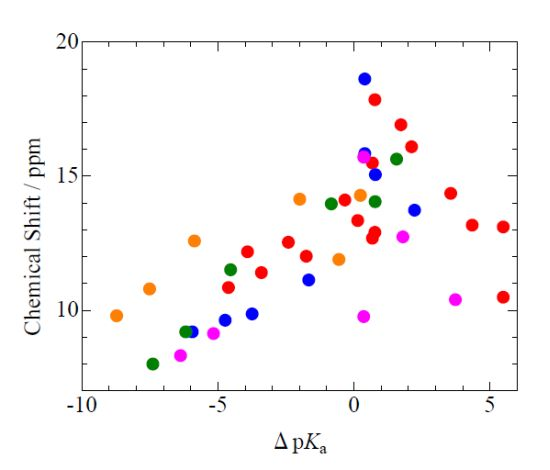
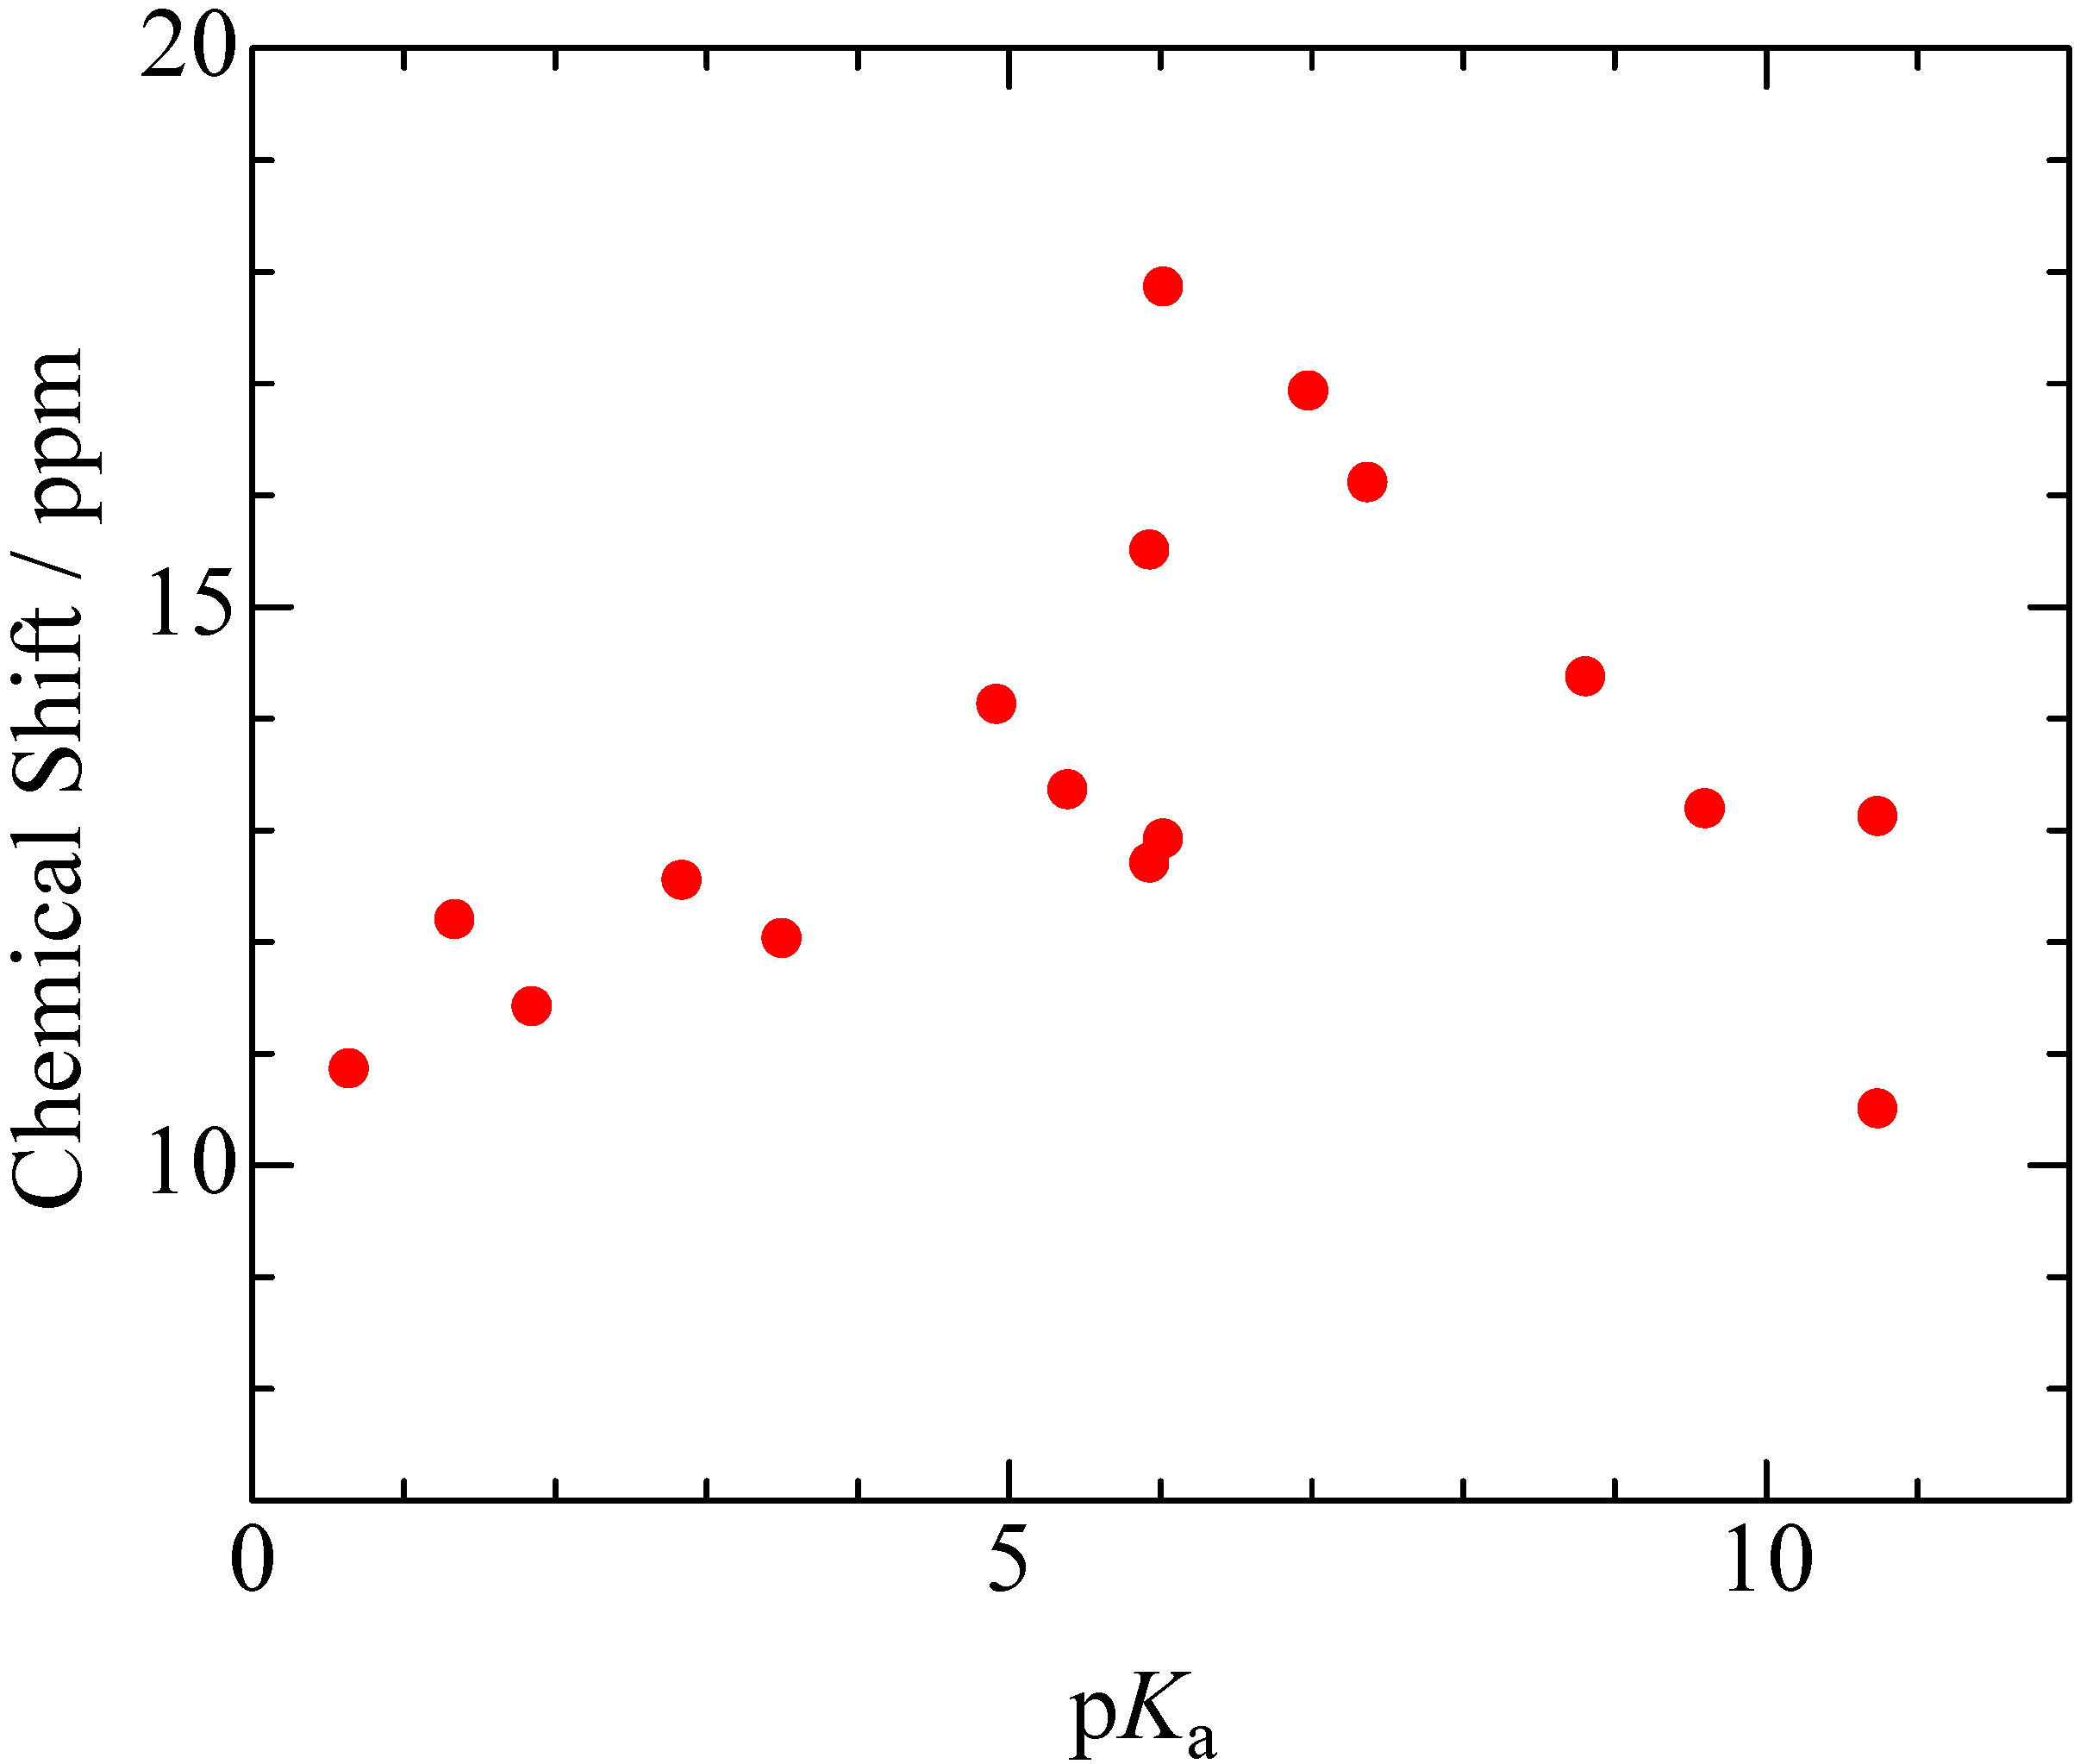
2.1. pKa Dependences of 1H-MAS-NMR Chemical Shift

1H-MAS-NMR spectra obtained for the PCP complexes are shown in Figure 1. The peaks obtained in a range of 9 to 18 ppm could be assigned to the H atom in O···H···N type H-bonds. This assignment could be supported by comparing with results of DFT calculation using a B3LYP/6-311++G** function. The 1H-MAS-NMR spectra show two results: (i) the CS values of bridging H atoms were increased and gradually decreased with increasing pKa values of N-Bases. (ii) Two peaks of the bridging H atom were recorded in PCP–2MP, PCP–4MP, PCP–TEA.
Figure 1. 1H-MAS-NMR spectra of pentachlorophenol complexes. Peaks of bridging H atoms are shown with arrows.
Molecules 18 04786 g001
In order to discuss the result (i), the 1H-NMR CS values of the bridging H atom are plotted as a function of N-Base’s pKa (Figure 2). This figure reveals that a maximum value of CS is found in PCP–4MP complex; the pKa value of 4MP (6.03) is slightly larger than that of PCP (5.26). This pKa value of 6.03 is agreement in the inversion point reported in the 35Cl NQR frequency curve [28,29]: It has been shown that the 35Cl NQR frequencies of the PCP complexes have a constant value of ca. 37.6 MHz in the range of pKa < 5, and successively decreased with increasing pKa in the middle pKa range of 5–7, and take a constant value of ca. 36.9 MHz in pKa > 7. The different dependence of 1H-NMR CS values and 35Cl NQR frequencies can be explained that the former method can directly detect the electron density of the bridging H atom, in contrast, the later method can estimate ionicity of the PCP molecule. Based on the previous reports [28,29,30,31,32,33,34,35,36,37], the neutralizing state of PCP (C6Cl5OH) is obtained in the range of pKa < 5 and the anion form (C6Cl5O) is detected in the high pKa ranges; in the middle pKa ranges, the proton transfer between PCP and N-Bases is suggested. Since a CS value of 1H nucleus can be theoretically considered as a function of charge density (the higher positive-charge results in the larger CS value, because 1H CS values are mainly determined by diamagnetic terms rather than paramagnetic ones), it can be concluded that the most positive-charge of the bridging H atom is recorded in the 4MP salt in the PCP complexes. Increasing the pKa values from 6.03, the CS values are gradually decreased. Based on results of 35Cl NQR measurements [28], average position of the bridging H atom is shifted from PCP to N-Base compounds with increasing N-Base’s pKa. The result of decreasing 1H-NMR CS values suggests that positive charge of the H atom is decreased in the range of pKa > 6.03: This result can be considered that positive charge of the bridging H atom is delocalized onto N-Base molecules with increasing the pKa values, because the longer O–H distance results in the shorter H-N separation.
Figure 2. 1H-MAS-NMR chemical shifts of pentachlorophenol complexes plotted as a function of N-Base’s pKa.
Molecules 18 04786 g002
In the case of TCP complexes, 1H-MAS-NMR spectra as shown in Figure 3 were obtained. Based on results of CS simulation using the same function as described above, it could be assigned that the peaks observed around 5–9 ppm were superimposed by the H atoms of TCP and N-Base. The CS values assigned to the bridging H atom of TCP, 26DCP, 35DCP, and pCP complexes (the signals were recorded in a range of 9–20 ppm) are summarized in Figure 4. In this figure, the CS values of PCP complexes are also displayed against ΔpKa which is defined by pKa(N-Base) - pKa(chlorophenols). This figure suggests that CS values of the bridging H atoms are correlated with ΔpKa and the maximum CS value of each complex is recorded at ΔpKa of ca. 1. In addition, the largest CS value of 18.6 ppm was recorded in TCP–IMID (in the case of PCP–4MP, the CS value of 17.8 ppm was obtained). Based on the previous reports about PCP–4MP [12,28,29,30,31,32,33,34,35,36], it can be considered that TCP and IMID molecules are linked by very strong H-bond and proton transfer can be also expected in the crystal.
Figure 3. 1H-MAS-NMR spectra of 2,4,6-trichlorophenol complexes. The signal of inner reference of silicon rubber was recorded at 0.12 ppm. Peaks of bridging H atoms are shown with arrows.
Molecules 18 04786 g003
Figure 4. 1H-MAS-NMR spectra of 2,4,6-trichlorophenol( Molecules 18 04786 i001), 2,6-dichlorophenol( Molecules 18 04786 i002), 3,5-dichlorophenol( Molecules 18 04786 i003), and p-chlorophenol( Molecules 18 04786 i004) complexes plotted as a function of pKa and ΔpKa = pKa (N-Bases) - pKa (chlorophenols) (pentachlorophenol( Molecules 18 04786 i005)).
Molecules 18 04786 g004
Two 1H-MAS-NMR peaks of the bridging H atom were recorded in PCP–2MP, PCP–4MP, and PCP–TEA complexes as described above [result (ii)]. The same result is detected in TCP–IMID, and 26DCP–2A4MP salts. In the case of the 4MP complex, two signals are detected at 12.9 and 17.8 ppm. This line shape is similar to the reported envelope [33,34]. These literatures show that there are two kinds of crystallographic structure (monoclinic and triclinic) in the PCP–4MP solids. Based on the reports, the peaks observed at 12.9 and 17.8 ppm can be assigned to the bridging H atom in the monoclinic and triclinic forms, respectively. Based on the result, it could be considered that the other complexes of PCP–2MP, PCP–TEA TCP–IMID, and 26DCP–2A4MP also have two kinds of crystal forms. In order to confirm this expectation, X-ray diffraction (XRD), 13C-CP/MAS-NMR, and temperature dependences of 1H-MAS-NMR spectra measurements were carried out. The results of XRD powdered patterns observed in them are displayed in Figure 5. In the case of PCP–2MP, the space group of P1 has been shown [41]. Subtracting signals assigned to the reported crystal structure from the observed spectrum, some peaks are remained on the XRD spectrum, therefore, it can be concluded that the sample has two kinds of crystallographic structure (the other structure could not be assigned to a unique structure in the present study). In the case of PCP–TEA, TCP–IMID and 26DCP–2A4MP solids, the XRD spectra suggest that two kinds of crystal are mixed in the solids samples.
In order to confirm some crystals were mixed in PCP–TEA, 13C-CP/MAS-NMR measurements were performed with a MAS ratio of 12 kHz. The spectrum observed in PCP–TEA solids showed nine peaks in a range of 100–170 ppm, as displayed in Figure 6. Since the 13C-NMR line was observed at 150.92 MHz with MAS speed of 12 kHz, spinning sidebands could be recorded at 79.5 ppm beside of an isotropic signal. This fact suggests that the signals recorded in the range of 100–170 ppm don’t include any spinning sidebands. Based on the result of 13C CS simulation using the same method described above, the peaks observed in the range of 100–170 ppm are assigned to the C atoms in PCP. Since the result of nine peaks recorded on the spectrum is inconsistent with the fact of the number of the C atoms in PCP, it can be concluded that the PCP–TEA sample has more than one H-bond state. In the case of PCP–TEA and 26DCP–2A4MP, 1H-MAS-NMR measurements were performed as a function of temperature. Since the spectra show little correlation with temperature as displayed in Figure 7, it can be concluded that no correlation is exists between the two crystal forms in this temperature region.
Figure 5. XRD spectra of pentachlorophenol–2-methylpyridine (PCP–2MP), pentachlorophenol–triethylamine (PCP–TEA), 2,4,6-trichlorophenol–imidazole (TCP–IMID), and 2,6-dichlorophenol–2-amino-4-methylpyridine (26DCP–2A4MP) complexes.
Molecules 18 04786 g005
Figure 6. 13C-CP/MAS-NMR spectrum of pentachlorophenol–triethylamine. The asterisks denote spinning-side-band peaks.
Molecules 18 04786 g006
Figure 7. Temperature dependences of 1H-MAS-NMR spectra observed in penta-chlorophenol–triethylamine (PCP–TEA) and 2,6-dichlorophenol–2-amino-4-methyl-pyridine (26DCP–2A4MP).
Molecules 18 04786 g007

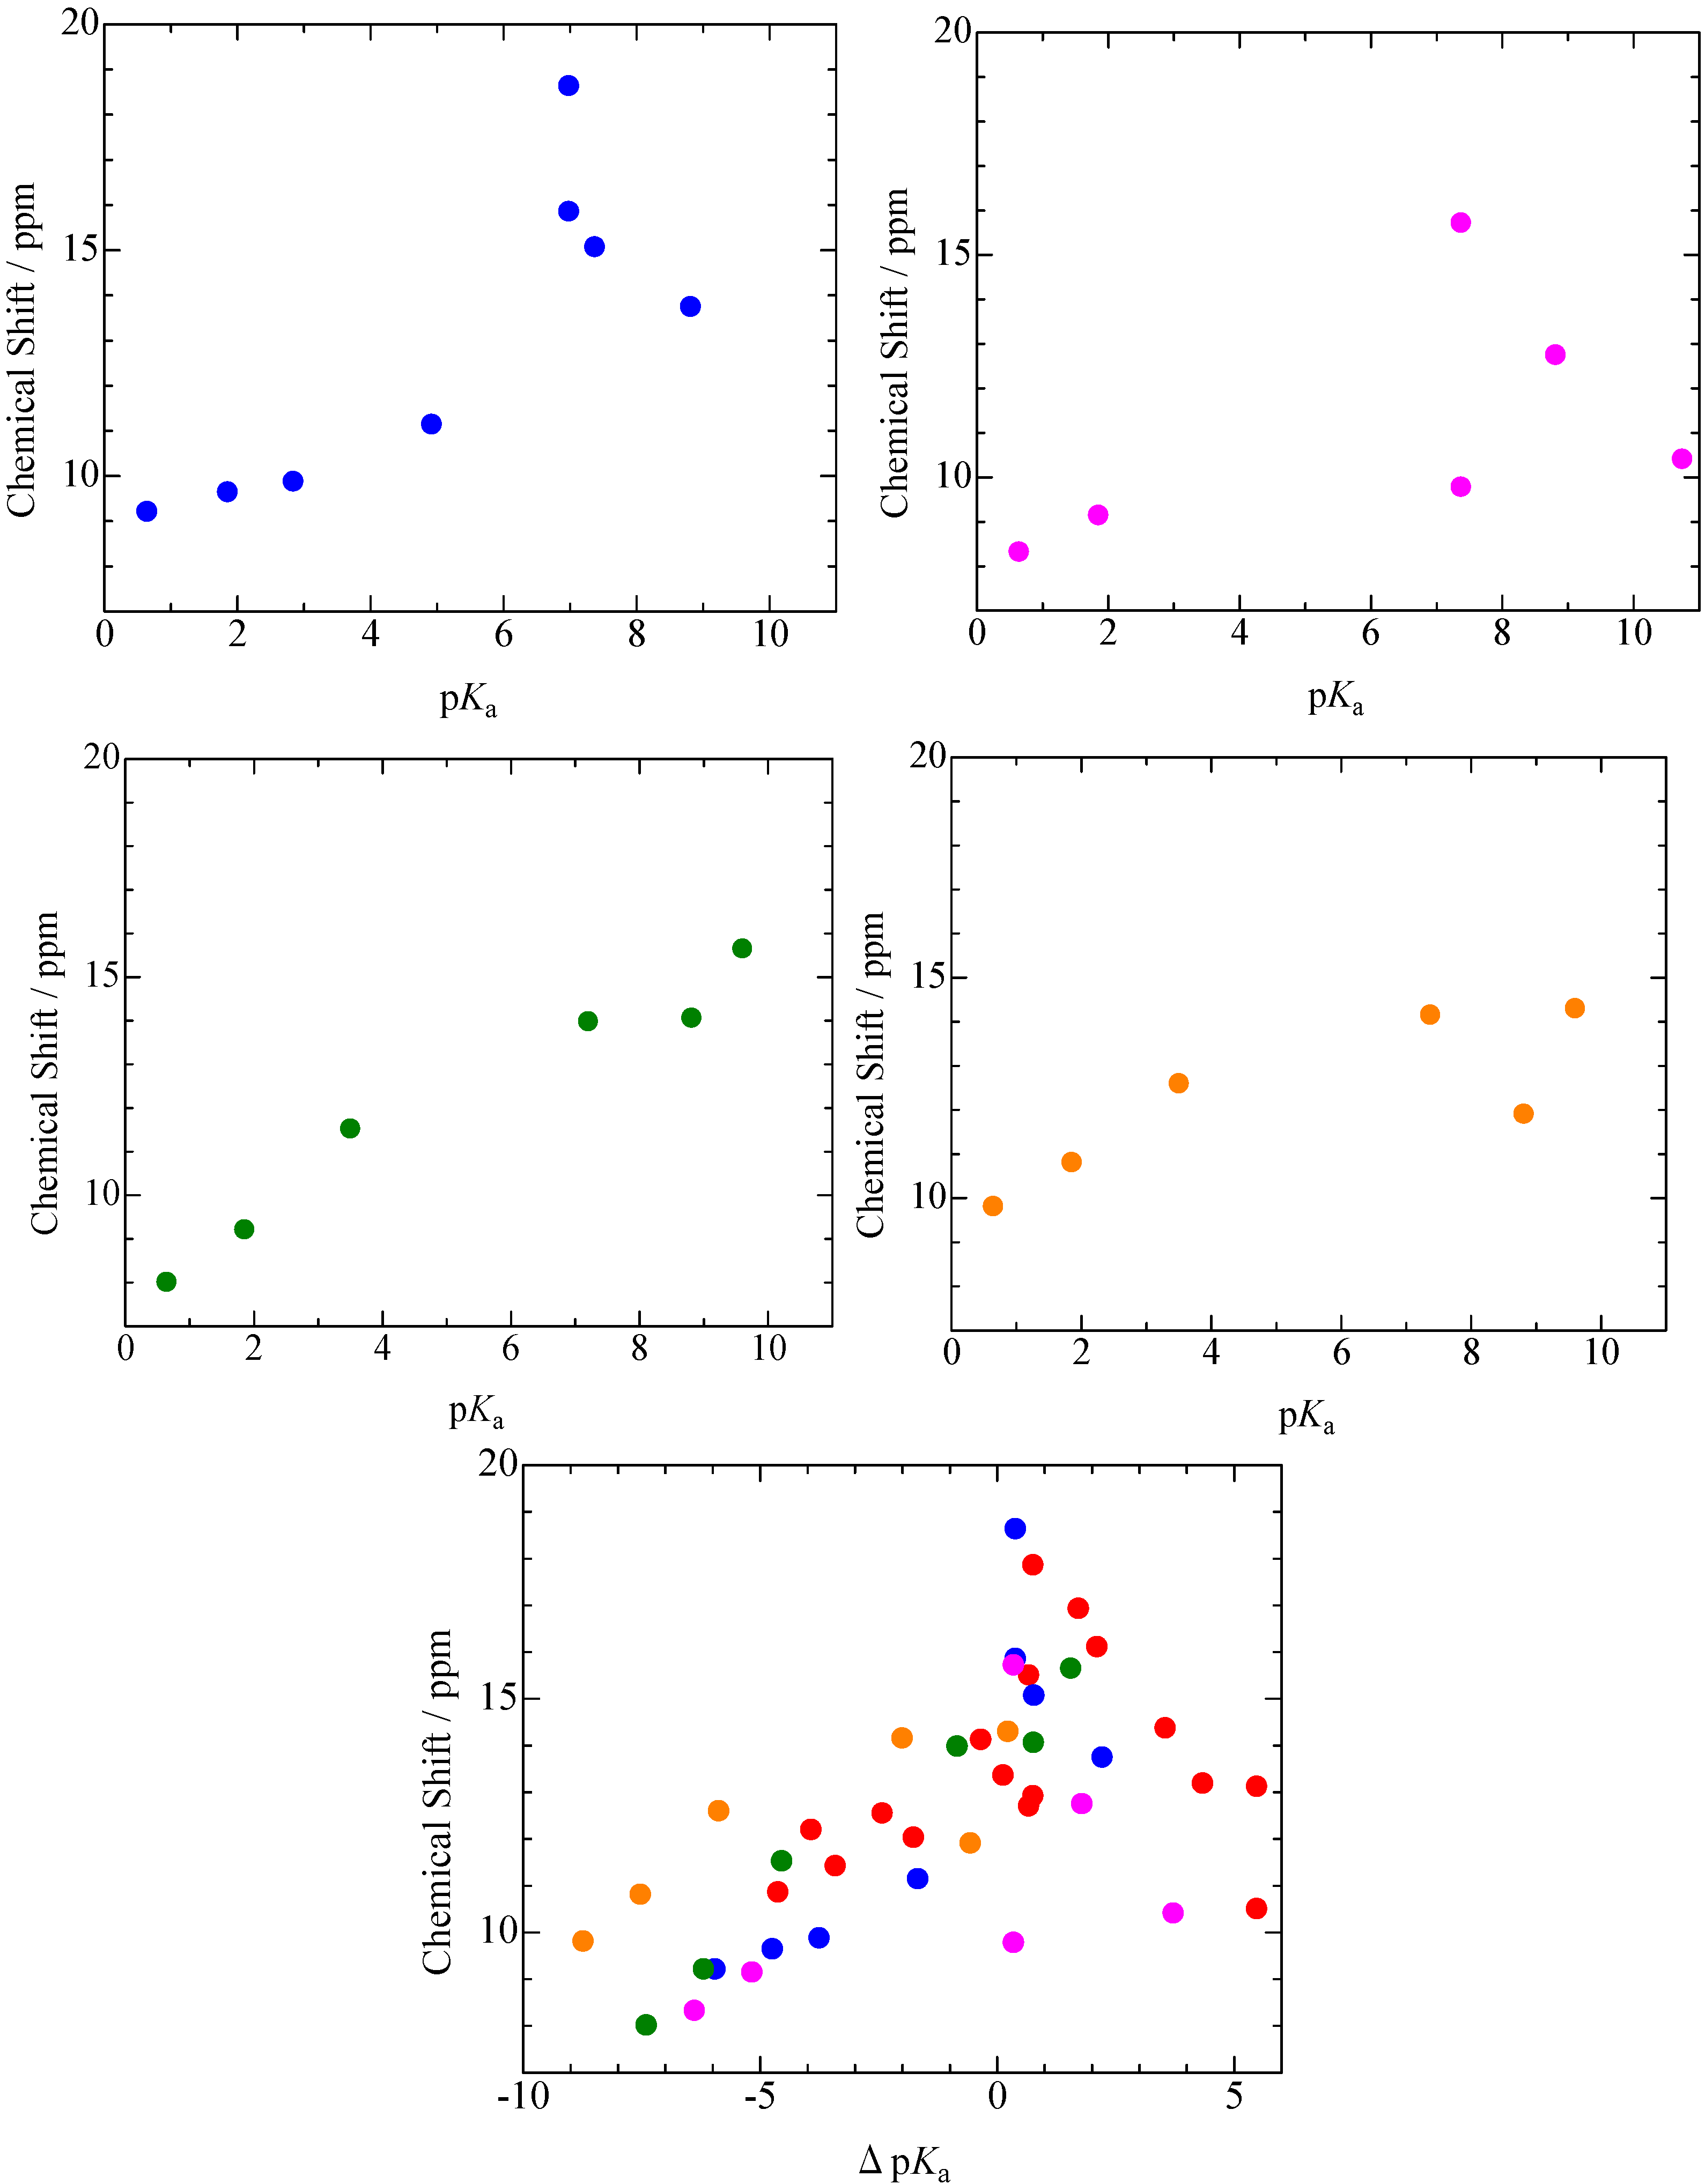
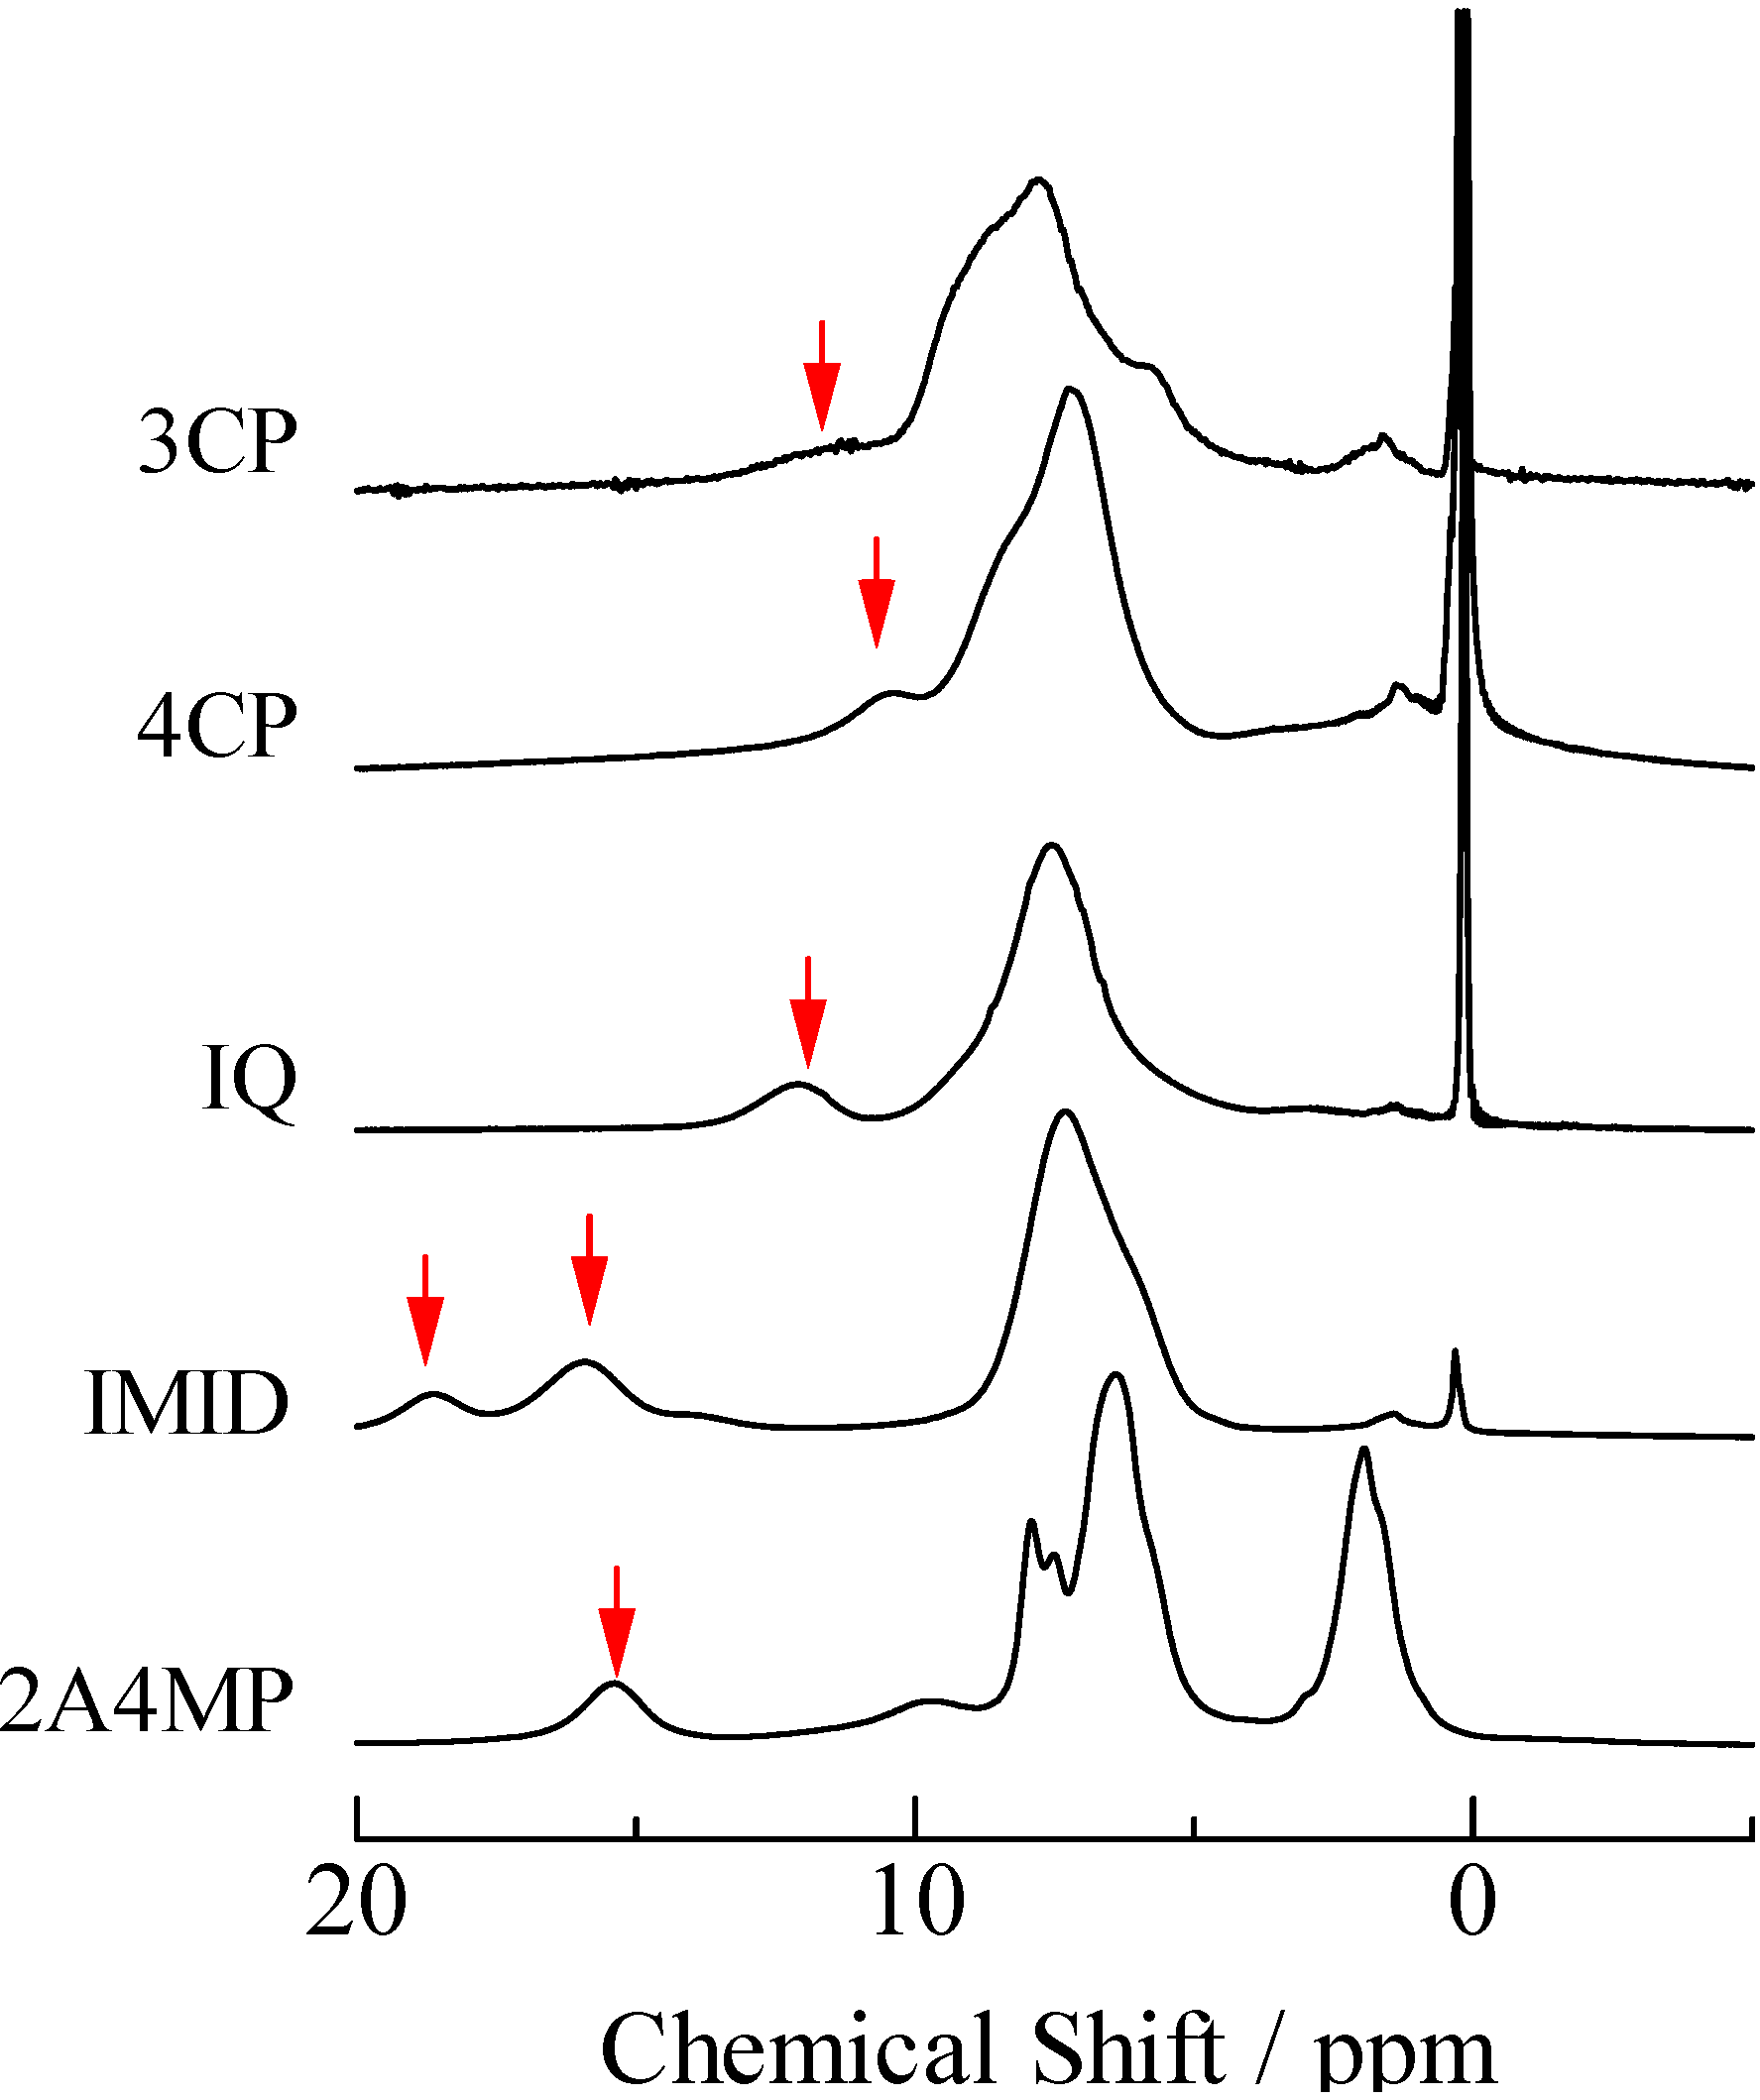
2.2. H/D Isotope Effects

1H-MAS-NMR spectra observed in N-Base complexes of PCP and TCP after deuterium substitution are displayed in Figure 8. In order to explain H/D isotope effects on 1H-MAS-NMR line-shapes, the 1H-MAS-NMR spectra of non-deuterium compounds as shown in Figure 1, Figure 3 are displayed again in Figure 8. Compering these spectra, the peak-intensities assignable to the H atom forming N···H···O type H-bond were reduced by deuterium substitution. These changes suggest that a high ratio of deuterium substitution was achieved in each complex. New peaks were recorded at around 2.5 ppm of TCP–3CP, TCP–4CP, and TCP–2A4MP after deuterium substitution. Since a 1H peak of CH3CN, which is used for preparation, is generally observed at this frequency, it can be considered that these samples include the solvent. 1H-MAS-NMR spectra of some complexes became broad after deuterium substitution, in contrast, narrowing was recorded in PCP-2A3MP-d and TCP-IQ-d.
Since no crystal structures of the complexes have been reported, XRD measurements were performed for both deuterium and non-deuterium complexes. Since the result of XRD observation of TCP-IQ-d showed very broad lines, it can be considered that the TCP–IQ crystal is deformed by deuterium substitution, i.e., very sharp signals observed in the 1H-MAS-NMR spectrum of TCT–IQ-d can be attributed to the spectrum of amorphous states. In the case of PCP–2A3MP, the similar XRD spectrum was obtained before and after deuterium substitution as displayed in Figure 9.
Figure 8. H/D isotope effects on 1H-MAS-NMR spectra of (a) pentachlorophenol (PCP) and (b) 2,4,6-trichlorophenol (TCP) complexes. The NMR signals observed in deuterated and non-deuterated samples are drawn by red and black lines, respectively.
Molecules 18 04786 g008
Figure 9. XRD spectra of pentachlorophenol–2-amino-3-methylpyridine.
Molecules 18 04786 g009
Therefore, it can be considered that the H/D isotope shifts recorded on the NMR line-shape are caused by the bridging H atom position. In order to discuss origin of H/D isotope effects, DFT simulation were performed. Whole atomic positions of the complex were simulated using a function of B3LYP/6-31+G** in the Gaussian 03 computer program [46] and gave the N–H and H···O distances of 105 and 159 pm, respectively. Shielding tensor calculation was performed with a B3LYP/6-311+G** method. Applying the same simulation to a tetramethylsilane (TMS) molecule, 1H CS values were obtained. The 1H CS values and potential energies simulated as a function of the N–H distance were plotted in Figure 10. The potential curves showed two minima. The lowest energy was obtained at the N–H length of 105 pm and the second at 150 pm (corresponds to the O–H separation of 114 pm): The simulation showed the probability of finding the bridging H atom near the N atom is higher than that of the O atom side. This estimation is consistent with the fact that the pKa value of 2A3MP is larger than that of PCP as shown in Table 1. The CS simulation of the PCP–2A3MP complex showed four peaks in a CS range of 5–9 ppm and one signal at 2.24 ppm. This result was consistent with the number of signals detected on the 1H-MAS-NMR spectrum of the deuterated complex as displayed in Figure 8. Based on the result of CS simulation, the peaks were assignable to the H atoms of CH3, NH2, 5-H, 4-H, and 6-H of 2A3MP molecule, moving from higher to lower fields. The CS simulation showed a tendency that the CS value of NH2 (blue circle in Figure 10) is shifted to higher field with decreasing the N–H length. It has been well known that a vibration-energy of an N–H bond becomes low by deuterium substitution, and the N–H length is reduced. Limbach et al. have proposed the following relations for H-bonds [33]:
Molecules 18 04786 i006
Molecules 18 04786 i007
Molecules 18 04786 i008
Molecules 18 04786 i009
Molecules 18 04786 i010
Molecules 18 04786 i011
Molecules 18 04786 i012
Molecules 18 04786 i013
Molecules 18 04786 i014
Here, P1 and P2 are bond orders of O–H and N–H, and ri and Molecules 18 04786 i015 
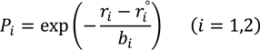
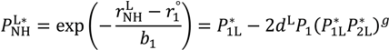
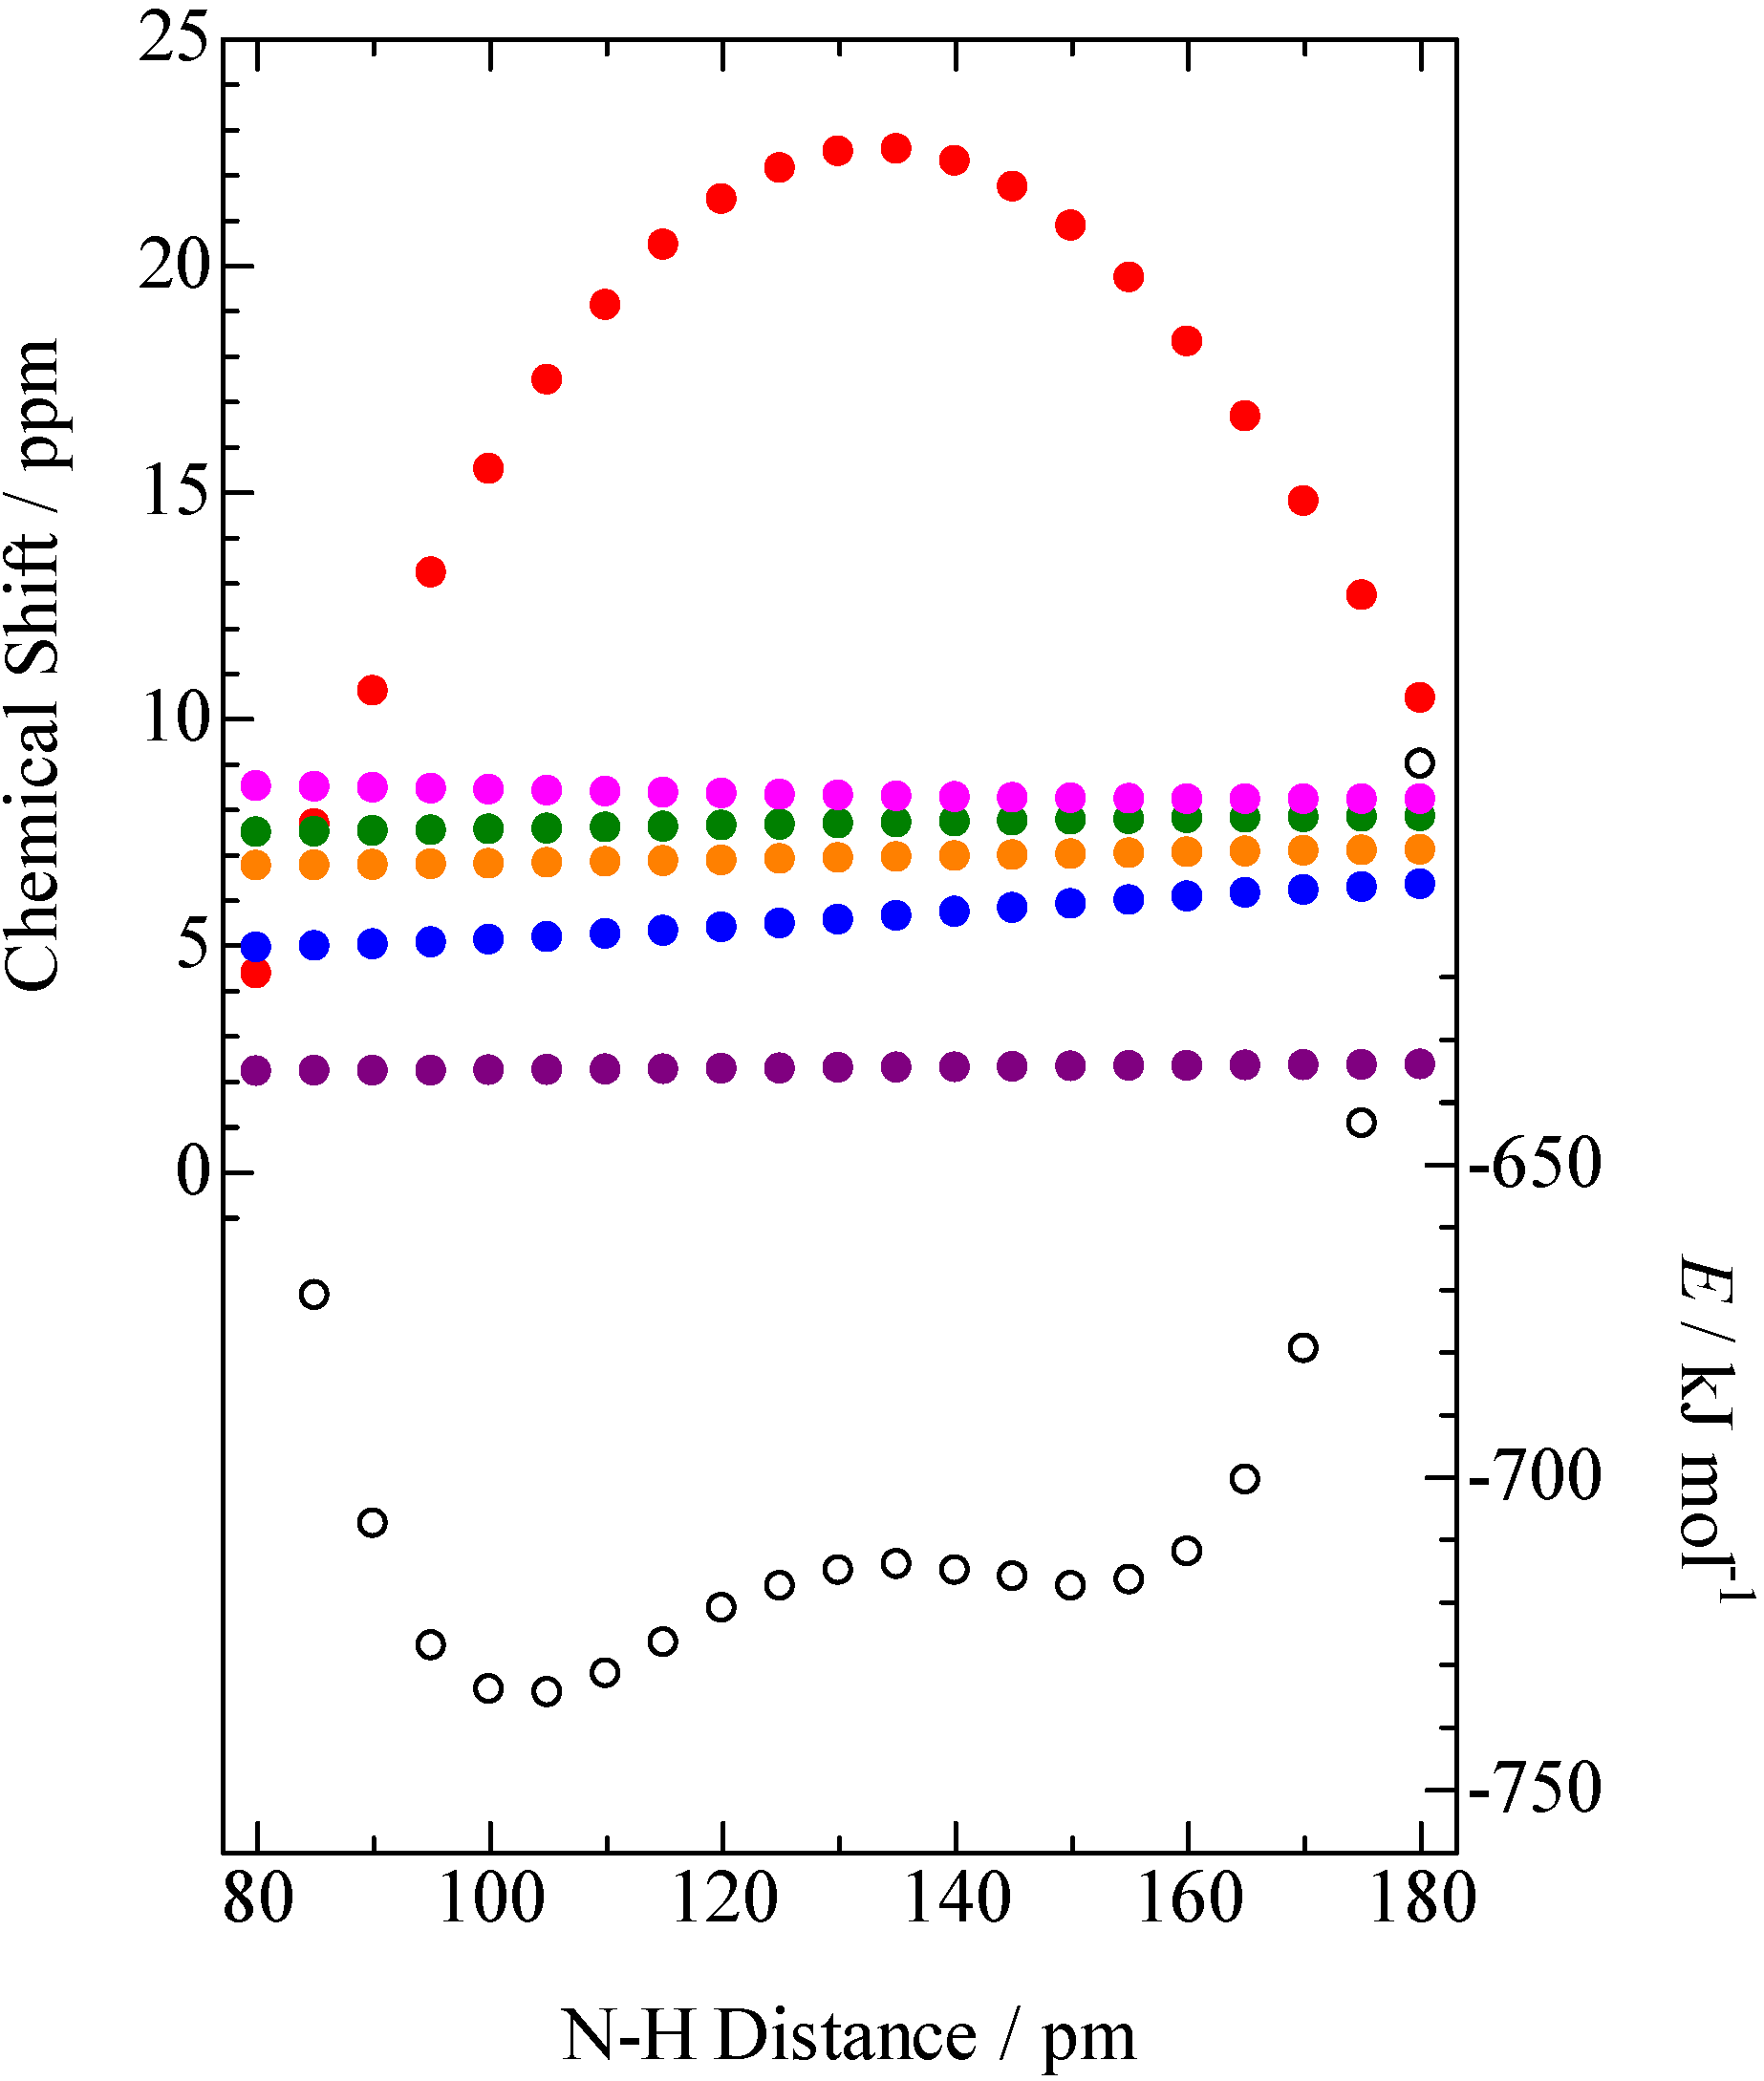
are lengths and equilibrium distances, respectively. The parameter of bi characterizes the decrease of the bond orders with increasing bond separation. Molecules 18 04786 i016 and Molecules 18 04786 i017 are bond orders corrected by anharmonic quantum zero point vibrational effects, where L = H or D. Molecules 18 04786 i018 and Molecules 18 04786 i019 , are modified bond orders of Molecules 18 04786 i016 and Molecules 18 04786 i017 for weak H-bonds. The parameters of CH = 360, CD = 30, f = 5, dH = 0.45, dD = 0.45, g = 2, Molecules 18 04786 i020= 94.2 pm, Molecules 18 04786 i021= 99.2 pm, Molecules 18 04786 i022= 37.1 pm, and Molecules 18 04786 i023
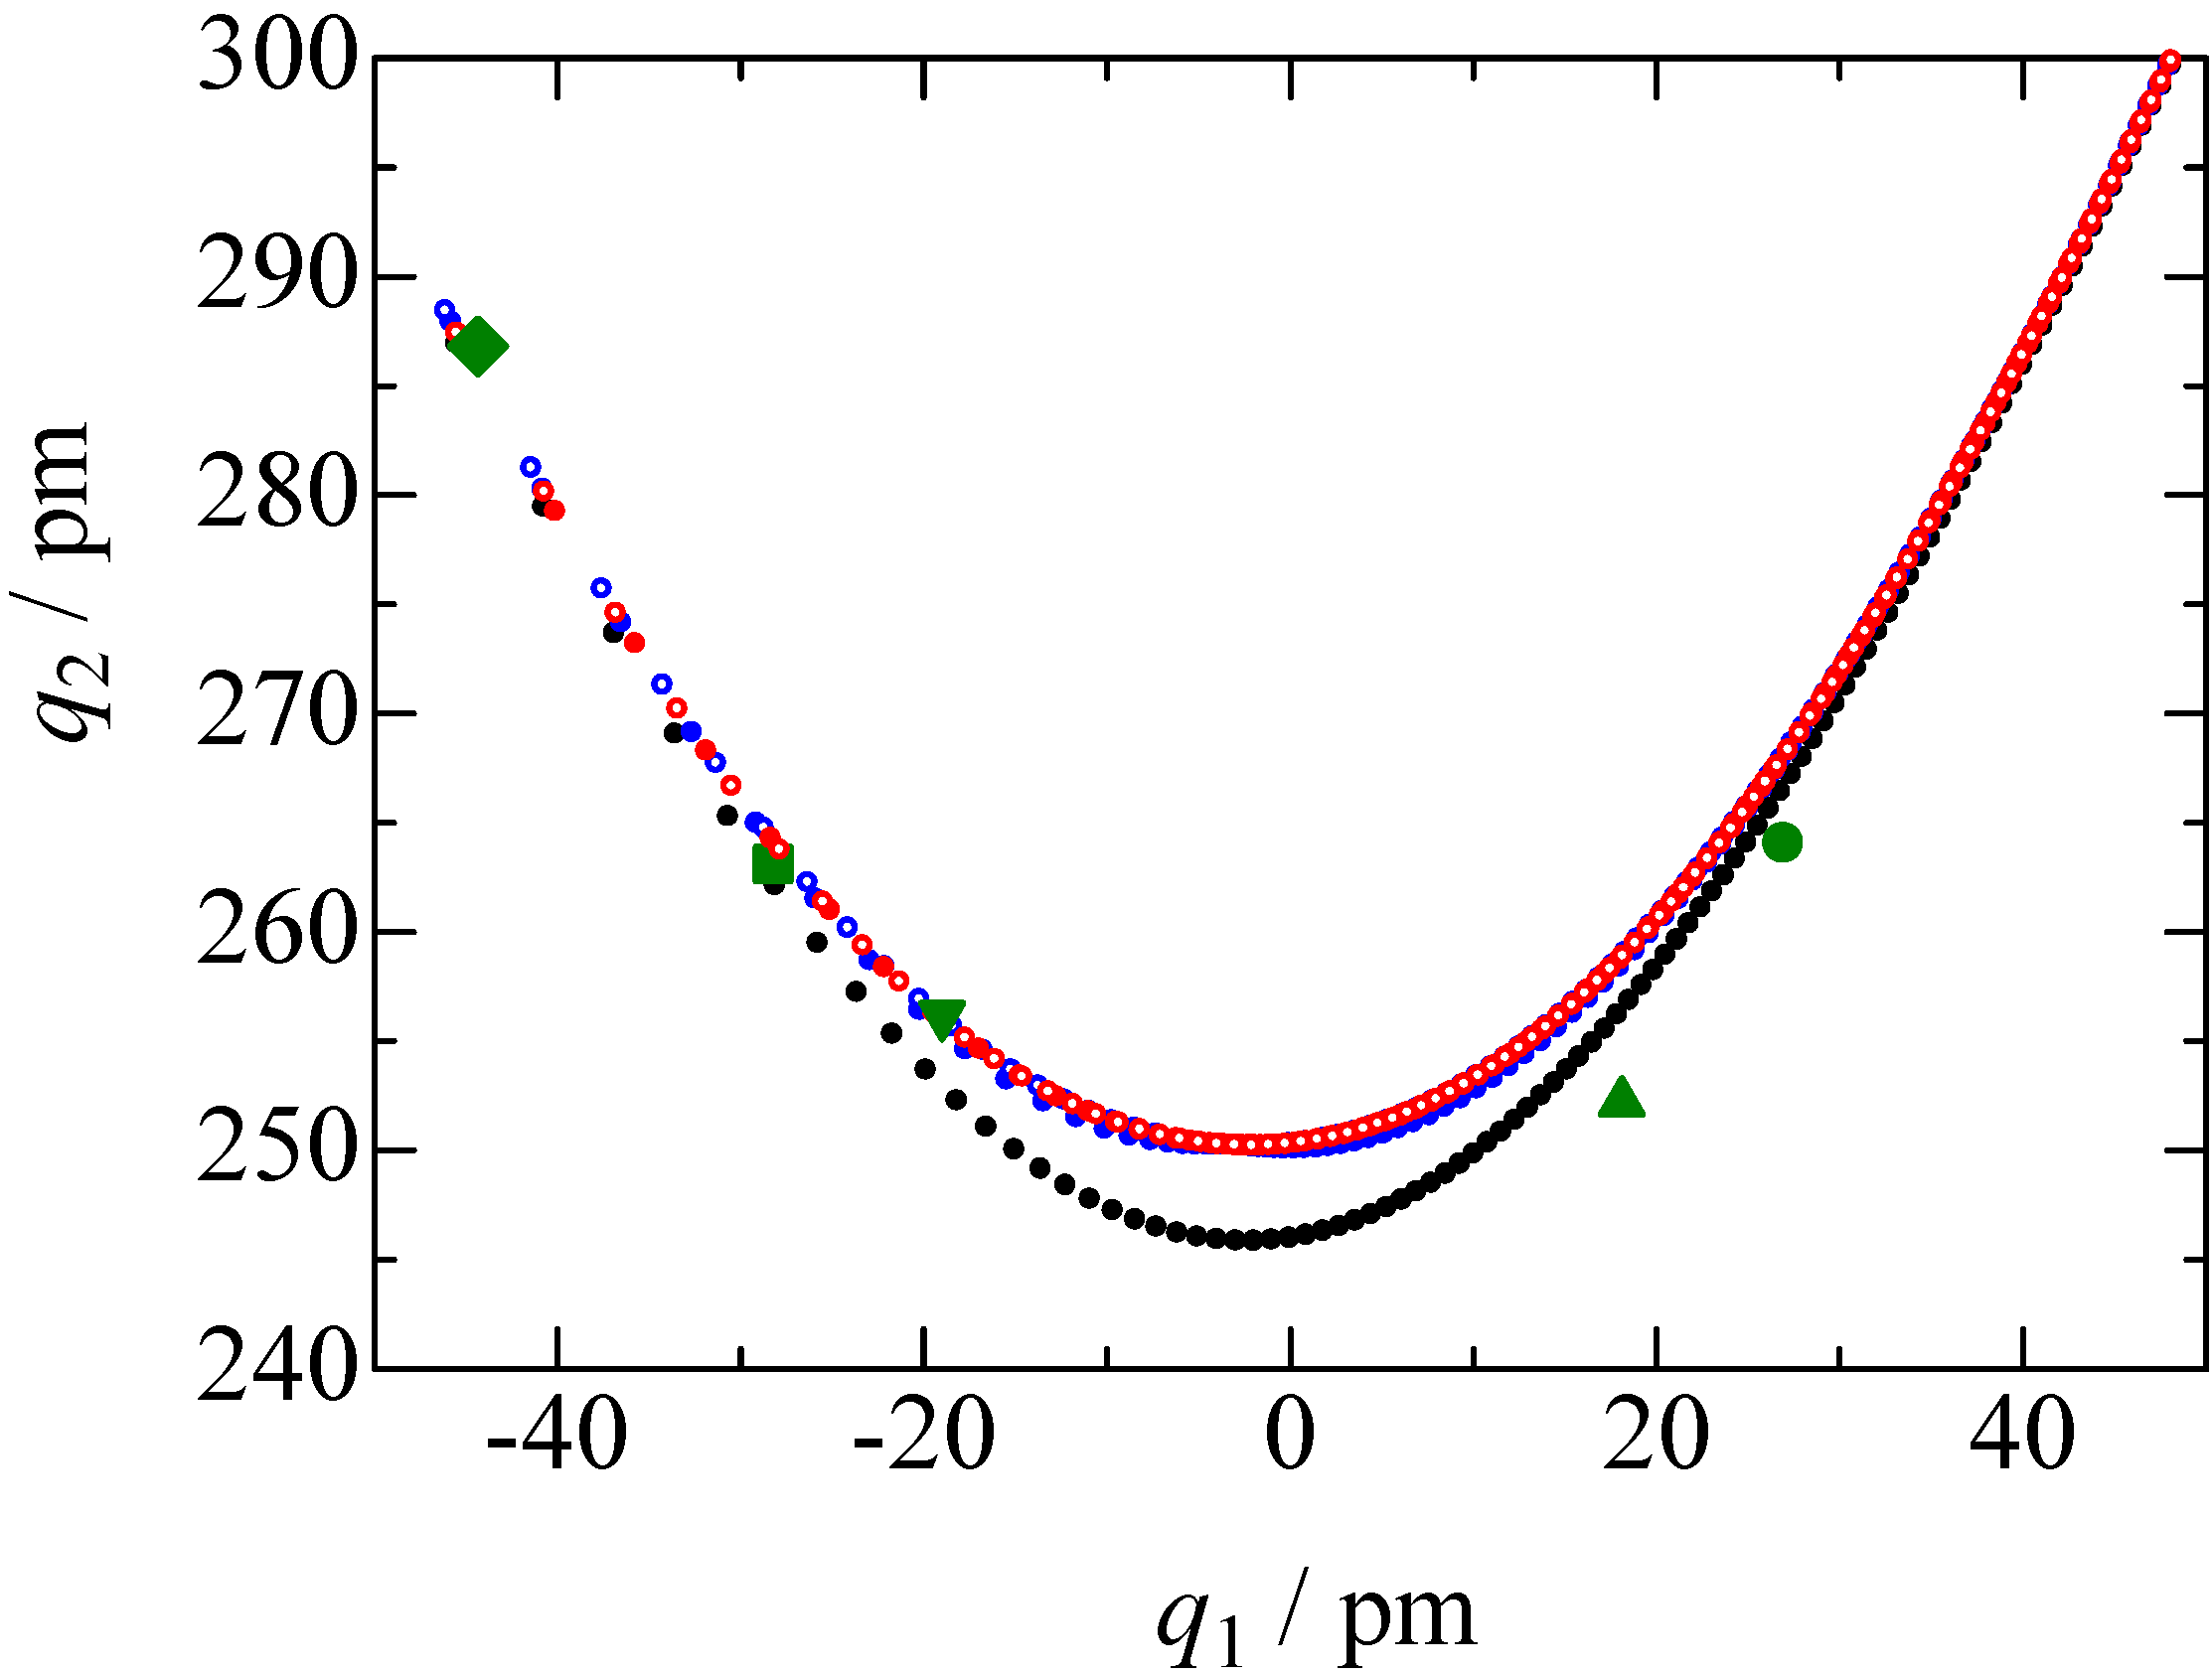
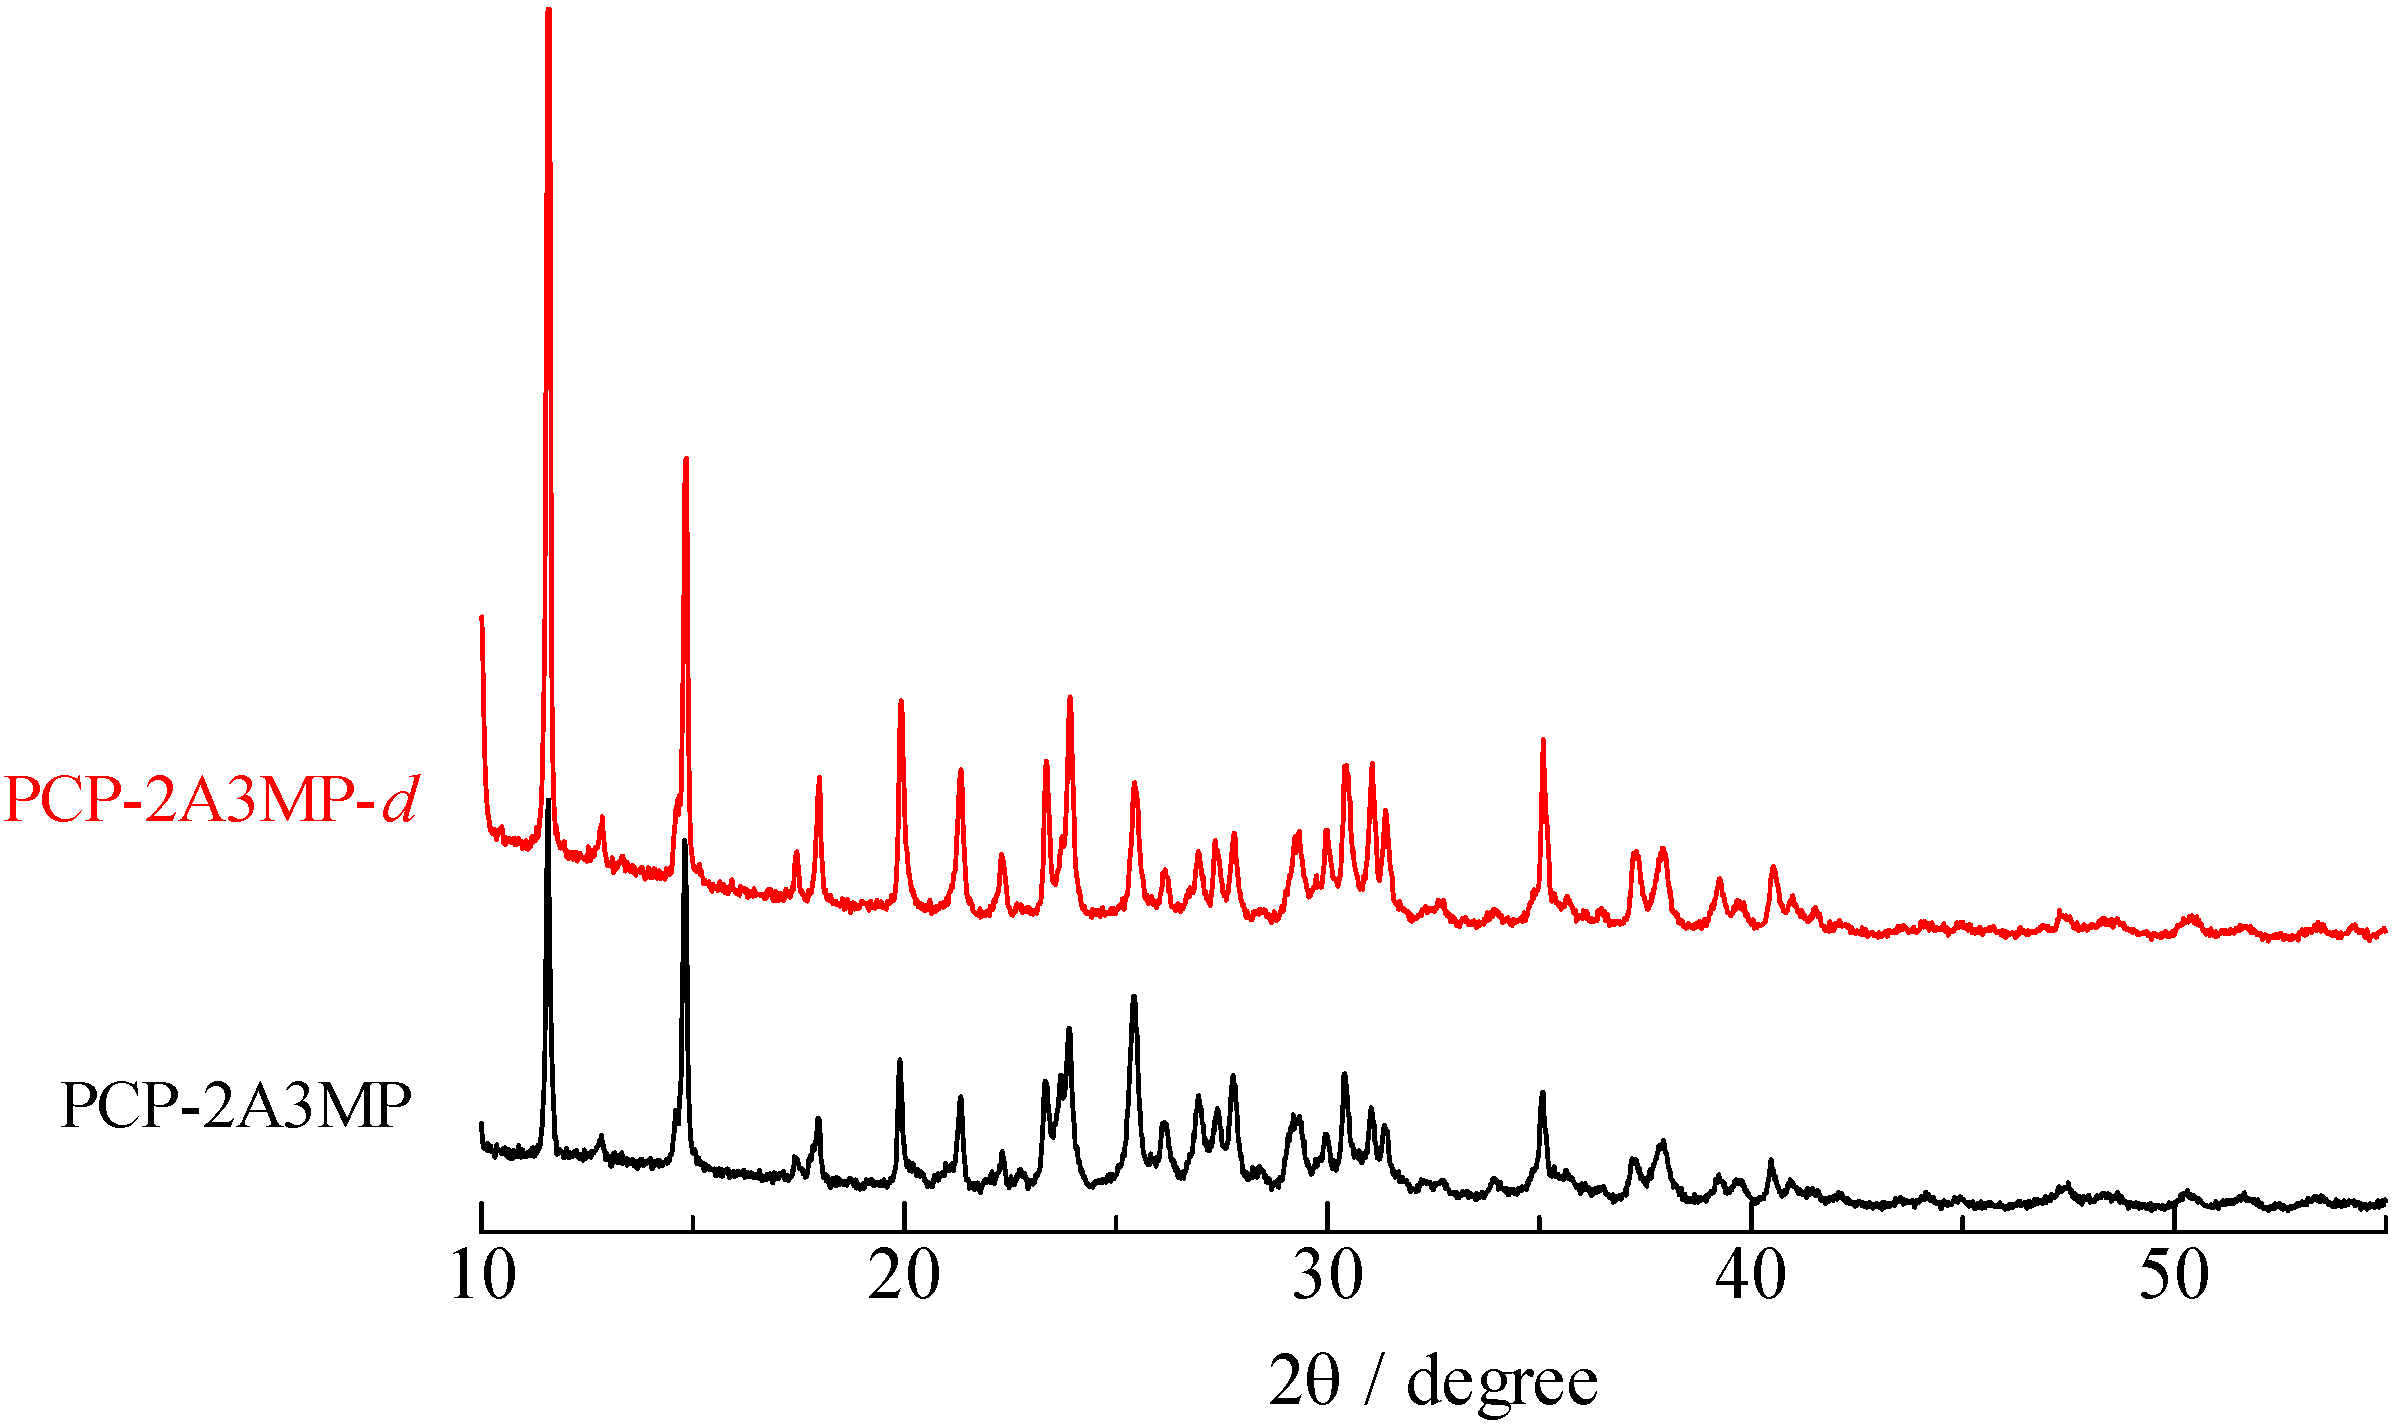
= 38.5 pm have been reported for pyridine – acid complexes [33]. Since Limbach et al. explain H-bond characters well employing the above relations and the parameters, the same calculations were performed for some complexes treated in this study. The obtained data are displayed in Figure 11. In the case of PCP–2A3MP, the q1 and q2 values were located at an area of weak quantum effects as displayed in Figure 11, therefore, it can be considered that the H/D isotope effects on the 1H-MAS-NMR spectrum can be explained by classical quantum models as shown in Figure 10. Based on these results, H/D isotope effects on the 1H-MAS-NMR line-shapes of the PCP–2A3MP-d complex can be explained by shorting the N–D length as compared with the N–H distance.
Figure 10. N–H distance dependences of potential energy and 1H-NMR chemical shift estimated by B3LYP/6-311+G**; potential energy ( Molecules 18 04786 i024), H(NH2) ( Molecules 18 04786 i001), H(CH3) ( Molecules 18 04786 i025), 4-H(p) ( Molecules 18 04786 i003), 5-H(m) ( Molecules 18 04786 i026), 6-H(o) ( Molecules 18 04786 i002), H(N–H···O) ( Molecules 18 04786 i005).
Molecules 18 04786 g010
Figure 11. H-bond correlations of O···H···N (q1 and q2 are H-bond coordinates defined by equation (6)). The black dots were calculated by eq. (1) and (5) (classical model), blue circles were estimated by equations (1) and (4) ( Molecules 18 04786 i001=H) and ( Molecules 18 04786 i027=D) (anharmonic quantum zero point vibration model), and red circles were demonstrated by combination of equation (1) to (3) ( Molecules 18 04786 i028=H) and (○=D) (modified quantum model). The green-colored symbols refer to PCP–2A3MP ( Molecules 18 04786 i003), PCP–3CP ( Molecules 18 04786 i029), PCP–4DMAP ( Molecules 18 04786 i030), PCP–4MP ( Molecules 18 04786 i031), and PCP–TEA ( Molecules 18 04786 i032).
Molecules 18 04786 g011

3. Experimental

Crude crystals were obtained by mixing equimolar amounts of PCP, TCP, 26DCP, 35DCP, and pCP, and N-Bases in acetonitrile. The samples were recrystallized by slow evaporation of the CH3CN solvent. Some crystals could be prepared, however, some samples showed gel or liquid states at room temperature. Deuterium samples were prepared by the following procedure: PCP was dissolved in NaOH aqueous solution, and the sodium salts were obtained by evaporating H2O. By adding the sodium salt into DCl deuterium solution, PCP-d crystals were gained. Preparing the deuterated complexes were attempted using the same process described above under N2 atmosphere, beginning with PCP-d instead of PCP. The same recipe was applied to TCP, 26DCP, 35DCP, and pCP for preparing deuterated complexes. Some PCP and TCP crystals could be prepared, however, many complexes were hardly crystallized after deuterium substitution.
Solid-state high-resolution 1H-MAS-NMR experiments were carried out at a Larmor frequency of 600.13 MHz with a Bruker Avance 600 spectrometer. The sample was packed in a ZrO rotor with an outer diameter of 2.5 mm and a spinning rate was kept at 30 kHz through the acquisition of free-induction-decay (FID) signals. Spectra were obtained from FID signals observed after a π/2 pulse. 1H CS values were calibrated by external reference of adamantane (δ = 1.91 ppm); in a case of TCP complexes, inner reference of silicon rubber was employed. Recycle time of 5 s was used for normal and deuterium substituted crystals. Sample temperature was controlled by a Bruker VT-3000 variable-temperature unit and estimated from 207Pb-NMR chemical sift of Pb(NO3)2 crystals [47].
13C-CP/MAS-NMR spectra measurements were carried out at a Larmor frequency of 150.92 MHz with the same spectrometer as 1H measurements. The samples were packed in a rotor with an outer diameter of 4.0 mm ZrO rotor. A ramp pulse sequence [48] was employed for recording the spectra with a spinning rate of 12 kHz. The CS of the 13C nuclei was calibrated by an external adamantane (δ = 29.47 ppm) reference. CP/MAS spectra were recorded with a contact time of 1.0 ms.
XRD powder patterns were obtained using a Bruker D8 ADVANCE equipped with a Cu anticathode. Spectra were recorded using a scan range of 10°–40° with a step angle of 0.02°.
Density-functional-theory (DFT) calculations were carried out using the Gaussian 03 computer program [46] to estimate the potential curve and theoretical values of shielding tensor of 1H and 13C nuclei.

4. Conclusions

CS values of 1H nuclei forming hydrogen bonding were observed in phenols (PCP, TCP, 26DCP, 35DCP, and pCP)–N-Base complexes by use of solid-state high-resolution 1H-MAS-NMR with a MAS speed of 30 kHz. The CS values assigned to the bridging H atoms in these crystals were gradually increased with the pKa values of N-Bases in the range of ΔpKa < 0 (ΔpKa = pKa(N-Base) - pKa(chlorophenols)) and successively decreased in ΔpKa > 2; the maximum CS values was obtained in the PCP (pKa = 5.26)–4MP (6.03), TCP(6.59)–IMID(6.99), 26DCP(7.02)–2A4MP(7.38), 35DCP(8.04)–4DMAP(9.61), and pCP(9.47)–4DMAP(9.61) complexes. The result obtained in the PCP complexes is consistent with the inversion point of 35Cl NQR frequencies [12,28]. In PCP–4MP, a proton transfer and isotope polymorphism have been reported [12,28,29,30,31,32,33,34,35,36,37,38,39,40]. Since the large 1H-NMR CS value of 18.6 ppm was recorded in TCP–IMID as compared with 17.8 ppm of PCP–4MP, it can be expected that the similar properties are obtained in TCP–IMID. Although pKa values of N-Bases are determined in aqueous solution, pKa dependences of 1H-NMR CS values were detected in solids of the complexes. This fact suggests that we can roughly predict electron densities of bridging H atoms in solid samples by comparing pKa values of acids and bases. This result can be obtained by 1H MAS NMR measurements. In addition, H/D isotope effects on 1H-MAS-NMR spectra were detected in PCP–2A3MP. Based on the results of CS simulation using a B3LYP/6-311+G** function, it can be explained that a little changes of the N–H length in H-bond contribute to the H/D isotope shift of the 1H-MAS-NMR peaks.

Acknowledgments

The author is grateful to Mr. Kentarou Hayashi and Mr. Masaaki Okamoto of Yokohama City University for their assistance.

References

  1. Jeffrey, G.A. An Introduction to Hydrogen Bonding; Oxford University Press: New York, NY, USA, 1997. [Google Scholar]
  2. Scheiner, S. Hydrogen Bonding; Oxford University Press: New York, NY, USA, 1997. [Google Scholar]
  3. Marechal, Y. The Hydrogen Bond and the Water Molecule; Elsevier: Amsterdam, The Netherlands, 2007. [Google Scholar]
  4. Matsushita, E.; Matsubara, T. Note on isotope effect in hydrogen bonded crystals. Prog. Theo. Phys. 1982, 67, 1–19. [Google Scholar] [CrossRef]
  5. Blinc, R.; Mali, M.; Trontelj, Z. 35Cl and 37Cl quadrupole resonance in normal and deuterated KH(CCl3COO)2 and NH4(CCl3COO)2. Phys. Lett. A 1967, 25, 289–290. [Google Scholar] [CrossRef]
  6. Pies, W.; Weiss, A. Advances in Nuclear Quadrupole Resonance; Heyden: London, UK, 1974; Volume 1, pp. 57–70. [Google Scholar]
  7. Lynch, R.J.; Waddington, T.C.; O’Shea, T.A.; Smith, J.A.S. Investigation of the hydrogen bonding in chlorocarboxylate anions using 35Cl quadrupole resonance spectroscopy. J. Chem. Soc. Faraday Trans. 2 1976, 72, 1980–1990. [Google Scholar] [CrossRef]
  8. Borchers, D.; Weiss, A. Structure, hydrogen bonds and phase transition in ethylenediammonium hexachlorometallates, [H3N(CH2)2NH3]2+ [XCl6]2−, X = tin, lead, tellurium,and platinum A chlorine-35 x-ray diffraction study. Ber. Bunsen-Gesellschaft 1986, 90, 718–725. [Google Scholar]
  9. Shirley, W.M. Nuclear quadrupole resonance studies of hydrogen bonding in trans-dichlorobis(ethylenediamine)cobalt(III) diaquahydrogen chloride. Spectrochim. Acta Part A 1987, 43A, 565–568. [Google Scholar] [CrossRef]
  10. Sasane, A.; Shinohara, H.; Mori, Y.; Kume, Y.; Asaji, T.; Nakamura, D. A temperature dependence study of chlorine-35 nuclear quadrupole resonance frequencies in some hexachloroplatinate(IV) hexahydrates. Z Naturforschung A 1987, 42, 611–616. [Google Scholar]
  11. Mackowiak, M.; Koziol, P. Effect of pressure on the symmetric hydrogen bond in (CCI3COO)2HK. Physica Status Solidi A Appl. Res. 1988, 108, 739–745. [Google Scholar] [CrossRef]
  12. Kalenik, J.; Majerz, I.; Malarski, Z.; Sobczyk, L. Isotopic effect on 35Cl NQR spectra of pentachlorophenol-amine hydrogen-bonded complexes. Chem. Phys. Lett. 1990, 165, 15–18. [Google Scholar] [CrossRef]
  13. Horiuchi, K. Temperature dependence of the effect of deuteriation on the chlorine-35 quadrupole resonance frequency in an Mg(H2O)6SnCl6 crystal. J. Chem. Soc. Faraday Trans. 1993, 89, 3359–3362. [Google Scholar] [CrossRef]
  14. Zdanowska-Fraczek, M. 35Cl NQR study of geometric isotope effect in hydrogen bonded chlorooctanes. J. Mol. Struct. 1994, 321, 53–56. [Google Scholar] [CrossRef]
  15. Zdanowska-Fraczek, M. NQR studies of charge distribution in hydrogen-bonded chloroacetates. Ber. Bunsen-Gesellschaft 1998, 102, 340–343. [Google Scholar]
  16. Honda, H. Even-Odd Effect of 35Cl Quadrupole Coupling Constants in Solid n-Alkylammonium Chlorides (C5–C10). Z. Naturforschung A 2003, 58, 623–630. [Google Scholar]
  17. Nakano, R.; Honda, H.; Kimura, T.; Nakata, E.; Takamizawa, S.; Noro, S.; Ishimaru, S. Anomalous H/D Isotope Effect on 35Cl NQR frequencies in piperidinium p-Chlorobenzoate. Hyperfine Interact. 2008, 181, 59–68. [Google Scholar] [CrossRef]
  18. Nakano, R.; Honda, H.; Kimura, T.; Kyo, S.; Ishimaru, S.; Miyake, R.; Nakata, E.; Takamizawa, S.; Noro, S. Anomalous H/D isotope effect on 35Cl NQR frequencies and h/d isotope effect on 1H MAS NMR Spectra in pyrrolidinium p-chlorobenzoate. Bull. Chem. Soc. Jpn. 2010, 83, 1019–1029. [Google Scholar] [CrossRef]
  19. Honda, H.; Kyo, S.; Akaho, Y.; Takamizawa, S.; Terao, H. H/D isotope effect of 1H MAS NMR spectra and 79Br NQR frequencies of piperidinium p-bromobenzoate and pyrrolidinium p-bromobenzoate. Hyperfine Interact. 2011, 197, 275–285. [Google Scholar]
  20. Kashino, S.; Sumida, Y.; Haisa, M. The crystal and molecular structures of the 1:1 addition compounds of piperidine with p-bromobenzoic acid and p-chlorobenzoic acid. Acta Cryst. B 1972, 28, 1374–1383. [Google Scholar] [CrossRef]
  21. Kashino, S.; Kataoka, S.; Haisa, M. The crystal and molecular structures of pyrrolidinium p-chlorobenzoate and pyrrolidinium p-toluate. Bull. Chem Soc. Jpn. 1978, 51, 1717–1722. [Google Scholar] [CrossRef]
  22. Hansen, P.E.; Bolvig, S.; Wozniak, K. Steric compression and twist in o-hydroxy acyl aromatics with intramolecular hydrogen bonding. J. Mol. Struct. 2005, 749, 155–168. [Google Scholar] [CrossRef]
  23. Hansen, P.E. Isotope effect on chemical shifts in hydrogen-bonded systems. J. Labelled Compd. Radiopharm. 2007, 50, 967–981. [Google Scholar] [CrossRef]
  24. Nguyen, T.T.; Le, T.N.; Duus, F.; Hansen, B.K. V.; Hansen, P.E. Intramolecular hydrogen bonding of novel o-hydroxythioacetophenones and related compounds evaluated by deuterium isotope effects on 13C chemical shifts. Magn. Reson. Chem. 2007, 45, 245–252. [Google Scholar] [CrossRef]
  25. Hofmann, J.P.; Duus, F.; Bond, A.D.; Hansen, P.E. A spectrochemometric approach to tautomerism and hydrogen-bonding in 3-acyltetronic acids. J. Mol. Struct. 2006, 790, 80–88. [Google Scholar] [CrossRef]
  26. Hansen, P.E.; Kamounah, F.S.; Hansen, B.K. V.; Spanget-Larsen, J. Conformational and tautomeric eccentricities of 2-acetyl-1,8-dihydroxynaphthalenes. Magn. Reson. Chem. 2007, 45, 106–117. [Google Scholar] [CrossRef]
  27. Nakano, R.; Honda, H.; Ishimaru, S.; Noro, S. 1H MAS, 13C CP/MAS, and 2H NMR spectra studies of piperidinium p-chlorobenzoate. Hyperfine Interact. 2012. [Google Scholar] [CrossRef]
  28. Grech, E.; Kalenik, J.; Sobczyk, L. 35Cl nuclear quadruplore resonance studies of pentachlorophenol-amine hydrogen-bonded complexes. J. Chem. Soc. Faraday 1979, 75, 1587–1592. [Google Scholar] [CrossRef]
  29. Steiner, T.; Majerz, I.; Wilson, C.C. First O–H–N Hydrogen bond with a centered proton obtained by thermally induced proton migration. Angew. Chem. Int. Ed. 2001, 40, 2651–2654. [Google Scholar] [CrossRef]
  30. Steiner, T.; Wilson, C.C.; Majerz, I. Neutron diffraction study of a very short O–H···N hydrogen bond: Crystalline adduct of 2-methylpyridine and pentachlorophenol. Chem. Commun. 2000, 1231–1232. [Google Scholar] [CrossRef]
  31. Malarski, Z.; Majerz, I.; Lis, T. The crystal structures at 80 K and IR spectra of the complex of 4-methylpyridine with pentachlorophenol and its deuterated analogue. J. Mol. Struct. 1996, 380, 249–256. [Google Scholar] [CrossRef]
  32. Majerz, I.; Malarski, Z.; Lis, T. An unusual geometrical and spectroscopic isotopic effect in the solid complex of 4-methylpyridine with pentachlorophenol. J. Mol. Struct. 1990, 240, 47–58. [Google Scholar] [CrossRef]
  33. Ip, B.C.K.; Shenderovich, I.G.; Tolstoy, P.M.; Frydel, J.; Denisov, G.S.; Buntkowsky, G.; Limbach, H. NMR studies of solid pentachlorophenol-4-methylpyridine complexes exhibiting strong OHN hydrogen bonds: Geometric H/D isotope effects and hydrogen bond coupling cause isotopic polymorphism. J. Phys. Chem. A 2012, 116, 11370–11387. [Google Scholar]
  34. Zhou, J.; Kye, Y.; Harbison, G.S. Isotopometric polymorphism. J. Am. Chem. Soc. 2004, 126, 8392–8393. [Google Scholar] [CrossRef]
  35. Majerz, I.; Olovsson, I. Influence of proton transfer degree on the potential energy surface for two very short hydrogen bonds. Acta Chim. Slov. 2011, 58, 379–384. [Google Scholar]
  36. Zhou, J.; Kye, Y.; Kolesnikov, A.I.; Harbison, G.S. Origins of isotopomeric polymorphism. Isotopes Environ. Health Stud. 2006, 42, 271–277. [Google Scholar] [CrossRef]
  37. Limbach, H.; Pietrzak, M.; Sharif, S.; Tolstoy, P.M.; Shenderovich, I.G.; Smirnov, S.N.; Golubev, N.S.; Denisov, G.S. NMR parameters and geometries of ohn and odn hydrogen bonds of pyridine-acid complexes. Chem. Euro. J. 2004, 10, 5195–5204. [Google Scholar] [CrossRef]
  38. Koll, A.; Majerz, I. Internal and external implications of the structure of hydrogen bonded complexes. II. MNDO-PM3 studies on the structure of the 4-methylpyridine complex with pentachlorophenol. Bull. Soc. Chim. Belg. 1994, 103, 629–640. [Google Scholar]
  39. Majerz, I.; Sobczyk, L. UV Absorption spectra of pentachlorophenol and amine hydrogen bonded complexes in the solid state. J. Chim. Phys. Phys. Chim. Biolog. 1993, 90, 1657–1666. [Google Scholar]
  40. Habeeb, M.M. Interaction site and proton transfer equilibrium in the 4-aminoantipyrine-pentaclorophenol hydrogen-bonded adduct. J. Chem. Res. (S) 2002, 255–256. [Google Scholar]
  41. Malarski, Z.; Majerz, I.; Lis, T. Structure and spectroscopic properties of the 1:1 complex of 2-methylpyridine with pentachlorophenol. J. Mol. Struct. 1987, 158, 369–377. [Google Scholar] [CrossRef]
  42. Malarski, Z.; Majerz, I.; Lis, T. Structure of the 1:1 complex of 3-pyridinecarbonitrile with pentachlorophenol. Acta Cryst. 1987, C43, 1766–1769. [Google Scholar]
  43. Majerz, I.; Malarski, Z.; Dobrowolska, S. Structure and IR spectroscopic behavior of the molecular complex of 4-acetylpyridine with pentachlorophenol. J. Mol. Struct. 1991, 249, 109–116. [Google Scholar] [CrossRef]
  44. Majerz, I.; Koll, A. Internal and external implications of the structure of hydrogen bonded complexes. I. MNDO-PM3 and AM1 studies on structure of 4-acethylpyridine complex with pentaclorophenol. Polish J. Chem. 1994, 68, 2109–2119. [Google Scholar]
  45. Schmidtmann, M.; Wilson, C.C. Hydrogen transfer in pentachlorophenol-dimethylpyridine complexes. CrstEngComm 2008, 10, 177–183. [Google Scholar] [CrossRef]
  46. Frisch, M.J.; Trucks, G.W.; Schlegel, H.B.; Scuseria, G.E.; Robb, M.A.; Cheeseman, J.R.; Montgomery, J.A., Jr.; Vreven, T.; Kudin, K.N.; Burant, J.C.; et al. Gaussian 03; Revision B.04; Gaussian, Inc.: Pittsburgh, PA, USA, 2003. [Google Scholar]
  47. Guan, X.; Stark, R.E. A general protocol for temperature calibration of MAS NMR probes at arbitrary spinning speeds. Solid State Nucl. Magn. Reson. 2010, 38, 74–76. [Google Scholar] [CrossRef]
  48. Metz, G.; Wu, X.; Smith, S.O. Ramped-amplitude cross polarization in magic-angle-spinning NMR. J. Magn. Reson. Ser. A 1994, 110, 219–227. [Google Scholar] [CrossRef]
  • Sample Availability: Not available.

