2.2. rVAA-I Induced SMMC7721 Cell Death
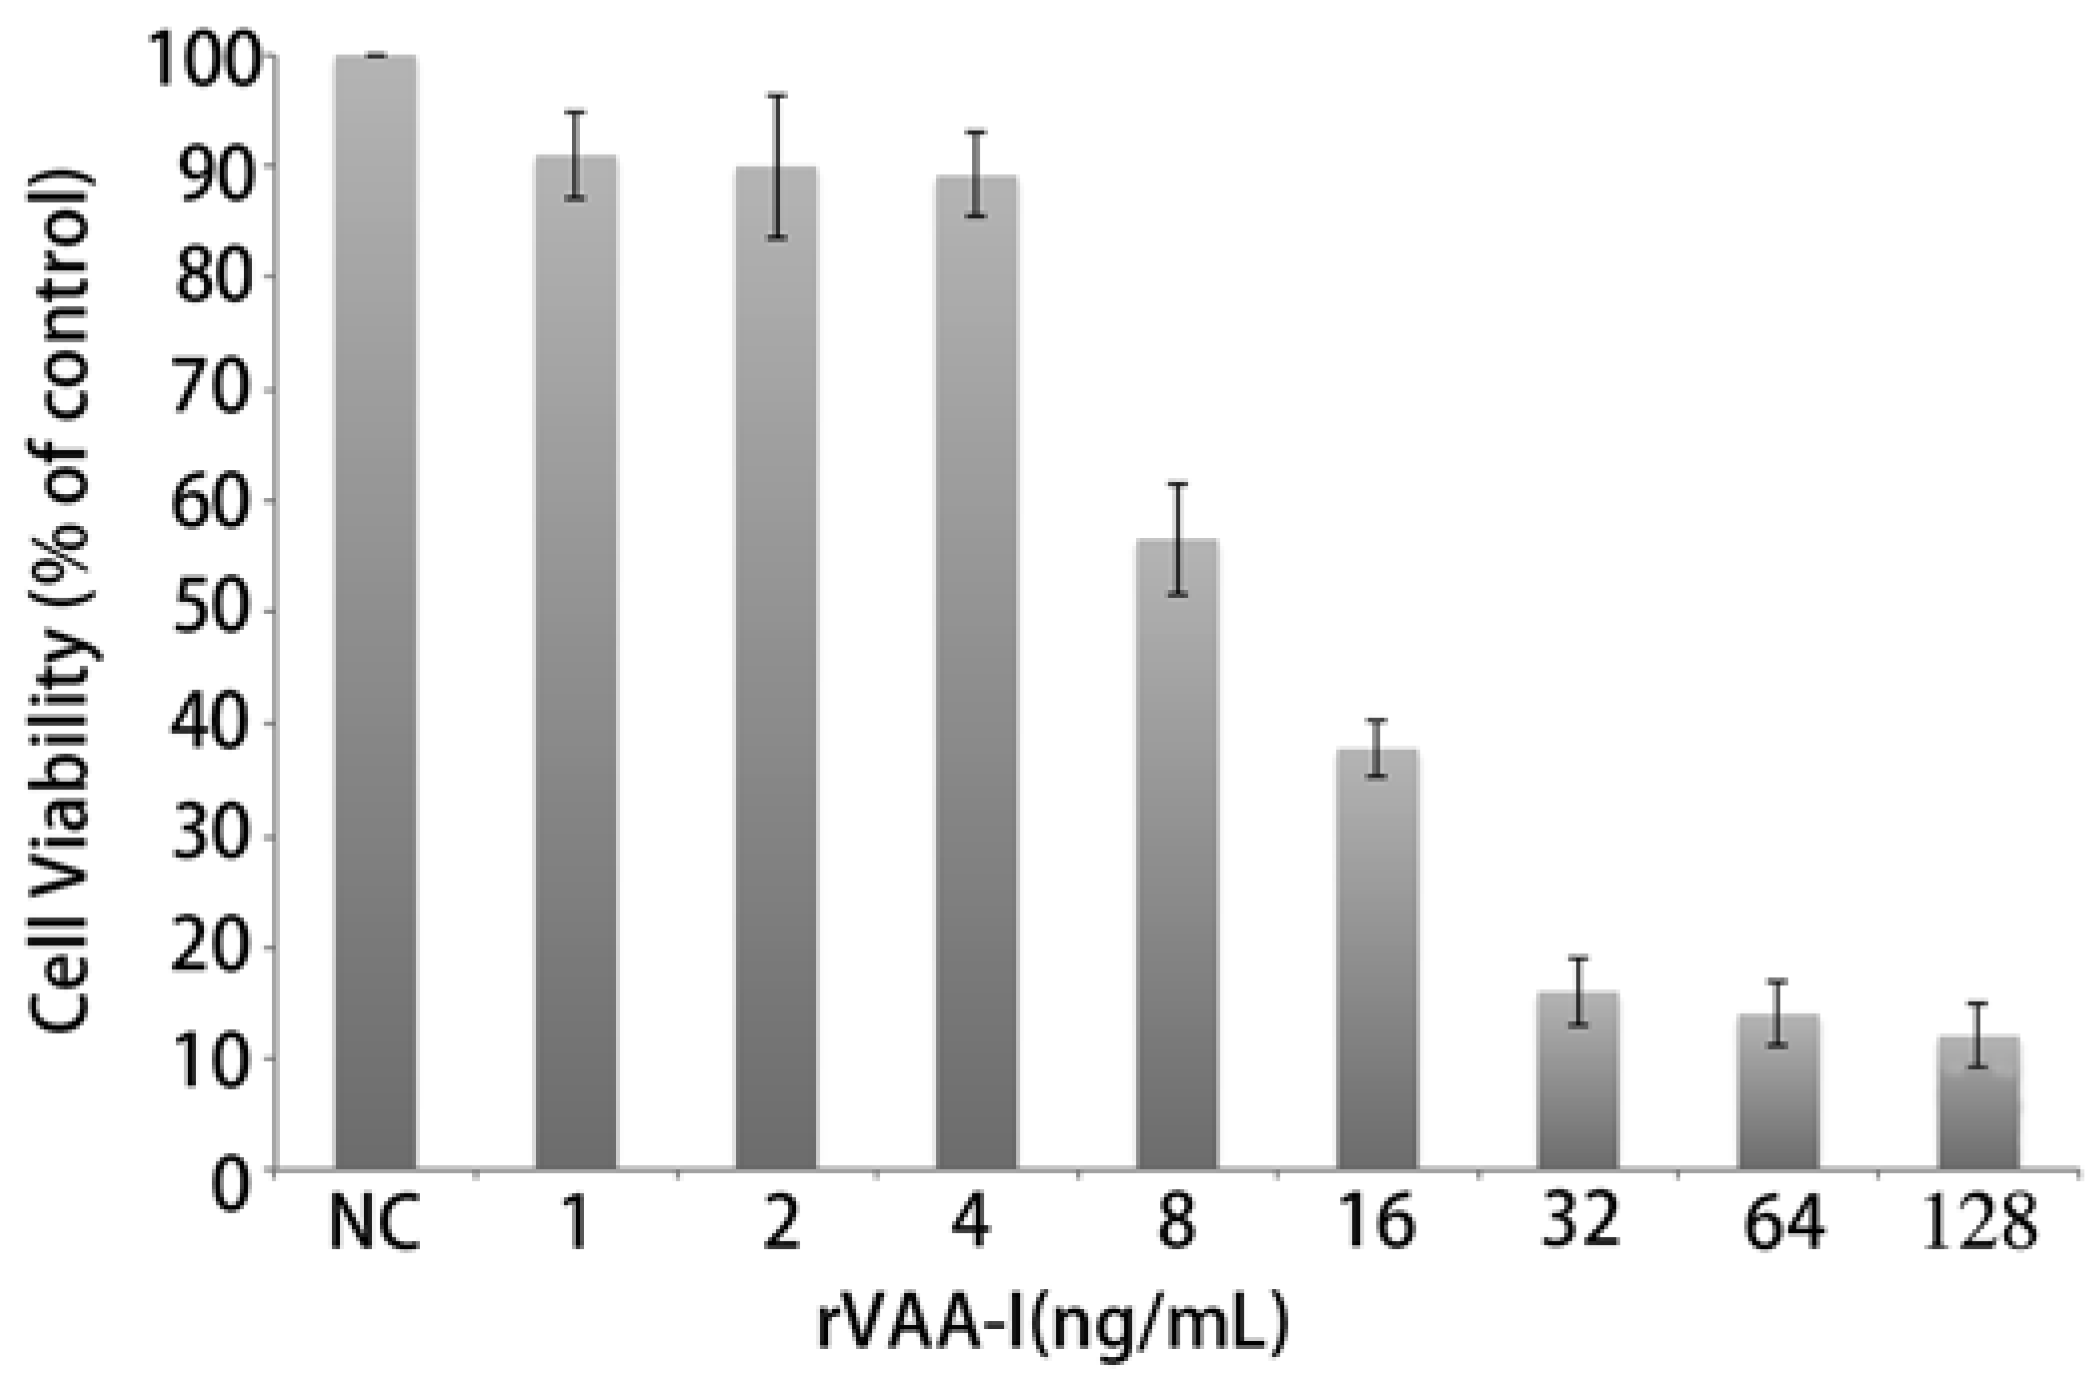
Microscopic observations revealed that rVAA-I had a very distinct killing effect on SMMC7721 cells. In addition, the MTT assays showed that addition of rVAA-I (1.0, 2.0, 4.0, 8.0, 16.0, 32.0, 64.0 and 128.0 ng/mL) decreased cell viability of SMMC7721 cells in a dose- and time-dependent manner. SMMC7721 cells were incubated with various concentrations of rVAA-I for 24 h and then the MTT assay was performed to determine the depressive effect of rVAA-I on cell viability (
Figure 2). Slight inhibition of viability was detected in cells exposed to 8 ng/mL of rVAA-I, whereas cell viability was markedly inhibited in cells treated with 16.0 ng/mL of rVAA-I. These data showed that rVAA-I inhibited SMMC7721 cell viability in a dose- and time- dependent way, with IC50 at 24 h of 16 ng/mL [
10].
Figure 1.
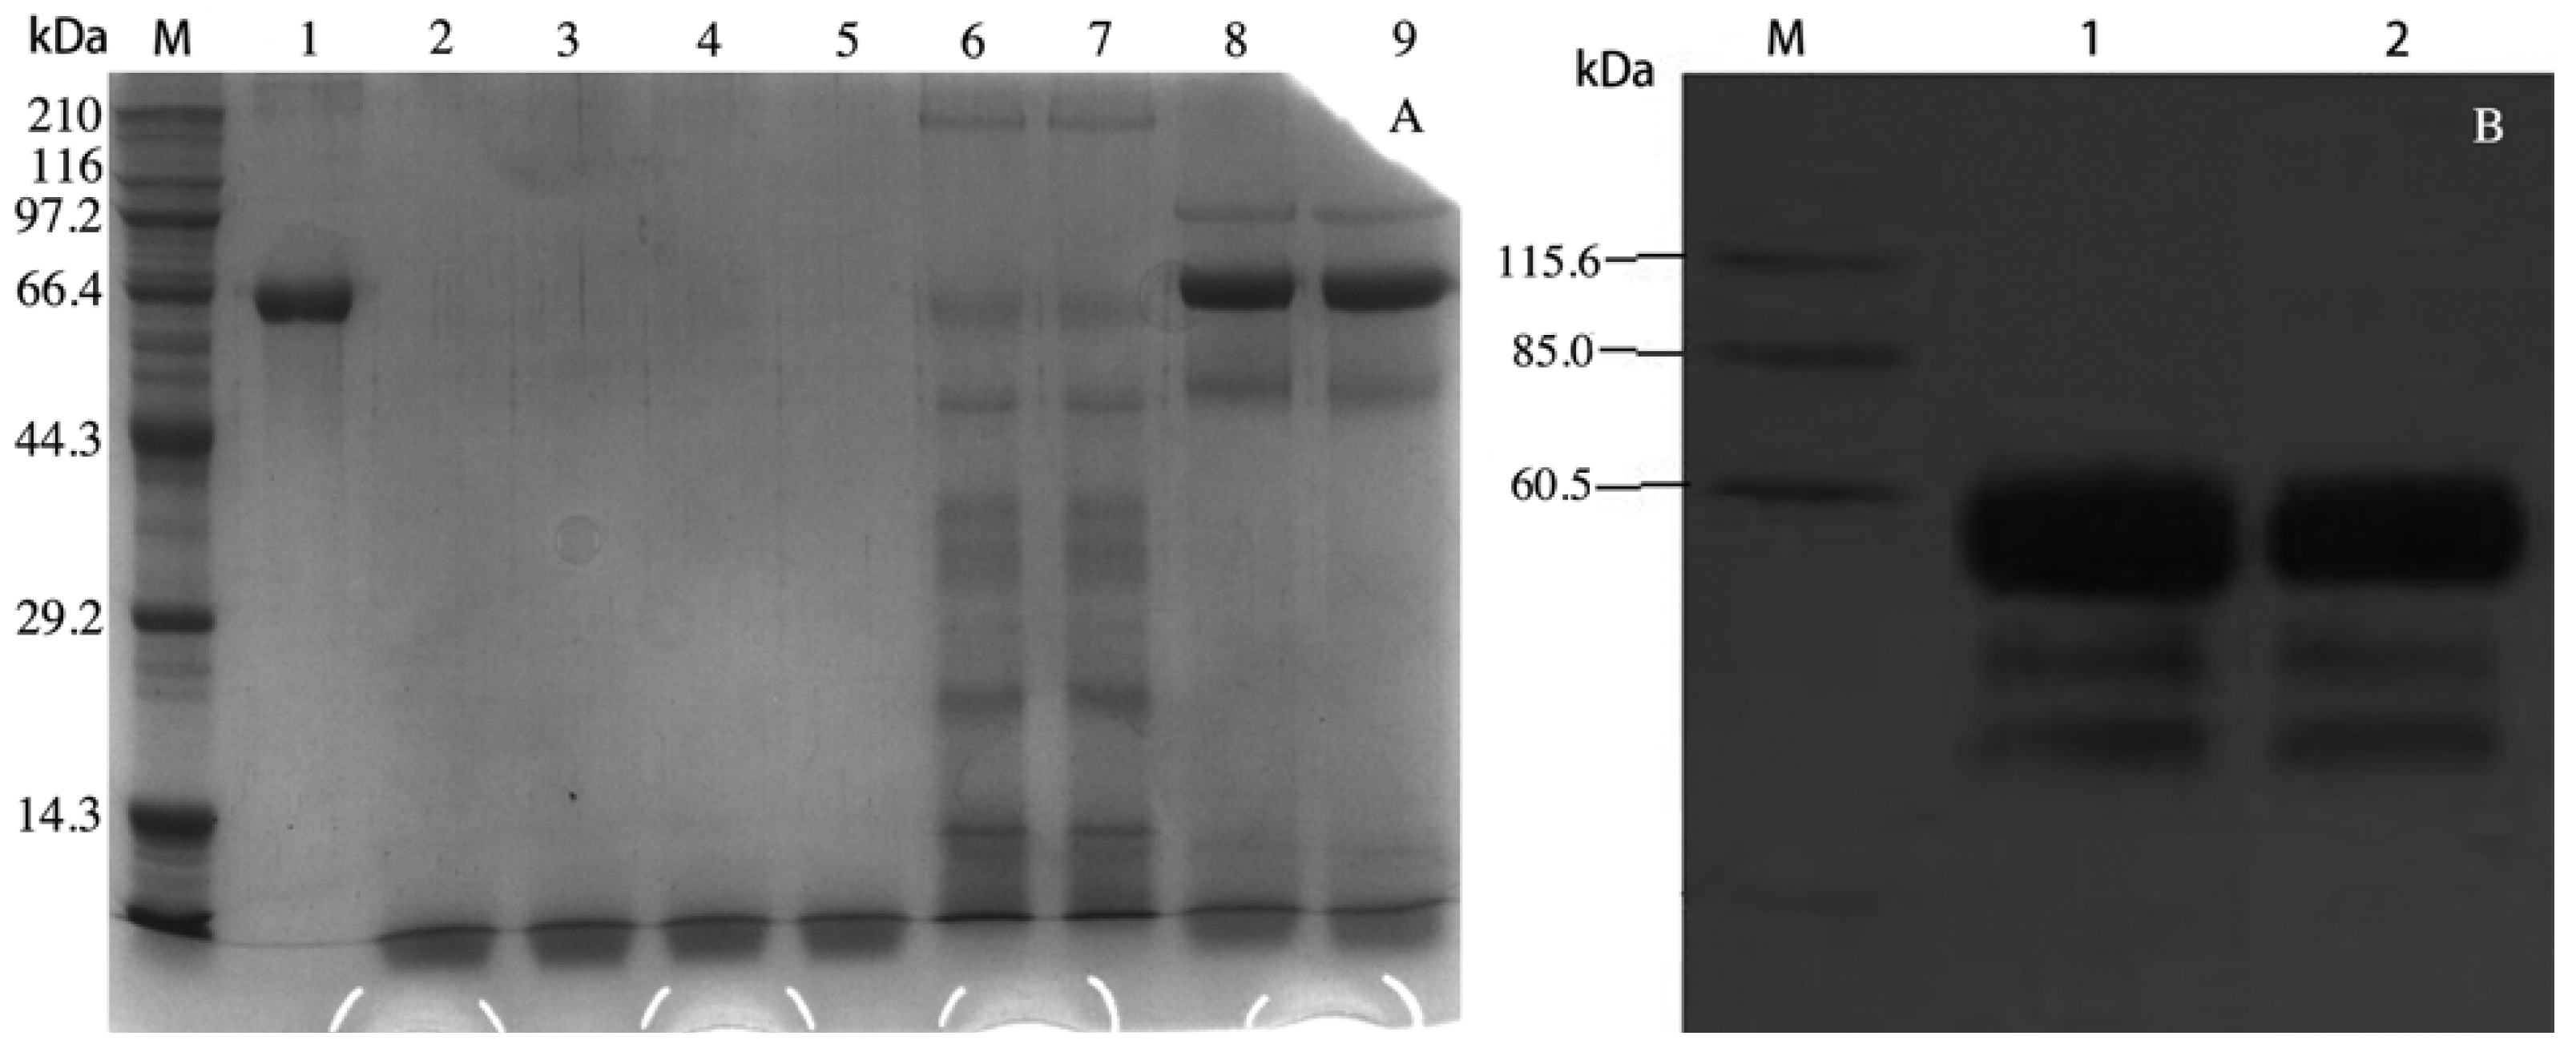
SDS-PAGE analysis of rVAA-I generated from Pichia pastoris (A). Lane M: Markers lanes, Lane 1: purified VAA-I, Lane 2–5: BMMY culture, Lane 6–7: supernantants of transformed yeast with blank pPICZα-A, Lane 8–9 supernantants of transformed yeast; Western Blotting analysis of rVAA-I generated from Pichia pastoris (B). Lane M, Markers; Lane 1–2, the induced supernatant of yeast transformants.
Figure 1.
SDS-PAGE analysis of rVAA-I generated from Pichia pastoris (A). Lane M: Markers lanes, Lane 1: purified VAA-I, Lane 2–5: BMMY culture, Lane 6–7: supernantants of transformed yeast with blank pPICZα-A, Lane 8–9 supernantants of transformed yeast; Western Blotting analysis of rVAA-I generated from Pichia pastoris (B). Lane M, Markers; Lane 1–2, the induced supernatant of yeast transformants.
Figure 2.
Inhibition of cell growth of SMMC-7721 cells treated with rVAA-I. SMMC-7721 cells treated with a range of rVAA-I concentrations (1.0–128.0 ng/mL) for 24, 36, 48 and 72 h. Viability was measured with MTT reagent after the indicated period of time. Points represent the mean of three similar experiments (n = 3); bars, SE.
2.3. Apoptosis Plays a Major Role in SMMC-7721 Cell Death Induced by rVAA-I
The extent of rVAA-I-induced cell death was evaluated using flow cytometry (FACSCalibur, BD Biosciences). SMMC7721 cells were treated with different concentrations of rVAA-I for 24 h in medium. Next, apoptosis was measured by Annexin V-FITC (early apoptosis) and propidium iodide (PI, late apoptosis) staining and analysis. Increases in apoptotic cells relative to the control were observed in cells exposed to each concentration of rVAA-I. Incubation with rVAA-I for 24 h induced apoptosis dose dependently in SMMC7721 cells cultures, reaching a 30% total apoptotic (early and late) rate for 8 ng/mL rVAA-I and a 44% total apoptotic rate for 16 ng/mL rVAA-I. SMMC7721 cells exposed to 32 ng/mL rVAA-I resulted in a 51% total apoptotic rate. In comparison, 8% total apoptotic cells were found in the untreated control, which most likely resulted from the isolation procedure (
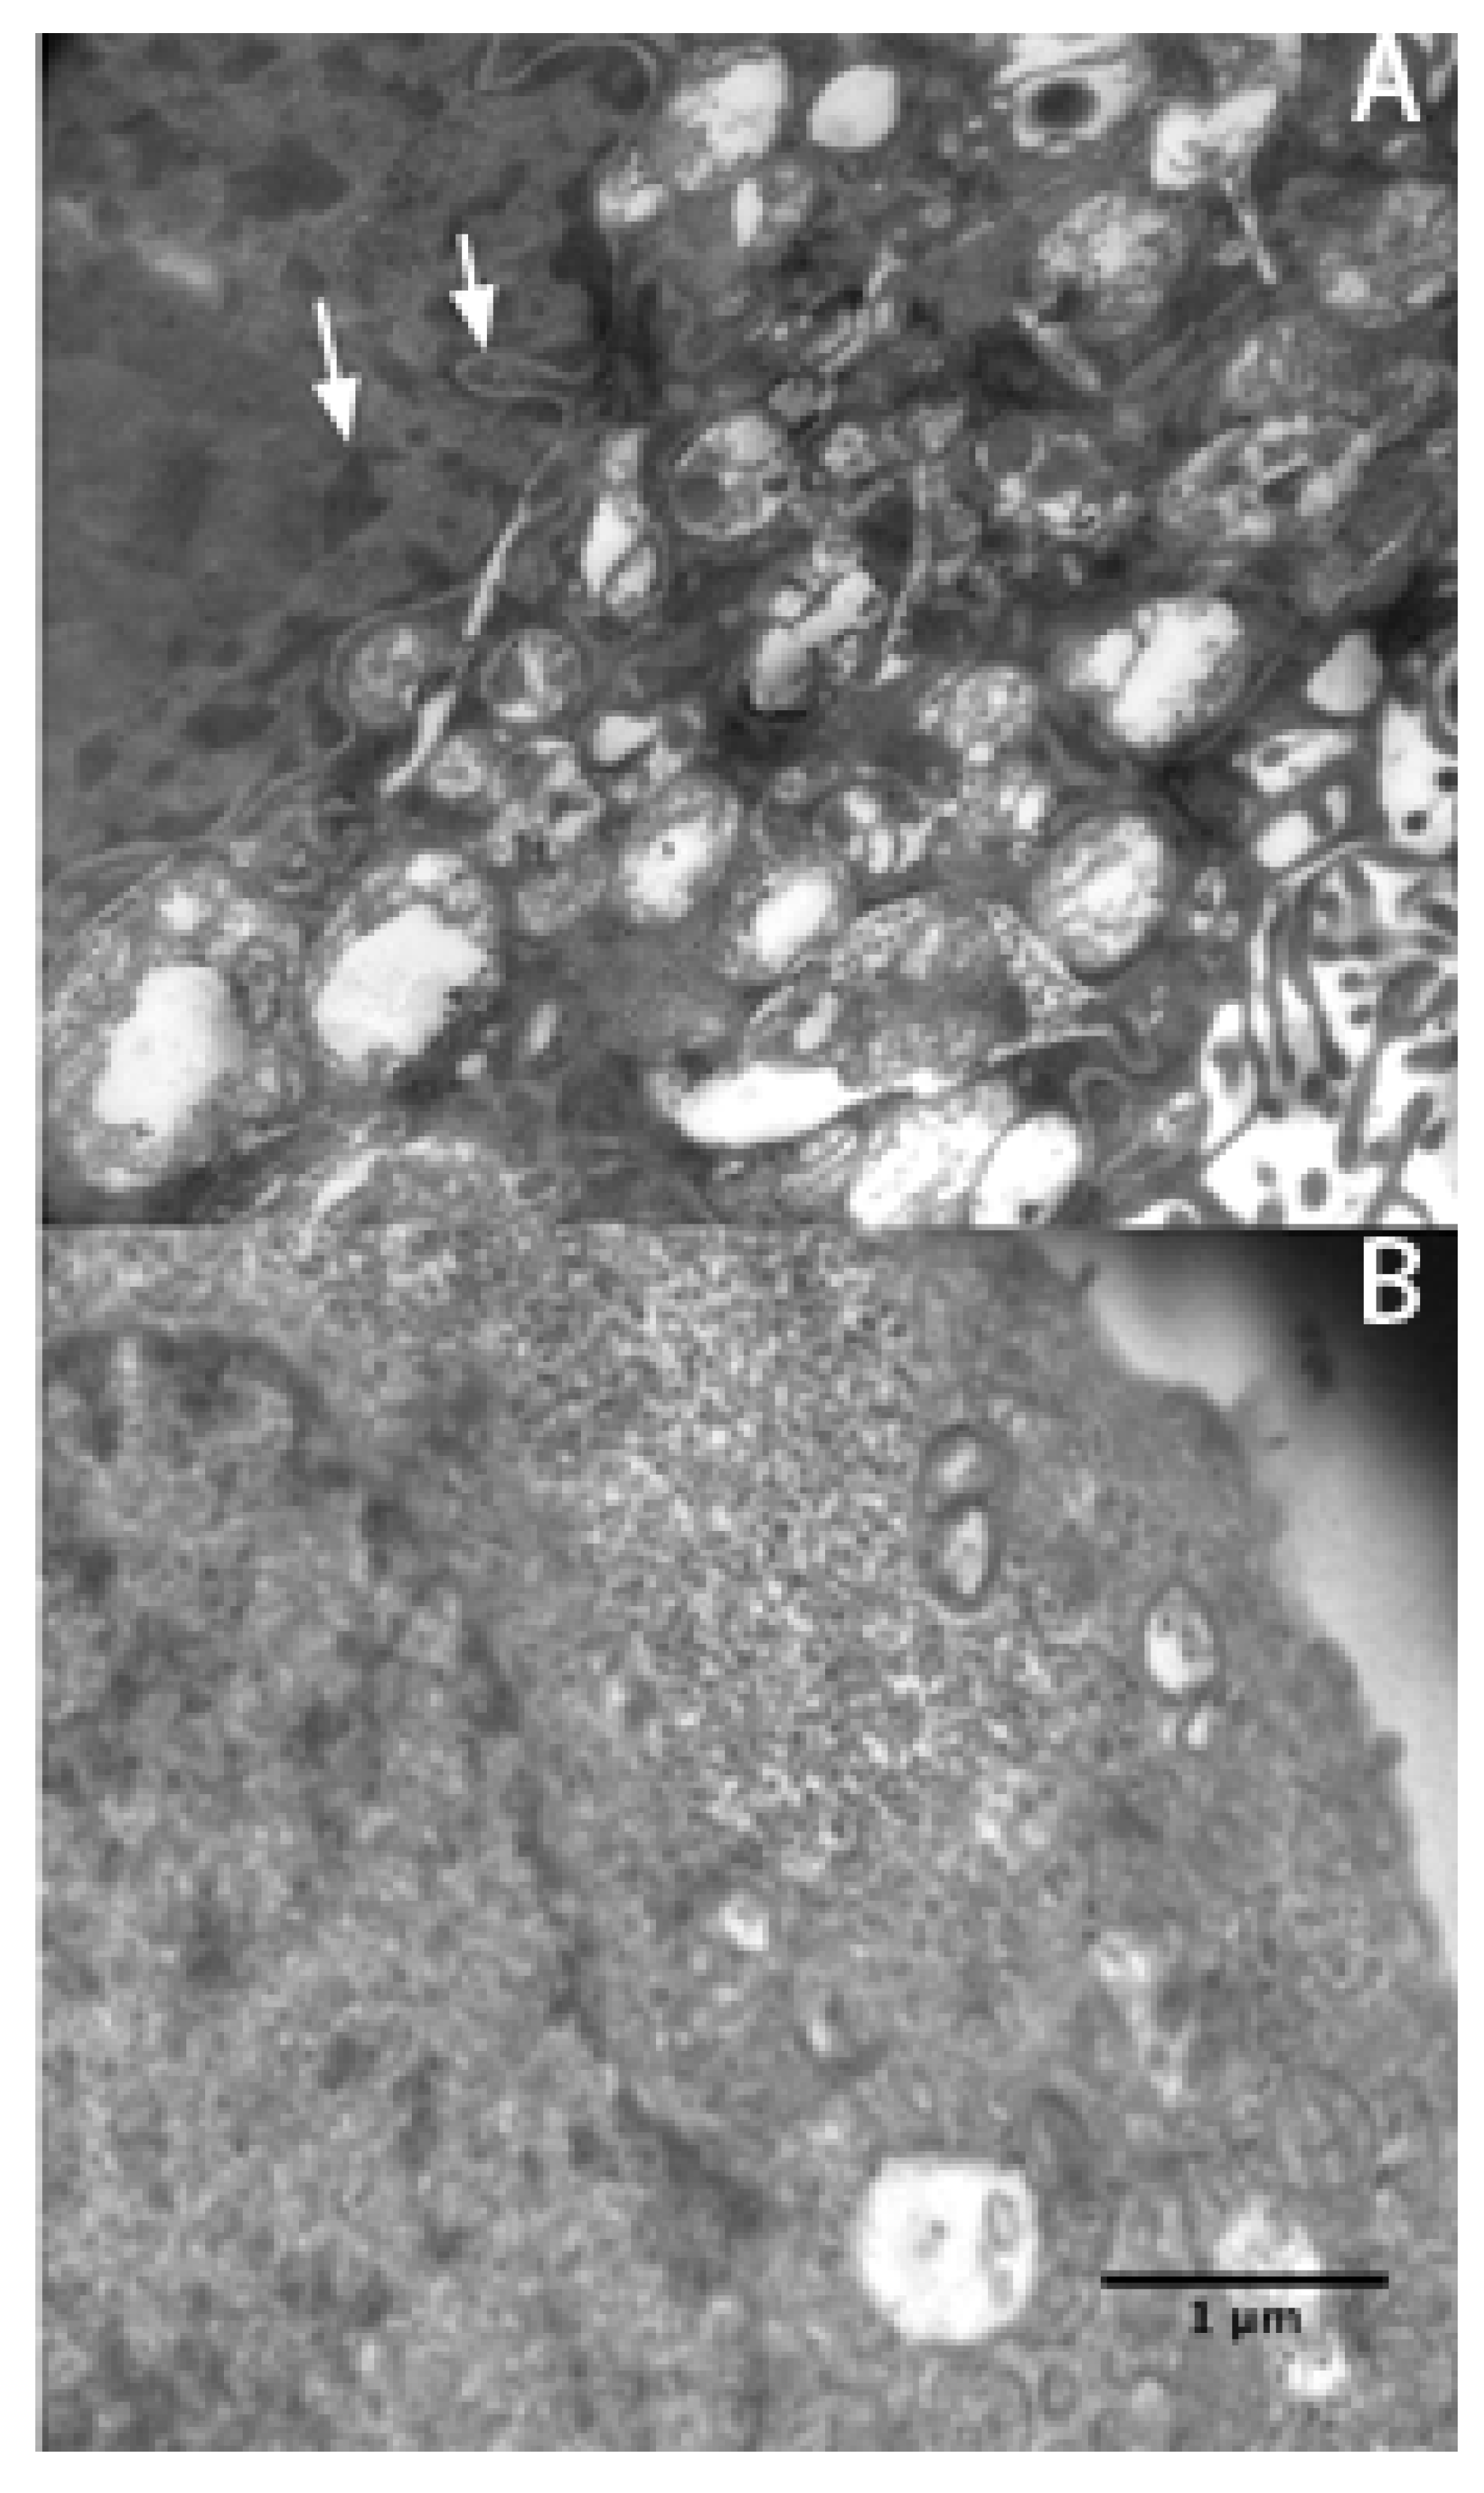
p < 0.05). This result suggests that exposure to rVAA-I could induce SMMC7721 cell apoptosis. Micrographs of SMMC7721 cells treated with 16 ng/mL rVAA-I showed karyopyknosis, chromatic agglutination, and nuclear fragmentation (white arrows) (
Figure 3A). All of these features are typical apoptotic morphological changes, especially condensation and shrinkage of nuclei. These latter changes were confirmed by Hoechst 33342 staining (unpublished data).
Figure 3.
Electron micrographs were taken of SGC7901 cells treated (A) and untreated (B) with 16 ng/mL rVAA-I. Typical apoptotic morphological changes are denoted by an white arrow. Scale bar: 1 μm.
Figure 3.
Electron micrographs were taken of SGC7901 cells treated (A) and untreated (B) with 16 ng/mL rVAA-I. Typical apoptotic morphological changes are denoted by an white arrow. Scale bar: 1 μm.
It is widely accepted that apoptosis is mediated by caspase activity, the specific role of caspases is debatable [
11,
12,
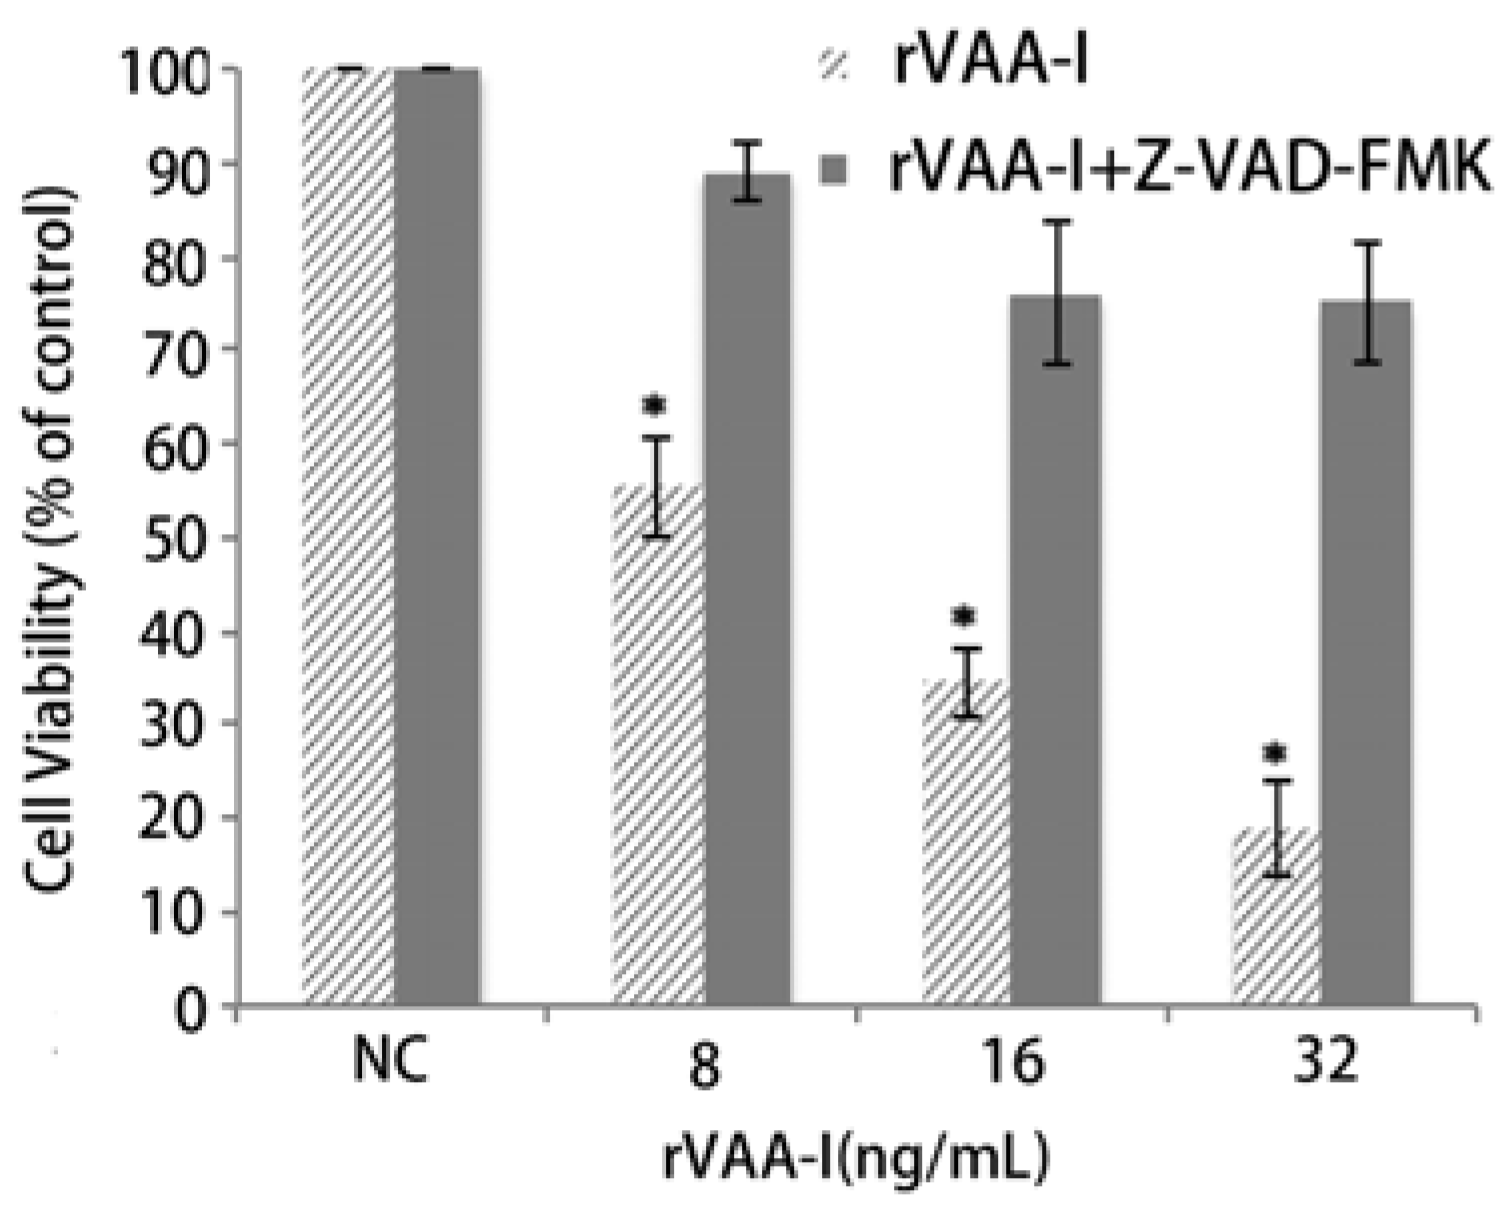
13]. A caspase inhibition assay was performed to examine the involvement of caspase in rVAA-I-induced cell death. The caspase inhibitor z-VAD-fmk (50 mM) did significantly affect the cell viability of rVAA-I-treated SMMC-7721 cells (
Figure 4). These results proved that rVAA-I-induced cell death depends on caspase activated apoptosis.
Figure 4.
Effect of caspases in SMMC-7721 cells treated with rVAA-I. SMMC-7721 cells untreated or treated with 50 μm Z-VAD-FMK for 30 min, and then treated with 8, 16, 32 ng/mL rVAA-I. The result measured with MTT. Standard error represents four independent experiments.
Figure 4.
Effect of caspases in SMMC-7721 cells treated with rVAA-I. SMMC-7721 cells untreated or treated with 50 μm Z-VAD-FMK for 30 min, and then treated with 8, 16, 32 ng/mL rVAA-I. The result measured with MTT. Standard error represents four independent experiments.
2.4. rVAA-I Triggers Calcium and Cytochrome c Release
Chromatin condensation is one of the hallmarks of apoptosis, and it is regulated by specific genes. Taking all of our results into consideration, we propose that rVAA-I induces apoptosis. In addition, [Ca
2+]i increased after treatment with rVAA-I in this study. Ca
2+ is a ubiquitous second messenger that mediates a wide range of cellular responses, such as contraction, fluid and electrolyte secretion, exocytosis, gene transcription, and apoptosis. The ability, simultaneously controlling multiple processes, occurs when carefully modulating Ca
2+ signals. This is also reported not only over time but in different subcellular regions. Recently, it was suggested that nuclear and cytosolic calcium are regulated independently. Several lines of evidence demonstrate that increases in Ca
2+ within the nucleus have specific biological effects that differ from the effects of increases in cytosolic Ca
2+. The Ca
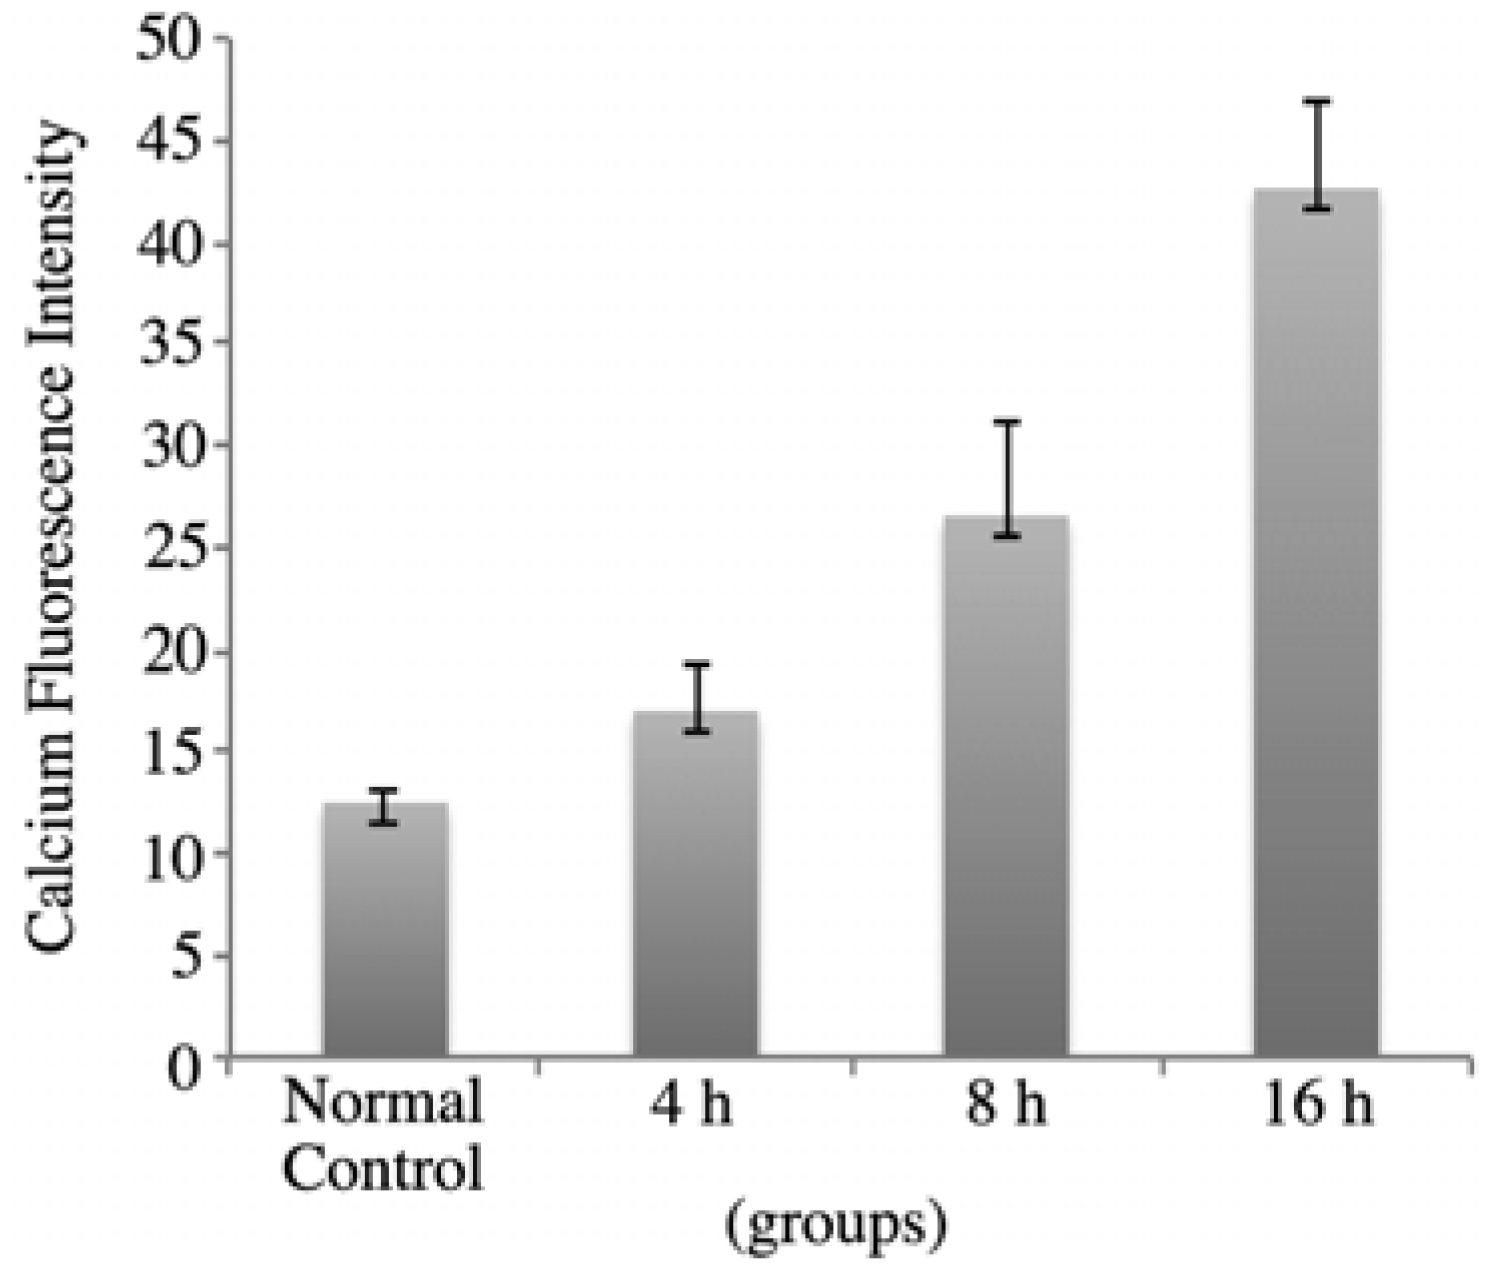
2+ indicator Fluo-3/AM assay provided further proof that rVAA-I could induce SMMC7721 cells apoptosis. As is shown in
Figure 5, in SMMC7721 cells treated with 16 ng/mL rVAA-I for 4 h, the calcium fluorescence intensity was 17.36 ± 2.22. After treatment for 8 and 16 h, the fluorescence intensity was 26.99 ± 3.69 and 42.48 ± 4.32, respectively. These values were significantly from those of the controls (
p < 0.05). These results indicated that rVAA-I could trigger calcium release and thereby cause intracellular calcium overload.
Figure 5.
rVAA-I could trigger calcium release in SMMC-7721 cells for 4, 8 and 16 h.
Figure 5.
rVAA-I could trigger calcium release in SMMC-7721 cells for 4, 8 and 16 h.
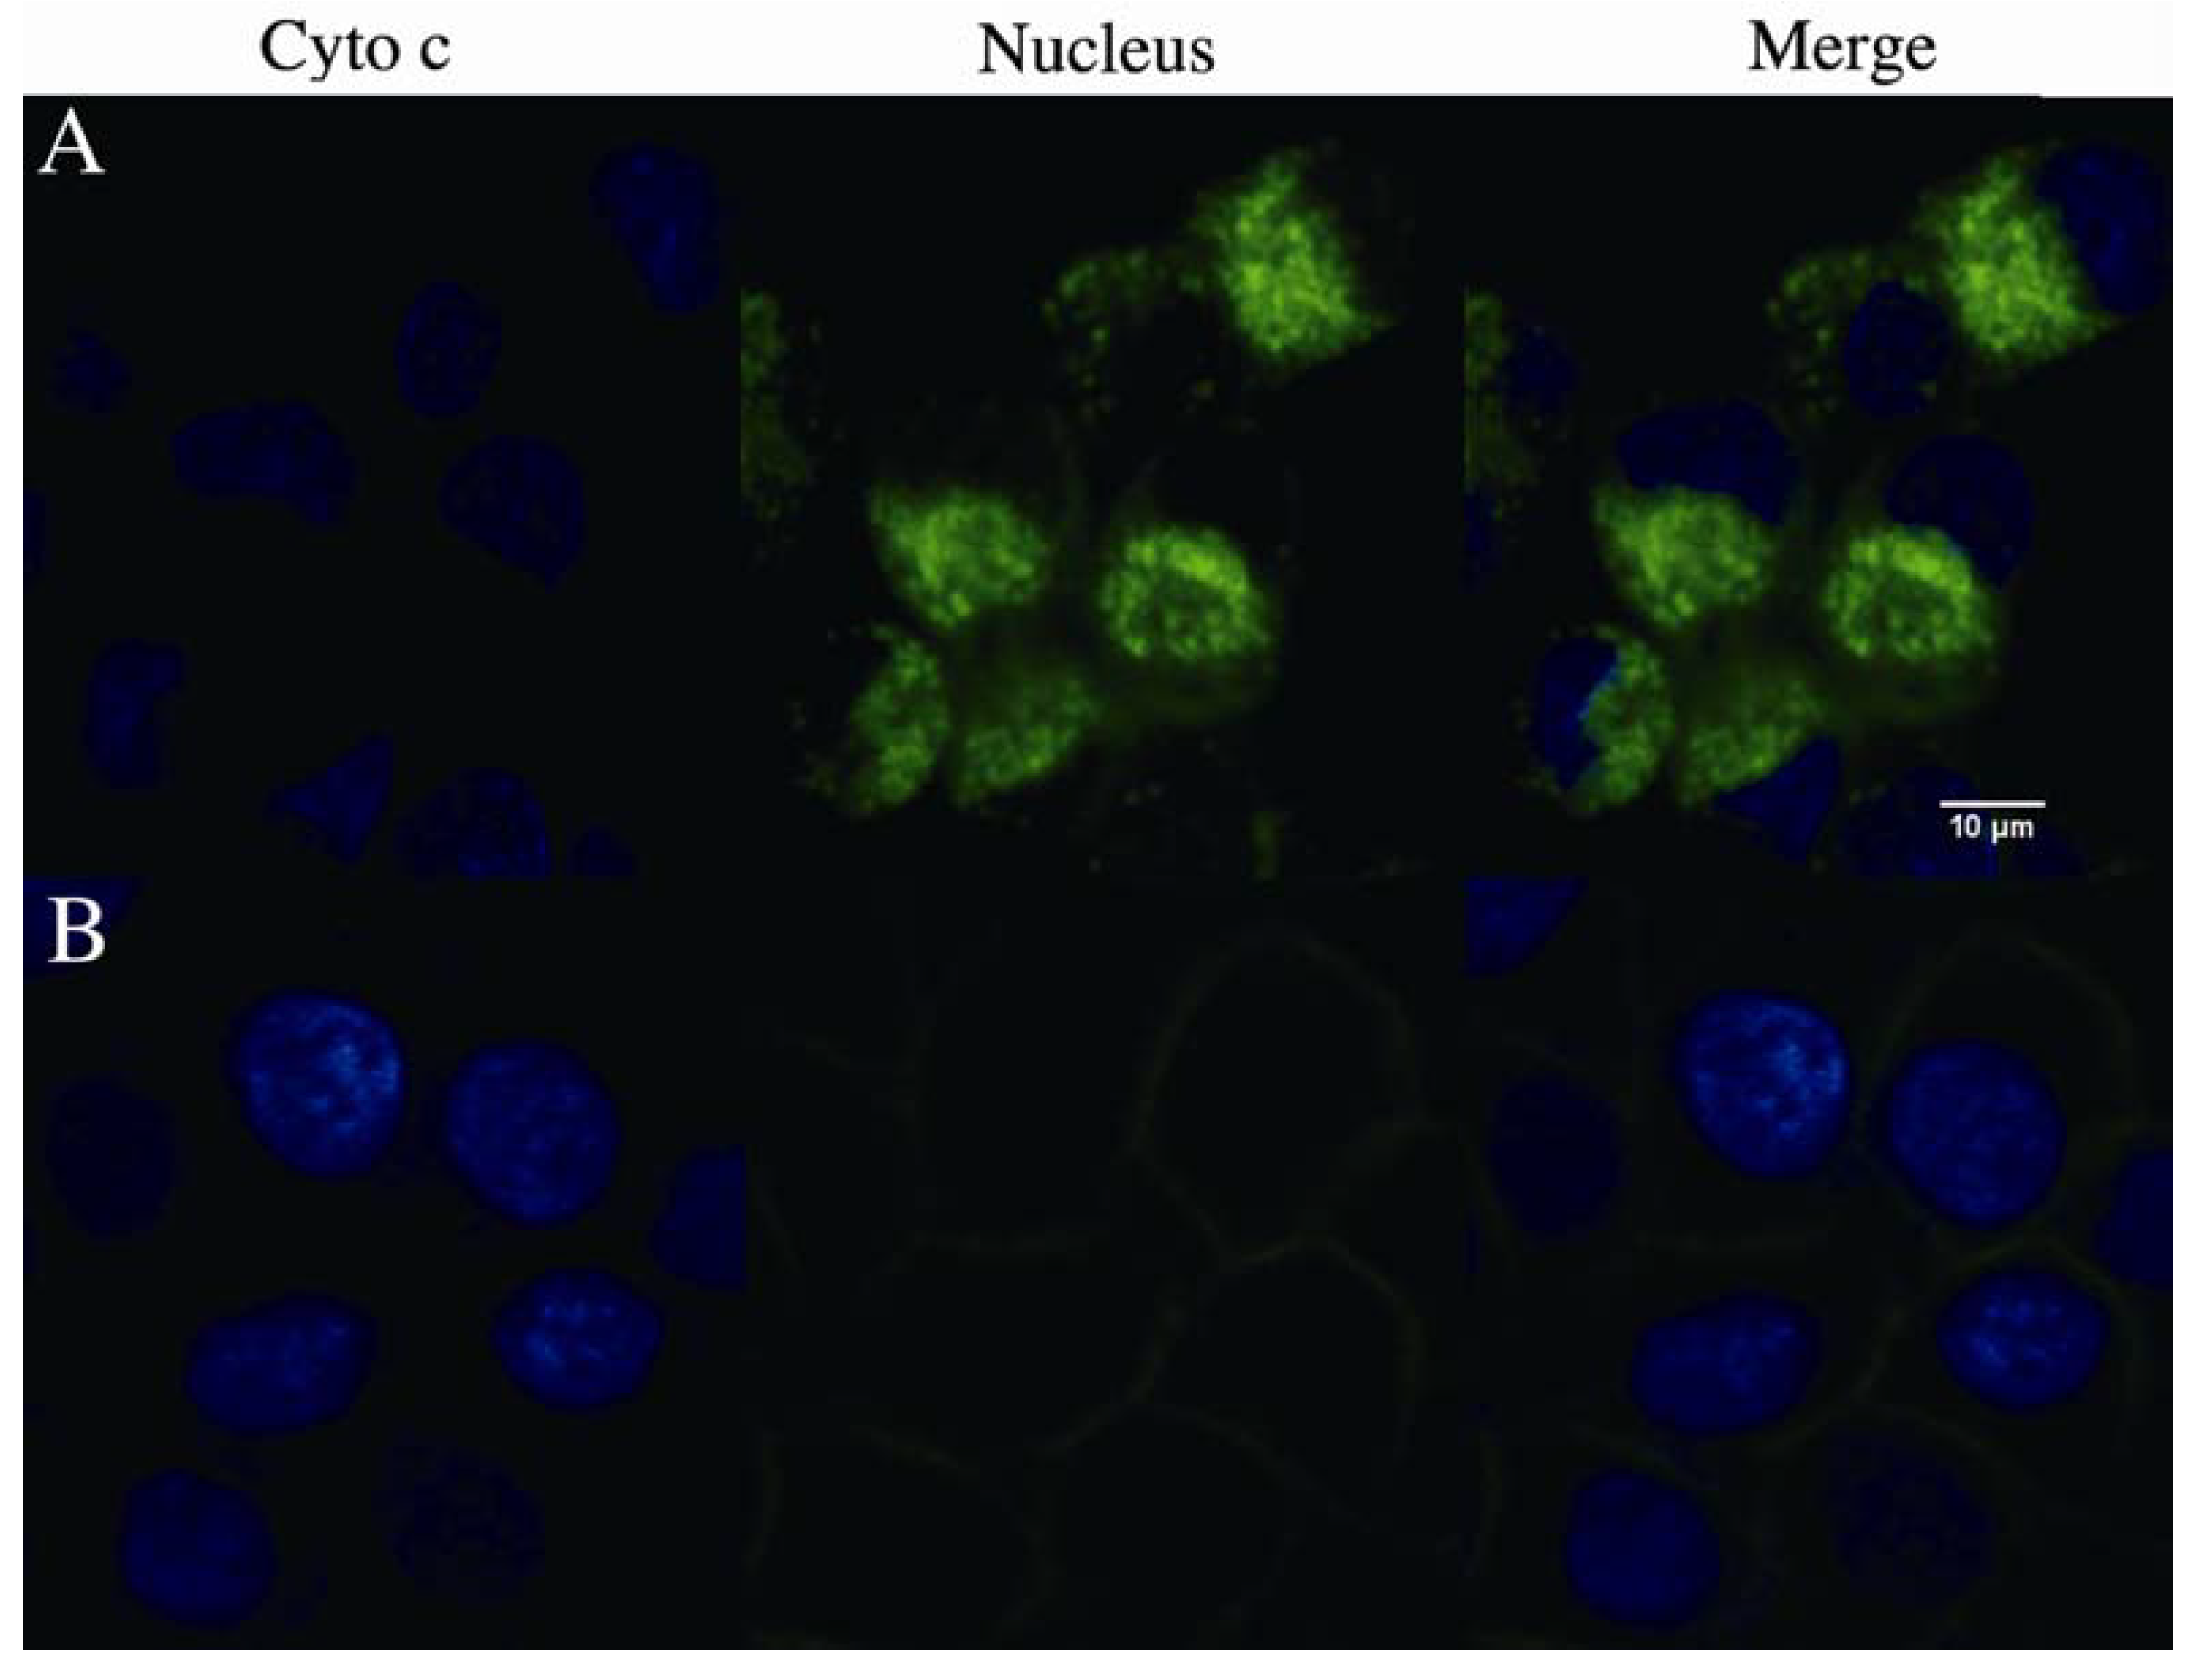
Next we analyzed the cytochrome c release from mitochondria using confocal microscopy. As shown in
Figure 6, cytochrome c (green) release was observed significantly in SMMC-7721 cells treated with 16 ng/mL rVAA-I for 18 h. However, cytochrome c release in non-treated control cells was not observed. Therefore, we conclude that cytochrome c is released from mitochondria to cytosol in rVAA-I-treated SMMC-7721 cells.
Figure 6.
Effect of rVAA-I on the cytochrome c release from mitochondria. (A) SMMC-7721 cells with confocal medium and (B) cells treated with of 16 ng/mL rVAA-I for 24 h were fixed and labeled for cytochrome c (green) and nucleus (blue). Images were obtained using confocal laser scanning microscopy.
2.5. PI 3K Pathway May Play an Important Role in the Process of Cell Death
Genome-wide transcriptional profiling of SMMC7721 cell has demonstrated that extensive gene expression occurs during the cell was treated with rVAA-I. To investigate the possible gene expression change in our rVAA-I induced apoptosis cell model, we performed a gene chip study by using the Affymetrix probe dataset which includes a total of 22,000 probes. We found when compared with probes in the control group, 85 probes increased and 42 probes decreased in the rVAA-I treated group.
T-test correction of the randomized variance model was performed to determine genes that were expressed separately and differentially. As a result, total 130 genes that had a p-value and the false discovery rate (FDR) less than 0.05 were declared to be significantly expressed. The gene expression value per group was the geometric mean of the Robust Multichip Average (RMA) normalized gene signals of three samples per group.
The complexity of gene relationship increased with k-core value rank. We wanted to find the main pathways assigned by the maximum numbers of genes in separately k-core and then define the key gene functions at each complexity level of network. For this analysis result, we determined the core functions at the core status of network which have a top k-core level (
Figure 2A). We can find that there are many DifGenes in the pathways, such as biosynthesis of steroids, cell adhesion molecules (CAMs), MAPK signaling pathway, terpenoid biosynthesis and synthesis and degradation of ketone bodies.
The gene expression profile in untreated and rVAA-I-treated cells also indicated that rVAA-I had a great impact on some important genes in the MAPK pathway. Some GO Terms associated with the nucleus differed between treated and control cells, including the MAPK signaling pathway (RAP1B, MAPK14, FLNA), apoptosis (SMNDC1), proteasome (PSMA2, PSMA4), riboflavin metabolism (RFK, MTMR6), tryptophan metabolism (FANCL, BRAP), the TGF-β signaling pathway (AMH), the phosphatidylinositol signaling system (IMPA1), and oxidative phosphorylation (PPA2) [
14]. The MAPK signaling pathway is involved in a wide range of cellular processes, such as viability, differentiation, transcription regulation, and development. The role of MAPK in apoptosis requires further study. In our study, FLNA, MAPK14, and RAP1B gene expression changed when cells were exposed to rVAA-I. FLNA is a 280-kDa dimer composed of the amino-terminal actin-binding domain, which interacts with a number of proteins with roles in signaling and cytoskeletal reorganization and is regulated by phosphorylation [
14,
15]. FLNA has been implicated in MAPK signaling induced by a variety of extracellular stimuli, and it can interact with the MAPK kinases MEK1 and MKK4 [
16]. It also can be phosphorylated by ribosomal S6 kinase [
17], which is an ERK target. RAP1 is a small GTPase that becomes activated downstream from multiple surface receptors via guanine nucleotide exchange factors. It also regulates several basic cellular functions such as adhesion, migration, polarity, differentiation, and growth. Moreover, it has been reported that RAP1 activates the MAP kinase pathway in several cell types [
18].
Our data suggest that the MAPK signaling pathway plays a critical role in SMMC7721 cells treated with rVAA-I. We used the KEGG, BioCarta, and GenMAPP databases to identify the gene network and the genes how it regulated. We then used real-time qPCR to validate the microarray results. Three differentially expressed genes (MAPK14, IMPA1, and SMNDC1) in the MAPK signaling pathway was selected for verification by real-time qPCR. In general, these results were consistent with those obtained by the microarray. Similar changes in the expression levels of representative mRNAs were observed using the chip arrays and real-time qPCR. Although the mRNA expression levels were not identical for real-time qPCR and the cDNA microarray, the increases or decreases were parallel between methods.
Under the experimental conditions used in this study, we observed expression changes in a series of genes that have multiple functions. The microarray study indicated that the biological processes of genes differentially expressed due to rVAA-I treatment included signal transduction and transcription regulation. When we examined the pathways of rVAA-I-induced genes using the MAS 2.0 system, we found that they were mainly involved in MAPK signaling and proteasome and riboflavin metabolism.
The protein encoded by MAPK14 is a member of the MAP kinase family, which acts as an integration point for multiple biochemical signals and is involved in a wide variety of cellular processes as well, such as viability, differentiation, transcription regulation, and development. Using chemical inhibitors in their experiments, Gillis
et al. determined that the ICP27-mediated activation of p38 signaling is responsible for the observed induction of apoptosis in the induced cell lines [
19]. According to Gillis
et al.’s previous research, arsenite-induced germline apoptosis was blocked in loss-of-function alleles of extracellular signal-regulated kinase (ERK) and p38MAPK cascades. The MAPK signaling pathways are essential for germline apoptosis. In regards to our study, we found that MAPK14 was up-regulated by rVAA-I treatment (unpublished data). The data showed that the p38 MAPK signaling pathway plays an important role in SMMC7721 cell apoptosis.
