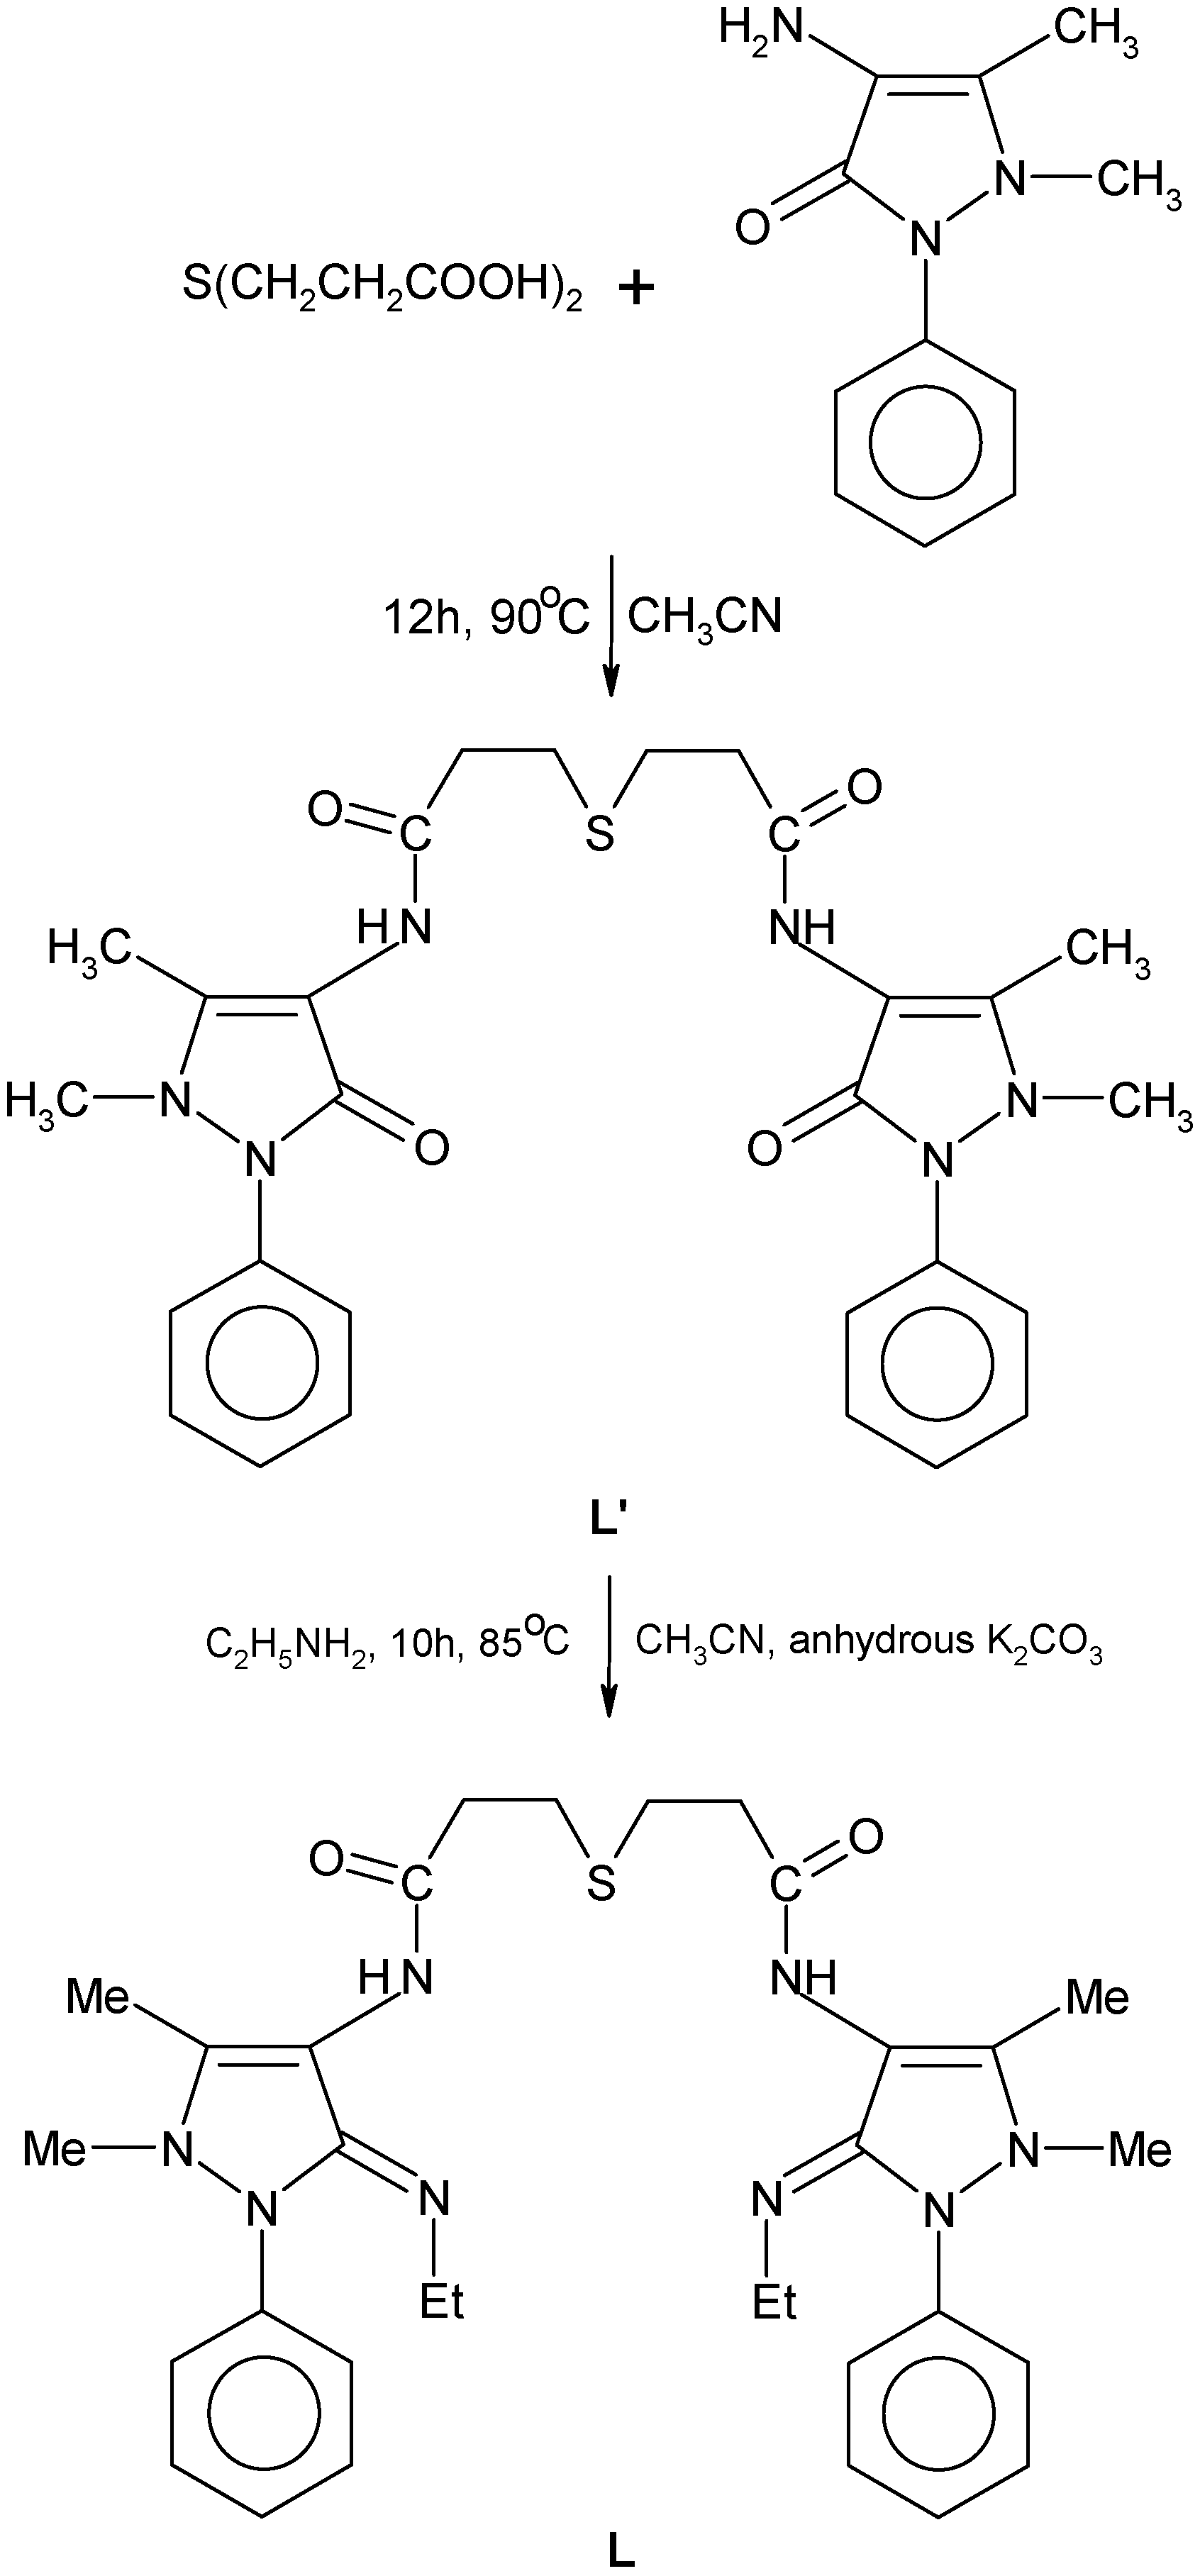
The synthesized novel Schiff’s base ligand, 3,3’-thiodipropionic acid bis(4-amino-5-ethylimino-2,3-dimethyl-1-phenyl-3-pyrazoline) (
Scheme 1) forms stable complexes with Co(II), Ni(II) and Cu(II) metal ions. The analytical data of the complexes, together with their physical properties are given in
Table 1. The analytical data of the complexes correspond to the general stoichiometry M(L)X
2 and M(L)SO
4 of the complexes, where M = Co(II), Ni(II) and Cu(II), L = ligand (C
32H
42N
8SO
2) and X = NO
3−, Cl
− and OAc
−. The value of molar conductance of complexes in DMSO indicates that the [M(L)SO
4] complexes are non-electrolytes and [M(L)X]X are 1:1 electrolytes [
12]. Magnetic moments lie in the range 5.01–5.08 B.M., 2.82–2.93 B.M. and 1.82–1.91 B.M. for Co(II), Ni(II) and Cu(II) complexes, respectively.
Mass spectra
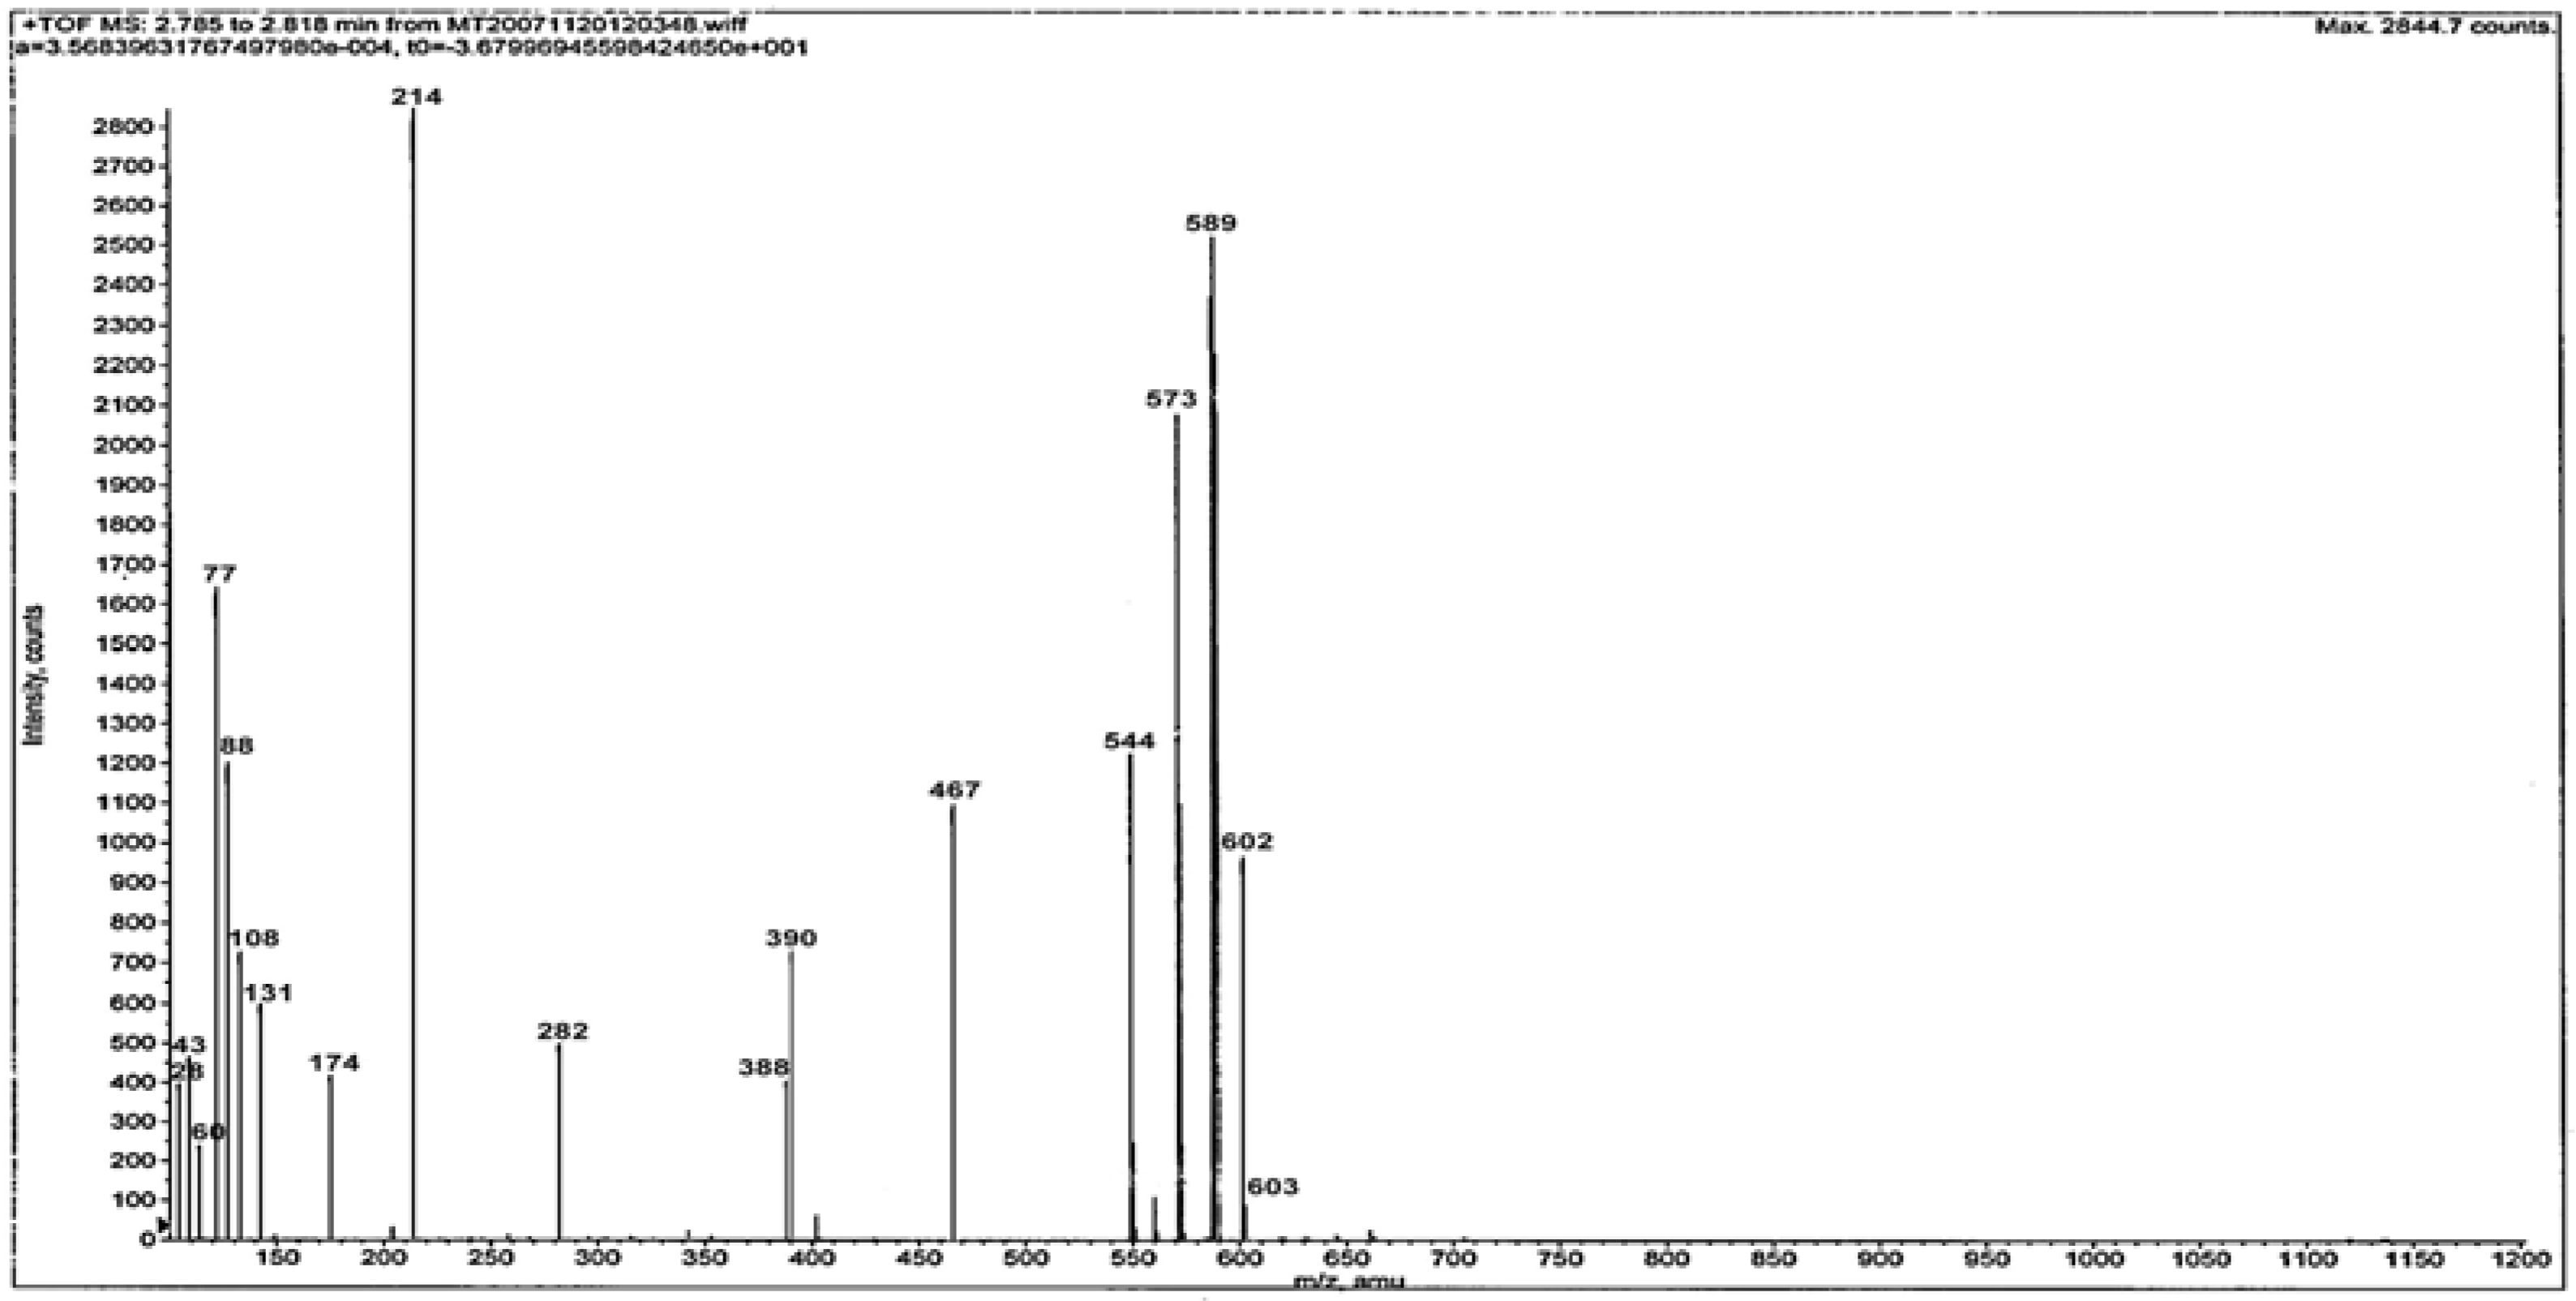
Mass spectra provide a vital clue for elucidating the structure of compounds. The ESI mass spectrum of ligand L is given in
Figure 1. The spectrum shows the molecular ion peak at m/z = 602 and the isotopic peak at m/z = 603 (M
++1) due to
13C and
15N isotopes. The base peak at m/z = 214 is due to the ethylimino-2,3-dimethyl-1-phenyl-3-pyrozoline (C
13H
16N
3)
+ ion. Another intense peak at m/z = 589 is due to a (C
31H
39N
8SO
2+2H)
+ ion. The different competitive fragmentation pathways of ligand give the peaks at different mass numbers at 28, 29, 43, 60, 77, 88, 108, 131, 174, 282, 388, 390, 467, 544 and 573. The intensity of these peaks reflects the stability and abundance of the ions [
13].
Figure 1.
Mass spectrum of the ligand L.
Figure 1.
Mass spectrum of the ligand L.
Figure 2.
1H-NMR spectrum of the ligand L.
Figure 2.
1H-NMR spectrum of the ligand L.
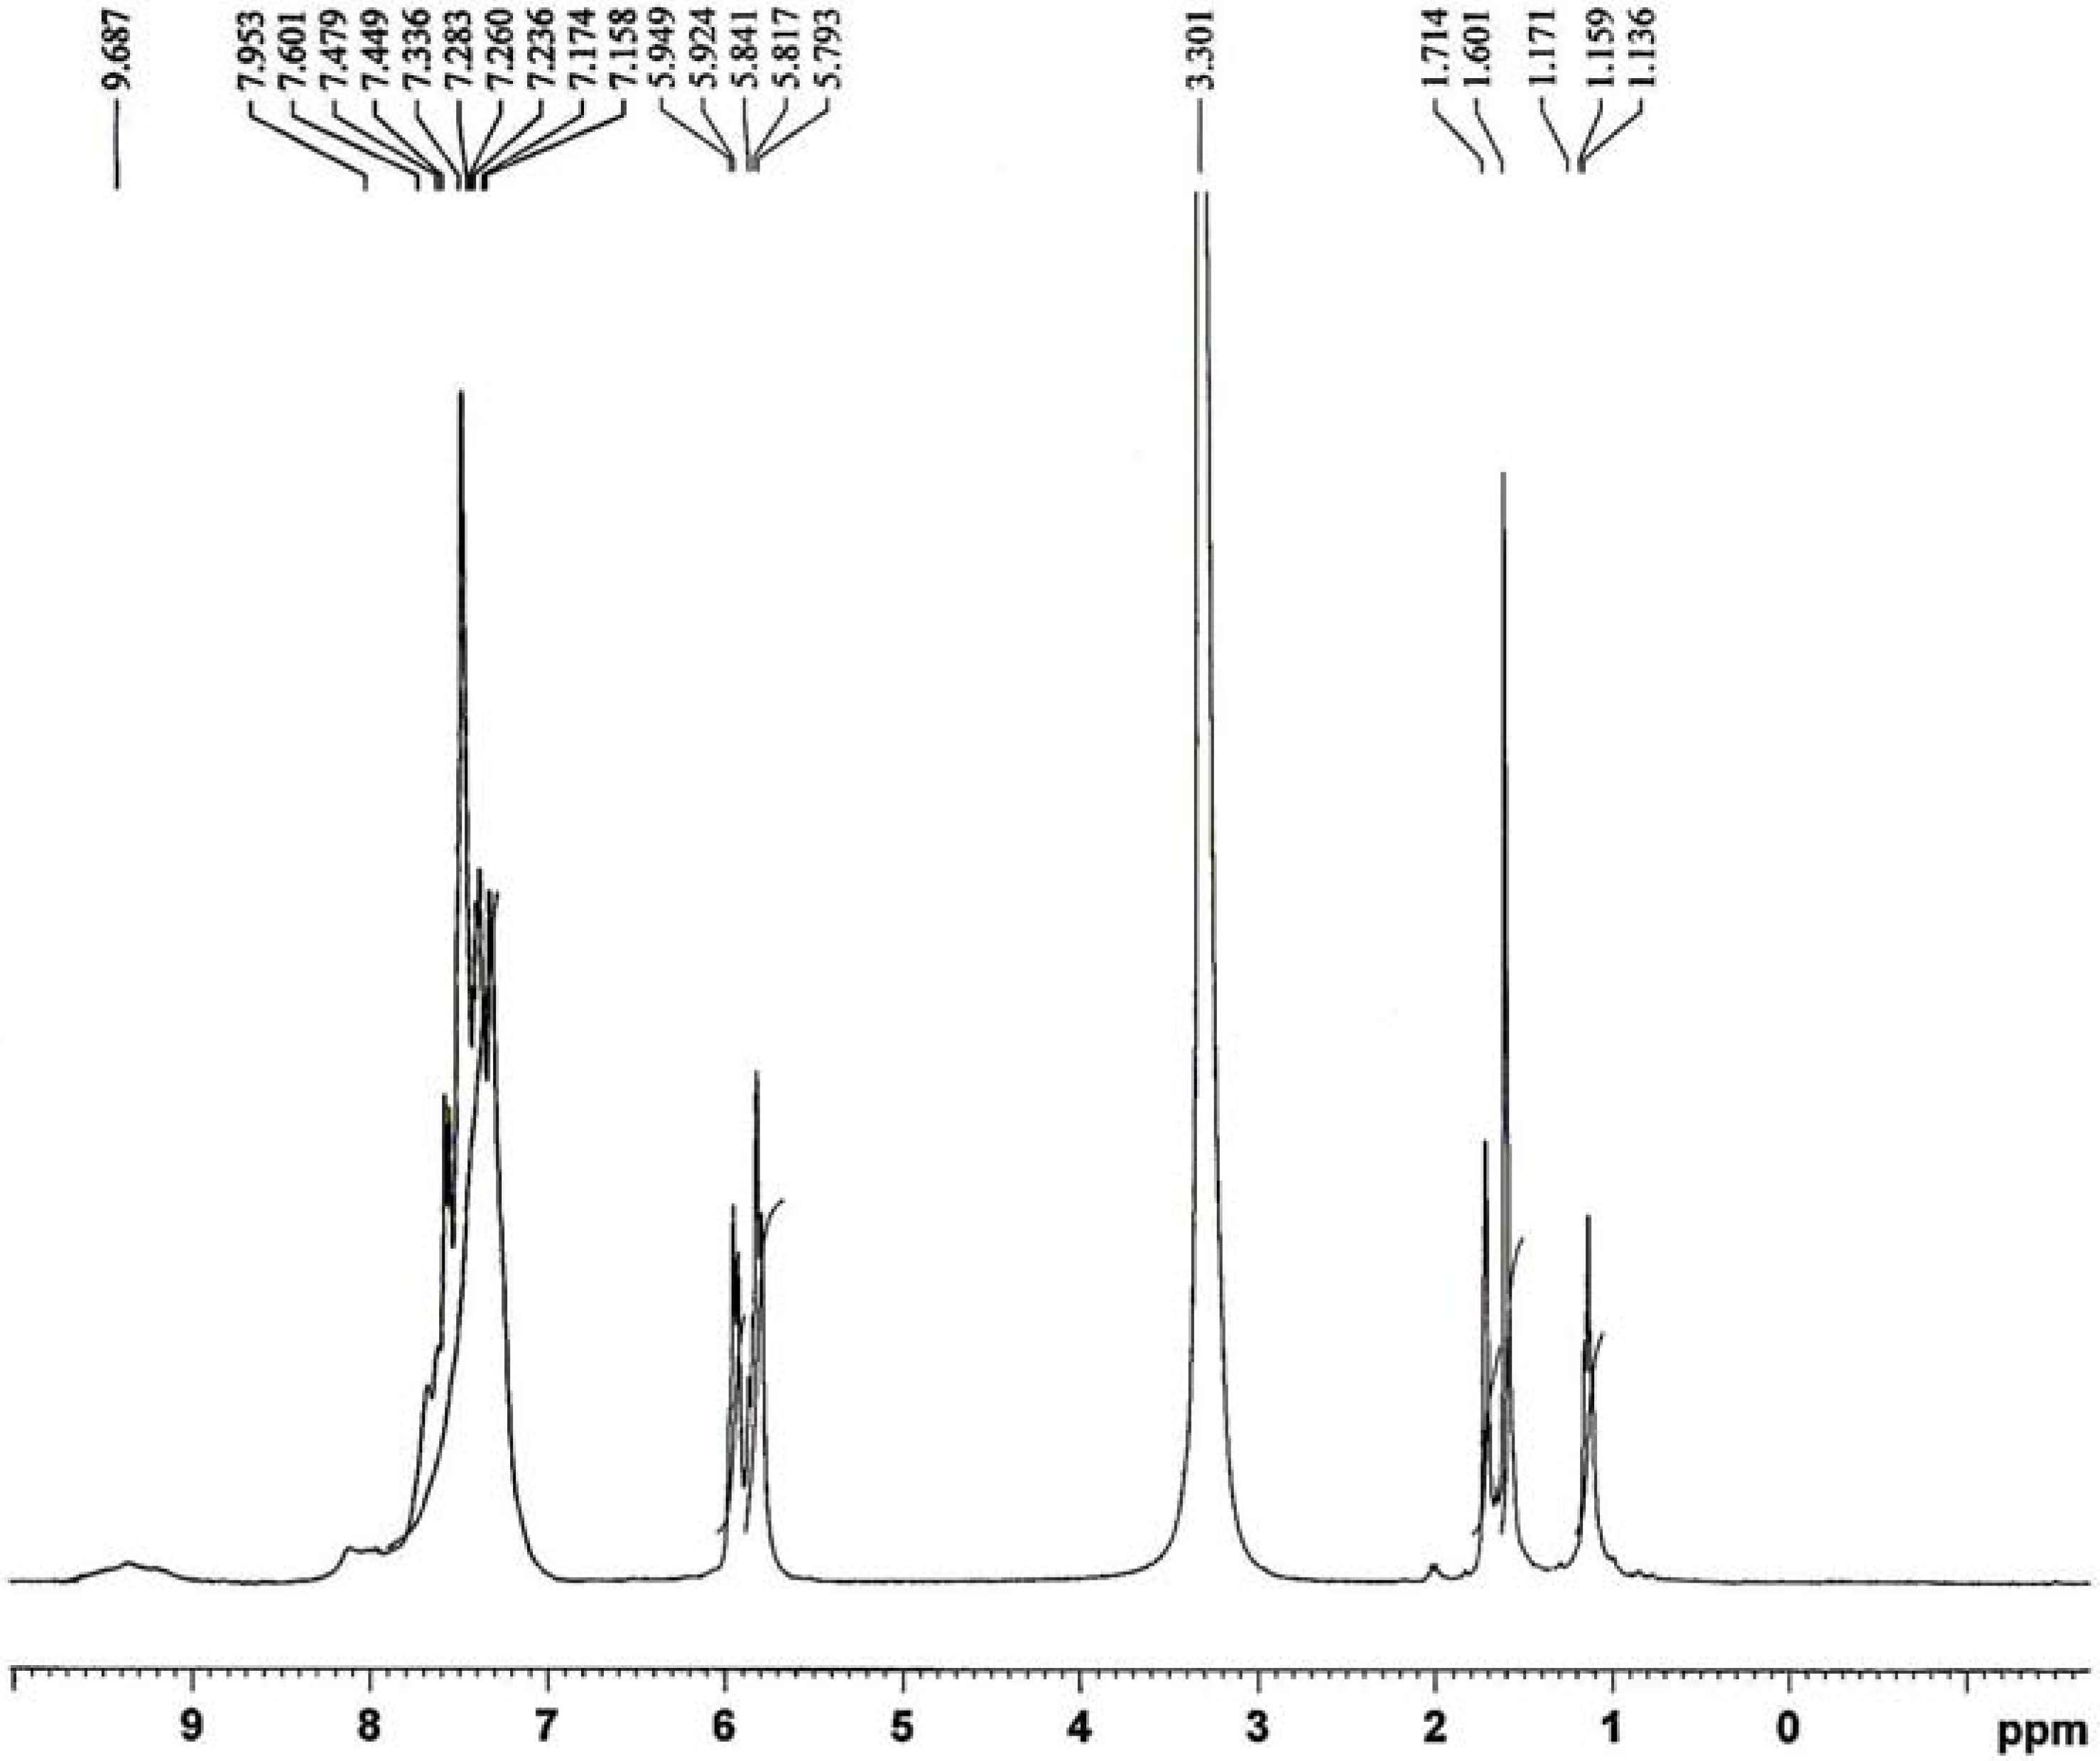
NMR spectra
NMR data of the ligand are given in
Table 2. Its
1H-NMR spectrum (
Figure 2) displays a triplet at ca. δ 1.136-1.171 ppm (s, 6H, 2H
3C-C), due to the six protons of two methyl groups attached to the CH
2 groups, two singlets at ca. δ 1.601 ppm (s, 6H, 2H
3C-C) and ca. δ 1.714 ppm (s, 6H, 2H
3C-N) due to protons of methyl groups attached to the pyrazoline rings, two multiplets at ca. δ 5.7-5.9 ppm (m, 12H, 6CH
2) due to the protons of six methylene groups and at ca. δ 7.1-7.9 ppm (m, 10H, aromatic) due to the protons of two phenyl rings and a broad signal at ca. δ 9.6 ppm (s, br, 2H, 2NH), corresponding to the two protons of two NH groups [
14].
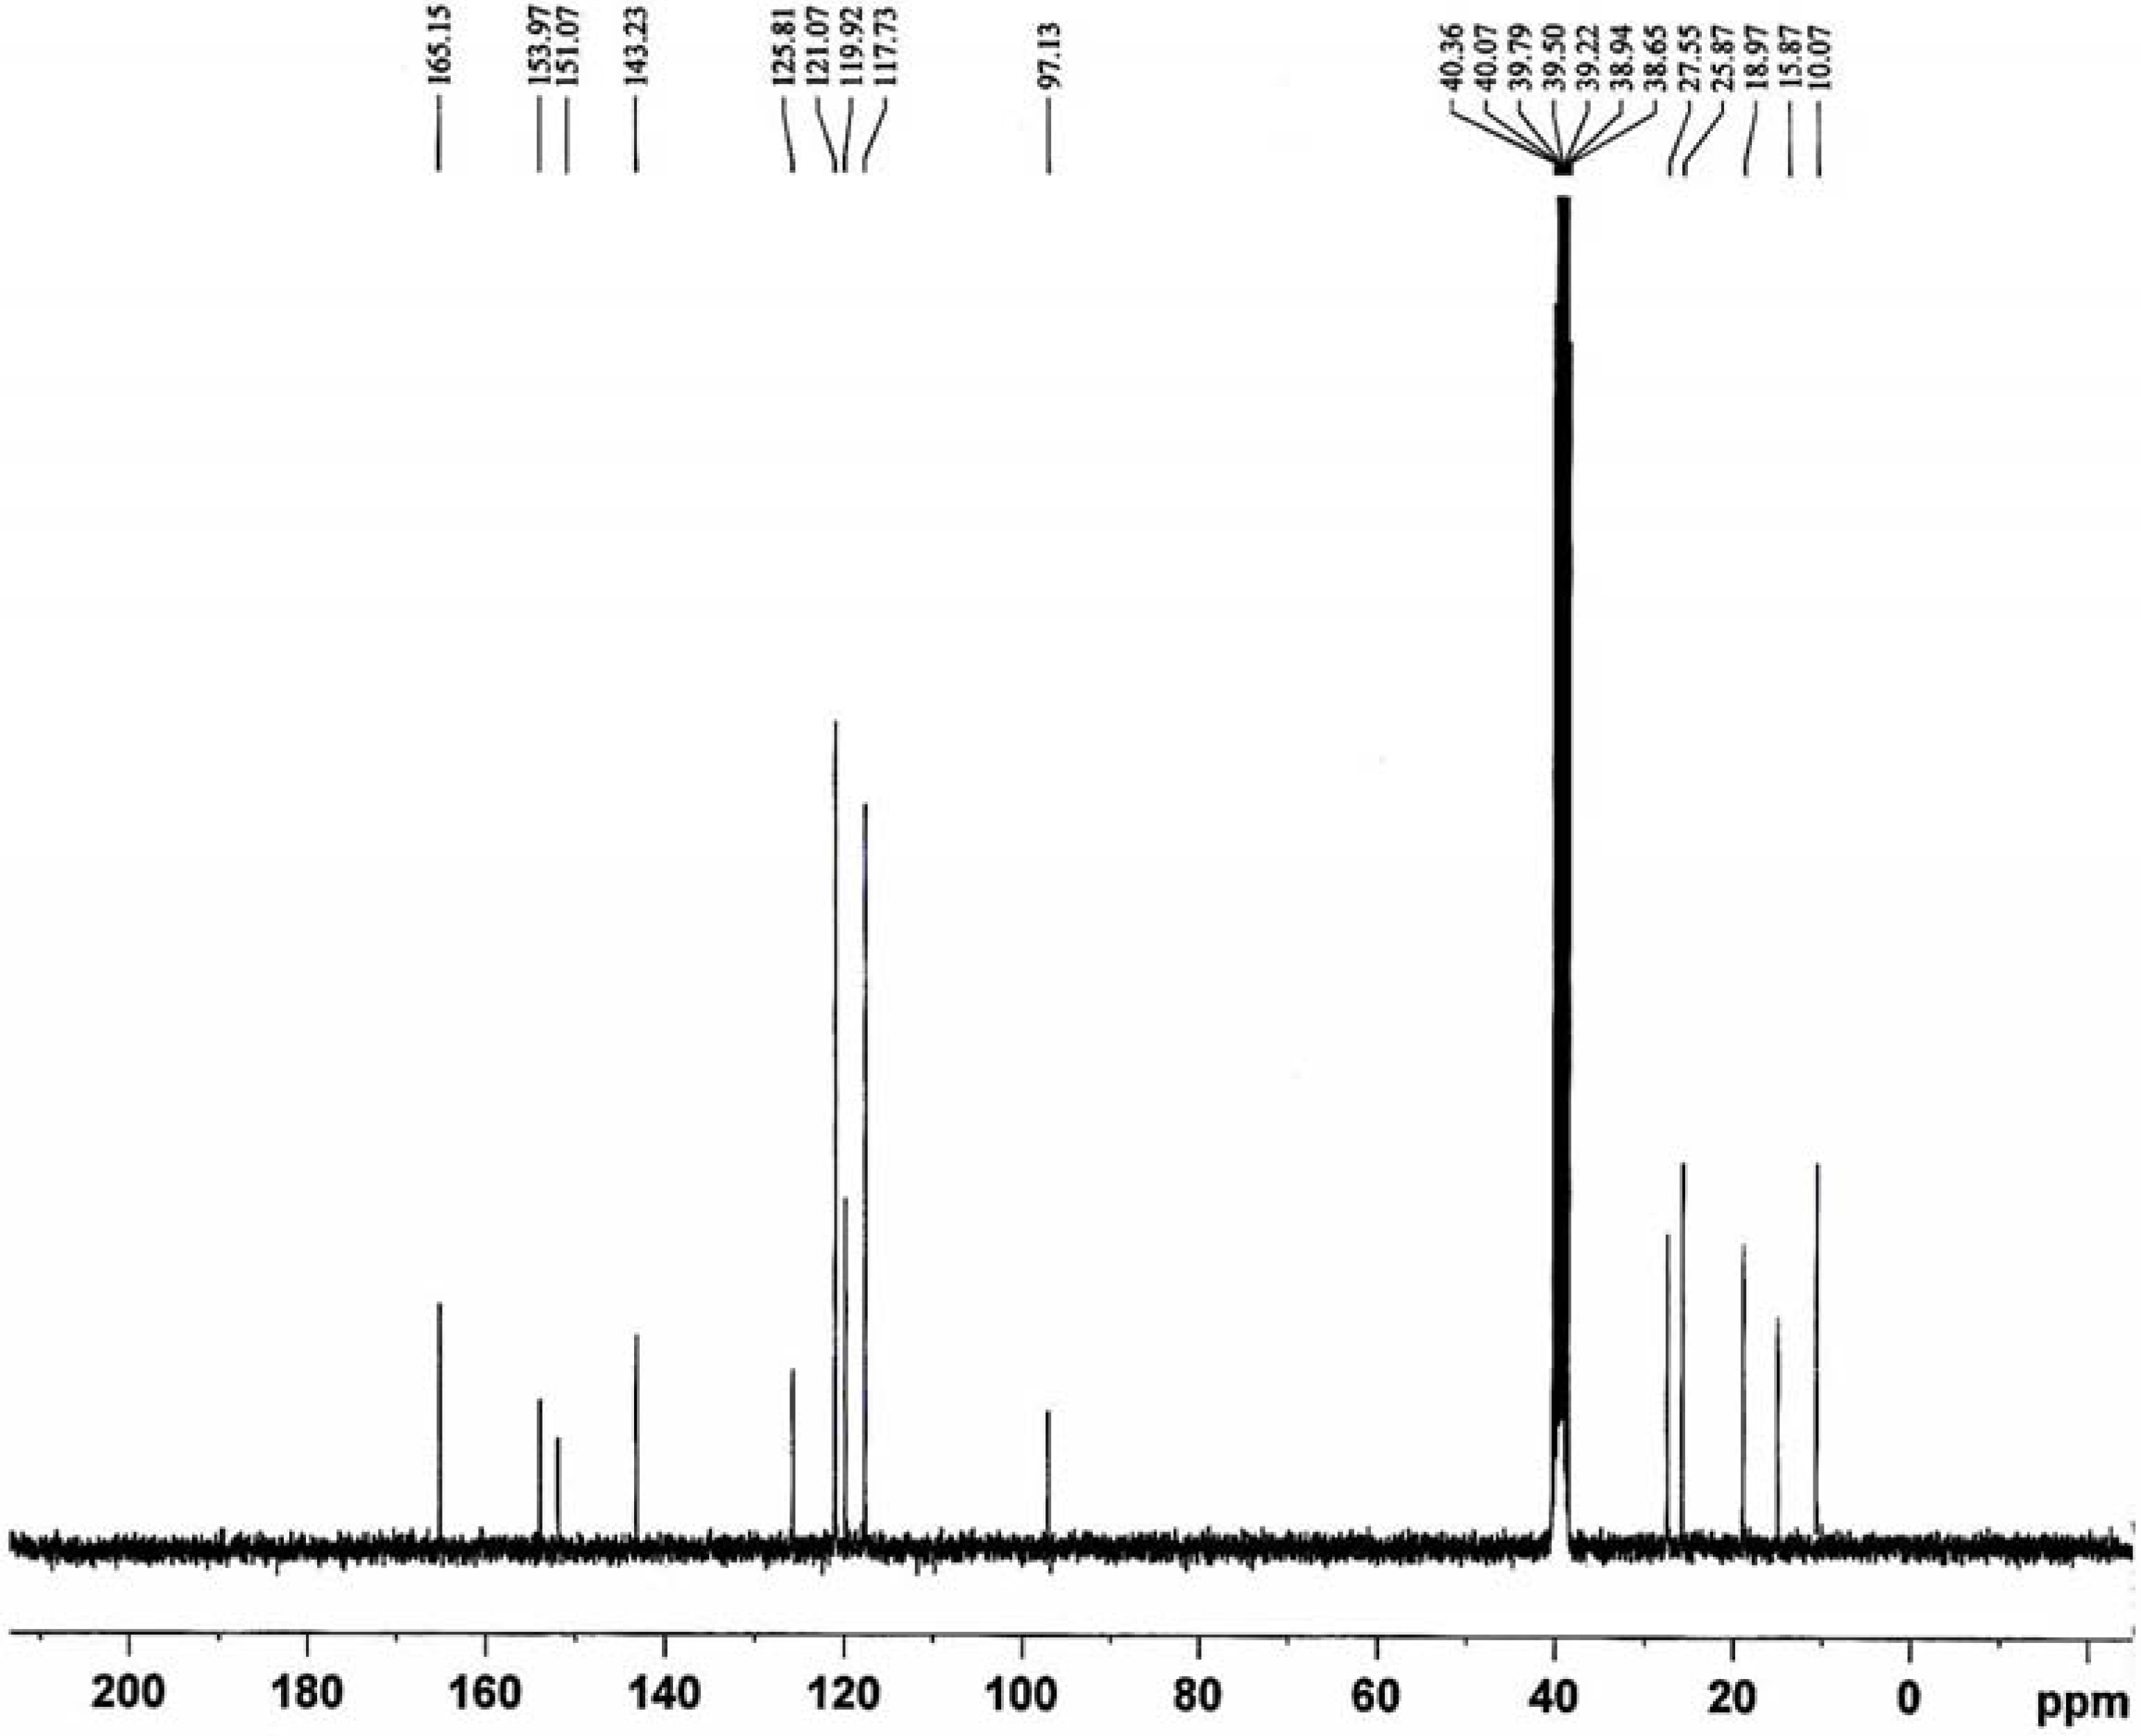
The
13C-NMR spectrum (
Figure 3) displays the signals corresponding to the different non-equivalent carbon atoms at different values of δ as follows: at ca. δ 10.07 ppm (H
3C-C), 15.87 ppm (H
3C-H
2C) and 18.97 ppm (H
3C-N) corresponding to carbon atoms of methyl groups; at ca. δ 25.87 ppm (H
2C-S), 27.55 ppm (H
2C-N) and 97.13 ppm (MeH
2C-N) due to methylene carbon atoms; at ca. δ 117.73, 119.92, 121.07 and 125.81 ppm due to the aromatic carbon atoms; at ca. δ 143.23 and 151.07 ppm (H
3C-C and H
3C-N) due to carbon atoms of pyrazoline rings; at ca. δ 153.97 ppm (C=N) due to carbon atoms azomethine groups and at ca. δ 165.15 ppm (C=O) due to carbon atom of carbonyl groups [
15,
16].
Figure 3.
13C-NMR spectrum of the ligand L.
Figure 3.
13C-NMR spectrum of the ligand L.
IR spectra
Selected IR bands of the ligand and its complexes are listed in
Table 3. The IR spectrum of the ligand displays bands at 1647, 1621 and 1532 cm
−1, which may be assigned to the ν(C=O) amide I, ν(C=N) (azomethine linkage) stretching vibration and δ
NH (NH in-plane-bending) (amide III) vibrations. The band appearing at 768 cm
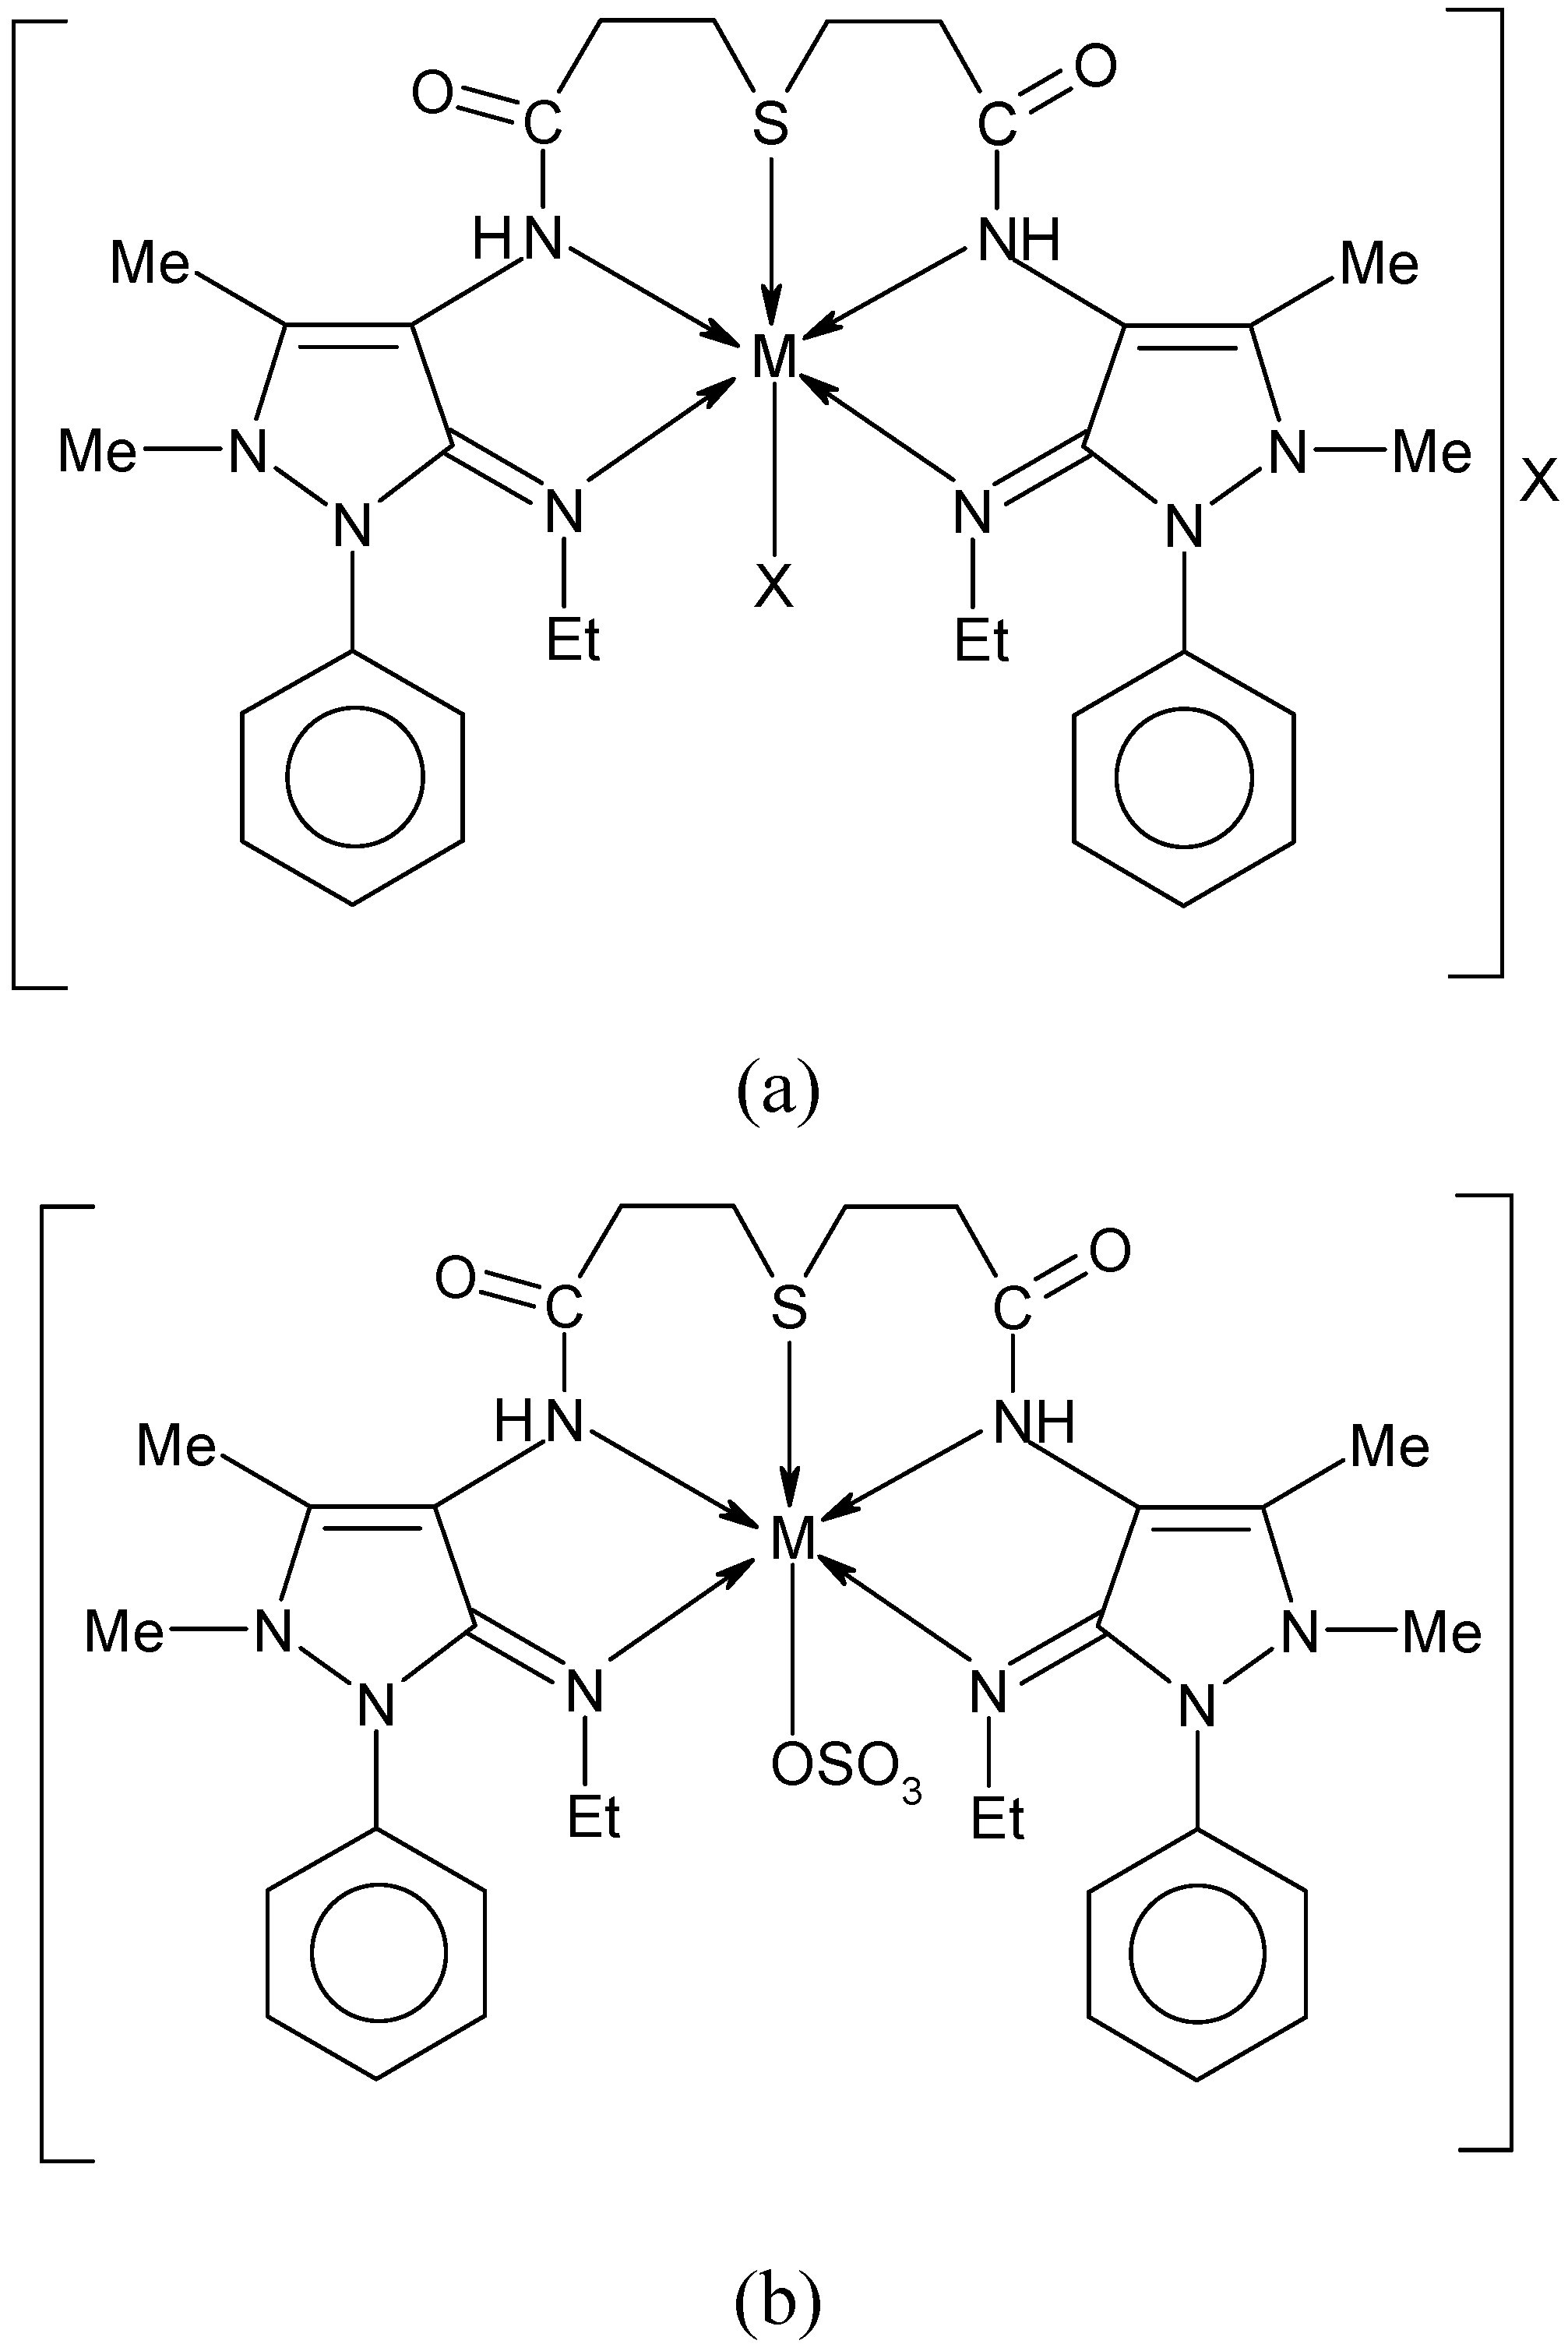
−1 in the spectrum corresponds to the C-S stretching vibration. The C-S group is less polar in comparison to a C=O group and has a considerably weaker bond, so consequently the corresponding band appeared at a lower frequency. The bands corresponding to the C=N stretching, NH in-plane-bending and C-S stretching vibrations show the downward shift upon coordination which indicates that the nitrogen atoms of azomethine and NH groups and sulfur atom of C-S group are coordinated to the metal atom. However, the band corresponding to the C=O group (amide I) remains almost unchanged on complexation, which indicates that the carbonyl group oxygen atom is not involved in coordination. This discussion suggests that the ligand coordinates to metal atom in quinquedentate fashion (NNSNN) [
17,
18,
19,
20,
21].
Table 2.
The NMR data of the Schiff’s base ligand.
Table 2.
The NMR data of the Schiff’s base ligand.
| 1H-NMR | 13C-NMR |
|---|
| δ (ppm) | Assignment | δ (ppm) | Assignment |
|---|
| 1.136-1.171 | t, 6H, 2H3C-H2C | 10.07 | C(7), C(20) |
| 1.601 | s, 6H, 2H3C-C | 15.87 | C(11), C(24) |
| 1.714 | s, 6H, 2H3C-N | 18.97 | C(5), C(21) |
| 5.793-5.949 | m, 12H, 6CH2 | 25.87 | C(13), C(16) |
| 7.158-7.953 | m, 10H, Ar | 27.55 | C(14), C(15) |
| 9.687 | br, 2H, 2NH | 97.13 | C(10), C(23) |
![Molecules 14 00174 i001]() | 117.73 | C(2, 2’), C(27, 27’) |
| 119.92 | C(3, 3’), C(26, 26’) |
| 121.07 | C(1), C(28) |
| 125.81 | C(4), C(25) |
| 143.23 | C(6), C(19) |
| 151.07 | C(8), C(18) |
| 153.97 | C(9), C(22) |
| 165.15 | C(12), C(17) |
The coordination behavior of the ligand is also verified by the appearance of new IR bands in the spectra of complexes in the 384-501 and 313-351 cm
−1 range (
Table 3). These bands may be assigned to ν(M-N) and ν(M-S) stretching vibrations, respectively. In addition, the IR spectra of complexes also display the bands due to anions. The nitrato complexes show the IR bands in the range 1397-1407 (ν
5), 1304-1313 (ν
1) and 1058-1075 cm
−1 (ν
2) due to NO stretching vibration of the NO
3− ion. The Δν i.e. ν
5-ν
1 (93-95 cm
−1) indicates the unidentate coordination of NO
3− ion. The chloro complexes show the bands in the region 307-321 cm
−1 to the ν(M-Cl). The acetato complexes give the IR bands in the region 1401-1412 cm
-1 and 1207-1214 cm
−1 due to ν
as(OAc) and ν
s(OAc) stretching vibrations, respectively. The Δν i.e. 187-204 cm
−1 suggests the unidentate coordination of OAc
− ion. In the sulphato complexes, the two medium intensity bands in the range 951-964 cm
−1 (ν
1) and 439-448 cm
−1 (ν
2) and a strong band 1037-1137 cm
−1 (ν
3) are appeared. The splitting of ν
3 band in to two bands suggests the coordination of SO
4−2 ion in unidentate manner [
22].
Table 3.
Selected IR bands of Schiff’s base ligand and its complexes.
Table 3.
Selected IR bands of Schiff’s base ligand and its complexes.
| Compound | ν(C=N) | ν(C=O) amide I | δ(NH) amide III | ν(C-S) | ν(M-N) | ν(M-S) | Anion bands |
|---|
| Ligand | 1621s | 1647vs | 1532s | 768ms | _ | _ | _ |
| [Co(L)NO3]NO3 | 1570s | 1648s | 1494mw | 761mw | 425w | 335w | 1405mw, 1310m, 1058m |
| [Co(L)Cl]Cl | 1601sh | 1646s | 1489m | 740sh | 464m | 339m | 307sh |
| [Co(L)OAc]OAc | 1593m | 1645s | 1488m | 717mw | 403m | 347sh | 1412s, 1208m |
| [Co(L)SO4] | 1576m | 1748s | 1501m | 722m | 436m | 339mw | 1087m, 1074m, 951m, 439mw |
| [Ni(L)NO3]NO3 | 1571ms | 1651s | 1493m | 652br | 479m | 326m | 1407m, 1313m, 1075mw |
| [Ni(L)Cl]Cl | 1570m | 1640m | 1405m | 673br | 384sh | 343sh | 318sh |
| [Ni(L)OAc]OAc | 1591m | 1648ms | 1406m | 651br | 475mw | 329m | 1406s, 1207s |
| [Ni(L)SO4] | 1596m | 1647s | 1507m | 668m | 479m | 313s | 1048s, 1037s, 964m, 448m |
| [Cu(L)NO3]NO3 | 1576vs | 1643s | 1517s | 669ms | 422mw | 342m | 1397s, 1304s, 1064m |
| [Cu(L)Cl]Cl | 1564w | 1647s | 1490m | 699m | 501w | 351m | 321sh |
| [Cu(L)OAc]OAc | 1570vs | 1650s | 1492ms | 684ms | 477m | 326m | 1401m, 1214m |
| [Cu(L)SO4] | 1568s | 1648s | 1490s | 684m | 458m | 318sh | 1137m, 1103m, 959m, 440mw |
Electronic spectra
The electronic spectra of the complexes were recorded in DMSO solutions. The electronic spectral data of the complexes are given in
Table 4. All the complexes show the high energy absorption band in the region 34,511–38,910 cm
−1. This transition may be attributed to the charge transfer band.
The electronic spectra of cobalt(II) complexes display the d–d transition bands in the region 9,746–10,471, 15,247–19,493 and 18,621–22,371 cm−1. These transitions may be assigned to the 4T1g (F) → 4T2g (F) ν1, 4T1g (F) → 4A2g (F) ν2 and 4T1g (F) → 4T1g (P) ν3, respectively. The transitions correspond to the tetragonal geometry of the complexes.
The absorption spectra of nickel(II) complexes display three d-d transition bands in the range 11,135 –12,108, 18,621–19,416 and 21,413–27,322 cm−1. The transitions correspond to the 3A2g (F) → 3T2g (F) ν1, 3A2g (F) → 3T1g (F) ν2 and 3A2g (F) → 3T1g (P) ν3, respectively. These transitions reveal that the nickel complexes possess an octahedral geometry and D4h symmetry.
Electronic spectra of copper(II) complexes show the d-d transition bands in the range 12,188–15,479, 18,621–19,132 and 24,402–27,322 cm
−1. These bands correspond to
2B
1g ←
2A
1g (
![Molecules 14 00174 i002]()
) ν
1,
2B
1g ←
2B
2g (
![Molecules 14 00174 i003]()
) ν
2 and
2B
1g ←
2E
g (
![Molecules 14 00174 i004]()
) ν
3 transitions, respectively. The spectra are typical of Cu(II) complexes with an elongated tetragonal. The spectra of all the complexes have been vibronically assigned to D
4h symmetry with a
![Molecules 14 00174 i005]()
ground state. The most active vibration in this point group appears to be b
1u symmetry and its efficiency may arise from its being the only out-of-the-xy-plane vibration. The complexes are with one electron sequence i.e.
![Molecules 14 00174 i005]()
>
![Molecules 14 00174 i006]()
> d
xy > d
xz, d
yz [
23,
24].
Table 4.
Magnetic moment values, electronic spectral and ligand field parameters data of complexes.
Table 4.
Magnetic moment values, electronic spectral and ligand field parameters data of complexes.
| Complex | meff (B.M.) | lmax (cm−1) | Dq (cm−1) | B(cm−1) | β | LFSE (kJmol−1) |
|---|
| [Co(L)NO3]NO3 | 5.02 | 10384, 16326,18621, 36101 | 984.2 | 532.03 | 0.48 | 94.07 |
| [Co(L)Cl]Cl | 5.08 | 9746, 19493, 22371, 37878 | 1186.9 | 913.10 | 0.81 | 113.44 |
| [Co(L)OAc]OAc | 5.06 | 10471, 16702, 21188, 36363 | 1177.1 | 784.74 | 0.70 | 112.50 |
| [Co(L)SO4] | 5.01 | 9856, 15247, 19555, 37724 | 1069.9 | 737.92 | 0.66 | 102.27 |
| [Ni(L)NO3]NO3 | 2.84 | 11248, 18621, 21413, 36101 | 1124.8 | 419.33 | 0.40 | 161.26 |
| [Ni(L)Cl]Cl | 2.87 | 11185, 18688, 27322, 38022 | 1118.5 | 830.33 | 0.79 | 160.36 |
| [Ni(L)OAc]OAc | 2.93 | 11135, 18621, 25510, 36900 | 1113.5 | 715.07 | 0.69 | 159.64 |
| [Ni(L)SO4] | 2.82 | 12108, 19416, 26131, 37028 | 1210.8 | 614.86 | 0.59 | 173.59 |
| [Cu(L)NO3]NO3 | 1.82 | 13042, 19066, 24402, 34511 | - | - | - | - |
| [Cu(L)Cl]Cl | 1.91 | 15479, 18621, 27322, 38910 | - | - | - | - |
| [Cu(L)OAc]OAc | 1.86 | 12188, 19132, 25382, 35610 | - | - | - | - |
| [Cu(L)SO4] | 1.85 | 14022, 18651, 26052, 36020 | - | - | - | - |
The ligand field parameters like Racah inter-electronic repulsion parameter B, ligand field splitting stabilization energy 10 Dq, covalency factor β and ligand field stabilization energy (LFSE) have been calculated for the Co(II) and Ni(II) complexes. The values of B and Dq of Co(II) complexes were calculated from the transition energy ratio diagram using ν
3/ν
1 ratio. The value of β for the complexes under study accounts for the covalent nature of the complexes. The evaluated parameters are listed in
Table 4.
EPR spectra
The X-band EPR spectra of the Co(II) complexes were recorded at liquid nitrogen temperature in polycrystalline form. The line shaped EPR spectra of Co(II) complexes with g
iso = 2.10−2.14 (
Table 5) correspond to the tetragonal symmetry around the Co(II) atoms.
As a consequence of the fast spin-relaxation time of high-spin cobalt(II) ion, the signals are observed only at low temperature. The polycrystalline powder EPR signals for the Co(II) complexes are broad. The spectra are consistent with an S = 3/2 spin state. No hyperfine splitting of the transitions is detected since it is difficult to resolve this splitting in nonmagnetically diluted Co(II) complexes. The line shapes are mostly dominated by the unresolved hyperfine interactions and by a distribution of E/D, where E and D describe the axial and rhombic Zero field splitting (ZFS) constants, respectively. The spread of E/D results in a spread of g-values (g-strain). The dominant broadening effect is realized when the g-strain is converted in <B-strain> with the relation ΔB = -(hν/β)(Δg/g
2), where the parameters have their usual definitions. Thus, the largest and smallest g-values of the S = 3/2 spectrum have field widths that differ by an order of magnitude, rationalizing why the high field features of the spectra are so broad [
25,
26].
Table 5.
EPR parameters and orbital reduction parameters of Co(II) and Cu(II) complexes.
Table 5.
EPR parameters and orbital reduction parameters of Co(II) and Cu(II) complexes.
| Complex | g⊥ | g|| | giso | G | k⊥2 | k||2 | k |
|---|
| [Co(L)NO3]NO3 | 2.0006 | 2.3694 | 2.12 | - | - | - | - |
| [Co(L)Cl]Cl | 2.0034 | 2.4128 | 2.14 | - | - | - | - |
| [Co(L)OAc]OAc | 2.0018 | 2.3917 | 2.13 | - | - | - | - |
| [Co(L)SO4] | 2.0021 | 2.2916 | 2.10 | - | - | - | - |
| [Cu(L)NO3]NO3 | 2.0311 | 2.2402 | 2.10 | 8.26 | 0.42 | 0.69 | 0.74 |
| [Cu(L)Cl]Cl | 2.0319 | 2.2421 | 2.10 | 8.10 | 0.49 | 0.67 | 0.71 |
| [Cu(L)OAc]OAc | 2.0216 | 2.1839 | 2.08 | 9.41 | 0.30 | 0.53 | 0.61 |
| [Cu(L)SO4] | 2.0294 | 2.2112 | 2.09 | 7.71 | 0.43 | 0.59 | 0.69 |
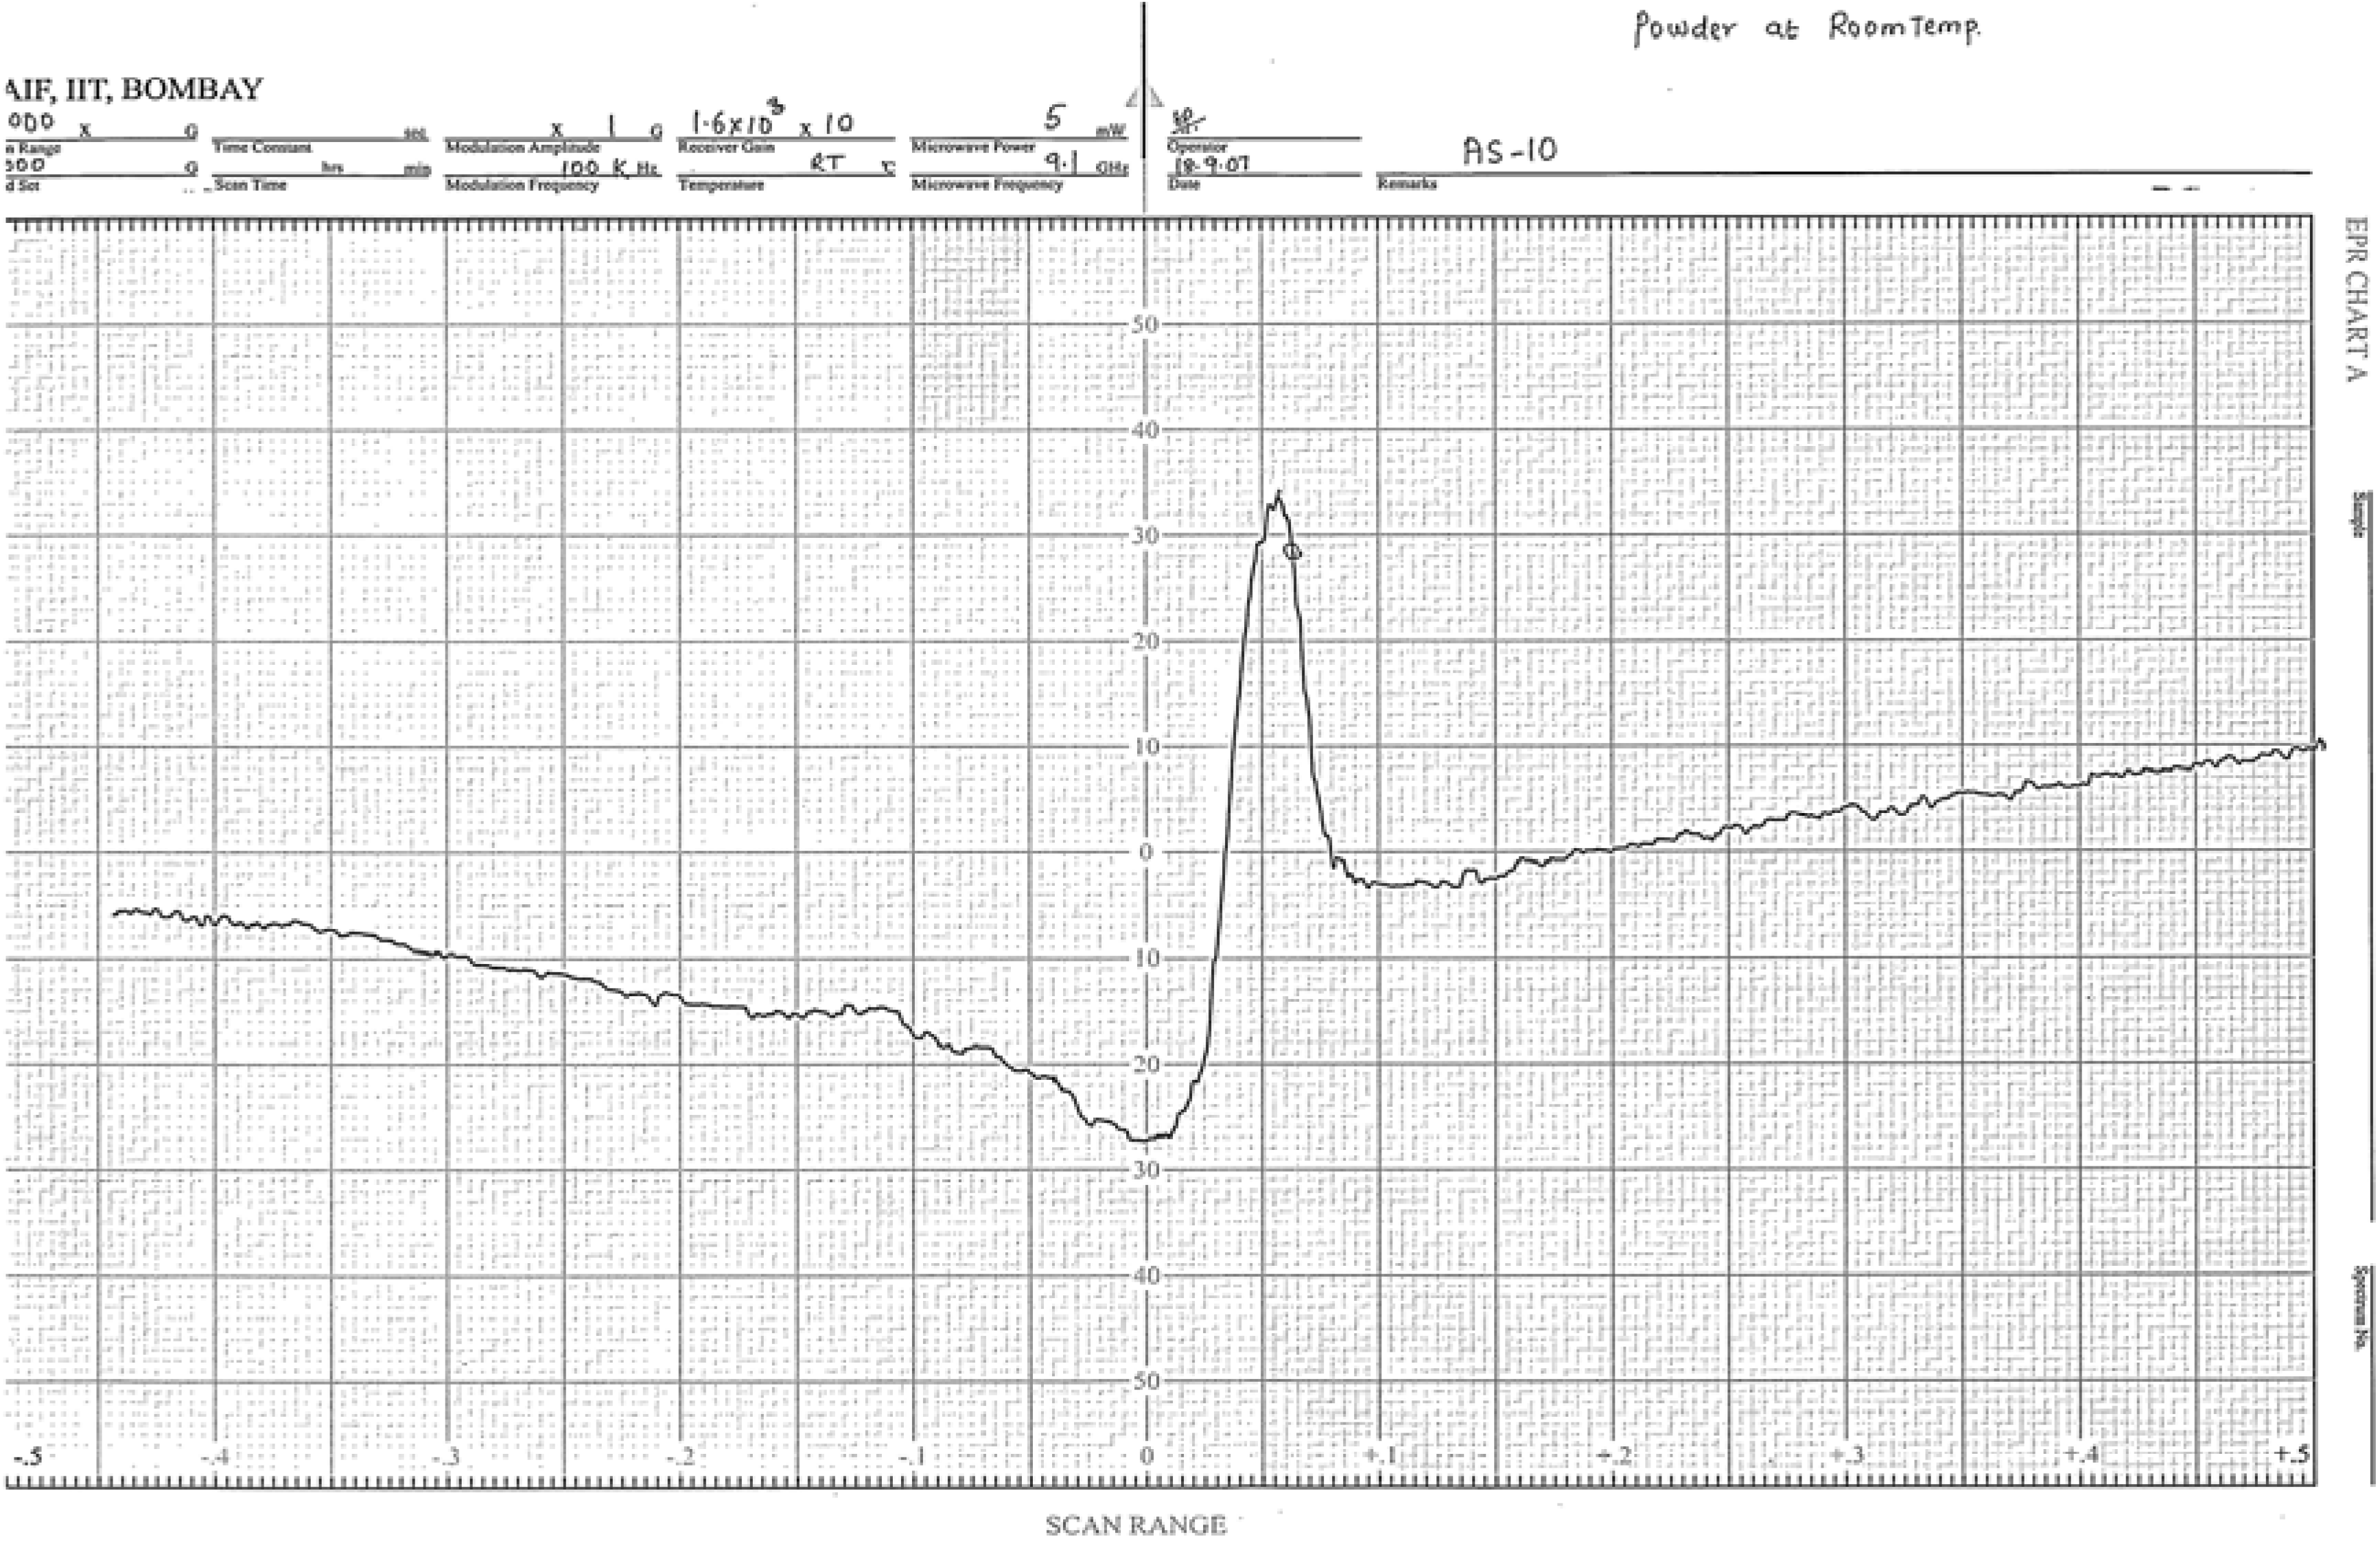
Figure 4.
EPR spectrum of the [Cu(L)Cl]Cl complex.
Figure 4.
EPR spectrum of the [Cu(L)Cl]Cl complex.
The X-band EPR spectra of copper(II) complexes were recorded at room temperature in polycrystalline form. The spectra show only one broad signal at g
iso = 2.08 – 2.10 (
Figure 4). The spectral studies reveal that the Cu(II) ion in the present complexes is in tetragonal field and shows the D
4h symmetry. The calculated values of g
|| and g
⊥ for the complexes show the order as g
|| > g
⊥ > 2.0023 (
Table 5), which is consistent with the
![Molecules 14 00174 i005]()
ground state [
27,
28]. The odd electron is located in the B
1g antibonding orbital.
The geometric parameter G i.e. the measurement of exchange interaction between the copper centres in the polycrystalline compounds, is calculated by using the expression:
The complexes in the present study show the G values greater than 4 (
Table 5), which suggest that the interaction between metal centres is negligible [
24].
For the copper(II) complexes, the EPR parameters and the d-d transition energies are used to evaluate, the orbital reduction factor k by using the expression: k
2 = k
||2 + 2k
⊥2/3, where k
|| and k
⊥ are the parallel and perpendicular components of the orbital reduction factor. The low values of k (0.61-0.74) indicate the covalent nature of the complexes (
Table 5). On the basis of above discussion, the structures of complexes are given in
Figure 5.
Figure 5.
Structure of complexes (a) [M(L)X]X, (b) [M(L)SO4], where M =Co(II), Ni(II) and Cu(II), L = ligand and X = NO3−, Cl− and OAc−.
Figure 5.
Structure of complexes (a) [M(L)X]X, (b) [M(L)SO4], where M =Co(II), Ni(II) and Cu(II), L = ligand and X = NO3−, Cl− and OAc−.
Antimicrobial activities
The data of the antifungal and antibacterial activities of ligand and complexes are given in
Table 6 and
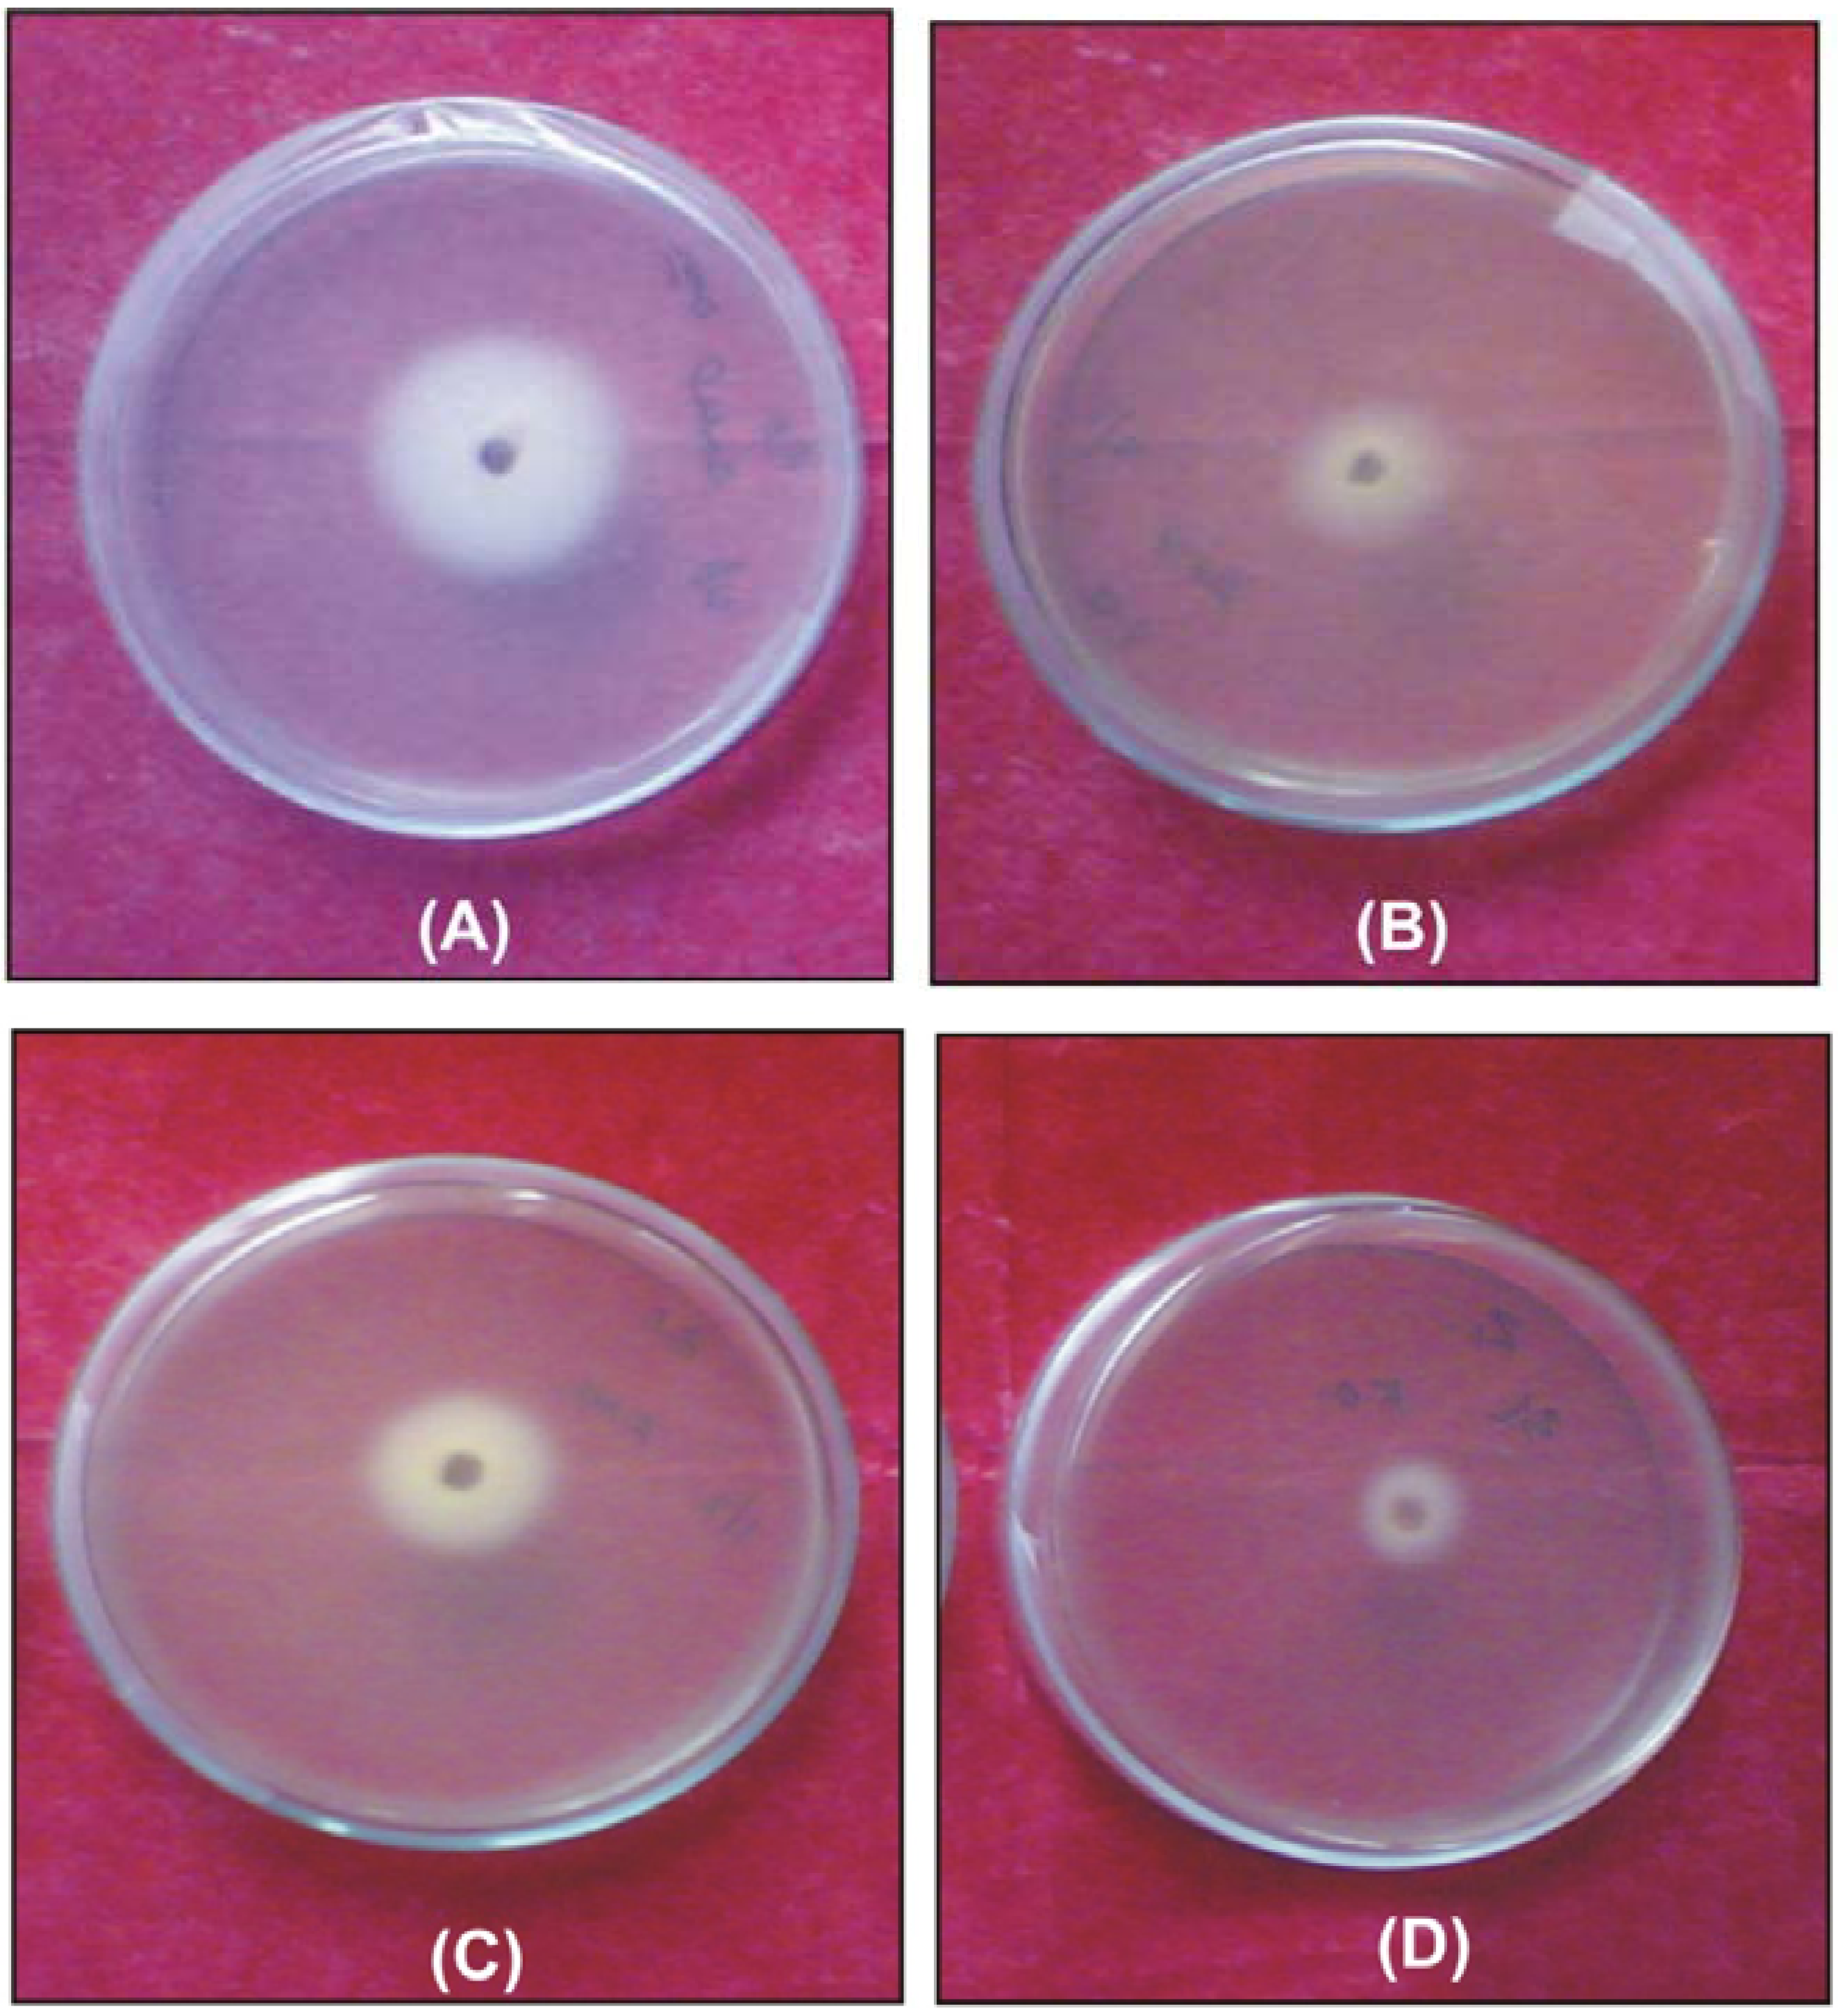
Table 7. The data reveal that the complexes have higher activities than the free ligand (
Figure 6). This enhancement of the activity of ligand on complexation can be explained by Overtone’s Concept and Chelation Theory [
29]. The theory states that chelation reduces the polarity of the metal atom by the partial sharing of its positive charge with donor groups and possible π–electron delocalization over the whole ring. This results with increasing of the lipophilic character of the complex and favor the permeation of the complex through the lipid layer of cell membrane. The complex blocks the metal binding sites in the enzymes of microorganisms. Consequently, the complex disturbs the metabolism pathways in cell and as a result microorganisms die.
Table 6.
Antifungal activity data of compounds.
Table 6.
Antifungal activity data of compounds.
| Compound | Fungal inhibition (%) (conc. in μg∙mL−1) |
|---|
| A. brassicae | A. niger | F. oxysporum |
|---|
| 100 | 200 | 300 | 100 | 200 | 300 | 100 | 200 | 300 |
|---|
| Ligand (L) | 40 | 52 | 62 | 35 | 50 | 58 | 42 | 60 | 66 |
| [Co(L)NO3]NO3 | 52 | 61 | 70 | 50 | 60 | 68 | 52 | 70 | 77 |
| [Co(L)Cl]Cl | 50 | 60 | 68 | 48 | 61 | 65 | 50 | 68 | 76 |
| [Co(L)OAc]OAc | 50 | 60 | 70 | 50 | 59 | 66 | 49 | 70 | 78 |
| [Co(L)SO4] | 48 | 59 | 68 | 50 | 60 | 66 | 50 | 70 | 76 |
| [Ni(L)NO3]NO3 | 58 | 70 | 78 | 65 | 74 | 80 | 60 | 74 | 85 |
| [Ni(L)Cl]Cl | 58 | 68 | 75 | 62 | 75 | 82 | 58 | 75 | 86 |
| [Ni(L)OAc]OAc | 55 | 65 | 76 | 64 | 70 | 80 | 60 | 72 | 85 |
| [Ni(L)SO4] | 57 | 68 | 76 | 63 | 72 | 80 | 59 | 74 | 84 |
| [Cu(L)NO3]NO3 | 60 | 72 | 80 | 64 | 75 | 84 | 60 | 74 | 90 |
| [Cu(L)Cl]Cl | 58 | 70 | 81 | 65 | 71 | 85 | 59 | 74 | 88 |
| [Cu(L)OAc]OAc | 60 | 71 | 80 | 65 | 70 | 82 | 60 | 72 | 90 |
| [Cu(L)SO3] | 60 | 72 | 80 | 65 | 74 | 85 | 60 | 72 | 88 |
| Standard (Captan) | 70 | 80 | 100 | 75 | 90 | 100 | 65 | 75 | 100 |
Table 7.
Antibacterial activity data of compounds.
Table 7.
Antibacterial activity data of compounds.
| Compound | Bacterial inhibition zone (mm) (conc. in μg∙mL−1) |
|---|
| Xanthomonas compestris | Pseudomonas aeruginosa |
|---|
| 250 | 500 | 1000 | 250 | 500 | 1000 |
|---|
| Ligand (L) | 10 | 12 | 15 | 8 | 12 | 14 |
| [Co(L)NO3]NO3 | 14 | 16 | 21 | 15 | 18 | 20 |
| [Co(L)Cl]Cl | 14 | 16 | 20 | 14 | 18 | 20 |
| [Co(L)OAc]OAc | 14 | 17 | 19 | 14 | 17 | 20 |
| [Co(L)SO4] | 14 | 16 | 20 | 15 | 18 | 19 |
| [Ni(L)NO3]NO3 | 16 | 20 | 25 | 17 | 22 | 25 |
| [Ni(L)Cl]Cl | 15 | 21 | 24 | 16 | 20 | 25 |
| [Ni(L)OAc]OAc | 15 | 20 | 24 | 16 | 20 | 24 |
| [Ni(L)SO4] | 16 | 20 | 24 | 16 | 21 | 25 |
| [Cu(L)NO3]NO3 | 16 | 21 | 26 | 18 | 22 | 28 |
| [Cu(L)Cl]Cl | 16 | 22 | 25 | 18 | 23 | 27 |
| [Cu(L)OAc]OAc | 17 | 22 | 26 | 17 | 21 | 27 |
| [Cu(L)SO4] | 17 | 22 | 25 | 18 | 22 | 26 |
Figure 6.
Antifungal activity against Fusarium oxysporum of: (A) ligand; (B) [Ni(L)NO3]NO3; (C) [Co(L)Cl]Cl and (D) [Cu(L)NO3]NO3.
Figure 6.
Antifungal activity against Fusarium oxysporum of: (A) ligand; (B) [Ni(L)NO3]NO3; (C) [Co(L)Cl]Cl and (D) [Cu(L)NO3]NO3.


 ) ν1,2B1g ← 2B2g (
  ) ν2 and 2B1g ← 2Eg (
  ) ν3 transitions, respectively. The spectra are typical of Cu(II) complexes with an elongated tetragonal. The spectra of all the complexes have been vibronically assigned to D4h symmetry with a
  ground state. The most active vibration in this point group appears to be b1u symmetry and its efficiency may arise from its being the only out-of-the-xy-plane vibration. The complexes are with one electron sequence i.e.
  > dxy > dxz, dyz [23,24].


