Changed Temporal Structure of Neuromuscular Control, Rather Than Changed Intersegment Coordination, Explains Altered Stabilographic Regularity after a Moderate Perturbation of the Postural Control System


Abstract
:
1. Introduction
2. Materials and Methods
2.1. Ethics
2.2. Participants
2.3. Measurement Procedures
2.4. Instrumentation
2.5. Data Processing
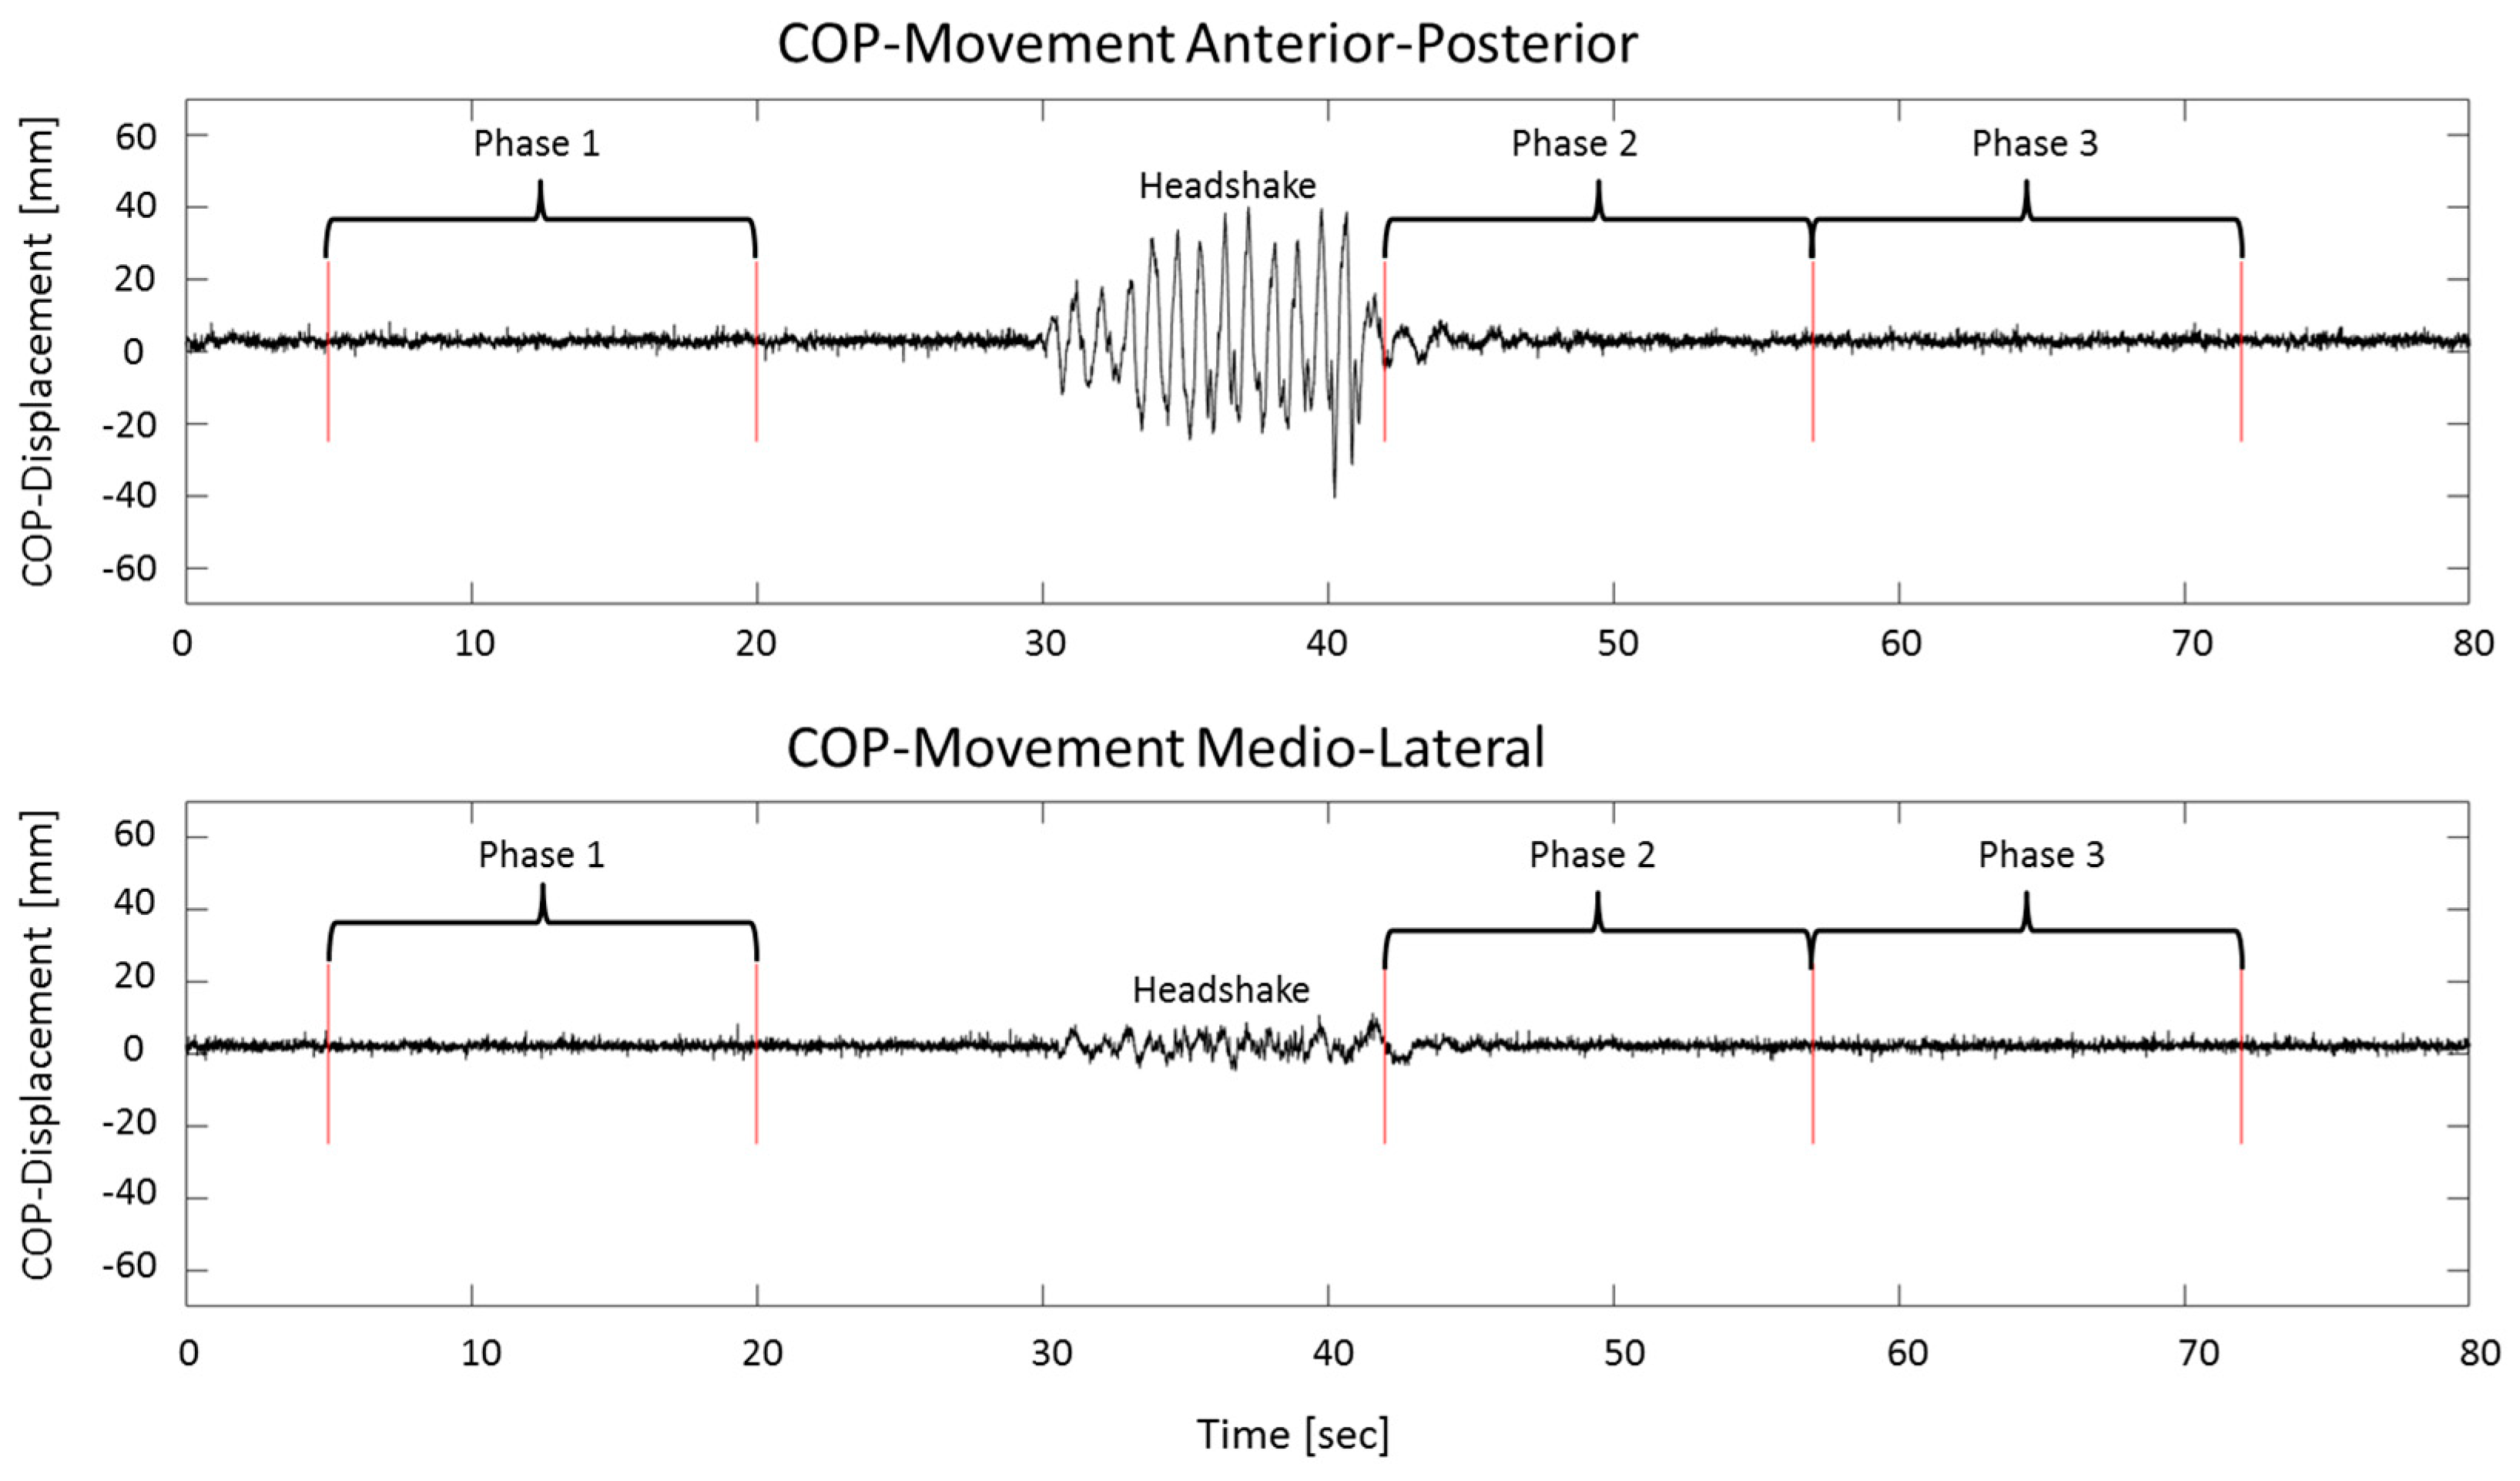
2.6. Processing of Center-of-Pressure Data
2.7. Processing of Kinematic Data: Calculation of Principal Movements (PMs)
2.8. Sample Entropy Calculation
2.9. Statistics
3. Results
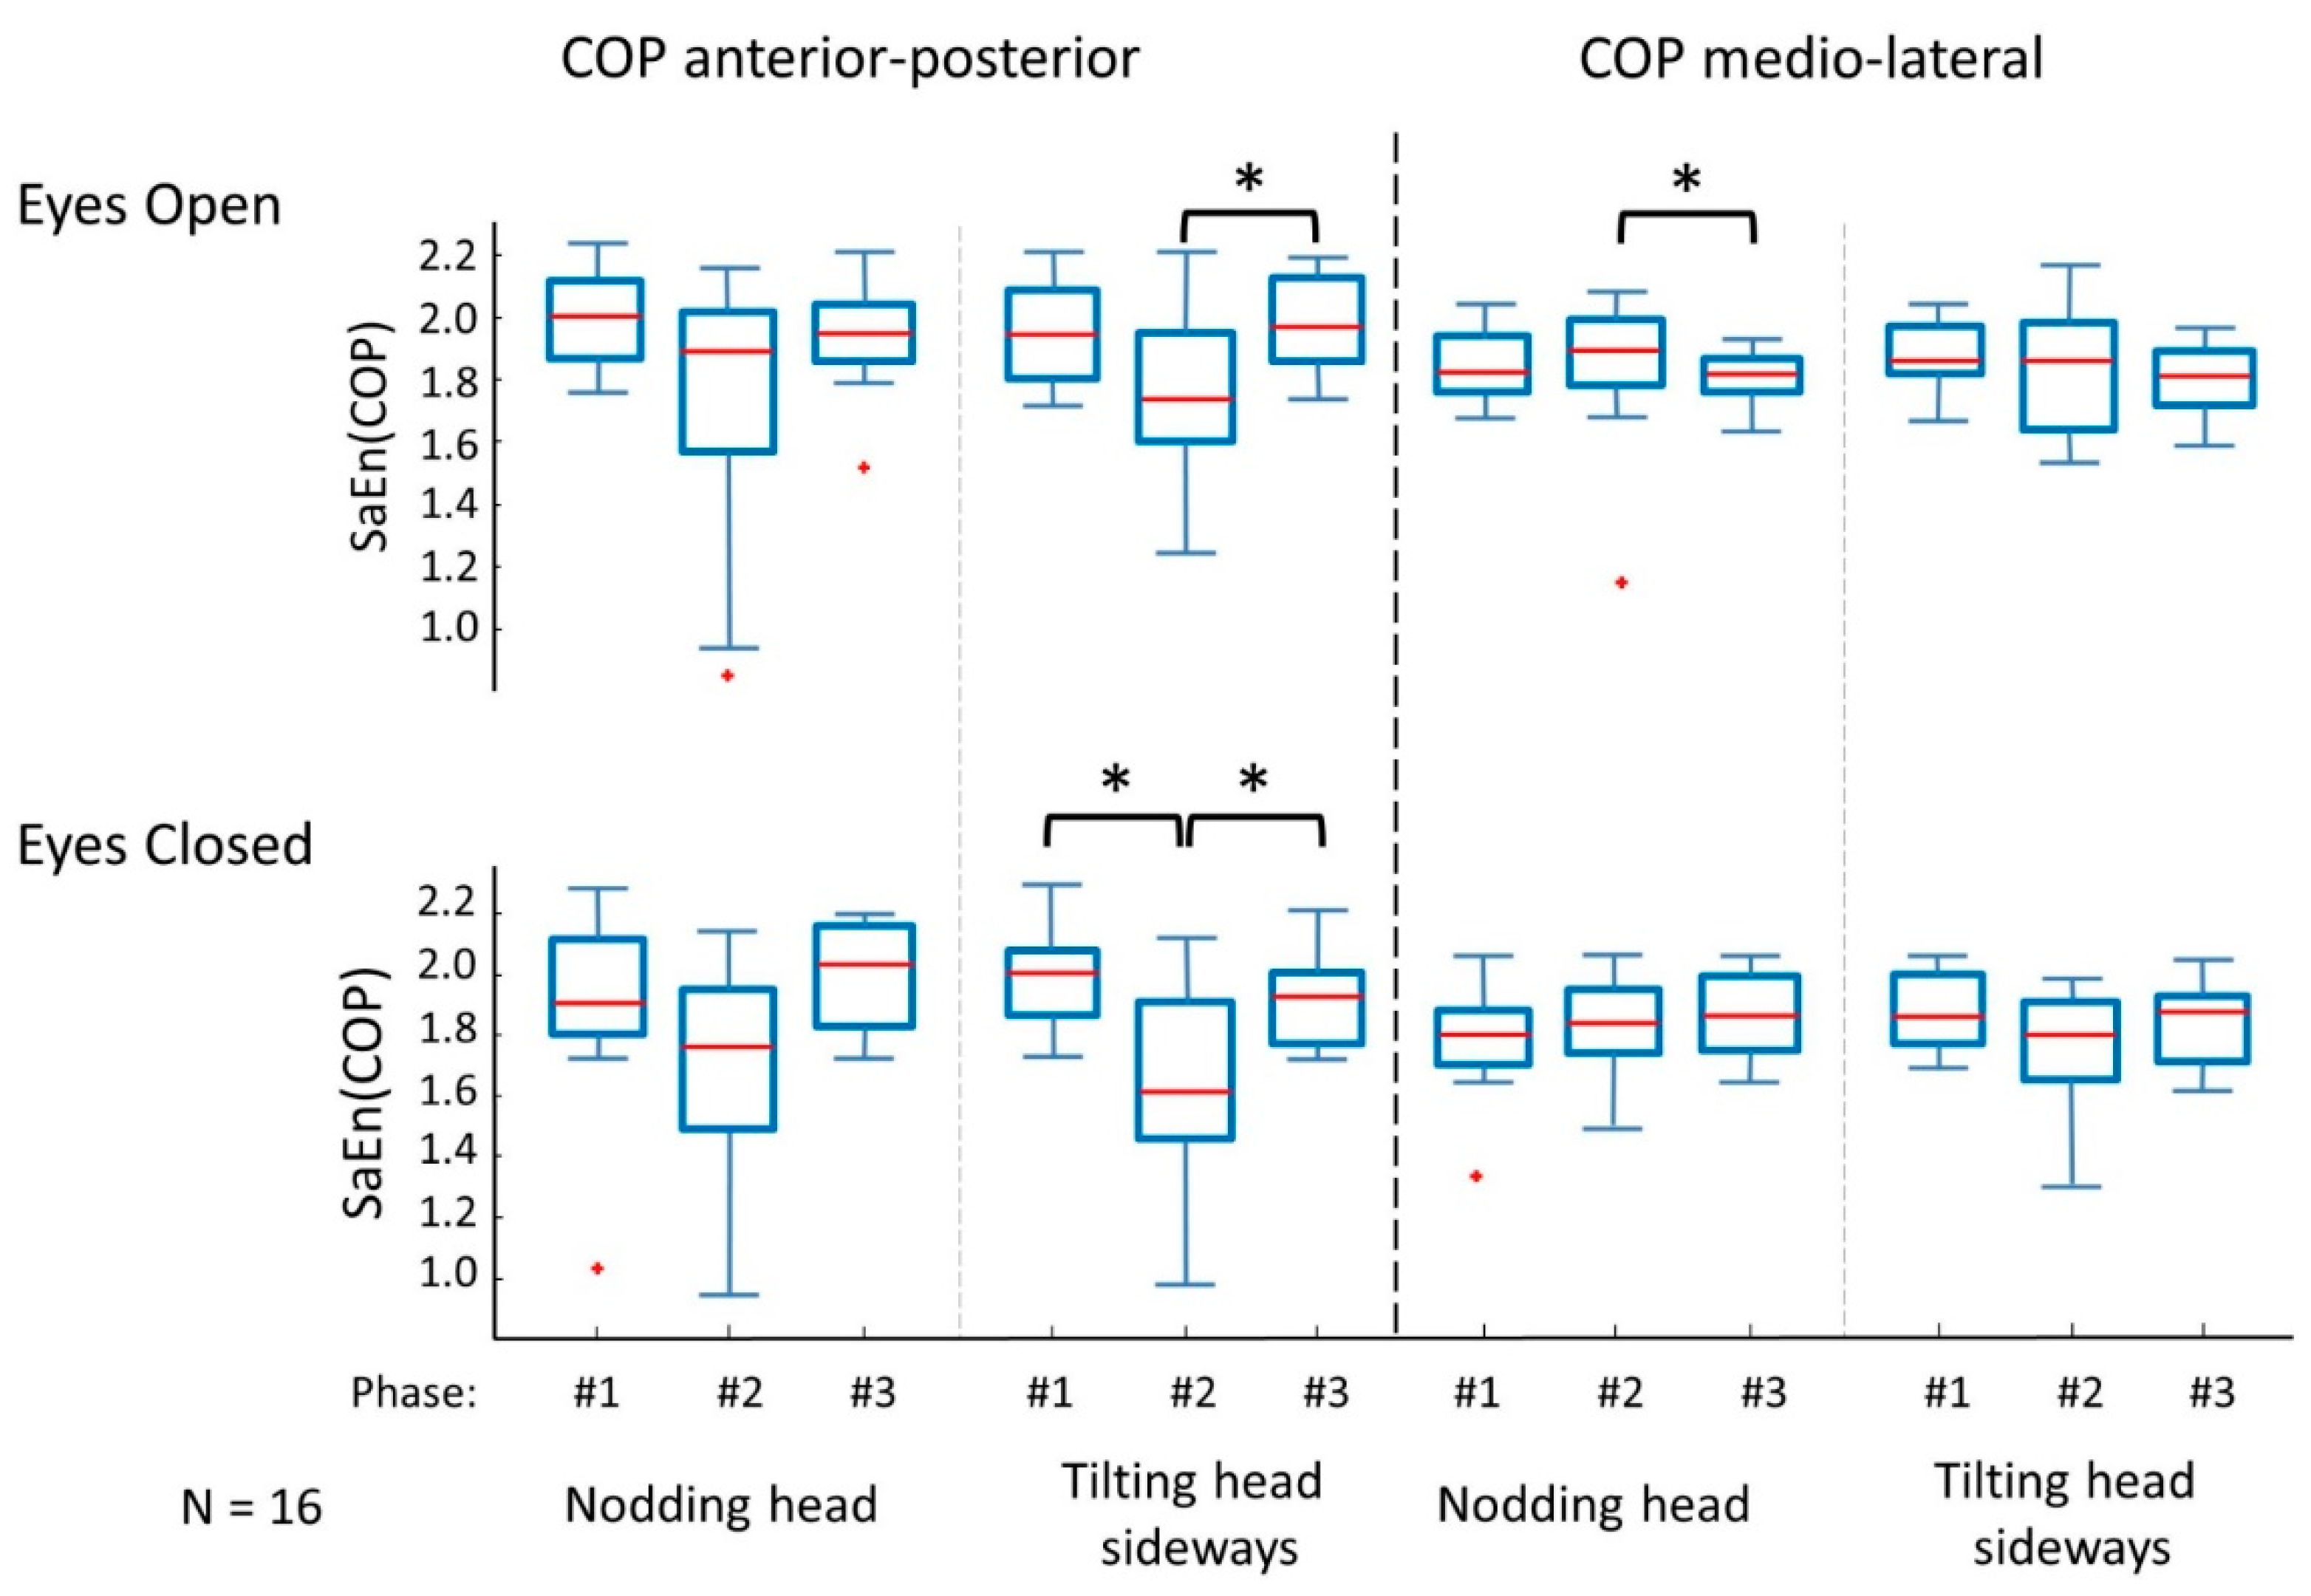
3.1. Center of Pressure Sample Entropy
3.2. Effects of Head Shaking on the Entropy of the Kinematic Movement Components
3.3. Effects of Head Shaking on the Coordinative Complexity of the Postural Movements
4. Discussion
4.1. Main Results
4.2. Limitations
5. Conclusions
Supplementary Materials
Author Contributions
Funding
Acknowledgments
Conflicts of Interest
References
- Massion, J. Postural control system. Curr. Opin. Neurobiol. 1994, 4, 877–887. [Google Scholar] [CrossRef]
- Cavanaugh, J.T.; Guskiewicz, K.M.; Giuliani, C.; Marshall, S.; Mercer, V.; Stergiou, N. Detecting altered postural control after cerebral concussion in athletes with normal postural stability. Br. J. Sports Med. 2005, 39, 805–811. [Google Scholar] [CrossRef] [Green Version]
- Memari, A.H.; Ghanouni, P.; Shayestehfar, M.; Ghaheri, B. Postural Control Impairments in Individuals With Autism Spectrum Disorder: A Critical Review of Current Literature. Asian J. Sports Med. 2014, 5. [Google Scholar] [CrossRef] [PubMed]
- Tasseel-Ponche, S.; Yelnik, A.P.; Bonan, I.V. Motor strategies of postural control after hemispheric stroke. Neurophysiol. Clin. Neurophysiol. 2015, 45, 327–333. [Google Scholar] [CrossRef] [PubMed]
- Manor, B.; Hu, K.; Zhao, P.; Selim, M.; Alsop, D.; Novak, P.; Lipsitz, L.; Novak, V. Altered control of postural sway following cerebral infarction: A cross-sectional analysis. Neurology 2010, 74, 458–464. [Google Scholar] [CrossRef] [PubMed] [Green Version]
- Vaugoyeau, M.; Viel, S.; Assaiante, C.; Amblard, B.; Azulay, J.P. Impaired vertical postural control and proprioceptive integration deficits in Parkinson’s disease. Neuroscience 2007, 146, 852–863. [Google Scholar] [CrossRef]
- Derlich, M.; Kręcisz, K.; Kuczyński, M. Attention demand and postural control in children with hearing deficit. Res. Dev. Disabil. 2011, 32, 1808–1813. [Google Scholar] [CrossRef]
- Rigoldi, C.; Cimolin, V.; Camerota, F.; Celletti, C.; Albertini, G.; Mainardi, L.; Galli, M. Measuring regularity of human postural sway using approximate entropy and sample entropy in patients with Ehlers–Danlos syndrome hypermobility type. Res. Dev. Disabil. 2013, 34, 840–846. [Google Scholar] [CrossRef]
- Gruber, A.H.; Busa, M.A.; Gorton III, G.E.; Van Emmerik, R.E.A.; Masso, P.D.; Hamill, J. Time-to-contact and multiscale entropy identify differences in postural control in adolescent idiopathic scoliosis. Gait Posture 2011, 34, 13–18. [Google Scholar] [CrossRef]
- Donker, S.F.; Ledebt, A.; Roerdink, M.; Savelsbergh, G.J.P.; Beek, P.J. Children with cerebral palsy exhibit greater and more regular postural sway than typically developing children. Exp. Brain Res. 2008, 184, 363–370. [Google Scholar] [CrossRef]
- Galli, M.; Rigoldi, C.; Mainardi, L.; Tenore, N.; Onorati, P.; Albertini, G. Postural control in patients with Down syndrome. Disabil. Rehabil. 2008, 30, 1274–1278. [Google Scholar] [CrossRef] [PubMed]
- Gribble, P.A.; Hertel, J. Effect of hip and ankle muscle fatigue on unipedal postural control. J. Electromyogr. Kinesiol. 2004, 14, 641–646. [Google Scholar] [CrossRef] [PubMed]
- Gribble, P.A.; Hertel, J. Effect of lower-extremity muscle fatigue on postural control. Arch. Phys. Med. Rehabil. 2004, 85, 589–592. [Google Scholar] [CrossRef] [PubMed]
- Melzer, I.; Benjuya, N.; Kaplanski, J. Age-related changes of postural control: Effect of cognitive tasks. Gerontology 2001, 47, 189–194. [Google Scholar] [CrossRef] [PubMed]
- Huxhold, O.; Li, S.-C.; Schmiedek, F.; Lindenberger, U. Dual-tasking postural control: Aging and the effects of cognitive demand in conjunction with focus of attention. Brain Res. Bull. 2006, 69, 294–305. [Google Scholar] [CrossRef] [PubMed] [Green Version]
- Ramdani, S.; Seigle, B.; Lagarde, J.; Bouchara, F.; Bernard, P.L. On the use of sample entropy to analyze human postural sway data. Med. Eng. Phys. 2009, 31, 1023–1031. [Google Scholar] [CrossRef] [PubMed]
- Ella, K.; Kristinsdottir, M.M. Eva Nordell, Gun-Britt Jarnlo, Annika Tjäder, Karl-Göran Thorngren Observation of Vestibular Asymmetry in a Majority of Patients over 50 Years With Fall-Related Wrist Fractures. Acta Otolaryngol. (Stockh.) 2001, 121, 481–485. [Google Scholar]
- Guo, L.; Yang, C.; You, Y.; Chen, S.; Yang, C.; Hou, Y.; Wu, W. Underlying mechanisms of Tai-Chi-Chuan training for improving balance ability in the elders. Chin. J. Integr. Med. 2014, 20, 409–415. [Google Scholar] [CrossRef] [PubMed]
- Haran, F.J.; Tierney, R.; Wright, W.G.; Keshner, E.; Silter, M. Acute Changes in Postural Control after Soccer Heading. Int. J. Sports Med. 2013, 34, 350–354. [Google Scholar] [CrossRef] [PubMed]
- Collins, J.J.; De Luca, C.J. Open-loop and closed-loop control of posture: A random-walk analysis of center-of-pressure trajectories. Exp. Brain Res. 1993, 95, 308–318. [Google Scholar] [CrossRef] [PubMed]
- Laughton, C.A.; Slavin, M.; Katdare, K.; Nolan, L.; Bean, J.F.; Kerrigan, D.C.; Phillips, E.; Lipsitz, L.A.; Collins, J.J. Aging, muscle activity, and balance control: Physiologic changes associated with balance impairment. Gait Posture 2003, 18, 101–108. [Google Scholar] [CrossRef]
- Donker, S.F.; Roerdink, M.; Greven, A.J.; Beek, P.J. Regularity of center-of-pressure trajectories depends on the amount of attention invested in postural control. Exp. Brain Res. 2007, 181, 1–11. [Google Scholar] [CrossRef] [PubMed] [Green Version]
- McCamley, J.D.; Denton, W.; Arnold, A.; Raffalt, P.C.; Yentes, J.M.; McCamley, J.D.; Denton, W.; Arnold, A.; Raffalt, P.C.; Yentes, J.M. On the Calculation of Sample Entropy Using Continuous and Discrete Human Gait Data. Entropy 2018, 20, 764. [Google Scholar] [CrossRef] [PubMed]
- Cavanaugh, J.T.; Guskiewicz, K.M.; Giuliani, C.; Marshall, S.; Mercer, V.S.; Stergiou, N. Recovery of Postural Control After Cerebral Concussion: New Insights Using Approximate Entropy. J. Athl. Train. 2006, 41, 305–313. [Google Scholar] [PubMed]
- Gao, J.; Hu, J.; Buckley, T.; White, K.; Hass, C. Shannon and Renyi entropies to classify effects of Mild Traumatic Brain Injury on postural sway. PLoS ONE 2011, 6, e24446. [Google Scholar] [CrossRef] [PubMed]
- Busa, M.A.; Jones, S.L.; Hamill, J.; van Emmerik, R.E.A. Multiscale entropy identifies differences in complexity in postural control in women with multiple sclerosis. Gait Posture 2016, 45, 7–11. [Google Scholar] [CrossRef] [PubMed]
- Wayne, P.M.; Gow, B.J.; Costa, M.D.; Peng, C.-K.; Lipsitz, L.A.; Hausdorff, J.M.; Davis, R.B.; Walsh, J.N.; Lough, M.; Novak, V.; et al. Complexity-Based Measures Inform Effects of Tai Chi Training on Standing Postural Control: Cross-Sectional and Randomized Trial Studies. PLoS ONE 2014, 9, e114731. [Google Scholar] [CrossRef] [PubMed]
- Sabatini, A.M. Analysis of postural sway using entropy measures of signal complexity. Med. Biol. Eng. Comput. 2000, 38, 617–624. [Google Scholar] [CrossRef]
- Pincus, S. Approximate entropy (ApEn) as a complexity measure. Chaos Interdiscip. J. Nonlinear Sci. 1995, 5, 110–117. [Google Scholar] [CrossRef]
- Rhea, C.K.; Silver, T.A.; Hong, S.L.; Ryu, J.H.; Studenka, B.E.; Hughes, C.M.L.; Haddad, J.M. Noise and Complexity in Human Postural Control: Interpreting the Different Estimations of Entropy. PLOS ONE 2011, 6, e17696. [Google Scholar] [CrossRef]
- Winter, D.A.; Prince, F.; Frank, J.S.; Powell, C.; Zabjek, K.F. Unified theory regarding A/P and M/L balance in quiet stance. J. Neurophysiol. 1996, 75, 2334–2343. [Google Scholar] [CrossRef] [PubMed]
- Winter, D.A.; Patla, A.E.; Prince, F.; Ishac, M.; Gielo-Perczak, K. Stiffness Control of Balance in Quiet Standing. J. Neurophysiol. 1998, 80, 1211–1221. [Google Scholar] [CrossRef] [Green Version]
- Federolf, P.; Roos, L.; Nigg, B.M. Analysis of the multi-segmental postural movement strategies utilized in bipedal, tandem and one-leg stance as quantified by a principal component decomposition of marker coordinates. J. Biomech. 2013, 46, 2626–2633. [Google Scholar] [CrossRef] [PubMed] [Green Version]
- Roerdink, M.; Haart, M.D.; Daffertshofer, A.; Donker, S.F.; Geurts, A.C.H.; Beek, P.J. Dynamical structure of center-of-pressure trajectories in patients recovering from stroke. Exp. Brain Res. 2006, 174, 256. [Google Scholar] [CrossRef] [PubMed]
- Federolf, P.A. A novel approach to study human posture control: “Principal movements” obtained from a principal component analysis of kinematic marker data. J. Biomech. 2016, 49, 364–370. [Google Scholar] [CrossRef]
- Haid, T.H.; Doix, A.-C.M.; Nigg, B.M.; Federolf, P.A. Age Effects in Postural Control Analyzed via a Principal Component Analysis of Kinematic Data and Interpreted in Relation to Predictions of the Optimal Feedback Control Theory. Front. Aging Neurosci. 2018, 10. [Google Scholar] [CrossRef] [PubMed]
- Promsri, A.; Haid, T.; Federolf, P. How does lower limb dominance influence postural control movements during single leg stance? Hum. Mov. Sci. 2018, 58, 165–174. [Google Scholar] [CrossRef] [PubMed]
- Haid, T.; Federolf, P. Human Postural Control: Assessment of Two Alternative Interpretations of Center of Pressure Sample Entropy through a Principal Component Factorization of Whole-Body Kinematics. Entropy 2018, 20, 30. [Google Scholar] [CrossRef]
- Gløersen, Ø.; Federolf, P. Predicting Missing Marker Trajectories in Human Motion Data Using Marker Intercorrelations. PLoS ONE 2016, 11. [Google Scholar] [CrossRef]
- Federolf, P.A. A Novel Approach to Solve the “Missing Marker Problem” in Marker-Based Motion Analysis That Exploits the Segment Coordination Patterns in Multi-Limb Motion Data. PLOS ONE 2013, 8, e78689. [Google Scholar] [CrossRef]
- Gløersen, Ø.; Myklebust, H.; Hallén, J.; Federolf, P. Technique analysis in elite athletes using principal component analysis. J. Sports Sci. 2018, 36, 229–237. [Google Scholar] [CrossRef] [PubMed]
- de Leva, P. Adjustments to Zatsiorsky-Seluyanov’s segment inertia parameters. J. Biomech. 1996, 29, 1223–1230. [Google Scholar] [CrossRef]
- Daffertshofer, A.; Lamoth, C.J.C.; Meijer, O.G.; Beek, P.J. PCA in studying coordination and variability: A tutorial. Clin. Biomech. 2004, 19, 415–428. [Google Scholar] [CrossRef] [PubMed]
- Troje, N.F. Decomposing biological motion: A framework for analysis and synthesis of human gait patterns. J. Vis. 2002, 2, 2-2. [Google Scholar] [CrossRef] [PubMed]
- Bockemühl, T.; Troje, N.F.; Dürr, V. Inter-joint coupling and joint angle synergies of human catching movements. Hum. Mov. Sci. 2010, 29, 73–93. [Google Scholar] [CrossRef] [PubMed] [Green Version]
- Verrel, J.; Lövdén, M.; Schellenbach, M.; Schaefer, S.; Lindenberger, U. Interacting effects of cognitive load and adult age on the regularity of whole-body motion during treadmill walking. Psychol. Aging 2009, 24, 75–81. [Google Scholar] [CrossRef] [PubMed]
- van Emmerik, R.E.A.; van Wegen, E.E.H. On the Functional Aspects of Variability in Postural Control. Exerc. Sport Sci. Rev. 2002, 30, 177. [Google Scholar] [CrossRef] [PubMed]
- Estrada, L.; Torres, A.; Sarlabous, L.; Jané, R. Influence of Parameter Selection in Fixed Sample Entropy of Surface Diaphragm Electromyography for Estimating Respiratory Activity. Entropy 2017, 19, 460. [Google Scholar] [CrossRef]
- Kanekar, N.; Lee, Y.-J.; Aruin, A.S. Frequency analysis approach to study balance control in individuals with multiple sclerosis. J. Neurosci. Methods 2014, 222, 91–96. [Google Scholar] [CrossRef]
- Hernandez, F.; Wu, L.C.; Yip, M.C.; Laksari, K.; Hoffman, A.R.; Lopez, J.R.; Grant, G.A.; Kleiven, S.; Camarillo, D.B. Six Degree-of-Freedom Measurements of Human Mild Traumatic Brain Injury. Ann. Biomed. Eng. 2015, 43, 1918–1934. [Google Scholar] [CrossRef]
- Gow, B.J.; Peng, C.-K.; Wayne, P.M.; Ahn, A.C.; Gow, B.J.; Peng, C.-K.; Wayne, P.M.; Ahn, A.C. Multiscale Entropy Analysis of Center-of-Pressure Dynamics in Human Postural Control: Methodological Considerations. Entropy 2015, 17, 7926–7947. [Google Scholar] [CrossRef]
- Reshape scale method: A novel multi scale entropic analysis approach. Phys. Stat. Mech. Its Appl. 2013, 392, 6265–6272. [CrossRef]
- Federolf, P.; Zandiyeh, P.; Tscharner, V. von Time scale dependence of the center of pressure entropy: What characteristics of the neuromuscular postural control system influence stabilographic entropic half-life? Exp. Brain Res. 2015, 233, 3507–3515. [Google Scholar] [CrossRef] [PubMed]


| Participants | Age | Body Weight (kg) | Body Height (cm) |
|---|---|---|---|
| All [n = 16] | 26.5 ± 3.5 | 69.3 ± 14.6 | 176.6 ± 11.0 |
| Female [n = 7] | 27.1 ± 3.3 | 54.6 ± 5.4 | 165.3 ± 4.9 |
| Male [n = 9] | 26.0 ± 3.6 | 80.8 ± 7.3 | 185.2 ± 4.8 |
| Trial | Nodding Head | Nodding Head | Tilting Head | Tilting Head |
|---|---|---|---|---|
| Eyes Open | Eyes Closed | Eyes Open | Eyes Closed | |
| headshakes per second, averaged over all participants | 2.0 ± 0.6 | 2.1 ± 0.6 | 1.8 ± 0.4 | 1.7 ± 0.4 |
| PMk | Qualitative Description of PMk | Eigenvaluesk Share to Whole Motion (%) |
|---|---|---|
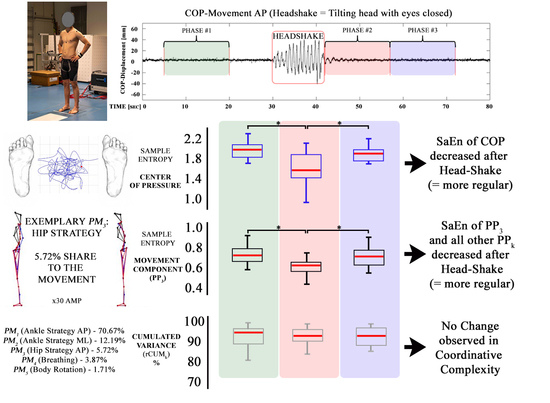
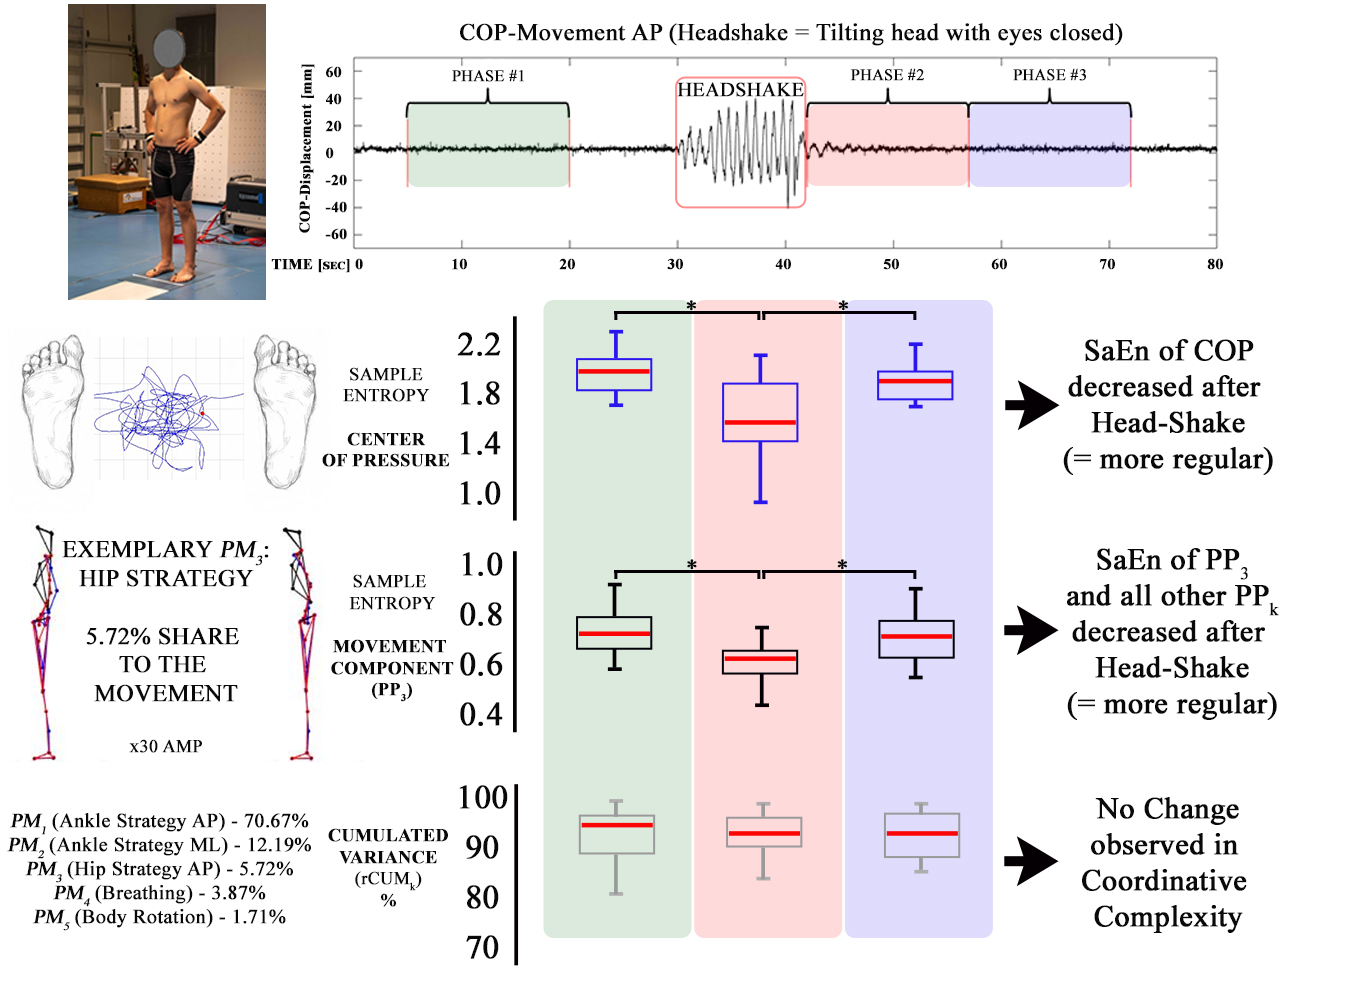
| PM1 | Ankle sway anterior–posterior | 70.67 |
| PM2 | Ankle sway medio-lateral | 12.19 |
| PM3 | Hip strategy (Hip flexion/extension) anterior-posterior | 5.72 |
| PM4 | Lifting shoulders / Breathing | 3.87 |
| PM5 | Upper body rotation | 1.71 |
| PPk | Trial | Overall | Post-Hoc between Phases | ||||||
|---|---|---|---|---|---|---|---|---|---|
| F | χ2 | DoF | p-Value | η2 | 1–2 | 2–3 | 1–3 | |||
| PP1 | Nodding head | eyes open | 10.894 | 2, 30 | 0.001 ** | 0.421 | 0.001 * | - | 0.033 * |
| eyes closed | 0.213 | 2, 30 | 0.809 | 0.014 | - | - | - | ||
| Tilting head | eyes open | 0.302 | 1.469, 22.028 | 0.675 | 0.020 | - | - | - | |
| eyes closed | 4.244 | 1.405, 21.078 | 0.040 * | 0.221 | 0.040 * | - | - | ||
| PP2 | Nodding head | eyes open | 5.907 | 2, 30 | 0.007 * | 0.283 | 0.034 * | 0.030 * | 0.024 * |
| eyes closed | 2.865 | 2, 30 | 0.078 | 0.160 | - | - | - | ||
| Tilting head | eyes open | 6.500 | 2 | 0.039 * | - | 0.040 * | - | - | |
| eyes closed | 6.175 | 2, 30 | 0.006 * | 0.292 | 0.045 * | 0.017 * | - | ||
| PP3 | Nodding head | eyes open | 6.258 | 2, 30 | 0.005 * | 0.294 | 0.025 * | - | - |
| eyes closed | 1.365 | 2, 30 | 0.271 | 0.083 | - | - | - | ||
| Tilting head | eyes open | 9.820 | 2, 30 | 0.001 * | 0.369 | 0.022 * | 0.007 * | - | |
| eyes closed | 12.310 | 2, 30 | 0.001 ** | 0.451 | 0.001 ** | 0.007 * | - | ||
| PP4 | Nodding head | eyes open | 5.158 | 2, 30 | 0.012 * | 0.256 | - | - | - |
| eyes closed | 1.580 | 2, 30 | 0.223 | 0.095 | - | - | - | ||
| Tilting head | eyes open | 9.745 | 2, 30 | 0.001 * | 0.394 | 0.005 * | 0.006 * | - | |
| eyes closed | 13.225 | 2, 30 | 0.001 ** | 0.469 | 0.003 * | 0.003 * | - | ||
| PP5 | Nodding head | eyes open | 1.392 | 2, 30 | 0.264 | 0.085 | - | - | - |
| eyes closed | 1.793 | 2, 30 | 0.184 | 0.107 | - | - | |||
| Tilting head | eyes open | 3.412 | 2, 30 | 0.046 * | 0.185 | - | - | - | |
| eyes closed | 7.148 | 2, 30 | 0.003 * | 0.323 | 0.007 * | 0.038 * | - | ||
| PPk | Trial | Overall rVARk | |||||
|---|---|---|---|---|---|---|---|
| F | DoF | p-Value | η2 | 1 − β | |||
| PP1 | Nodding head | eyes open | 1.320 | 2, 30 | 0.282 | 0.081 | 0.263 |
| eyes closed | 1.719 | 2, 30 | 0.196 | 0.103 | 0.332 | ||
| Tilting head | eyes open | 0.625 | 2, 30 | 0.542 | 0.040 | 0.145 | |
| eyes closed | 0.274 | 2, 30 | 0.763 | 0.018 | 0.089 | ||
| PP2 | Nodding head | eyes open | 1.228 | 1.480, 22.201 | 0.300 | 0.076 | 0.213 |
| eyes closed | 6.387 | 2, 30 | 0.005 * | 0.299 | 0.870 | ||
| Tilting head | eyes open | 2.023 | 2, 30 | 0.150 | 0.119 | 0.384 | |
| eyes closed | 0.473 | 2, 30 | 0.628 | 0.031 | 0.120 | ||
| PP3 | Nodding head | eyes open | 2.691 | 2, 30 | 0.084 | 0.152 | 0.492 |
| eyes closed | 0.977 | 2, 30 | 0.388 | 0.061 | 0.204 | ||
| Tilting head | eyes open | 1.418 | 2, 30 | 0.258 | 0.086 | 0.280 | |
| eyes closed | 0.093 | 2, 30 | 0.912 | 0.006 | 0.063 | ||
| PP4 | Nodding head | eyes open | 0.601 | 2, 30 | 0.555 | 0.039 | 0.141 |
| eyes closed | 0.294 | 2, 30 | 0.748 | 0.019 | 0.092 | ||
| Tilting head | eyes open | 0.175 | 2, 30 | 0.840 | 0.012 | 0.075 | |
| eyes closed | 0.737 | 2, 30 | 0.487 | 0.047 | 0.163 | ||
| PP5 | Nodding head | eyes open | 0.726 | 1.415, 21.218 | 0.450 | 0.046 | 0.141 |
| eyes closed | 0.574 | 2, 30 | 0.569 | 0.037 | 0.136 | ||
| Tilting head | eyes open | 0.583 | 2, 30 | 0.564 | 0.037 | 0.138 | |
| eyes closed | 0.476 | 2, 30 | 0.626 | 0.031 | 0.121 | ||
| PPk | Trial | Overall rCUM | |||||
|---|---|---|---|---|---|---|---|
| F | χ2 | DoF | p-Value | η2 | 1 − β | |||
| PP1 | Nodding head | eyes open | 1.320 | 2, 30 | 0.282 | 0.081 | 0.263 |
| eyes closed | 1.719 | 2, 30 | 0.196 | 0.103 | 0.332 | ||
| Tilting head | eyes open | 0.625 | 2, 30 | 0.542 | 0.040 | 0.145 | |
| eyes closed | 0.274 | 2, 30 | 0.763 | 0.018 | 0.089 | ||
| PP2 | Nodding head | eyes open | 3.917 | 2, 30 | 0.031 * | 0.207 | 0.661 |
| eyes closed | 0.032 | 2, 30 | 0.968 | 0.002 | 0.054 | ||
| Tilting head | eyes open | 1.004 | 2, 30 | 0.378 | 0.063 | 0.208 | |
| eyes closed | 0.206 | 2, 30 | 0.815 | 0.014 | 0.079 | ||
| PP3 | Nodding head | eyes open | 2.816 | 2, 30 | 0.076 | 0.158 | 0.551 |
| eyes closed | 0.524 | 2, 30 | 0.597 | 0.034 | 0.128 | ||
| Tilting head | eyes open | 0.765 | 2, 30 | 0.474 | 0.049 | 0.168 | |
| eyes closed | 0.178 | 2, 30 | 0.838 | 0.012 | 0.075 | ||
| PP4 | Nodding head | eyes open | 2.822 | 2, 30 | 0.075 | 0.158 | 0.512 |
| eyes closed | 0.500 | 2 | 0.779 | - | - | ||
| Tilting head | eyes open | 0.966 | 2, 30 | 0.392 | 0.060 | 0.202 | |
| eyes closed | 0.141 | 2, 30 | 0.869 | 0.009 | 0.070 | ||
| PP5 | Nodding head | eyes open | 2.823 | 2, 30 | 0.075 | 0.158 | 0.513 |
| eyes closed | 1.625 | 2 | 0.444 | - | - | ||
| Tilting head | eyes open | 0.876 | 2, 30 | 0.427 | 0.055 | 0.187 | |
| eyes closed | 2.625 | 2 | 0.269 | - | - | ||
© 2019 by the authors. Licensee MDPI, Basel, Switzerland. This article is an open access article distributed under the terms and conditions of the Creative Commons Attribution (CC BY) license (http://creativecommons.org/licenses/by/4.0/).
Share and Cite
Wachholz, F.; Kockum, T.; Haid, T.; Federolf, P. Changed Temporal Structure of Neuromuscular Control, Rather Than Changed Intersegment Coordination, Explains Altered Stabilographic Regularity after a Moderate Perturbation of the Postural Control System. Entropy 2019, 21, 614. https://doi.org/10.3390/e21060614
Wachholz F, Kockum T, Haid T, Federolf P. Changed Temporal Structure of Neuromuscular Control, Rather Than Changed Intersegment Coordination, Explains Altered Stabilographic Regularity after a Moderate Perturbation of the Postural Control System. Entropy. 2019; 21(6):614. https://doi.org/10.3390/e21060614
Chicago/Turabian StyleWachholz, Felix, Tove Kockum, Thomas Haid, and Peter Federolf. 2019. "Changed Temporal Structure of Neuromuscular Control, Rather Than Changed Intersegment Coordination, Explains Altered Stabilographic Regularity after a Moderate Perturbation of the Postural Control System" Entropy 21, no. 6: 614. https://doi.org/10.3390/e21060614