Thermodynamic Fluid Equations-of-State

Department of Physics, University of Algarve, 8005-139 Faro, Portugal
Entropy 2018, 20(1), 22; https://doi.org/10.3390/e20010022
Submission received: 24 October 2017
/
Revised: 20 December 2017
/
Accepted: 30 December 2017
/
Published: 4 January 2018
(This article belongs to the Special Issue Selected Papers from 14th Joint European Thermodynamics Conference)
Abstract
:As experimental measurements of thermodynamic properties have improved in accuracy, to five or six figures, over the decades, cubic equations that are widely used for modern thermodynamic fluid property data banks require ever-increasing numbers of terms with more fitted parameters. Functional forms with continuity for Gibbs density surface ρ(p,T) which accommodate a critical-point singularity are fundamentally inappropriate in the vicinity of the critical temperature (Tc) and pressure (pc) and in the supercritical density mid-range between gas- and liquid-like states. A mesophase, confined within percolation transition loci that bound the gas- and liquid-state by third-order discontinuities in derivatives of the Gibbs energy, has been identified. There is no critical-point singularity at Tc on Gibbs density surface and no continuity of gas and liquid. When appropriate functional forms are used for each state separately, we find that the mesophase pressure functions are linear. The negative and positive deviations, for both gas and liquid states, on either side of the mesophase, are accurately represented by three or four-term virial expansions. All gaseous states require only known virial coefficients, and physical constants belonging to the fluid, i.e., Boyle temperature (TB), critical temperature (Tc), critical pressure (pc) and coexisting densities of gas (ρcG) and liquid (ρcL) along the critical isotherm. A notable finding for simple fluids is that for all gaseous states below TB, the contribution of the fourth virial term is negligible within experimental uncertainty. Use may be made of a symmetry between gas and liquid states in the state function rigidity (dp/dρ)T to specify lower-order liquid-state coefficients. Preliminary results for selected isotherms and isochores are presented for the exemplary fluids, CO2, argon, water and SF6, with focus on the supercritical mesophase and critical region.
Keywords:
equation-of-state; liquid-gas criticality; carbon dioxide; argon; water; SF6; virial coefficients1. Introduction
There is a long history and an extensive literature of cubic equations-of-state, going back 140 years, from van der Waals renowned two-term equation for Andrew’s original p-V-T data on carbon dioxide [1], to current research and compilations with hundreds of terms and parameters. As the thermodynamic experimental measurements have improved in accuracy, ever more complex equations have evolved [2]. These equations are used to represent experimental thermodynamic properties for modern data banks such as the NIST compilation for CO2 [2,3]. Over recent decades, ever-increasing numbers of terms and more fitted parameters are required. The Span–Wagner equation for CO2 [2], for example, contains hundreds of terms, each with many fitted parameters, and various adjustable fractional exponents. As even more accurate data become available from future research, these functional forms will need yet more adjustable parameters.
The basic reason of this inconvenient modeling practice is the van der Waals gas-liquid continuity hypothesis [1]. Continuous cubic functional forms are inappropriate in the vicinity of Tc and in the supercritical mid-range between gas and liquid phases. A mesophase, confined within percolation loci that bound the existence of gas and liquid phases by higher-order discontinuities, has been identified [4,5,6]. A simple numerical differentiation of NIST equations-of-state [7] can demonstrate the supercritical mesophase and observe the phase bounds, along any isotherm, of any fluid (e.g., CO2 Figure 1) for any of the 200 fluids in the NIST Thermophysical Property data bank. These boundaries have been smoothed over by the equations-of-state used to parameterize the original experimental data.
Within the uncertainties, p(ρ,T) is a linear function of ρ in the mesophase region. The origin of the linearity is the colloidal nature of the supercritical mesophase [6,8] with a linear combination rule for thermodynamic state functions, similar to subcritical lever rule for the inhomogeneous 2-phase region. When appropriate functional forms are used for gaseous and liquid states separately, we find that all other isothermal thermodynamic state functions in the mesophase are linear functions of density. In the case of pressure, the negative and positive adjacent deviations for liquid and gas on either side are quadratic. The parameterizations require only physical constants belonging to the specific fluid, Boyle temperature (TB), critical temperature (TC), and coexisting densities along the critical isotherm, and known virial coefficients b2(T) and b3(T) etc. A remarkable finding is that for the gas phases below TB, the coefficient b4 is effectively zero within the experimental uncertainty. There is rigidity symmetry between gas and liquid phases on either side of the mesophase reported previously [9], that relates the lower coefficients of the liquid equation to properties of the gas in the vicinity of the percolation loci.
The objective of this research is to investigate the extent that these findings can be used to describe experimental thermodynamic properties of a pure fluid over the whole range of equilibrium existence. Here, we investigate equations-of-state for gas, liquid and mesophase separately, each of which, in an initial approximation, require only measurable physical constants specific to particular fluids. Comparisons with experimental data are made via the NIST thermo-physical databank [3]. NIST tabulations reproduce experimental data with 100% accuracy, and therefore, provide a foremost criteria for testing the alternative description to van der Waals underlying science of critical and supercritical behavior of fluids as described in references [4,5,6,7,8,9].
2. Rigidity and Fluid-State Bounds
Rigidity, (ω)T, is the work required to isothermally and reversibly increase the density of a fluid. With dimensions of a molar energy, this simple state function relates directly to the change in Gibbs energy (G) with density at constant T
The inequalities that distinguish gas from liquid are:
and for the mesophase
ωT = (dp/dρ)T = ρ(dG/dρ)T
GAS ρ < ρPB (d2ω/dρ)T < 0
LIQUID ρ > ρPA (d2ω/dρ)T > 0
MESO ρPB < ρ < ρPA (d2ω/dρ)T = 0
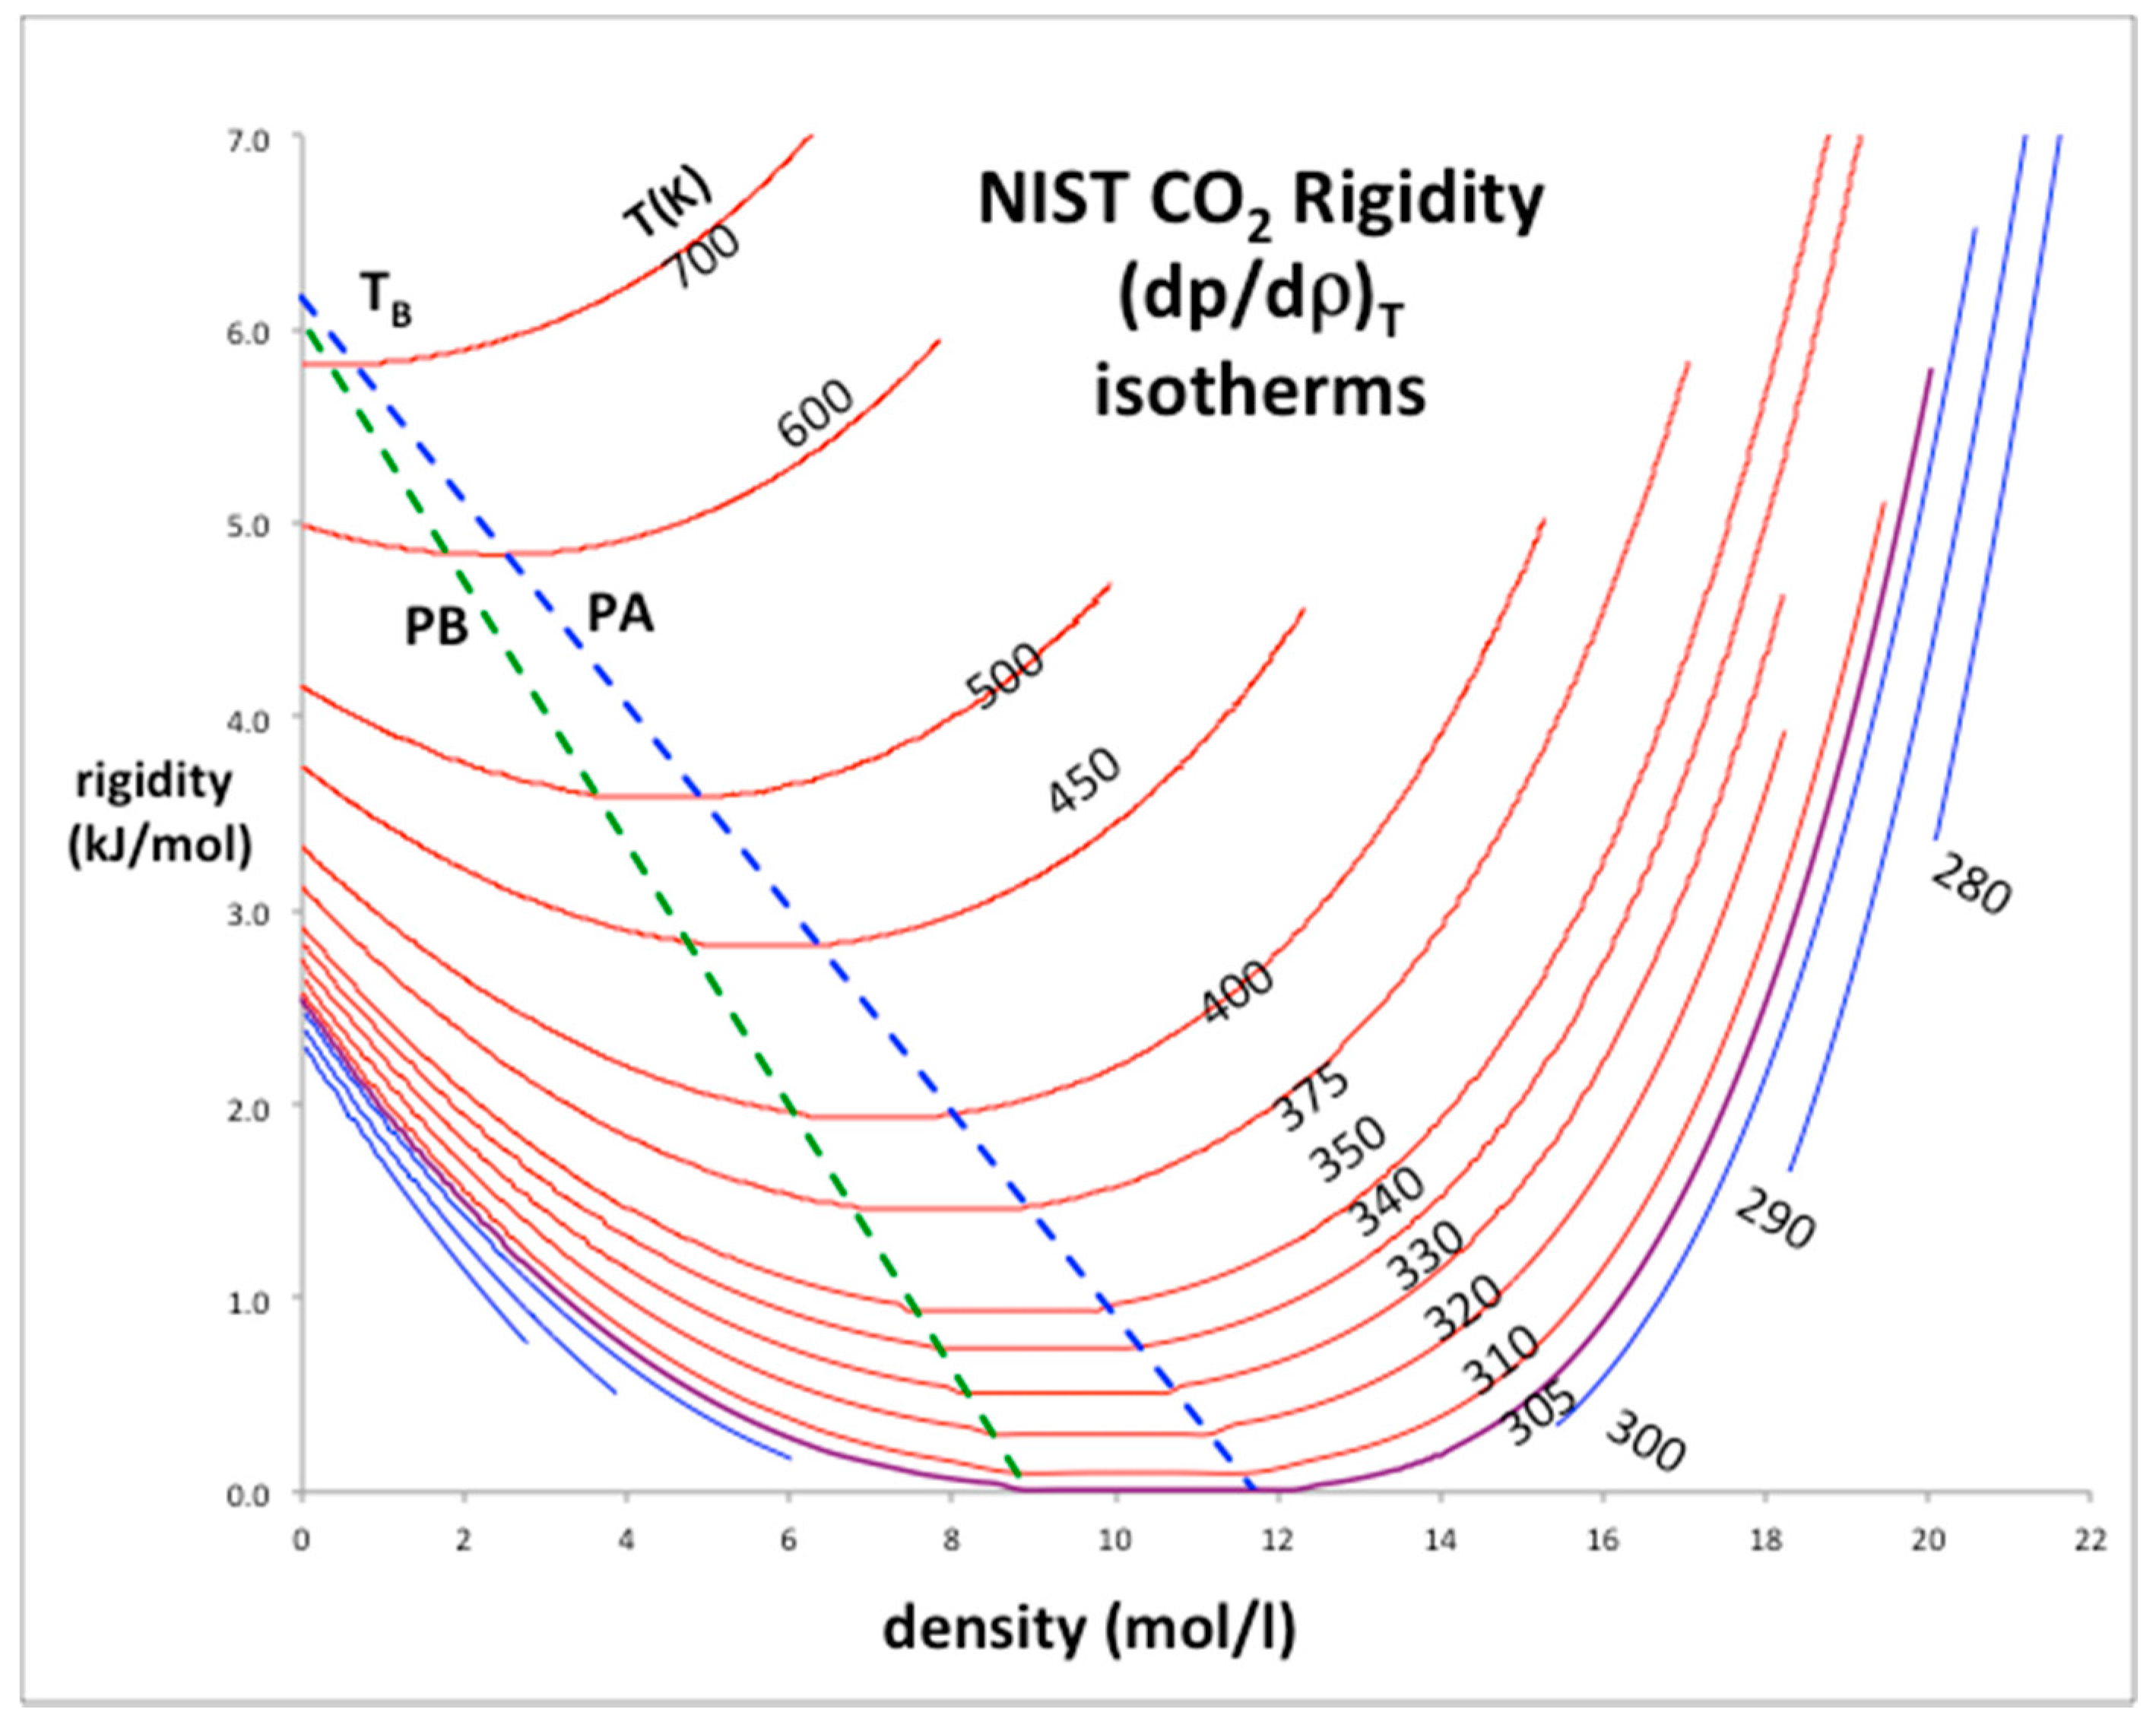
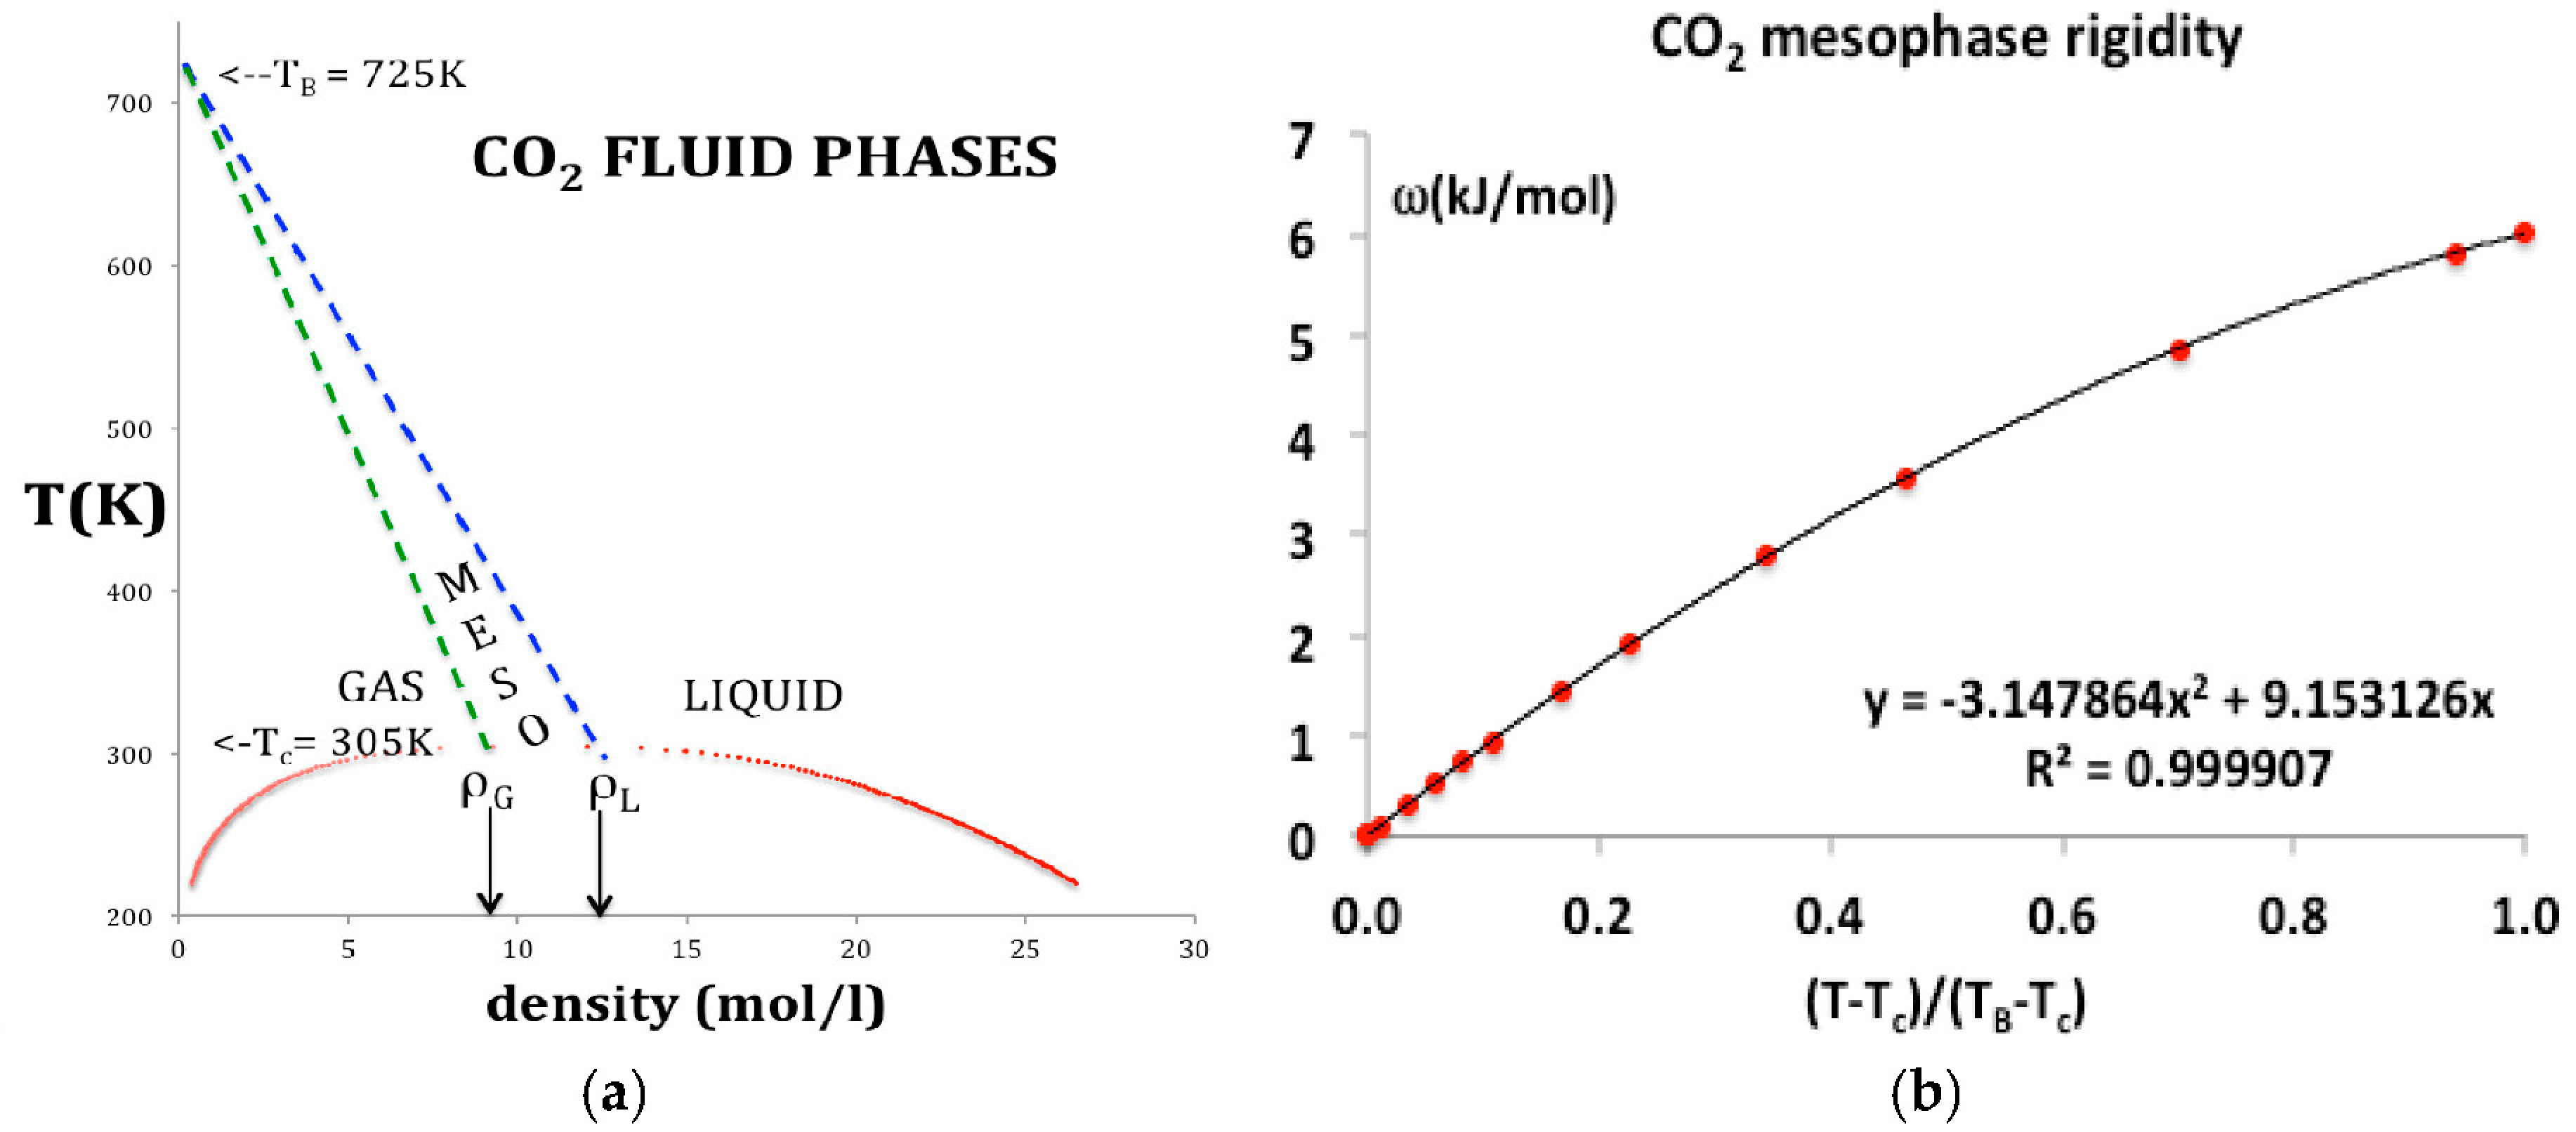
The rigidity isotherms shown in Figure 2 for CO2 have been obtained from NIST Thermophysical databank [3]. Inequalities in the derivatives of ωT (Equations (2) and (3)) can thermodynamically define the percolation loci [9]. It follows that at low density the percolation loci must approach the Boyle temperature (TB) by its definition, which is obtained from the rigidity intersection interpolated at zero density. For CO2 the limiting rigidity (RTB: where R is the gas constant) along the percolation loci is 6.03 kJ/mol and TB is 725 K, i.e., the temperature above which the 2nd-virial coefficient (b2) is positive and below which it is negative; at TB, p = ρkT and b2 = 0. In the pressure-density plane, the percolation loci exhibit maxima as density decreases and approach zero, i.e., the ideal gas limit at low pressures and densities. The same behavior is seen for other atomic (e.g., argon) and molecular (e.g., water) fluids.
It is clear from Equation (1) that ω ≥ 0, i.e., rigidity must always be positive although it can be zero in two-phase coexistence regions. Gibbs energy cannot decrease with pressure when T is constant. From these definitions moreover, not only can there be no “continuity” of gas and liquid but the gas and liquid states are fundamentally different in their thermodynamic description. Rigidity is determined by number density fluctuations at the molecular level, which have different but complementary statistical origins in each phase, hence the symmetry [9]. There is a distribution of many small clusters in a gas with one large void; there is a distribution of unoccupied pockets in the liquid with one large cluster. The statistical neighborhood properties of unoccupied pockets are the same as occupied sites.
The percolation loci and the critical coexisting densities at Tc for CO2 have been obtained by the method previously described in detail for Lennard-Jones fluids [5] and argon [8]. Looking at Figure 2, the coexisting densities of the gas (ρG) and of liquid (ρL) and the meso-density gap vary linearly between the critical temperature (Tc) and Boyle temperature (TB). If the mesophase rigidity is obtainable in terms of TB and TC, we can then represent the density bounds with linear functions and the rigidity in the mesophase as shown in Figure 3a,b, and incorporate a linear equation of state for the mesophase that connects with gas and liquid at the percolation bounds PB and PA respectively.
GAS ρPB(T) = ρG(Tc) [(TB − T)/(TB − TC)]
LIQUID ρPA(T) = ρL(Tc) [(TB − T)/(TB − TC)]
Use of original experimental data could result in non-linear Equations (5) and (6) for density state bounds in a more refined analysis. Given these expressions for the temperature dependence of the percolation loci, and the rigidity in the mesophase (Figure 3b), in terms of physical constants belonging to the specific fluid, we can now proceed to represent the thermodynamic surfaces using virial expansions.
The rigidity in the mesophase varies from kT at TB to zero at Tc. It is linearly dependent on temperature in the near-critical region up about 1.25 T/Tc but there is an increasing small quadratic term as seen in Figure 3b. The temperature dependence in the range Tc to TB appears to be logarithmic, but without a scientific explanation, and within the uncertainty of the data, it is best represented by a simple quadratic
where T* = (T − Tc)/(TB − Tc) and the constants c1 and c2 as given in Figure 3b.
ωT = c1T* + c2T*2
3. Pressure Surfaces p(ρ,T)
The pressure for any thermodynamic equilibrium state point can be obtained as a function of density along any isotherm. The gas equation-of-state can be parameterized using the formally exact Mayer virial expansion [10]. The mesophase pressure increases linearly with density the region 0 > T > TB and
ρPB(T) > ρ < ρPA(T), and for the ‘liquid’ state ρ > ρPA(T), we can use an empirical expansion. The isothermal equations-of-state for pressure are as follows:
GAS p(ρ,T) = kTρ (1 + b2(T)ρ + b3(T)ρ2 + …)
MESO p(ρ,T) = p(ρPB,T) + ωT (ρ − ρPB)
LIQUID p(ρ,T) = p(ρPA,T) + [a1(ρ − ρPA) + a2(ρ − PA)2 + a3(ρ − ρ PA)3 …]
For the temperature-density region Tc < T < TB and ρ < ρPA(T), Equations (8)–(10) are based upon the observation that there is a phase transition of the third-order at the mesophase bounds with a discontinuity in the derivative of ω with respect to ρ, i.e., the third derivative of Gibbs energy with respect to ρ at constant T along an isotherm. For temperatures above TB, p(ρPA,T) and ρPA, in Equation (10), are zero, whereupon the coefficients an in Equation (10) become the same as the Mayer virial coefficients bn (T) in Equation (8).
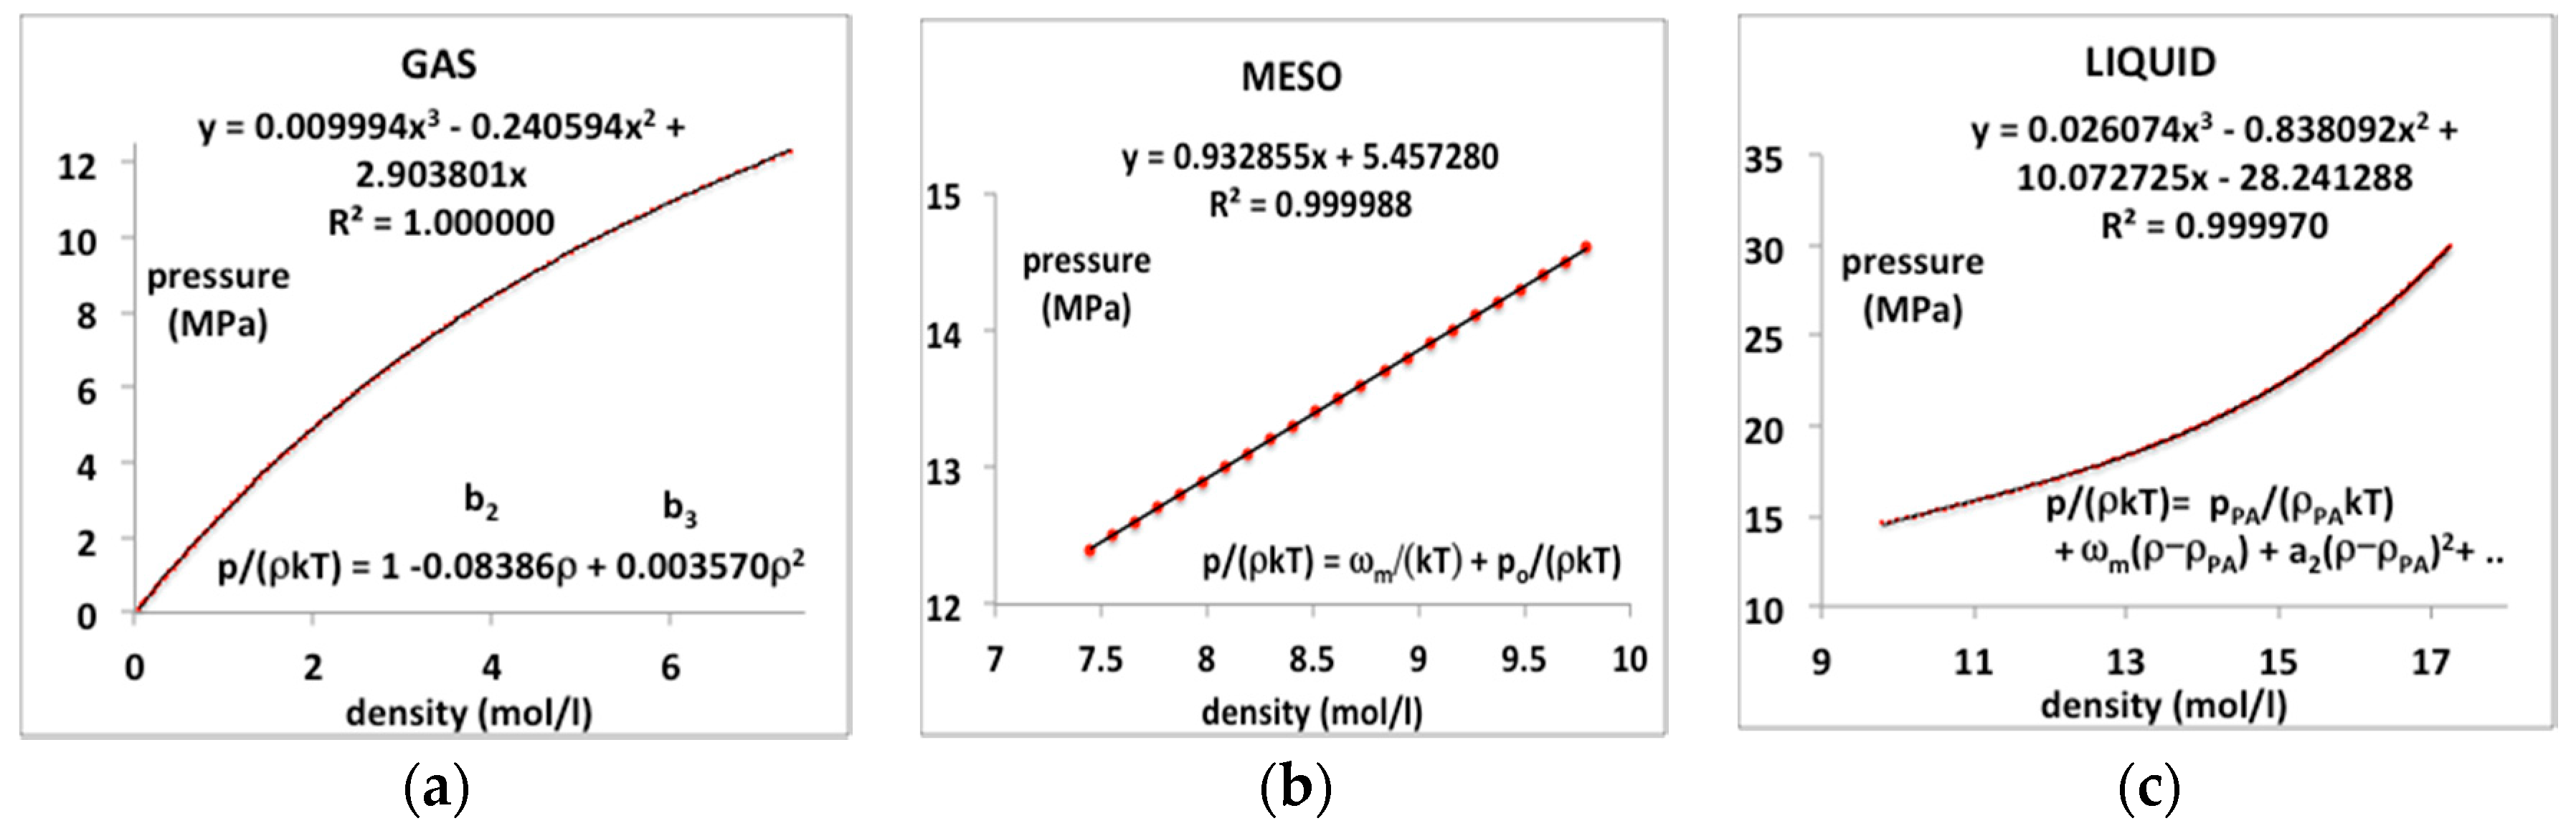
For the supercritical fluid at temperatures above TB, Equation (8) up to order b4 is sufficient to reproduce the pressure with five-figure accuracy, i.e., within the margin of the original experimental uncertainty, with a trend-line regression >0.999999, up to temperatures of 1000 K and pressures up to 50 Mpa. For the gas phase, at all temperatures below TB, the 4th virial coefficient is found to be essentially zero, within the uncertainty of the experimental data; all higher terms are negligible. Thus, for the case of CO2, the equation-of-state of the whole ‘gas’ region of Figure 3 requires just the second and a third virial coefficients b2(T) and b3(T) within the experimental precision.
An overall p(ρ,T) equation of state can be integrated along any isotherm to obtain the Helmoltz energy function A(T) and hence, via the partition function, all other thermodynamic state functions and/or derivatives by long-established procedures [11].
3.1. Supercritical CO2
In order to demonstrate a necessity of three separate equations-of-state, we take, as an example in the first instance, a supercritical isotherm T = 350 K, or T/Tc = 1.15, of CO2. The critical and Boyle temperatures for CO2 according to NIST databank [3] are Tc = 305 K and Tc = 725 K. Using the same method described previously for argon [8], the coexisting densities at Tc are found to be ρc(gas) = 7.771 mol/L and ρc(liq) = 13.46 mol/L. Substituting these physical constant values into equations (5 to 7) for T = 350 K we obtain the gas and liquid state density bounds ρPB(gas) = 7.305 mol/L and ρPA(liq) = 12.02 mol/L, and the rigidity ω(350 K) = 0.318 kT (0.925 kJ/mol).
If we try to fit the NIST data for the whole isotherm continuously from 0, just up to only 50 MPa, using a 6-term polynomial for example, we obtain the result:
with R² = 0.999125
p = −0.000008ρ6 + 0.000457ρ5 − 0.009373ρ4 + 0.096245ρ3 − 0.596317ρ2 + 3.459264ρ − 0.189239
In this typical continuous overall polynomial fit, the lower order coefficients are scientifically meaningless. By contrast, by using virial coefficients and known properties of the mesophase bounds, the NIST data for the whole range of three regions can be reproduced with essentially 100% precision when the gas, liquid and meso-states have different equations-of-state. We assume that there is a third-order phase transition, i.e., a discontinuity in the third derivative of Gibbs energy at the gas and liquid-state boundaries in accord with inequalities (2 and 3).
The experimental data from the NIST tabulations is reproduced with the same precision as the original data can be obtained, i.e., accurate to 5 figures, as evidenced by the mean-squared regression (R2) in the trendline polynomial coefficients as given. Also shown in Figure 4 are redefined equations to give the virial coefficients in Equations (8)–(10) as shown on the plots. The coefficient a1 in the liquid-state expansion is taken to be equal to the value of ωT in the mesophase to effect the third-order discontinuity between the mesophase and the liquid state. There is a symmetry between the rigidity of gas and liquid on either side of the mesophase but at this stage, this observation is empirical. As it presently lacks formal theory, we assume only the linear coefficient in Equation (10) and make no assumptions regarding higher-order coefficients at this stage.
3.2. Supercritical Argon
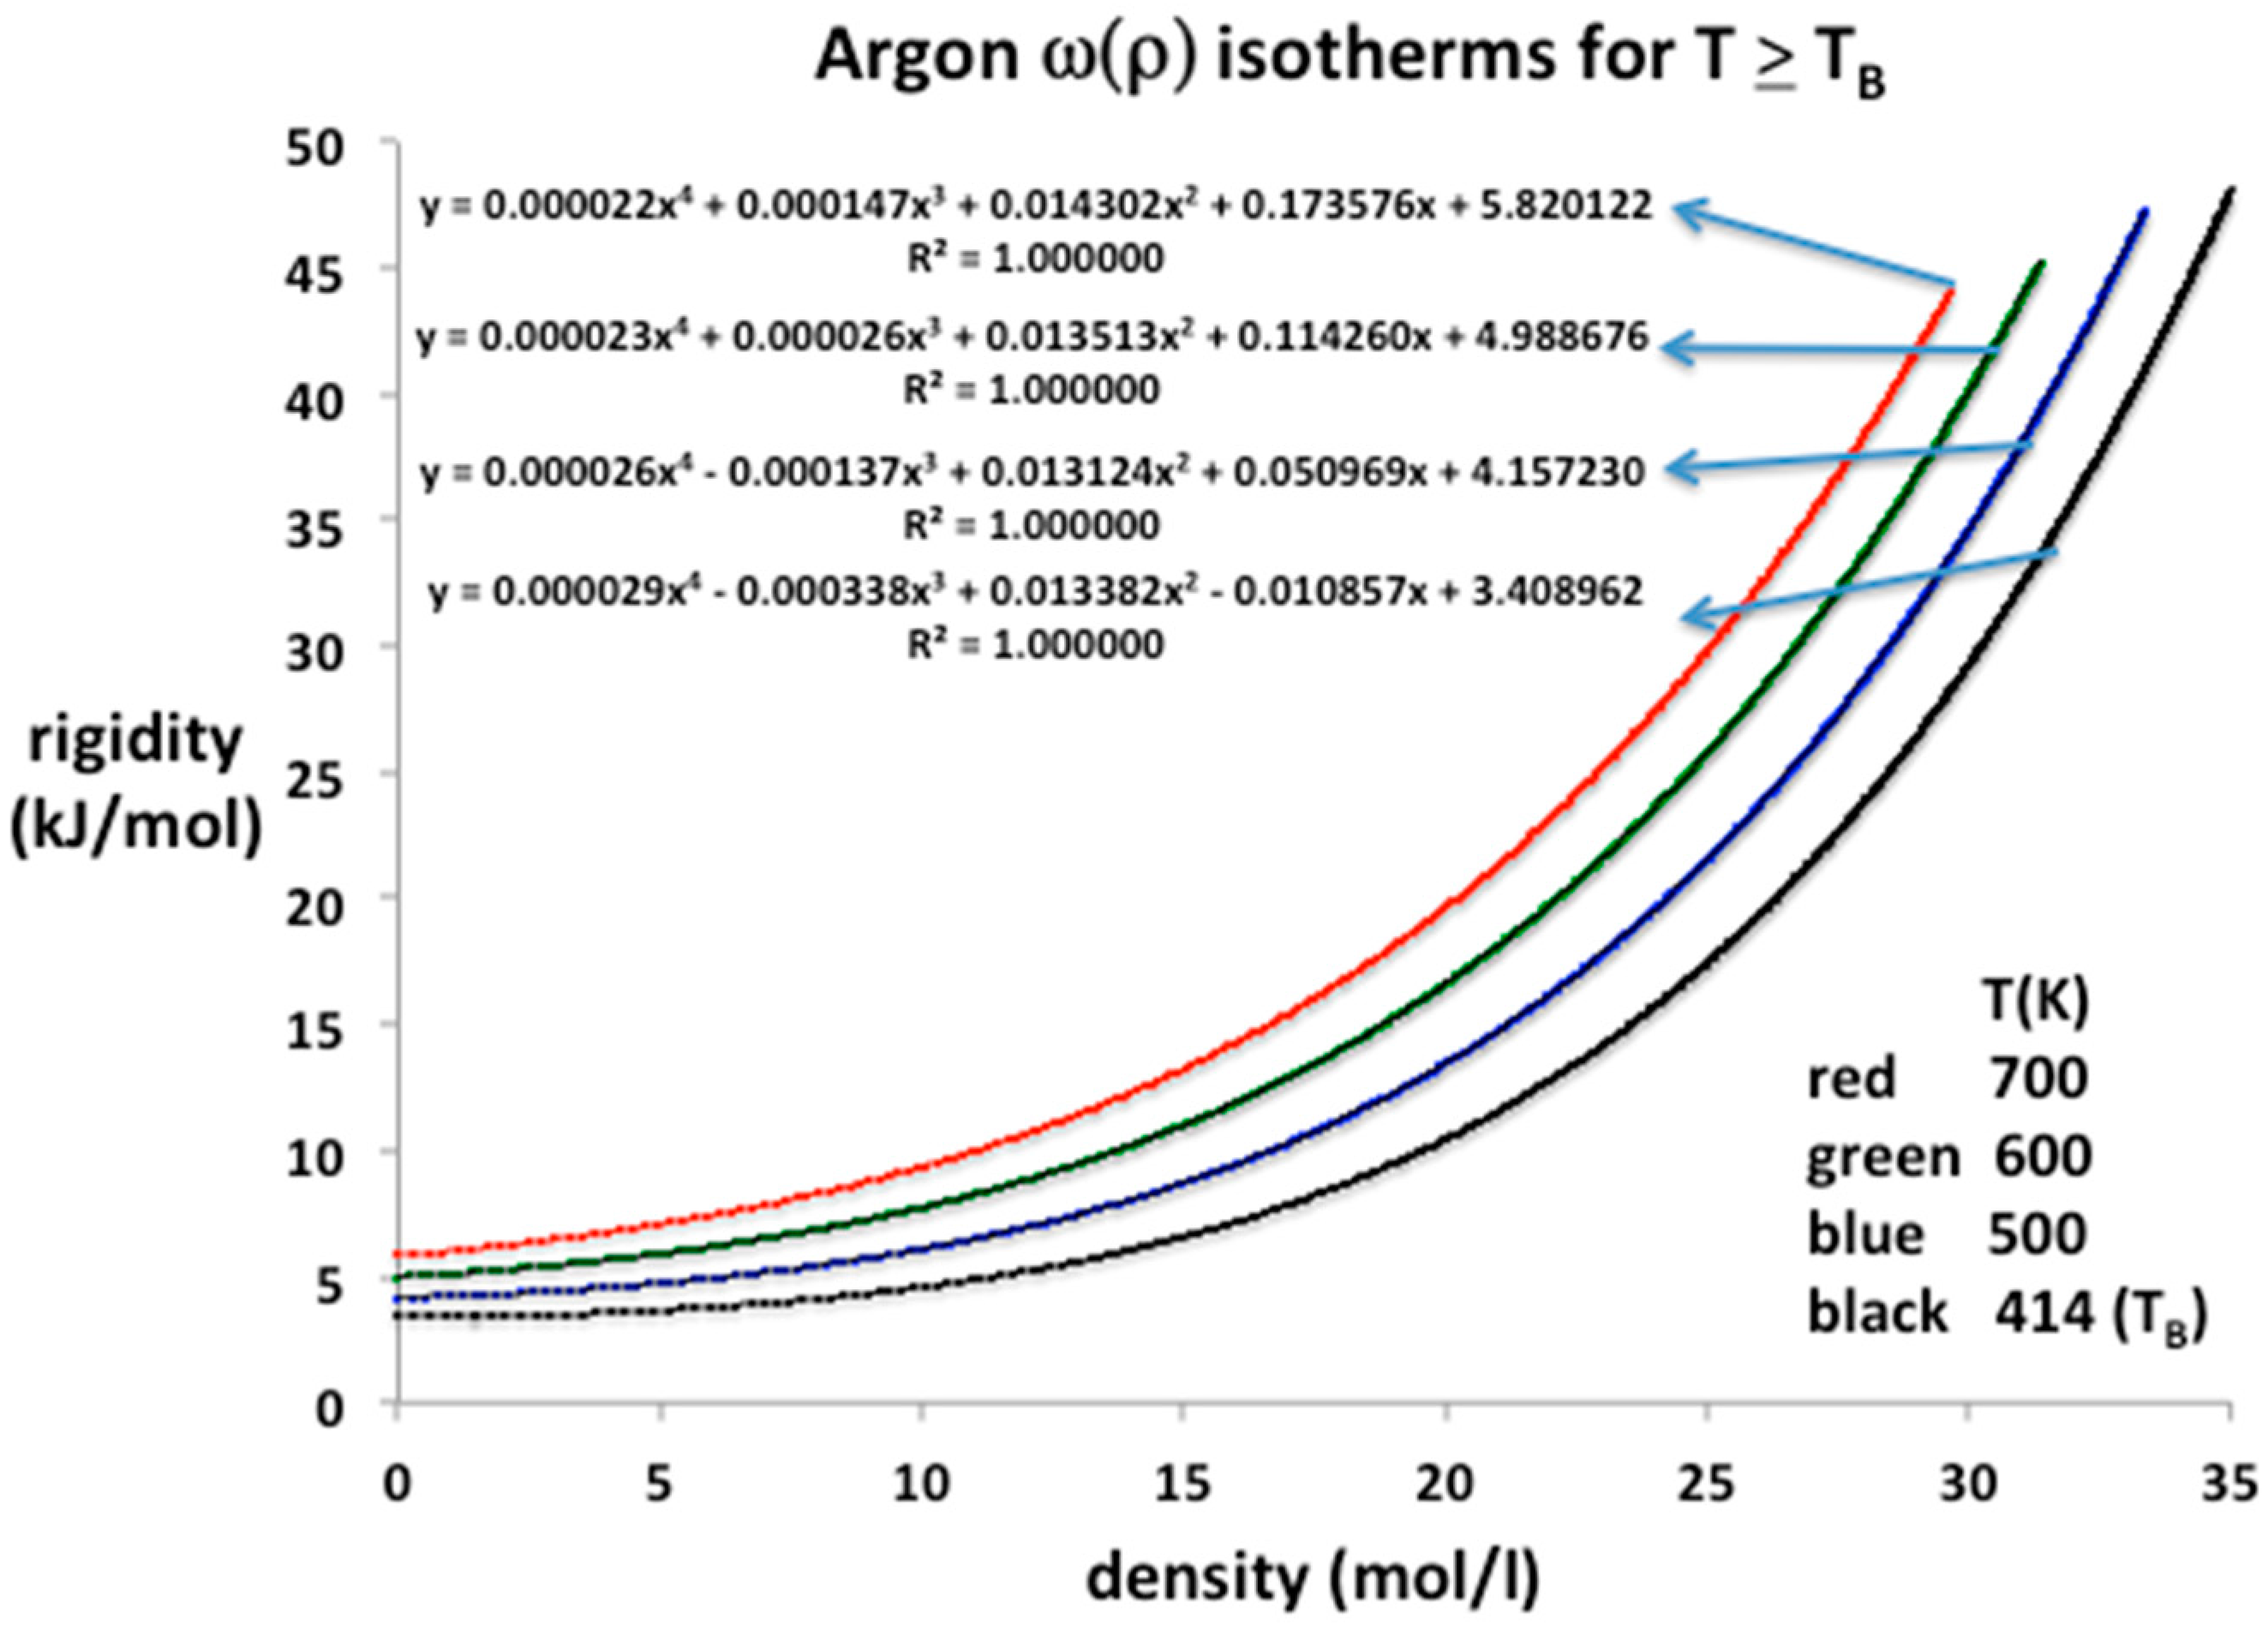
Modern research into fundamental equation-of-state science is more often based upon the example of argon in the first instance because of the relative simplicity of the spherical two-body pair potential and the amenability to basic theory. The literature on equation-of-state data to high temperature and pressure is both extensive and accurate to at least five figures except in the vicinity of the critical temperature (Tc) and pressure (pc) [3,12]. For temperatures above the Boyle temperature there appears to be just a single continuous fluid state up to the highest pressures measured, which, in the case of argon, is 1000 MPa, according to NIST [3,12]. If there are no discontinuities along isotherms for T > TB, the Mayer virial expansion is applicable over the whole accessible density range. The expansion for the pressure is
and on differentiation the rigidity is
where bn are the temperature-dependent virial coefficients with conventional definitions. The NIST data for four supercritical isotherms above and including the Boyle temperature (TB) can be precisely reproduced using Equation (12) and the virial coefficients determined. From Stewart and Jacobson [13] we obtain TB = 414 ± 0.5 for argon, which is consistent with the zero value of the second virial coefficient obtained here from parameterizations of NIST rigidity values from sound velocity compilations.
p = kT(ρ + b2ρ2 + b3ρ3 + b4ρ4 ……)
ω = (dp/dρ)T = kT(1 + 2b2ρ + 3b3ρ2 + 4b4ρ3………)
The equation-of-state isotherms are presented in Figure 5. Also given are the polynomial trend-line parameters up to order 4. In this region, the entire experimental range of pressures, from near zero at ideal gas states at limiting low densities, up to 1000 MPa, can be represented to within the experimental five-figure precision by a three or at most four-term, closed-virial equation. Using Equation (12) we can deduce lower-order values of the virial coefficients of argon as listed in Table 1. The values obtained for b2 and b3 are in agreement with the literature values within the experimental uncertainties, which can be as high as 20% in the case of b3 [9]. For argon at supercritical temperatures, little is presently known experimentally about b4 and higher coefficients.
Lower-order virial coefficients, as defined by Equation (12), and calculated from the trend-line polynomial coefficients in Figure 5, are summarized in Table 1. All the experimental data from the NIST tabulations are reproduced with maximum precision as evidenced by the mean-squared regression in the trendline polynomial coefficients (R2 = 1.000000 to six decimal places in every case); the coefficients have been redefined to obtain values of the virial expansion coefficients defined in Equation (11). These are in line with previous b2(T) and b3(T) tabulations [14] within the uncertainties, which are rather wide, up to a few percent for b2(T), and up to 25% in the case of b3(T).
4. Critical Isotherms
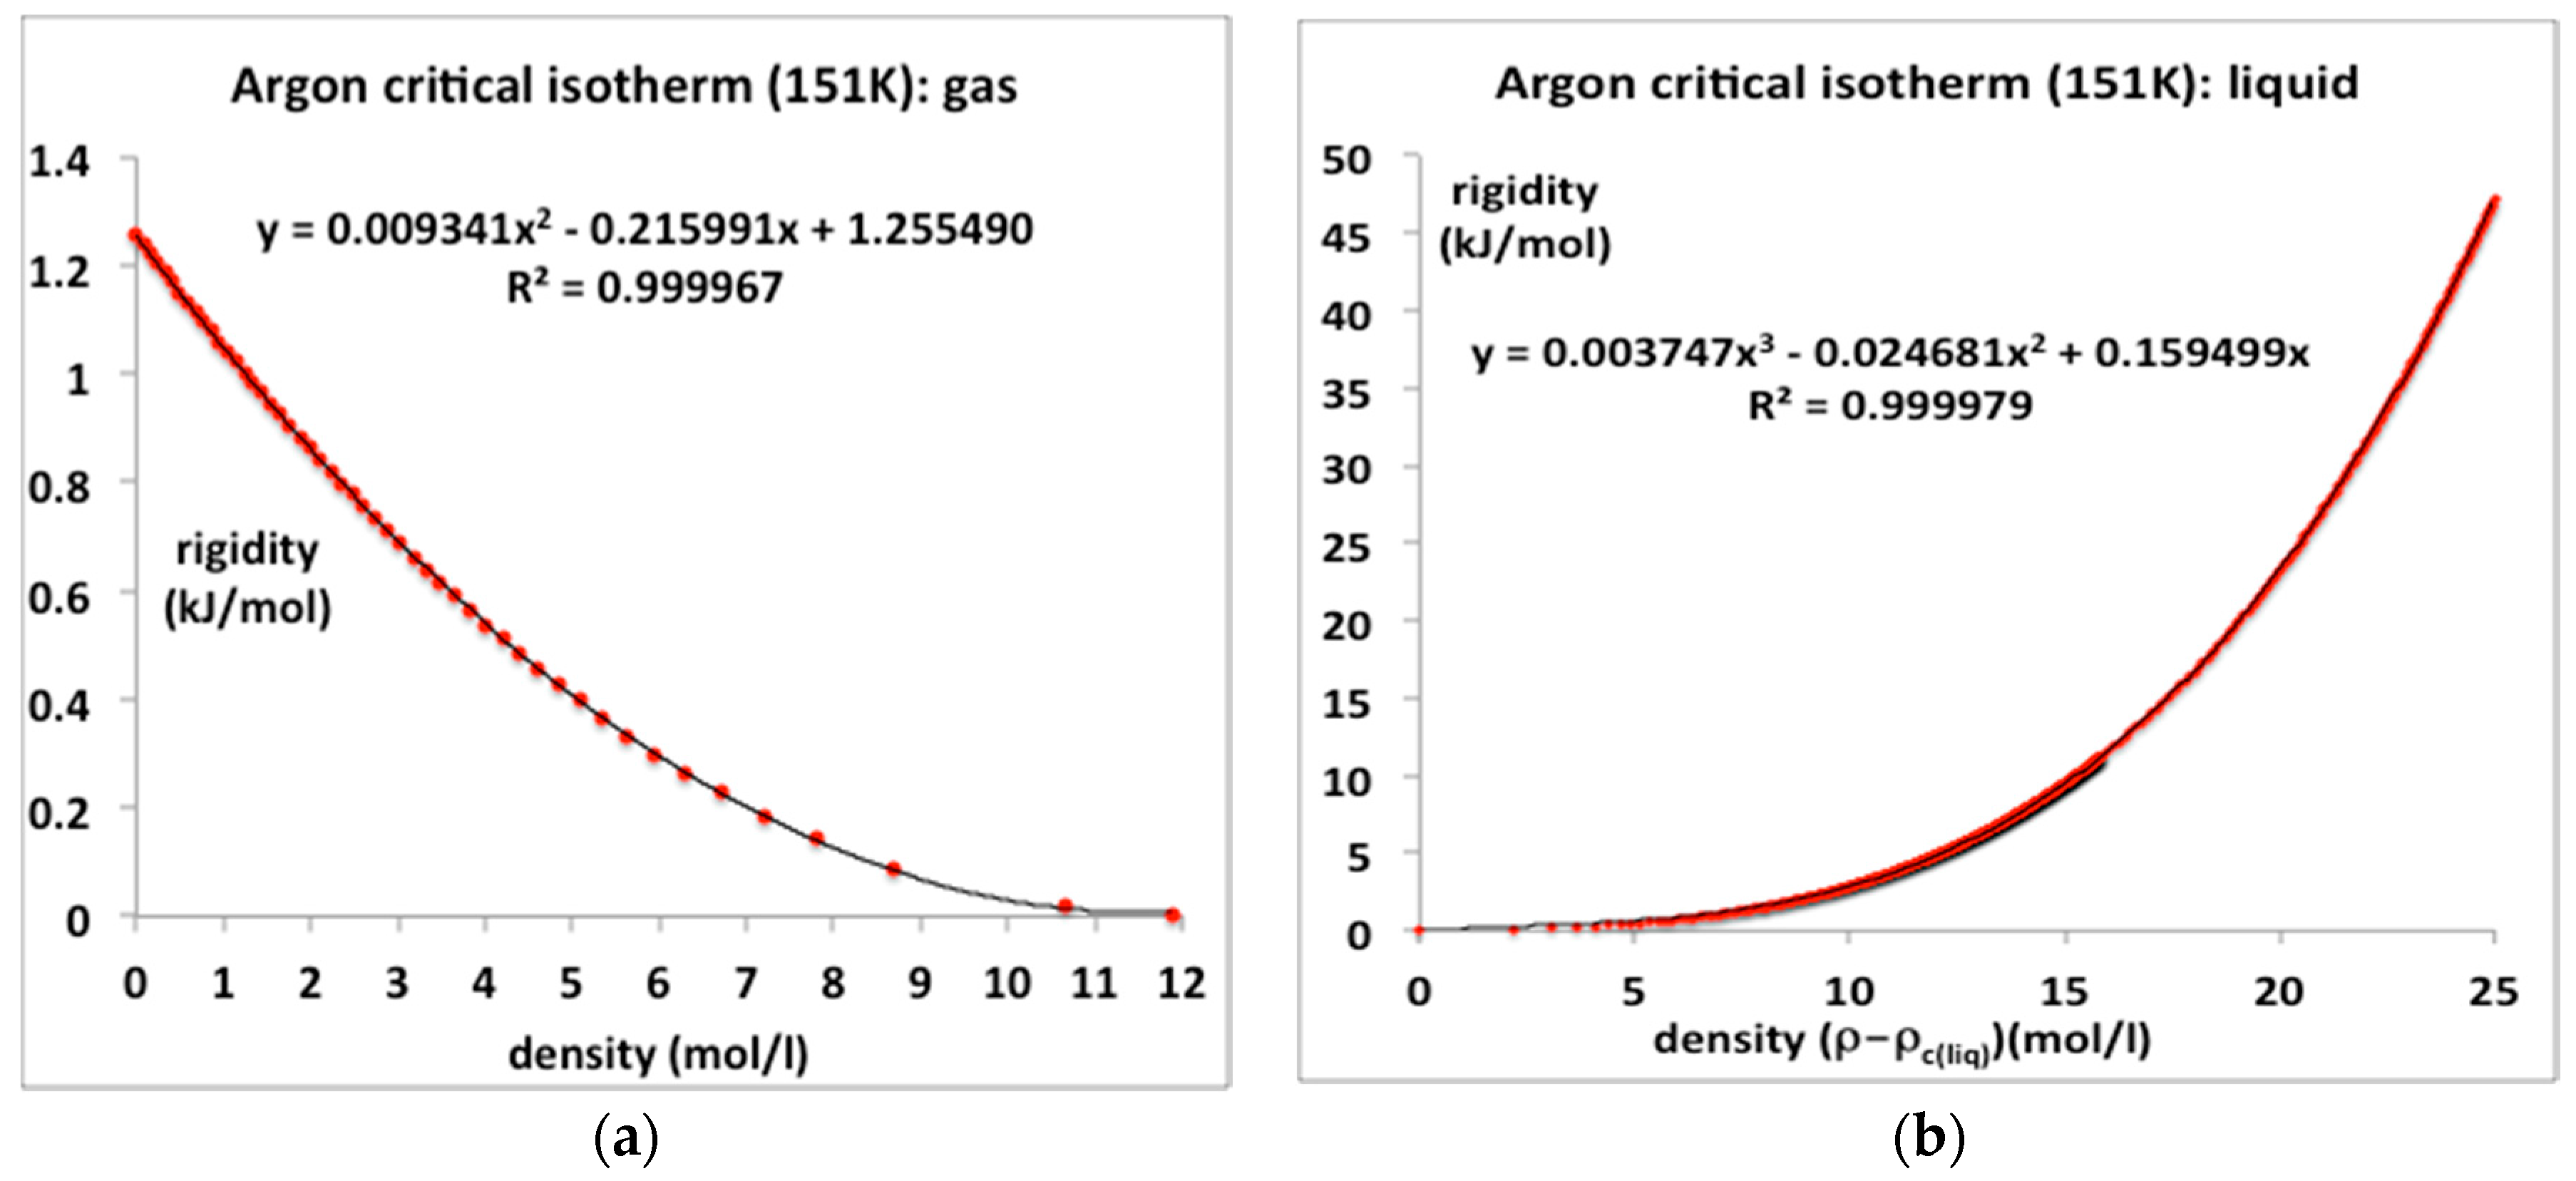
4.1. Argon
The critical temperature of argon according to NIST is 150.87, the value obtained in a revised analysis of the data of Gilgen et al. is 151.1 ± 0.1. Here we represent the rigidities of the experimental 151 K isotherm from the NIST data tables using standard trend-line polymomials. The coexisting gas and liquid densities as obtained from the original experimental data of Gilgen et al. [14,15] are ρc(gas) = 11.89 mol/L and ρc(liq) = 14.95 mol/L [8]. For all temperatures between Tc and the triple point (Ttr), the NIST ω(ρ)T isotherms can be reproduced with 100% precision using just the two-parameter equation. Numerical values of the coefficients b2 and b3 at Tc, obtained from the rigidity isotherms as illustrated in Figure 6a, are included in Table 1. The trend-line polynomials of order 3 reproduce the NIST isotherms over the whole range of equilibrium existence with high accuracy.
These trend-line equations for ωT(ρ) can be integrated to obtain pressure equations, and rewritten as:
where ρcl is the critical coexisting liquid density ρc(liq). For argon, the critical pressure in Equation (14) pc = 4.949 MPa [4]. Thus, we have an equation-of-state for argon along the whole critical isotherm, with no divergent singularity. The coefficients in Equations (13) and (15), are obtainable from the rigidity data plotted in Figure 6a,b, for example, by dividing the coefficients an by nkT.
Gas ρ < ρc(gas) p = kT (ρ + b2 ρ2 + b3 ρ3)
Meso ρc(gas) < ρ < ρc(liq) p = pc
Liquid ρ > ρc(liq) p = p(ρcl,T) + kT [a (ρ − ρcl) + a2(ρ − ρcl)2 + a3(ρ − ρcl)3]
4.2. Steam and Water
The evidence for supercritical percolation transitions bounding the existence of water and steam in the supercritical region, and the parameters describing the mesophase, have all been the subject of a previous article with an extended debate [16]. For the present purposes, we only need values of some physical constants that are given as an ancillary data list by NIST [3].
Figure 7 shows how the critical point in the T-p plane is thermodynamically defined by an intersection of two percolation loci, using the example of water. The coexisting density curves are taken from the experimental measurements of the IAPWS International Steam Tables [17]. The supercritical percolation transition points PA and PB intersect at Tc, and continue to define the metastable limit of existence loci, usually referred to as spinodals, of the subcritical gas and liquid within the two-phase region. Values of the critical physical constants for water are: Tc = 647.1 K; pc = 22.05 MPa; critical steam density ρcG = 13.02 mol/L; critical water density ρcL = 20.61 mol/L [3,16].
Also plotted in Figure 7 are the experimentally observed spinodals [18] that bound the regions of metastable existence within the two-phase coexistence region at subcritical temperatures. At Tc, the percolation loci, PA and PB in Figure 7, cross the critical coexistence line at its extremities to become the subcritical boundary of the metastable compressed gas (p > psat) and metastable expanded liquid state (p < psat) stability limits respectively. This behavior was also shown for liquid argon [8]. It is consistent with a phenomenological definition of PA and PB when both liquid and gas have the same values of the rigidity (ωT) on the same isotherm whereupon (d2p/dρ2)T = 0 at both PA and PB but at different pressures. At these instability points, there is also zero surface tension and consequently no barrier to spontaneous nucleation of steam from water at PA, or water from steam at PB, for example.
The equations-of-state for steam and water along the critical isotherm are shown in Figure 8a,b respectively. In both cases a quartic equation is required to fit the data with the five-figure precision of the NIST tables. The fourth virial coefficient for steam at Tc, however, still appears to be quite small in its contribution right up to the near critical density. We also note that the liquid water critical isotherm extends from a critical pressure of 22.05–1000 MPa and can be reproduced with six-figure precision by the quartic polynomial.
It is clear from the above that the equations-of-state for subcritical isotherms will require a scientific knowledge of the forms for the extension of the percolation loci into the subcritical two-phase region on the density surface. At present we do not have this information. It would be rather unwise to make any assumptions based only upon the known supercritical behavior of the density loci of PA and PB and rather scanty subcritical spinodals. In the following section, therefore, we will limit the present extension of the above to an analysis of the 100 K isotherm of liquid argon, to demonstrate the applicability of the simple equation-of-state forms Equations (8)–(10) to subcritical gas and liquid state isotherms.
5. Subcritical Isotherms
Subcritical Argon
The 100 K (T/Tc ~ 2/3) isotherm data for the rigidity from the NIST compilation of gaseous and liquid argon are re-plotted in Figure 9. The gas pressure up to the condensation line can be represented with just the two-term equation with the value of b2 given in Table 1; b3 is essentially zero. Thus the accurate equation for argon gas at lower temperatures is simply
pgas (100 K) = kTρ (1 + b2 ρ)
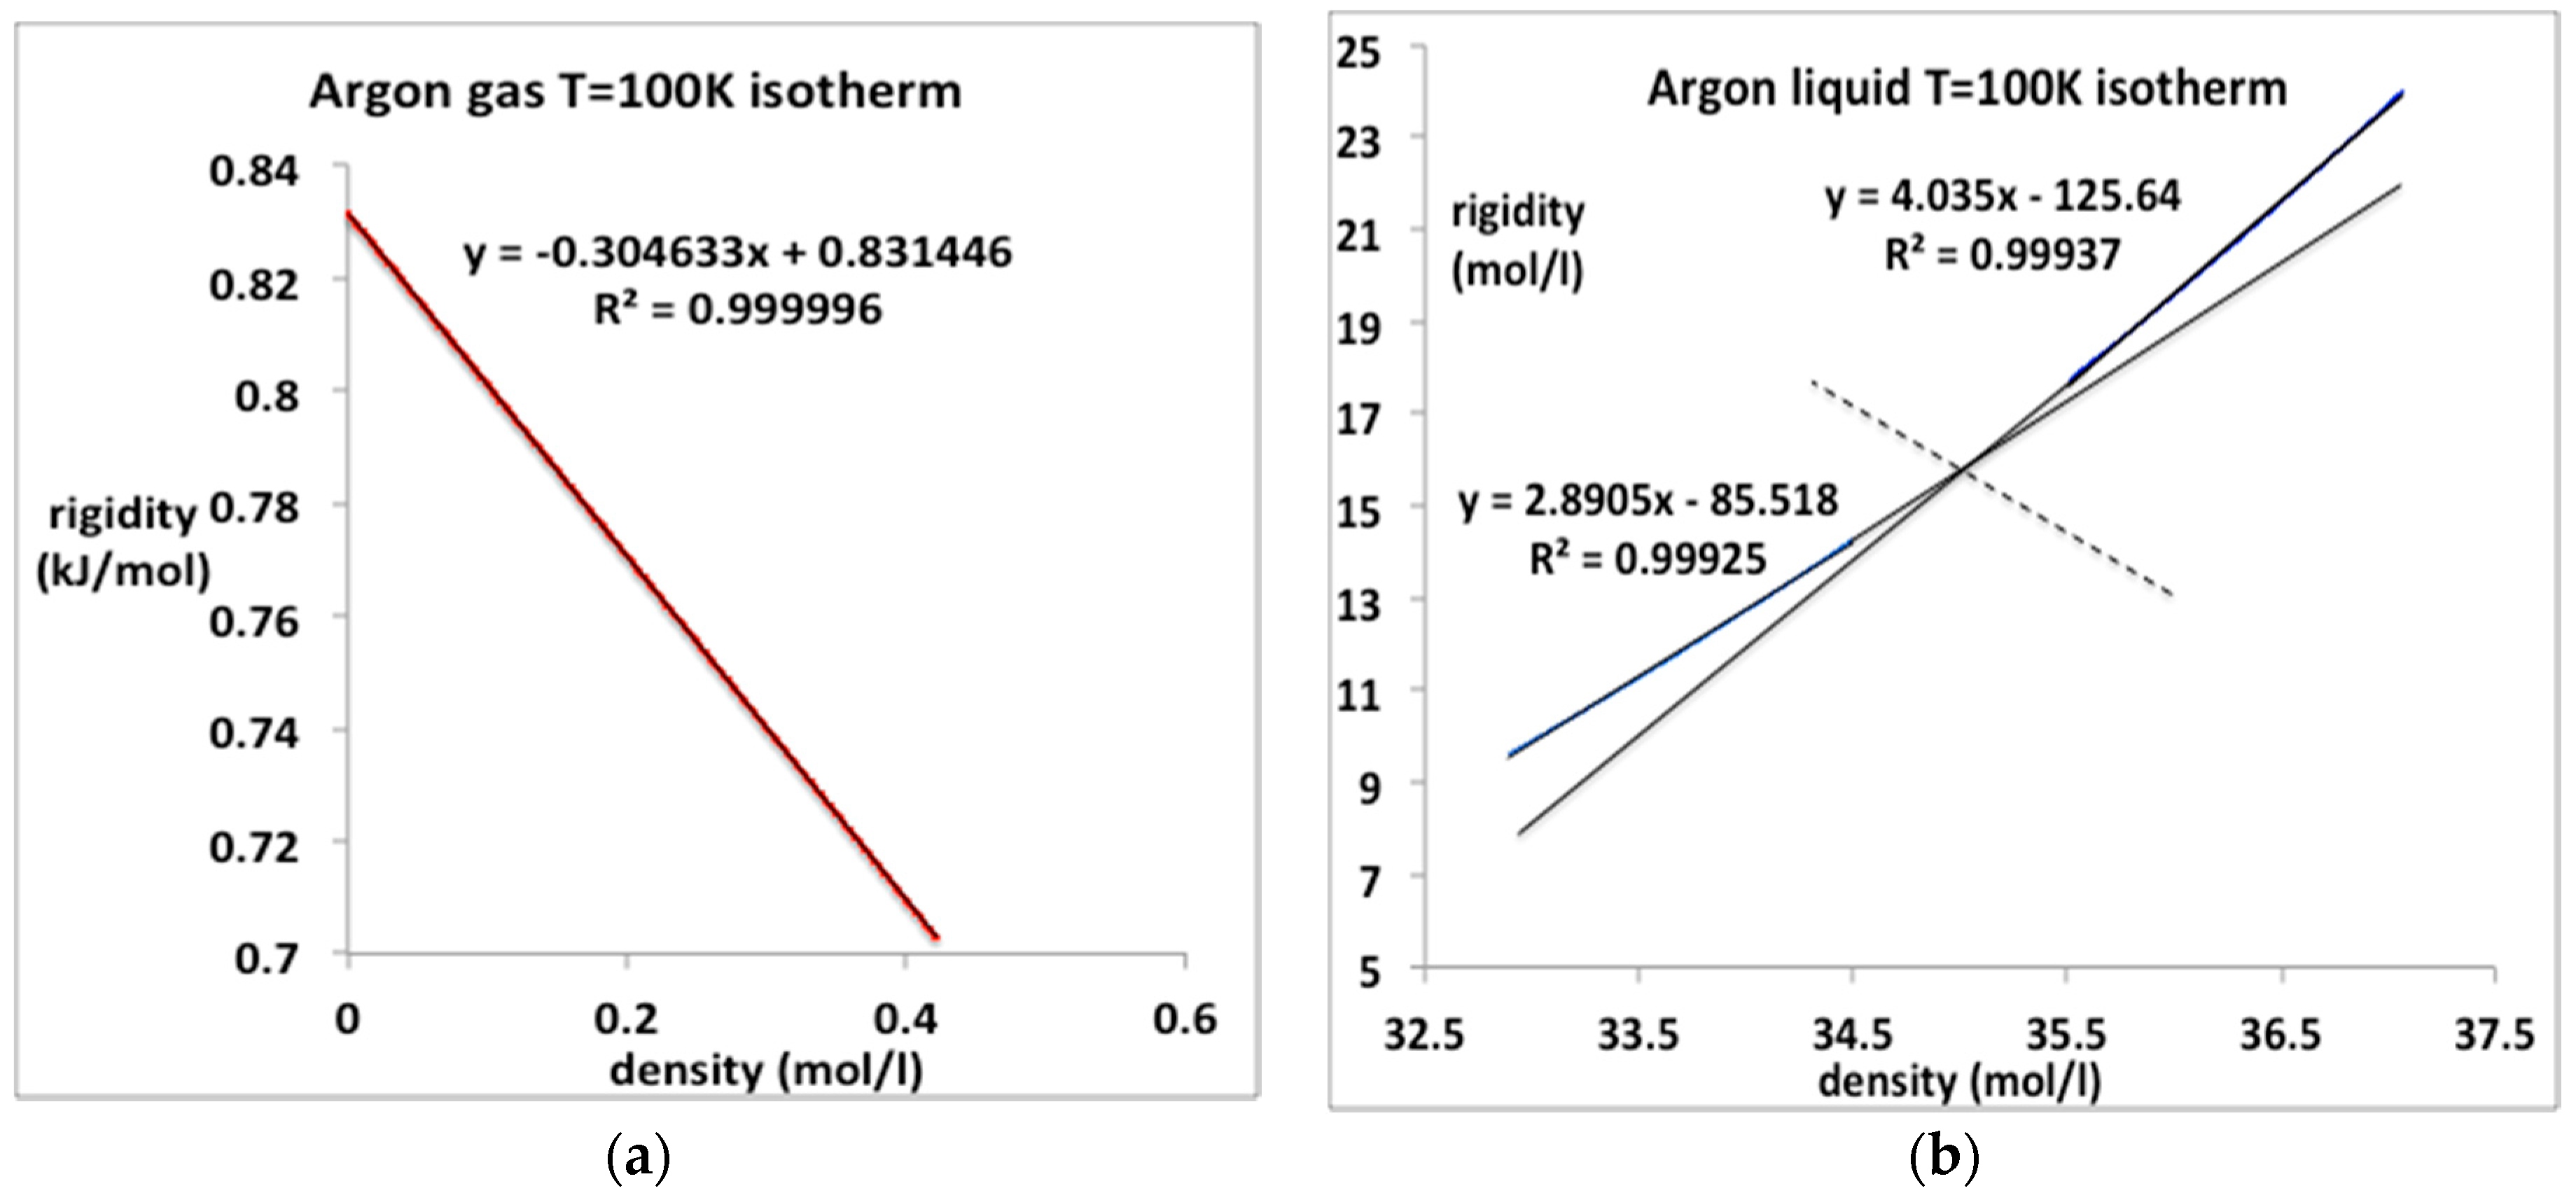
The value obtained from the linear fit of ωT in Figure 8a, is 183.2 × 10⁻³ mol/L compares favorably with an experimental value −187 (cm3/mol) obtained in 1958 [13].
The corresponding pressure data for liquid argon at 100 K up to freezing (62 MPa) may not be continuous in all its derivatives, and hence the equation-of-state may not be as simple as it looks if there is a higher-order discontinuity. The liquid isotherm appears to comprise two linear parts containing an intersection at an intermediate density of around 35.0 mol/L. This is consistent with a previous conjecture [19] that as the crystallization point is approached, the liquid itself may become another kind of mesophase as large clusters of ordered arrangements of atoms, probably bcc in the case of argon, begin to stabilize. This could be a feature of the equilibrium “liquid” state structure in the near triple-point density region. One can regard the data in Figure 9b as a fragment of evidence for this conjecture. We will not consider this intriguing possibility further at this stage. We note, however, that if this is indeed the underlying science, any equation-of-state for the equilibrium ‘pure liquid’ may terminate before the equilibrium crystallization density is reached along subcritical isotherm, below around 115 K in the case of argon.
6. Energy and Heat Capacities
6.1. Argon Critical Isotherm and Isochores
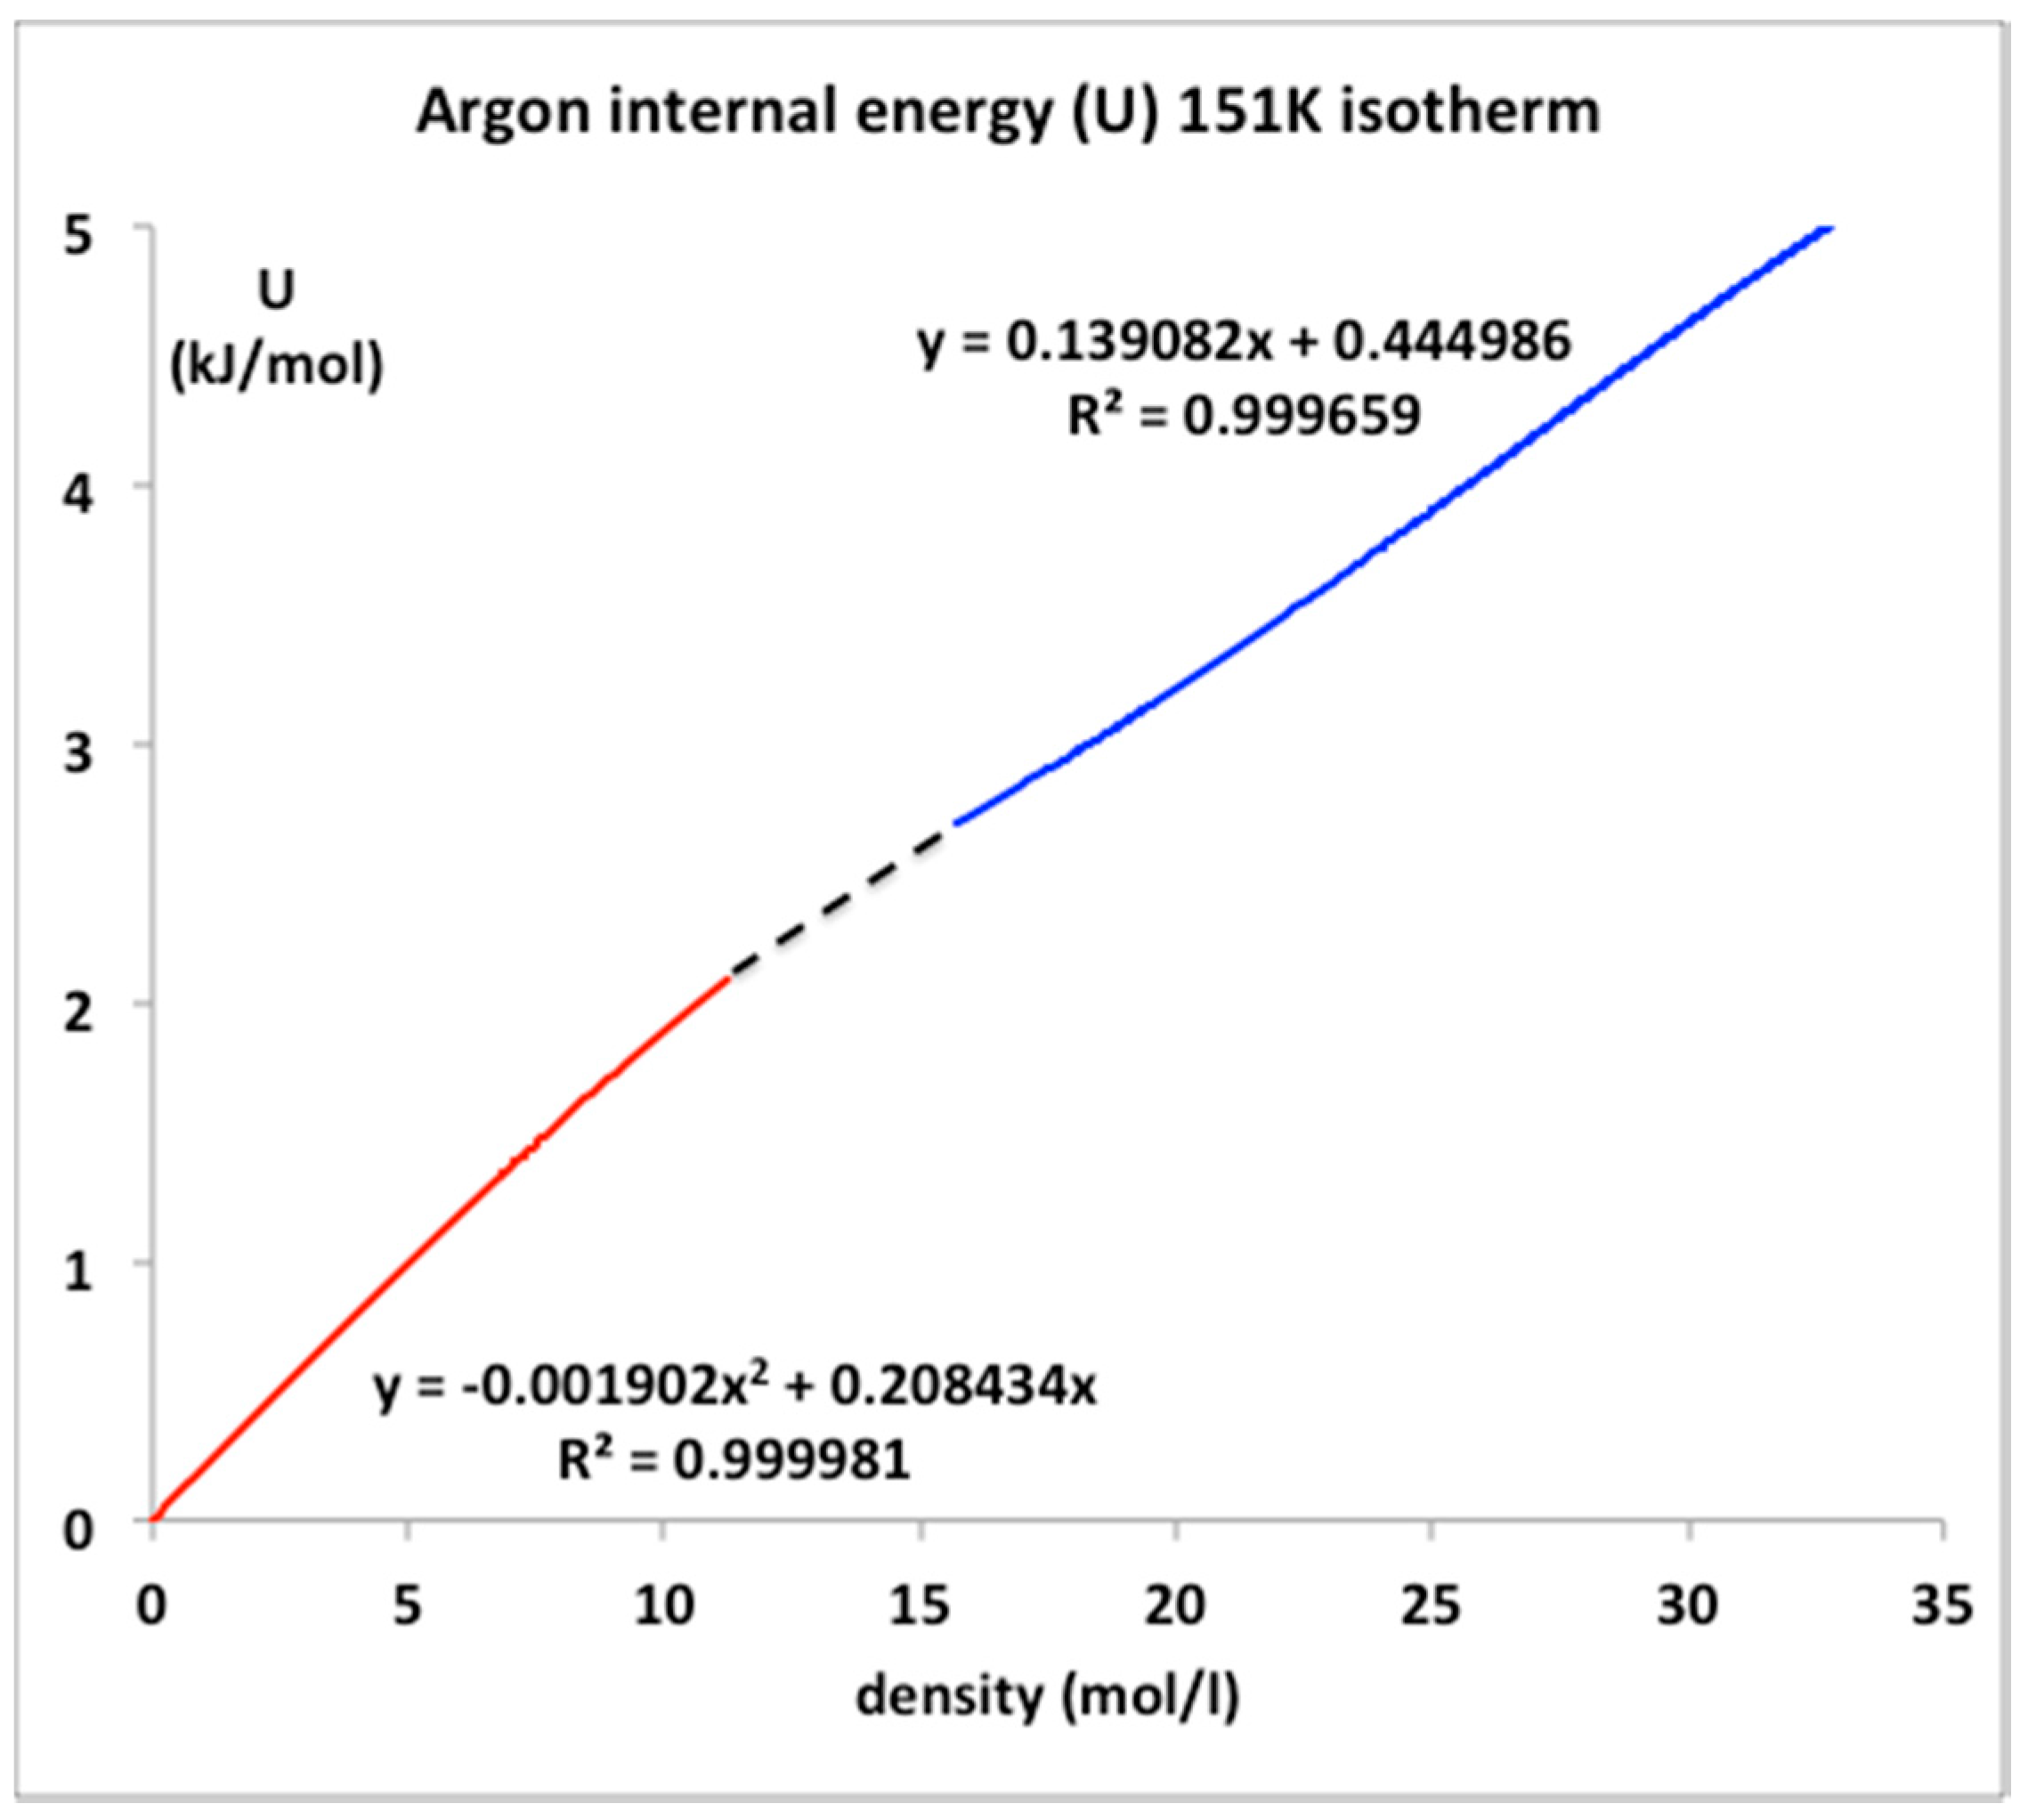
The only real evidence for a van der Waals-like singularity and a critical point, with continuity of gas and liquid [1] and universal scaling properties [20], is evidently in historic heat capacity measurements [21,22]. Here we focus briefly at the equation-of-state for the internal energy U(ρ)T for the critical isotherm of argon close to Tc (151 K). The NIST data with the trend-line parameters are shown in Figure 9. The foremost observation is that along this isotherm the gas phase is represented by a quadratic requiring two coefficients whereas the liquid phase is linear up to a density around 35 mol/L. The critical divide is linear by definition in accord with the lever rule or proportionality.
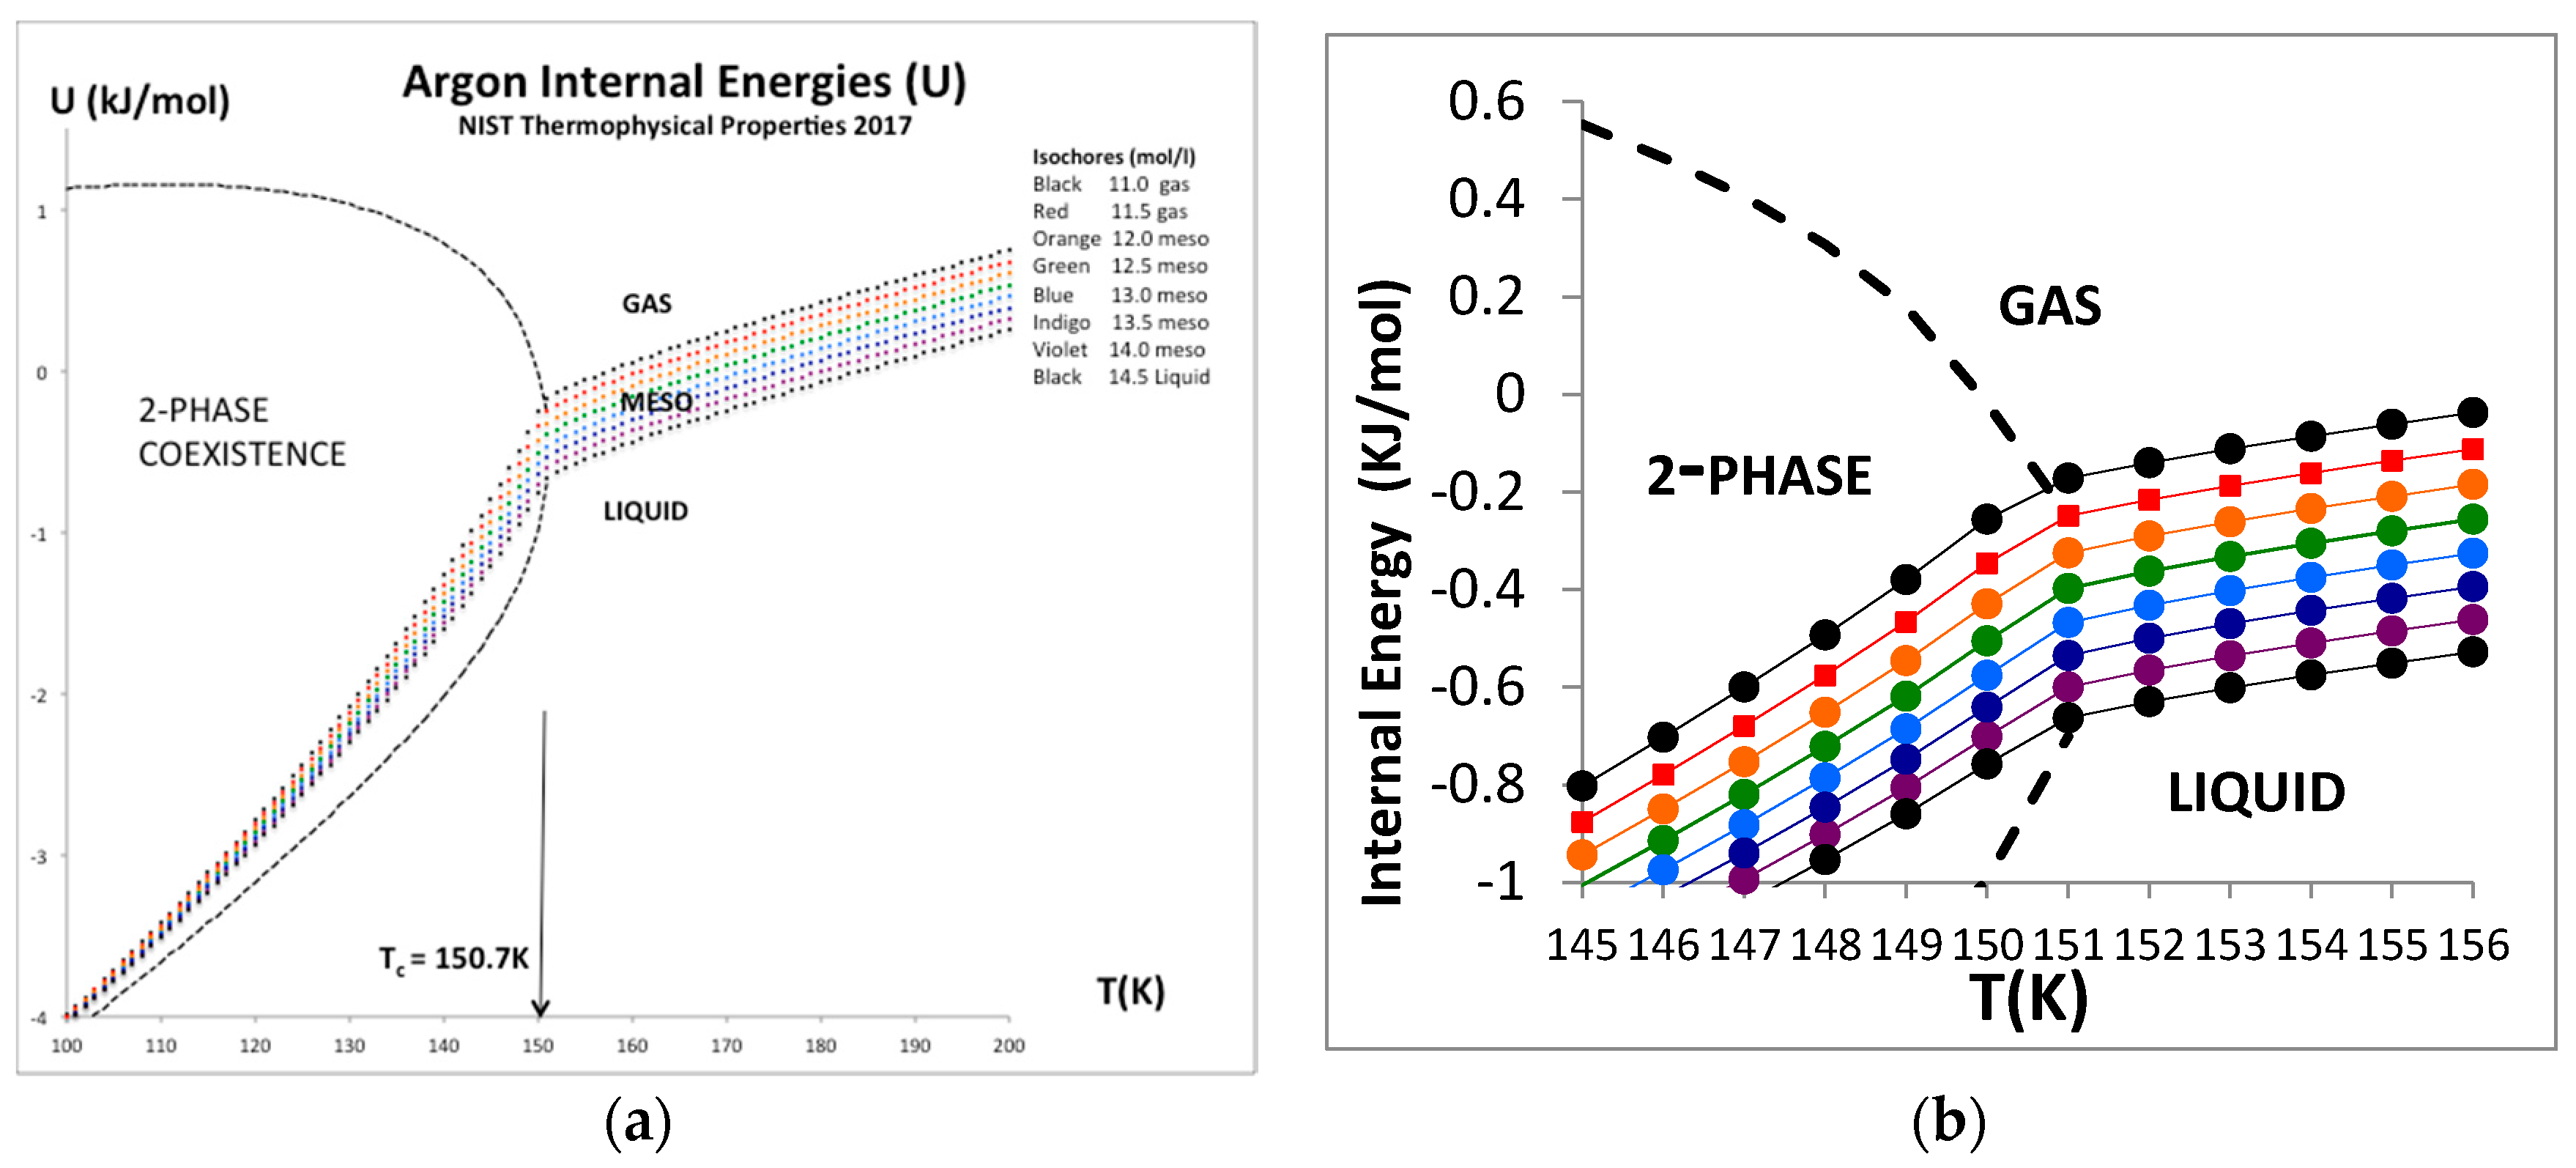
The internal energy for all temperatures below Tc in the two-phase region is defined to be linear by the lever rule since the physical state is of two-phase coexistence. Above the critical divide the three regions shown in Figure 10, however, look much the same, so we can identify two higher-order phase transitions bounding the mesophase. There is no evidence of divergent behavior of slope of U(T)ρ, i.e., in the isochoric heat capacity Cv. Isotherms from Tc to 2Tc all show a constant value of (dU/dT)ρ in the supercritical region, as seen in Figure 11. Along the critical divide, the isochoric heat capacity is defined by the lever rule: for T ≤ Tc
where X is mole fraction of liquid.
Cv = (dU/dT)V = X Cv(liq) + (1 − X) Cv(gas)
Uhlenbeck [20] appears to have been the first to recognize what he described as “surprising Russian results” [21,22] as being supportive of a universal picture of critical phenomena in which the isochoric heat capacity Cv is believed to diverge logarithmically on both sides of the critical point. When the proceedings of the Washington Conference were published one-year after the event [20], the articles by Rowlinson, and by Fisher, in particular, hailed the Russian discovery as a breakthrough (referenced by Rowlinson though curiously not referenced by Fisher), with the implicit proclamation that the van der Waals critical point, with continuity of liquid and gas, had become established scientific truth, and universal scaling properties similar to a 2D-Ising model lattice gas would describe gas-liquid and indeed all similar ‘critical point singularities’. In fact, an abundance of experimental evidence against this conjecture was already there in the literature [23] and not supportive of van der Waals hypothesis or universality.
Despite using complex equations-of-state that could accommodate the concept of a critical density at the node of a parabola, the NIST thermodynamic data bank is still valid as “experimental” evidence that the 1965 Washington proclamation of ‘a universality theory’ was fundamentally incorrect. It was based upon a misinterpretation of the isochoric heat capacity Cv for T < Tc, and spurious results at, or millikelvins greater than, Tc [24,25]. Along any isochore within the critical divide there can be no divergence of the isochoric heat capacity. For T > Tc a divergence of Cv would be a contradiction of laws of thermodynamics. If one could reversibly add heat (Qrev) to a classical Gibbs fluid system that does no work with no increase in the temperature, it would be imply, for example, that Qrev i.e., enthalpy, or (Qrev/T) i.e., entropy, are not state functions [26].
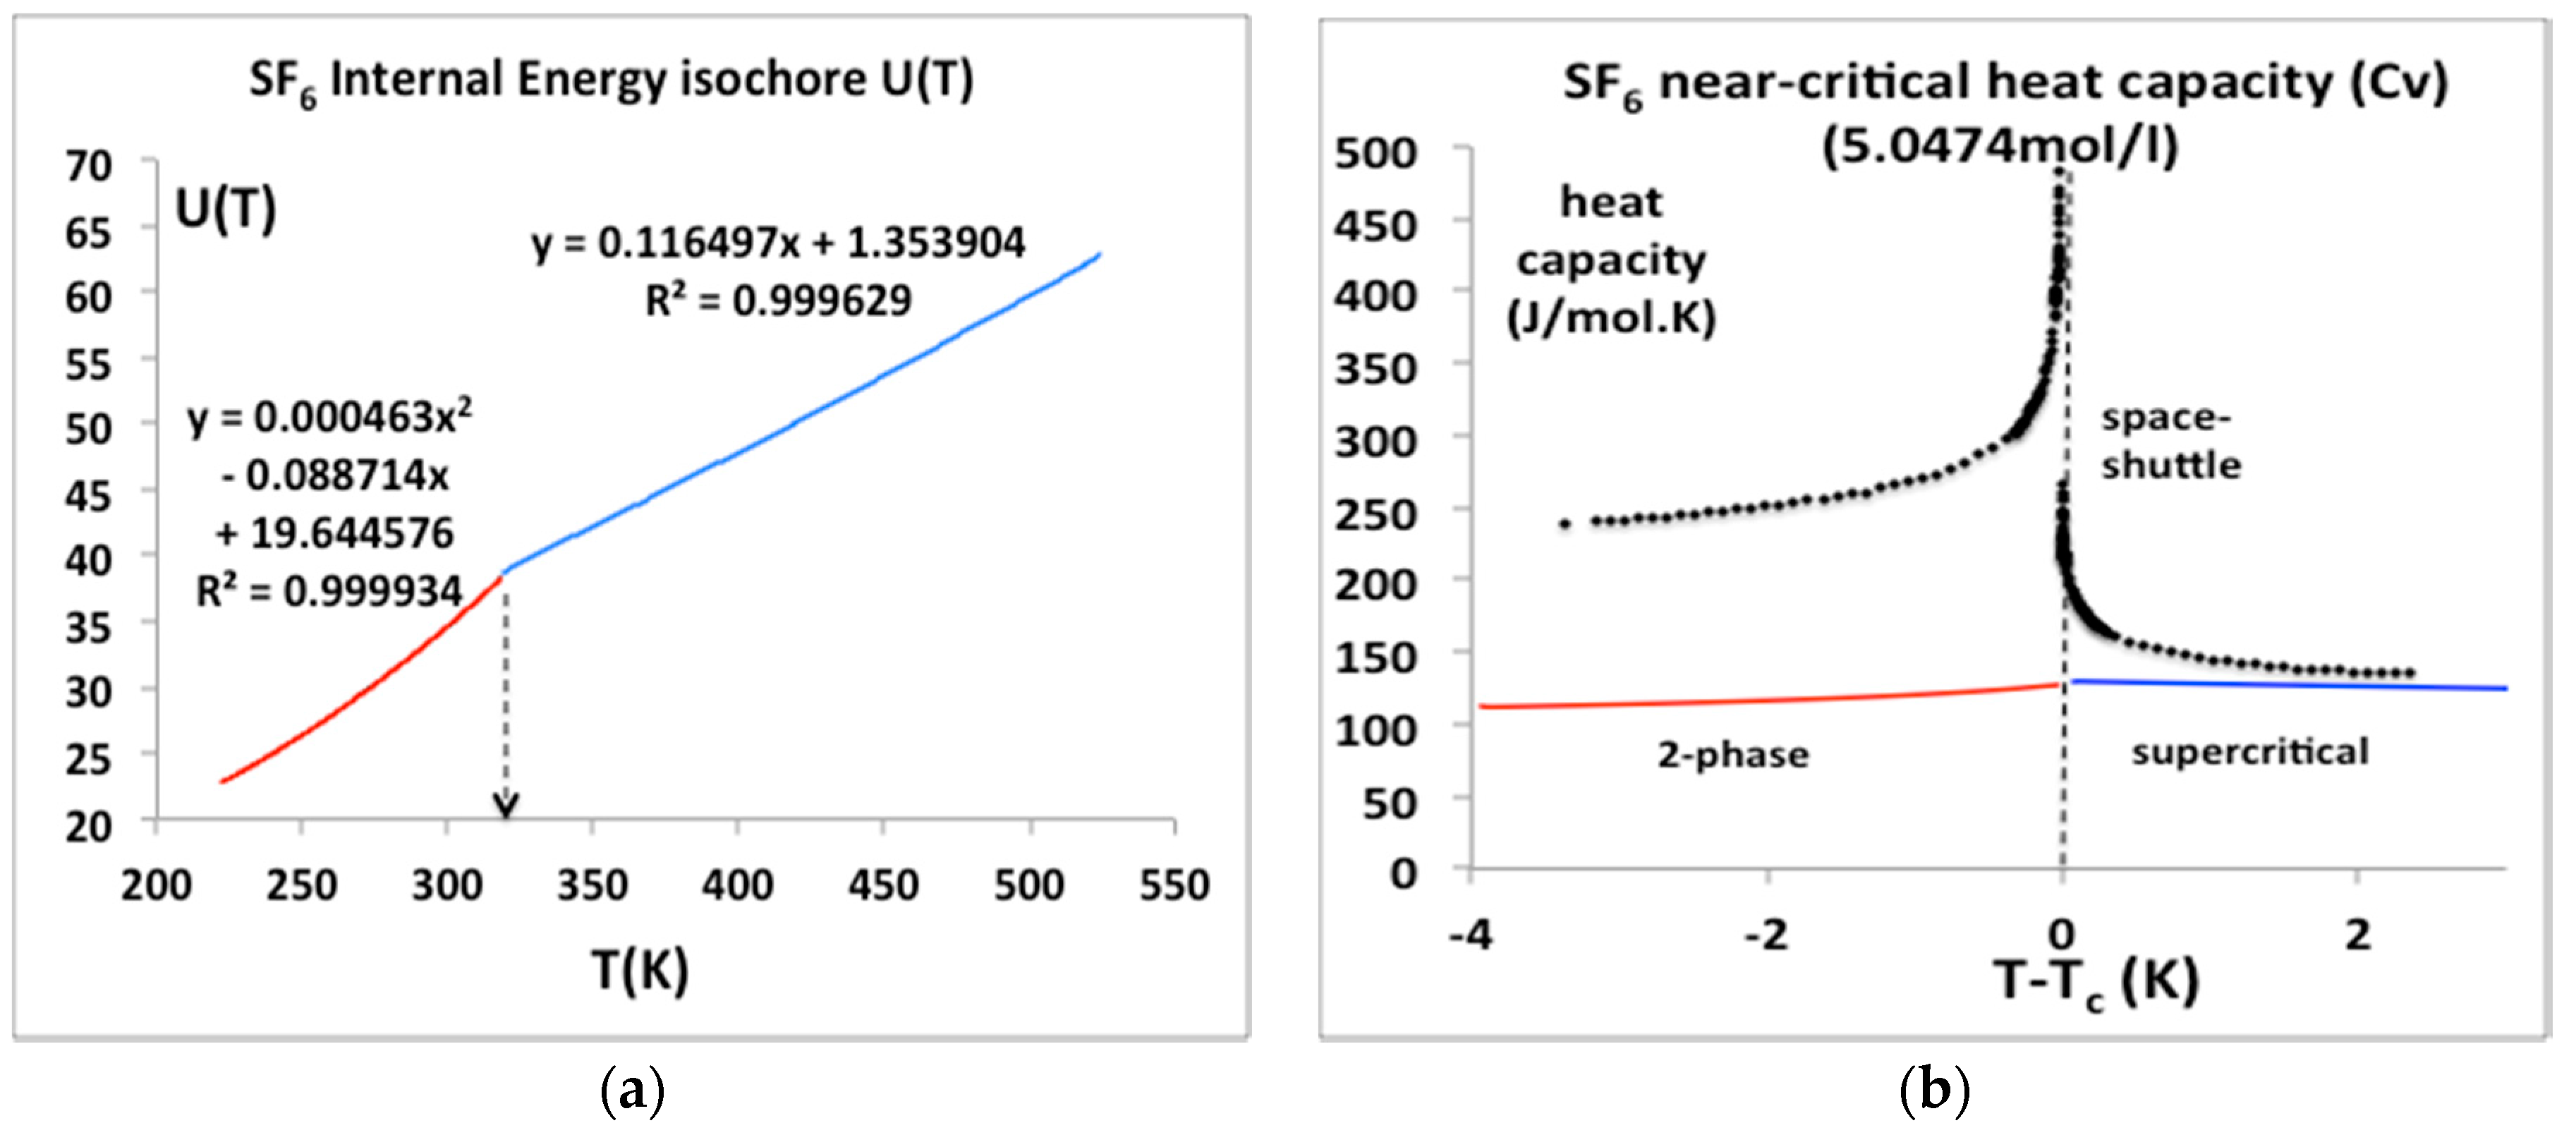
6.2. SF6 near Critical Isochors
Sulphur hexafluoride has a special importance in this scientific debate; its critical temperature and pressure are amenable to experiments at near ambient conditions. It has been the subject of a microgravity experiment aboard the NASA Space Shuttle [27] that appeared to confirm the erroneous result obtained some 25 years earlier by Voronel and his colleagues [24,25]. We have obtained the original published data points of the space shuttle experiments (see acknowledgements) and have plotted them alongside the U(T)V equation-of-state from the NIST data bank parameterized as a simple quadratic for T < Tc and linear for T > Tc equations in Figure 12a. The equations for U(T) at the same density as the space shuttle μg experiment can be differentiated to give the isochoric heat capacities Cv in Figure 12b. In contrast to both the historic Russian results for argon, and the space shuttle “Cv” values also plotted in Figure 12b, there is no divergence of the isochoric heat capacity Cv either below or above Tc, as suggested, for example, in alternative near critical equations of state with a crossover to the divergent form in the vicinity of Tc [28].
We can see from Figure 12 that the isochoric heat capacities reported in the Russian experiments, and the space shuttle experiments, as relied upon by all the principle proponents of universality for several decades [20], are a misinterpretation of the correct thermodynamic definition of the isochoric heat capacity Cv below the critical temperature. If the equations-of-state for U(T) in Figure 12a are essentially correct, the space shuttle result, as well as the argon results for “Cv” must be wrong in the region above Tc. One explanation may be that the experimental measurements on argon [21] were carried out on continuously stirred steady-states. Heat capacity data obtained for stirred samples in closed adiabatic calorimeters cannot be construed as equilibrium thermodynamic data for the determination of fluid equations-of-state in the close proximity of Tc, either below or above Tc, for any isochore along the critical divide. In the case of the SF6 microgravity experiments [22], if there was no stirring, there must be some other reason for the discrepancy seen in Figure 12, that is presently inexplicable.
7. Conclusions
From the foregoing analysis, we conclude that the pressure equation-of-state, and hence all other thermodynamic state functions, can be expressed simply in terms of a few physical constants belonging to the fluid, and coefficients in virial expansions. The van der Waals equation-of-state survived for about 50 years until, increasingly, there was evidence that it could not account for the experimental data unless it was extended to include more and more terms and adjustable parameters. Modern equations-of-state with a large number of terms and adjustable parameters can reproduce experimental p-V-T data to high precision for chemical engineering applications, but they may no longer reflect an underlying physical science in the spirit of van der Waals.
We have found that the equation-of-state for the low density gas phases, in all three temperature regions T > TB, TB >T > Tc, and T < Tc, can all be represented by the first two or three terms of a Mayer virial expansion. For T > TB a single virial equation can represent the whole isotherms up to the highest recorded pressures, which in the case of argon is 100 MPa. For supercritical temperatures below the Boyle temperature the gas phase can be represented by a term virial expansion to within the accuracy that the original pressures reported by NIST [3]. The virial equations-of-state are fundamental to all atomic and molecular fluids and appear to be accurate up to second order, i.e., to quadratic terms for all temperatures below TB. We will report detailed comparisons and virial coefficients for the case CO2, and also some preliminary comparisons with experimental data and NIST equations, for the exemplary fluid argon, in due course.
At this stage in the development of science-based alternative forms of the equation-of-state we have not attempted to parameterise the second and third virial coefficients as functions of temperature. We note, however, there is evidence that b2(T) may be non-analytic at the Boyle temperature. It can be represented by two different series expansions, at least in the case of a simple Lennard–Jones model, above and below TB [29,30]. There are also some indications that b3(T) exhibits a maximum at or near Tc. Also, we find that for simple fluids, e.g., argon, below TB, the coefficient b4(T) appears to become vanishingly small. A more accurate determination of lower-order virial coefficients from original thermodynamic data ought now to become a research priority.
Acknowledgments
Conflicts of Interest
The author declares no conflict of interest.
References
- Van der Waals, J.D. “Over de Continuiteit van den Gas-en Vloeistoftoestand” (On the Continuity of the Gas and Liquid State). Ph.D. Thesis, University of Leiden, Leiden, The Netherlands, 1873. [Google Scholar]
- Span, R.; Wagner, W. A New Equation of State for Carbon Dioxide Covering the Fluid Region for temperatures from the Triple Point to 1100 K at Pressures up to 800 MPa. J. Phys. Chem. Ref. Data 1996, 25, 1509–1594. [Google Scholar] [CrossRef]
- NIST Thermophysical Properties of Fluid Systems. 2017. Available online: http://webbook.nist.gov/chemistry/fluid/ (accessed on 20 May 2017).
- Woodcock, L.V. Observations of a thermodynamic liquid-gas critical coexistence line and supercritical phase bounds from percolation loci. Fluid Phase Equilib. 2012, 351, 25–33. [Google Scholar] [CrossRef]
- Heyes, D.M.; Woodcock, L.V. Critical and supercritical properties of Lennard-Jones Fluids. Fluid Phase Equilib. 2013, 356, 301–308. [Google Scholar] [CrossRef]
- Magnier, H.J.; Curtis, R.C.; Woodcock, L.V. Nature of the supercritical Mesophase. Nat. Sci. 2014, 6, 797–807. [Google Scholar] [CrossRef]
- Woodcock, L.V. Percolation Transitions and Fluid State Boundaries. CMST 2017, 23, 281–294. [Google Scholar] [CrossRef]
- Woodcock, L.V. Gibbs density surface of fluid argon: Revised critical parameters. Int. J. Thermophys. 2014, 35, 1770–1777. [Google Scholar] [CrossRef]
- Woodcock, L.V. Thermodynamics of Gas-Liquid Criticality: Rigidity Symmetry on Gibbs Density Surface. Int. J. Thermophys. 2016, 37, 24. [Google Scholar] [CrossRef]
- Mayer, J.E.; Mayer, M.G. Statistical Mechanics; Wiley: New York, NY, USA, 1940. [Google Scholar]
- Michels, A.; Geldermans, M.; de Groot, S.R. Determination of thermodynamic properties from laboratory compressibility data. Physica 1946, 12, 105. [Google Scholar] [CrossRef]
- Tegeler, C.; Span, R.; Wagner, W. A new equation of state for argon covering the fluid region for temperatures from the melting line to 700 K at Pressures up to 1000 MPa. J. Phys. Chem. Ref. Data 1999, 28, 779–850. [Google Scholar] [CrossRef]
- Stewart, R.B.; Jacobsen, R.T. Thermodynamic properties of argon from triple point to 1200 K with pressures up to 1000 MPa. J. Phys. Chem. Ref. Data 1989, 18, 639–678. [Google Scholar] [CrossRef]
- Gilgen, R.; Kleinrahm, R.; Wagner, W. Measurement and correlation of the (pressure, density, temperature) relation of argon: I. The homogeneous gas and liquid regions in the temperature range from 90 to 300 K at pressures up to 12MPa. J. Chem. Thermodyn. 1994, 26, 383–398. [Google Scholar] [CrossRef]
- Gilgen, R.; Kleinrahm, R.; Wagner, W. Measurement and correlation of the (pressure, density, temperature) relation of argon II Saturated-liquid and saturated vapour densities and vapour pressures along the entire coexistence curve. J. Chem. Thermodyn. 1994, 26, 399–413. [Google Scholar] [CrossRef]
- Woodcock, L.V. Gibbs density surface of water and steam: 2nd debate on the absence of van der Waals’ critical point. Nat. Sci. 2014, 6, 411–432. [Google Scholar] [CrossRef]
- Wagner, W.; Kretzschmar, H.-J. IAPWS-IF’97 International Steam Tables: Properties of Water and Steam; Springer: Berlin, Germany, 2008. [Google Scholar]
- Shamsundar, N.; Lienhard, J.H. Equations of state and spinodal lines: A review. Nucl. Eng. Des. 1993, 141, 269–287. [Google Scholar] [CrossRef]
- Finney, J.L.; Woodcock, L.V. Renaissance of Bernal’s random close packing and hypercritical line in the theory of liquids. J. Phys. 2014, 26, 463102. [Google Scholar] [CrossRef] [PubMed]
- Green, M.S.; Sengers, J.V. Critical Phenomena. In Proceedings of the Conference on Phenomena in the Neighborhood of Critical Points, Washington, DC, USA, 5–8 April 1965; National Bureau of Standards: Washington, DC, USA, 1965. [Google Scholar]
- Bagatskiǐ, M.I.; Voronel, A.V.; Gusak, B.G. Measurements of isochoric heat capacities of near-critical argon. Sov. Phys. JETP 1963, 16, 517. [Google Scholar]
- Voronel, A.V.; Chorkin, Y.R.; Popov, V.A.; Simkin, V.G. Measurements of isochoric heat capacities of near-critical argon. Sov. Phys. JETP 1964, 18, 568. [Google Scholar]
- Rice, O.K. Critical phenomena. In Thermodynamics and Physics of Matter; Rossini, F.D., Ed.; Oxford University Press: London, UK, 1955; pp. 419–500. [Google Scholar]
- Sengers, J.V.; Anisimov, M.A. Comment on “Gibbs density surface of fluid argon: Revised critical properties” by L. V. Woodcock. Int. J. Thermophys. 2015, 36, 3001. [Google Scholar] [CrossRef]
- Woodcock, L.V. On the interpretation of near critical heat capacity measurements. Int. J. Thermophys. 2017, 38, 139. [Google Scholar] [CrossRef]
- Sandler, S.I.; Woodcock, L.V. Historical observations on the laws of thermodynamics. J. Chem. Eng. Data 2010, 55, 4485. [Google Scholar] [CrossRef]
- Haupt, A.; Straub, J. Evaluation of the isochoric heat capacity measurements at the critical Isochore of SF6 performed during the German Spacelab Mission D-2. Phys. Rev. E 1999, 59, 1975. [Google Scholar] [CrossRef]
- Kostrowicka-Wyczalkowska, A.; Sengers, J.V. Thermodynamic properties of Sulphur hexafluoride in the critical region. J. Chem. Phys. 1999, 111, 1551. [Google Scholar] [CrossRef]
- Eu, B.C. Exact analytic second virial coefficient for the Lennard-Jones Fluid. arXiv, 2009; arXiv:0909.3326. [Google Scholar]
- Heyes, D.M.; Pieprzyk, S.; Rickayzen, G.; Branka, A.C. The second virial coefficient and critical point behaviour of the Mie potential. J. Chem. Phys. 2016, 145, 084505. [Google Scholar] [CrossRef] [PubMed]
Figure 1.
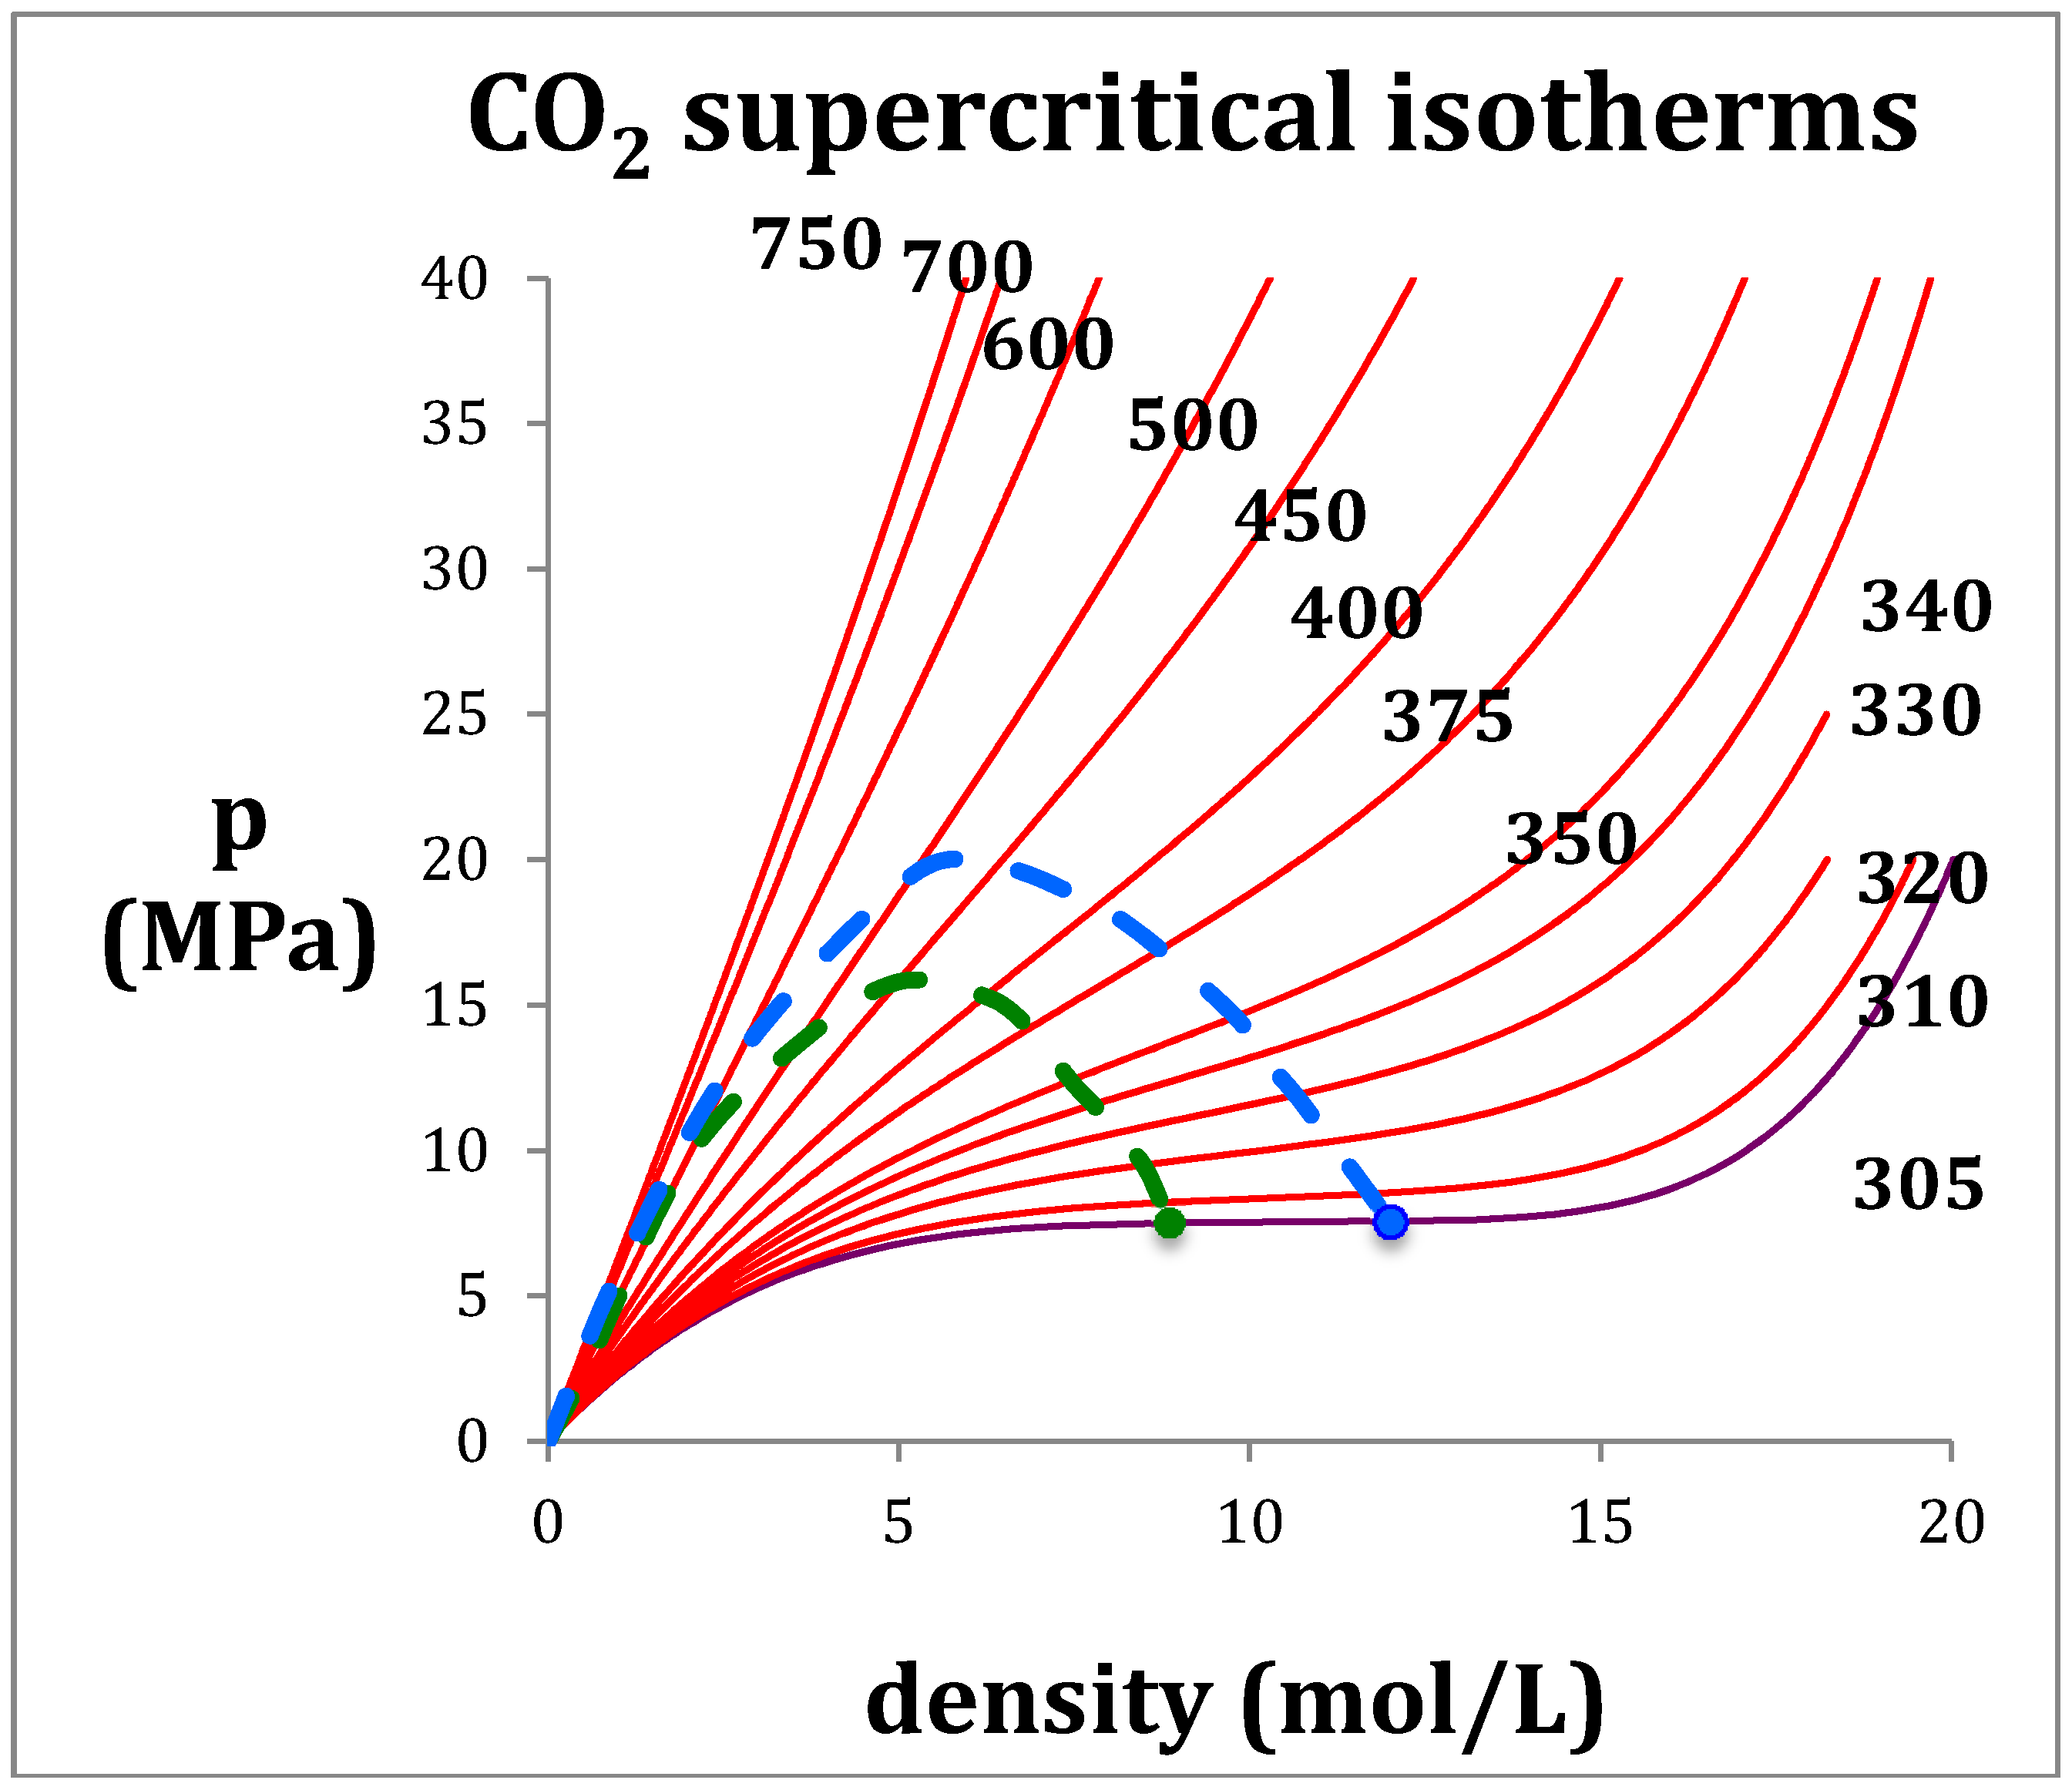
Supercritical T(K) isotherms for CO2: the green dashed line is the percolation loci PB; the blue dashed line is the percolation loci PA; the green and blue solid circles are the maximum experimentally observable coexisting gas density, and minimum coexisting liquid density along Tc i.e., 305 K (purple).
Figure 1.
Supercritical T(K) isotherms for CO2: the green dashed line is the percolation loci PB; the blue dashed line is the percolation loci PA; the green and blue solid circles are the maximum experimentally observable coexisting gas density, and minimum coexisting liquid density along Tc i.e., 305 K (purple).

Figure 2.
Rigidity of fluid phases of CO2 from NIST thermo-physical tables: the loci of gas and liquid-phase bounds are green (percolation line PB) and blue (percolation line PA) respectively; red lines are supercritical isotherms, blue lines are subcritical isotherms; the purple isotherm is Tc (305 K): the Boyle temperature (TB) = 725 K.

Figure 3.
(a) Phase diagram for CO2: data obtained from NIST Thermophysical Properties compilation indicating the percolation loci that bound the supercritical liquid and gas states: the green and blue dashed lines are the gas (PB) and liquid (PA) percolation loci respectively [4,5,6,7,8,9]; solid red points; coexisting densities of the gas (ρG) and of liquid (ρL) at Tc are indicated by the arrows; (b) rigidity as a function of temperature in the mesophase.

Figure 4.
Pressure equations p(ρ) for CO2 at a supercritical temperature (350 K or T/Tc = 1.15) as derived from NIST Thermophysical Properties compilation: (a) gas state; (b) supercritical meso-phase and (c) liquid.
Figure 4.
Pressure equations p(ρ) for CO2 at a supercritical temperature (350 K or T/Tc = 1.15) as derived from NIST Thermophysical Properties compilation: (a) gas state; (b) supercritical meso-phase and (c) liquid.

Figure 5.
Rigidity isotherms, ω(ρ) for argon at temperatures from 700 K down to TB (414 K) as obtained from NIST Thermophysical Properties compilation up to pressures of 500 MPa; all of the EXCEL trendline polynomials of order 4 reproduce the NIST isotherms with total precision, i.e., a regression of R2 = 1.000000 up to 6-figure precision.

Figure 6.
Rigidity isotherms, ω(ρ), for argon along Tc from NIST Thermophysical Properties compilation [3]: (a) gas phase from zero to maximum gas density at critical pressure 4.949 MPa (b) liquid phase from minimum liquid density from pc (4.949 MPa) to 326 MPa. The rigidity along the critical divide is equal to zero.

Figure 7.
A phase diagram of water and steam in the p-T plane: the red and blue data points and dashed lines are the percolation loci state bounds PA (water) and PB (steam) respectively.
Figure 7.
A phase diagram of water and steam in the p-T plane: the red and blue data points and dashed lines are the percolation loci state bounds PA (water) and PB (steam) respectively.
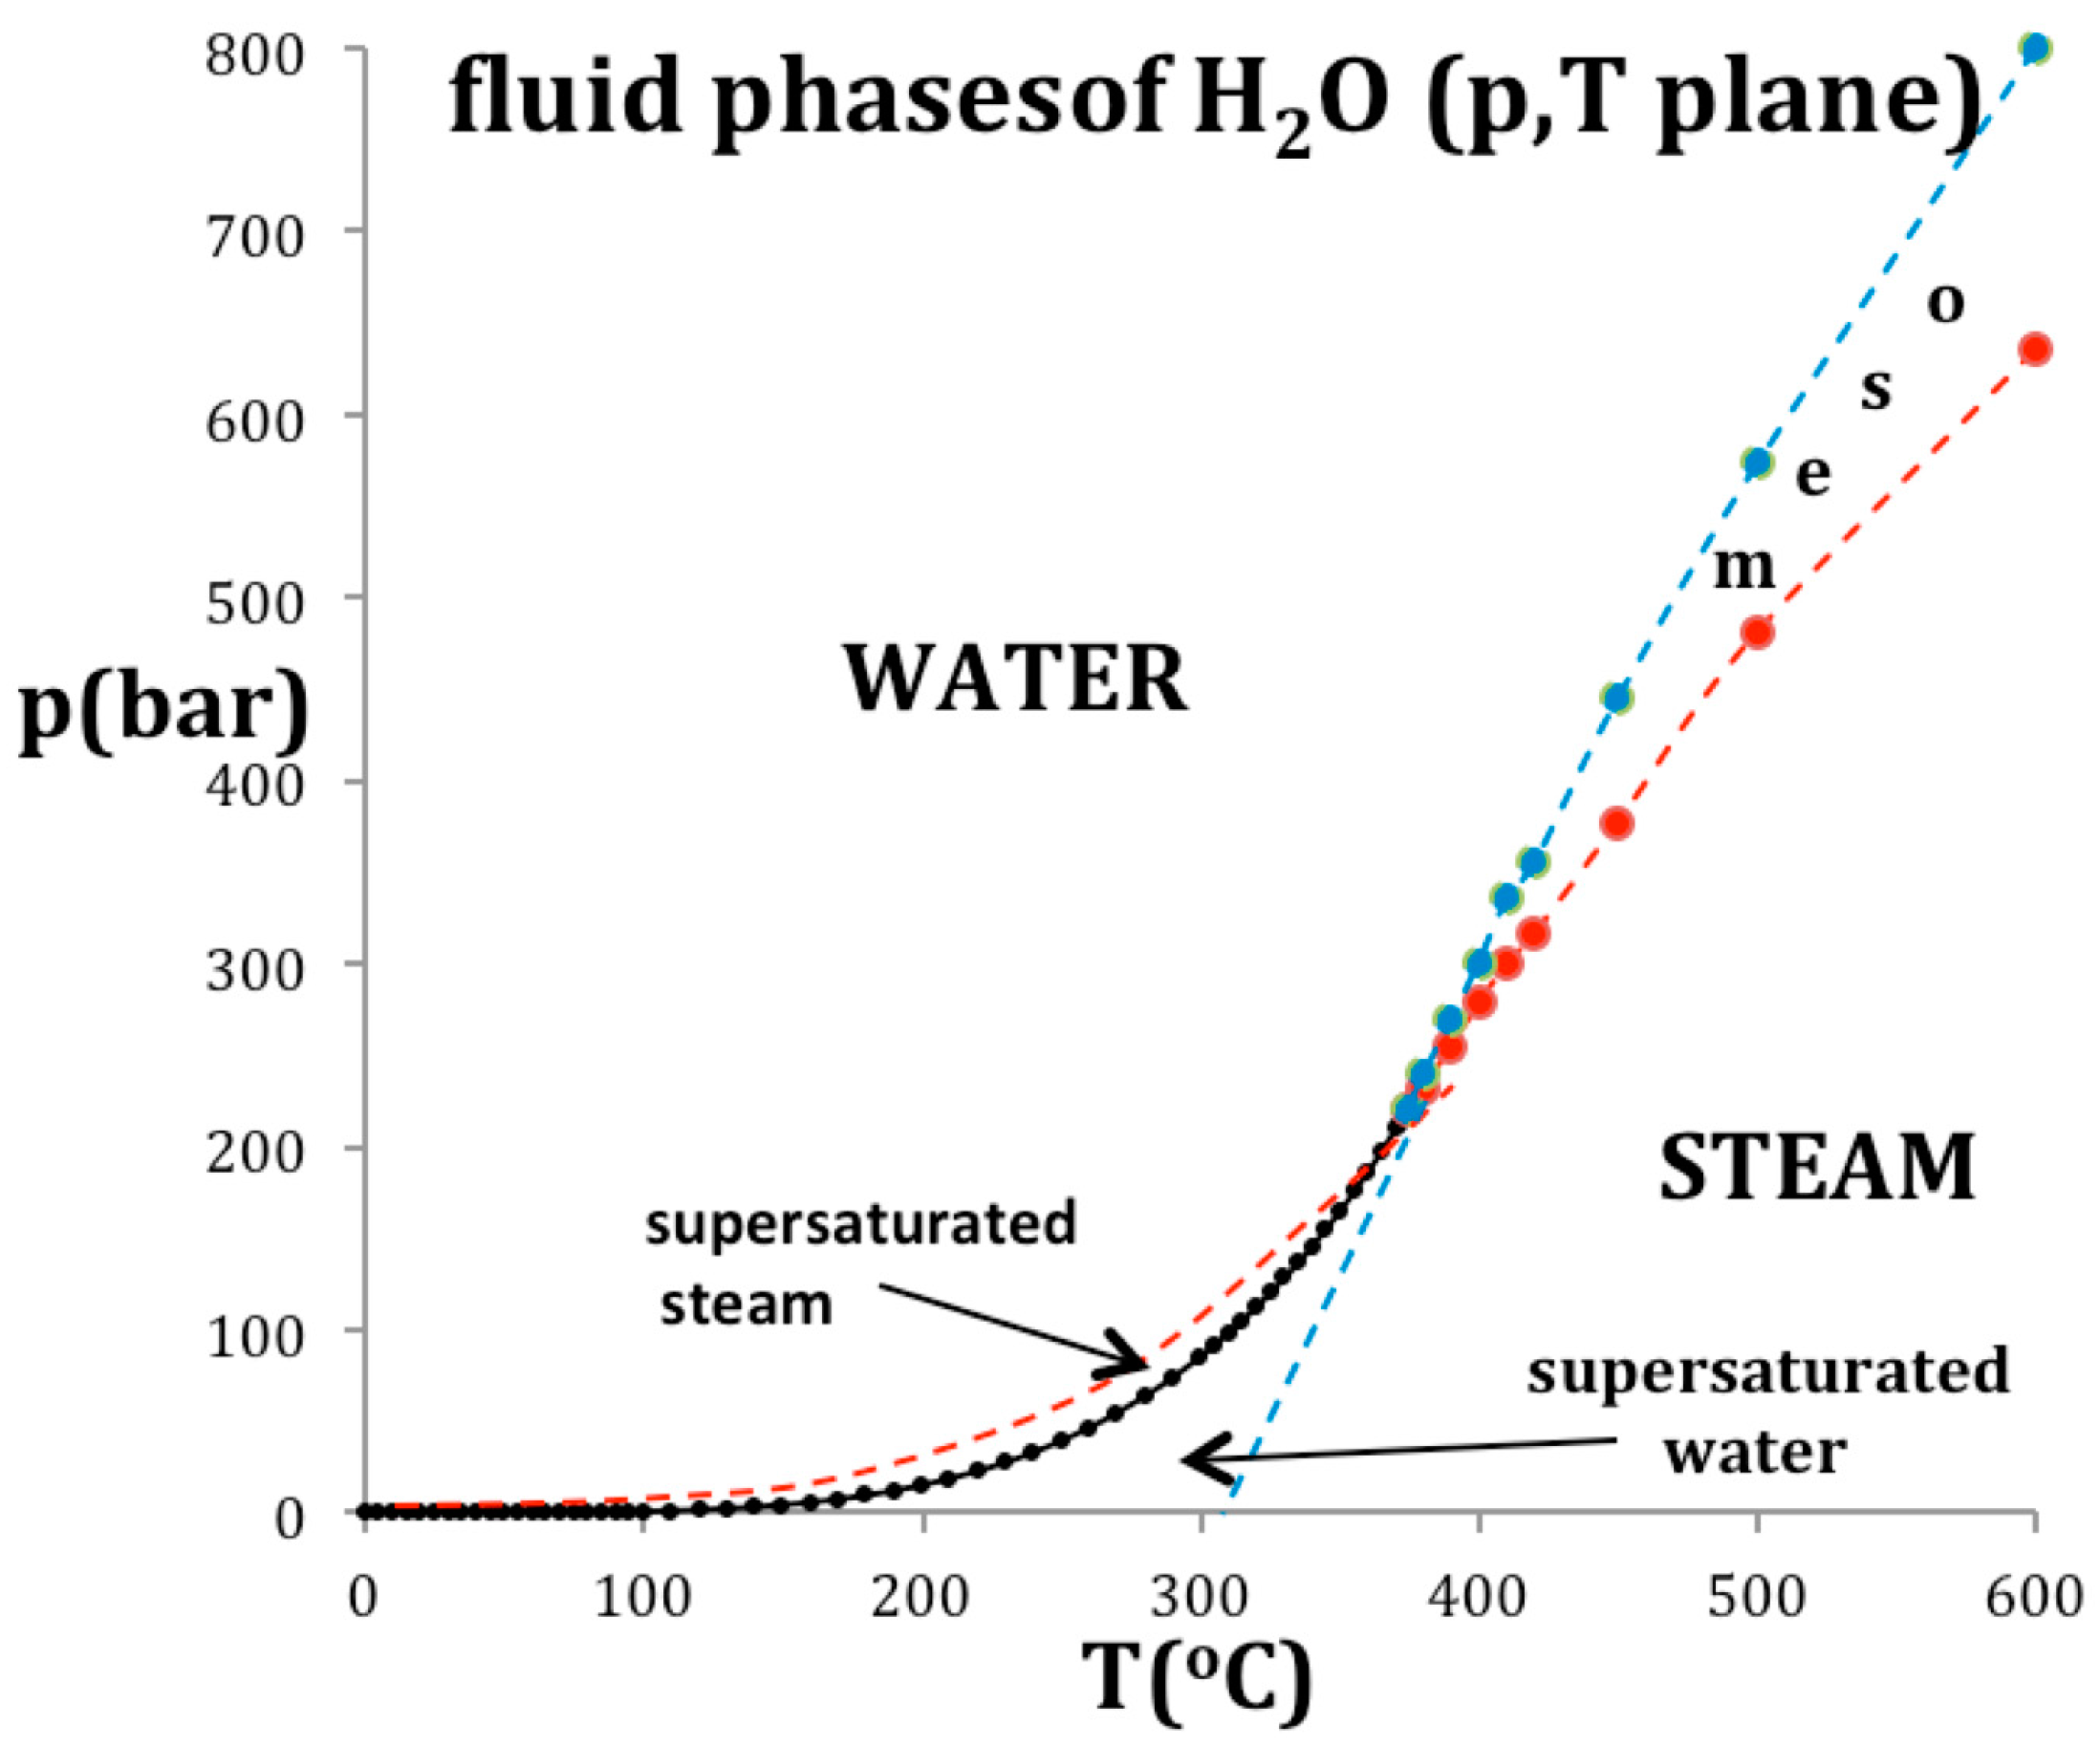
Figure 8.
Rigidity (ω) for steam and water along the critical isotherm from NIST Thermophysical Properties compilation [4]: (a) steam from zero to ρcG at Tc (rigidity = 0); (b) liquid phase from minimum liquid density (ρcL) at pc = 22.05 MPa (ω = 0) to a pressure of 1000 MPa (ω ~ 100 kJ/mol).
Figure 8.
Rigidity (ω) for steam and water along the critical isotherm from NIST Thermophysical Properties compilation [4]: (a) steam from zero to ρcG at Tc (rigidity = 0); (b) liquid phase from minimum liquid density (ρcL) at pc = 22.05 MPa (ω = 0) to a pressure of 1000 MPa (ω ~ 100 kJ/mol).
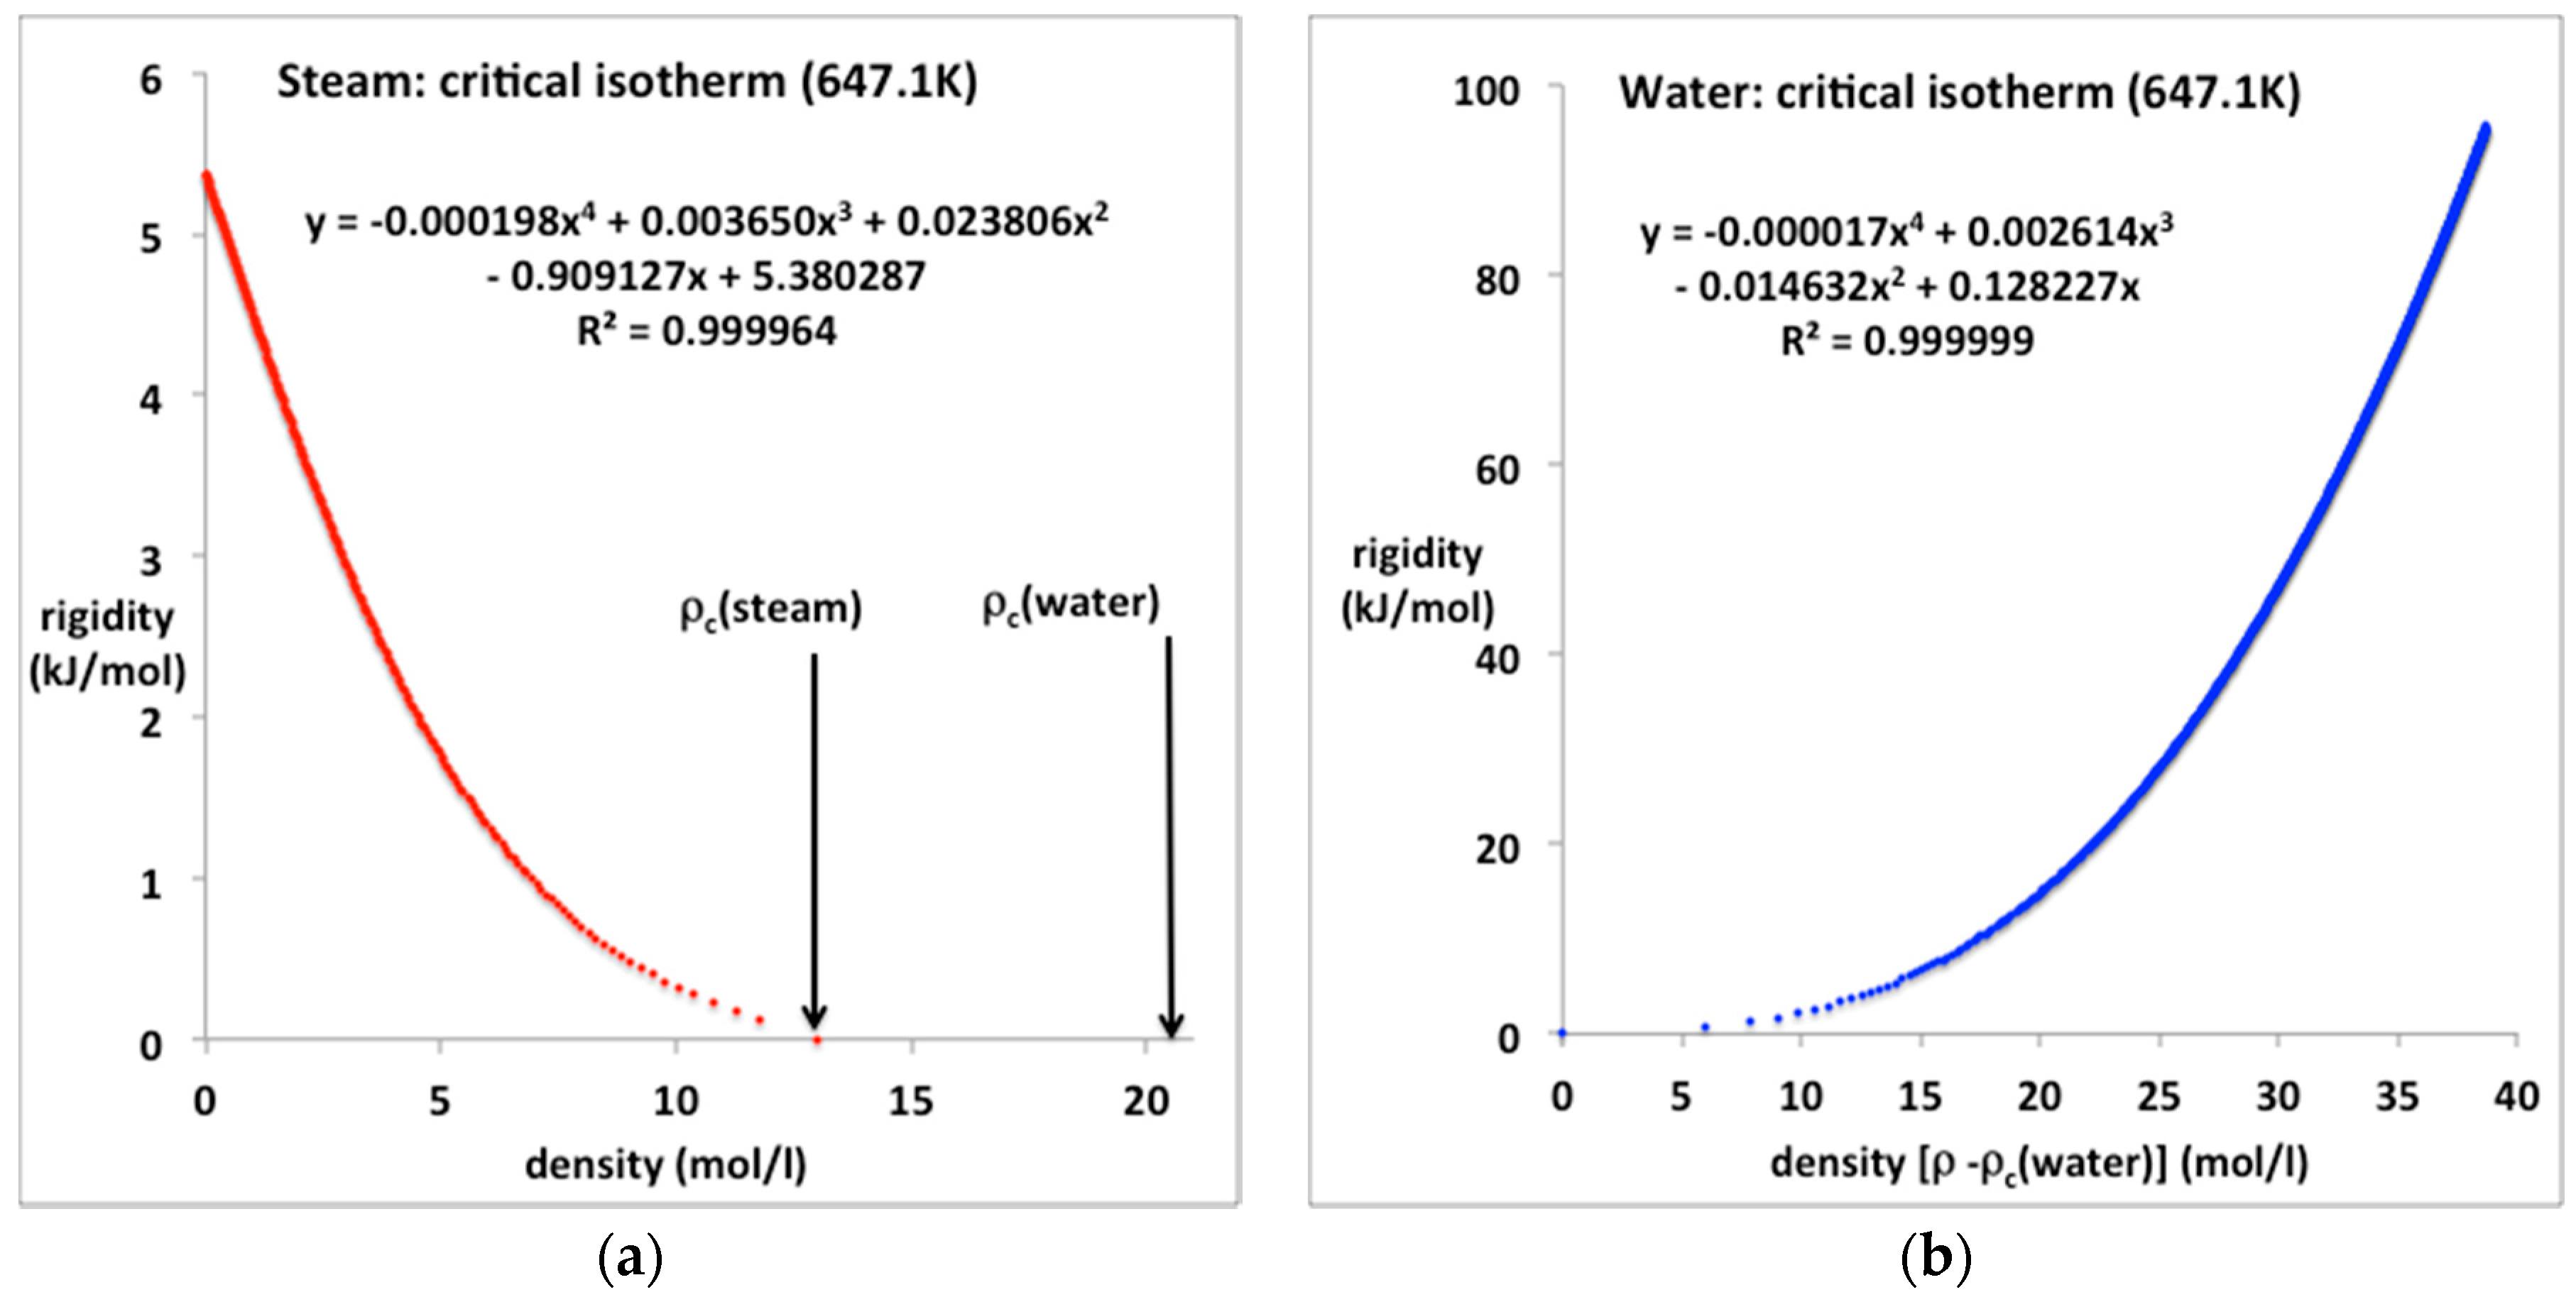
Figure 9.
Rigidity ω(ρ) for argon along the sub-critical isotherm T = 100 K from NIST [4]: (a) gas phase from zero to maximum equilibrium gas coexistence density (0.42 mol/L): (b) liquid phase from minimum liquid equilibrium coexistence density (32.9 mol/L) at the coexistence pressure (MPa) to a pressure of 100 MPa.

Figure 10.
Internal energy U(ρ) for argon along the isotherm (T = 151 K) using data from NIST [4].
Figure 10.
Internal energy U(ρ) for argon along the isotherm (T = 151 K) using data from NIST [4].

Figure 11.
(a) Internal energy isochores, U(T)ρ for argon for a temperature range from near triple point to supercritical from NIST [4] showing an expanded window picture of the near critical isochores to the right. (b) Magnified data in critical region showing a weak discontinuity in (dU/dT)v, i.e., Cv, at Tc but clearly no evidence of logarithmic divergence on either side of Tc.

Figure 12.
(a) Internal energy isochores, U(T)ρ for SF6 for a temperature range from near triple point to supercritical from NIST Thermophysical Properties compilation [4]; (b) Isochoric heat capacities calculated from the equations in Figure 1a, i.e., (dU/dT)ρ alongside the original space shuttle heat capacity data points.


Table 1.
Argon virial coefficients.
| T (K) | b2 (10−3 mol/L) | b3 (10−6 mol2/L2) | b4 (10−9 mol3/L3) |
|---|---|---|---|
| 700 | 14.91 | 0.8191 | 0.0063 |
| 600 | 11.45 | 0.9029 | 0.0013 |
| 500 | 6.130 | 1.0523 | −0.0082 |
| 414 (~TB) | 0.0081 | 1.3085 | −0.0248 |
| 151 (~Tc) | −86.02 | 2.48 | 0 |
| 100 | −183.2 | 0 |
© 2018 by the author. Licensee MDPI, Basel, Switzerland. This article is an open access article distributed under the terms and conditions of the Creative Commons Attribution (CC BY) license (http://creativecommons.org/licenses/by/4.0/).
Share and Cite
MDPI and ACS Style
Woodcock, L.V. Thermodynamic Fluid Equations-of-State. Entropy 2018, 20, 22. https://doi.org/10.3390/e20010022
AMA Style
Woodcock LV. Thermodynamic Fluid Equations-of-State. Entropy. 2018; 20(1):22. https://doi.org/10.3390/e20010022
Chicago/Turabian StyleWoodcock, Leslie V. 2018. "Thermodynamic Fluid Equations-of-State" Entropy 20, no. 1: 22. https://doi.org/10.3390/e20010022
Note that from the first issue of 2016, this journal uses article numbers instead of page numbers. See further details here.