Traction Inverter Open Switch Fault Diagnosis Based on Choi–Williams Distribution Spectral Kurtosis and Wavelet-Packet Energy Shannon Entropy


Abstract
:1. Introduction
2. Spectral Kurtosis Based on CWD and Wavelet-Packet Energy Shannon Entropy
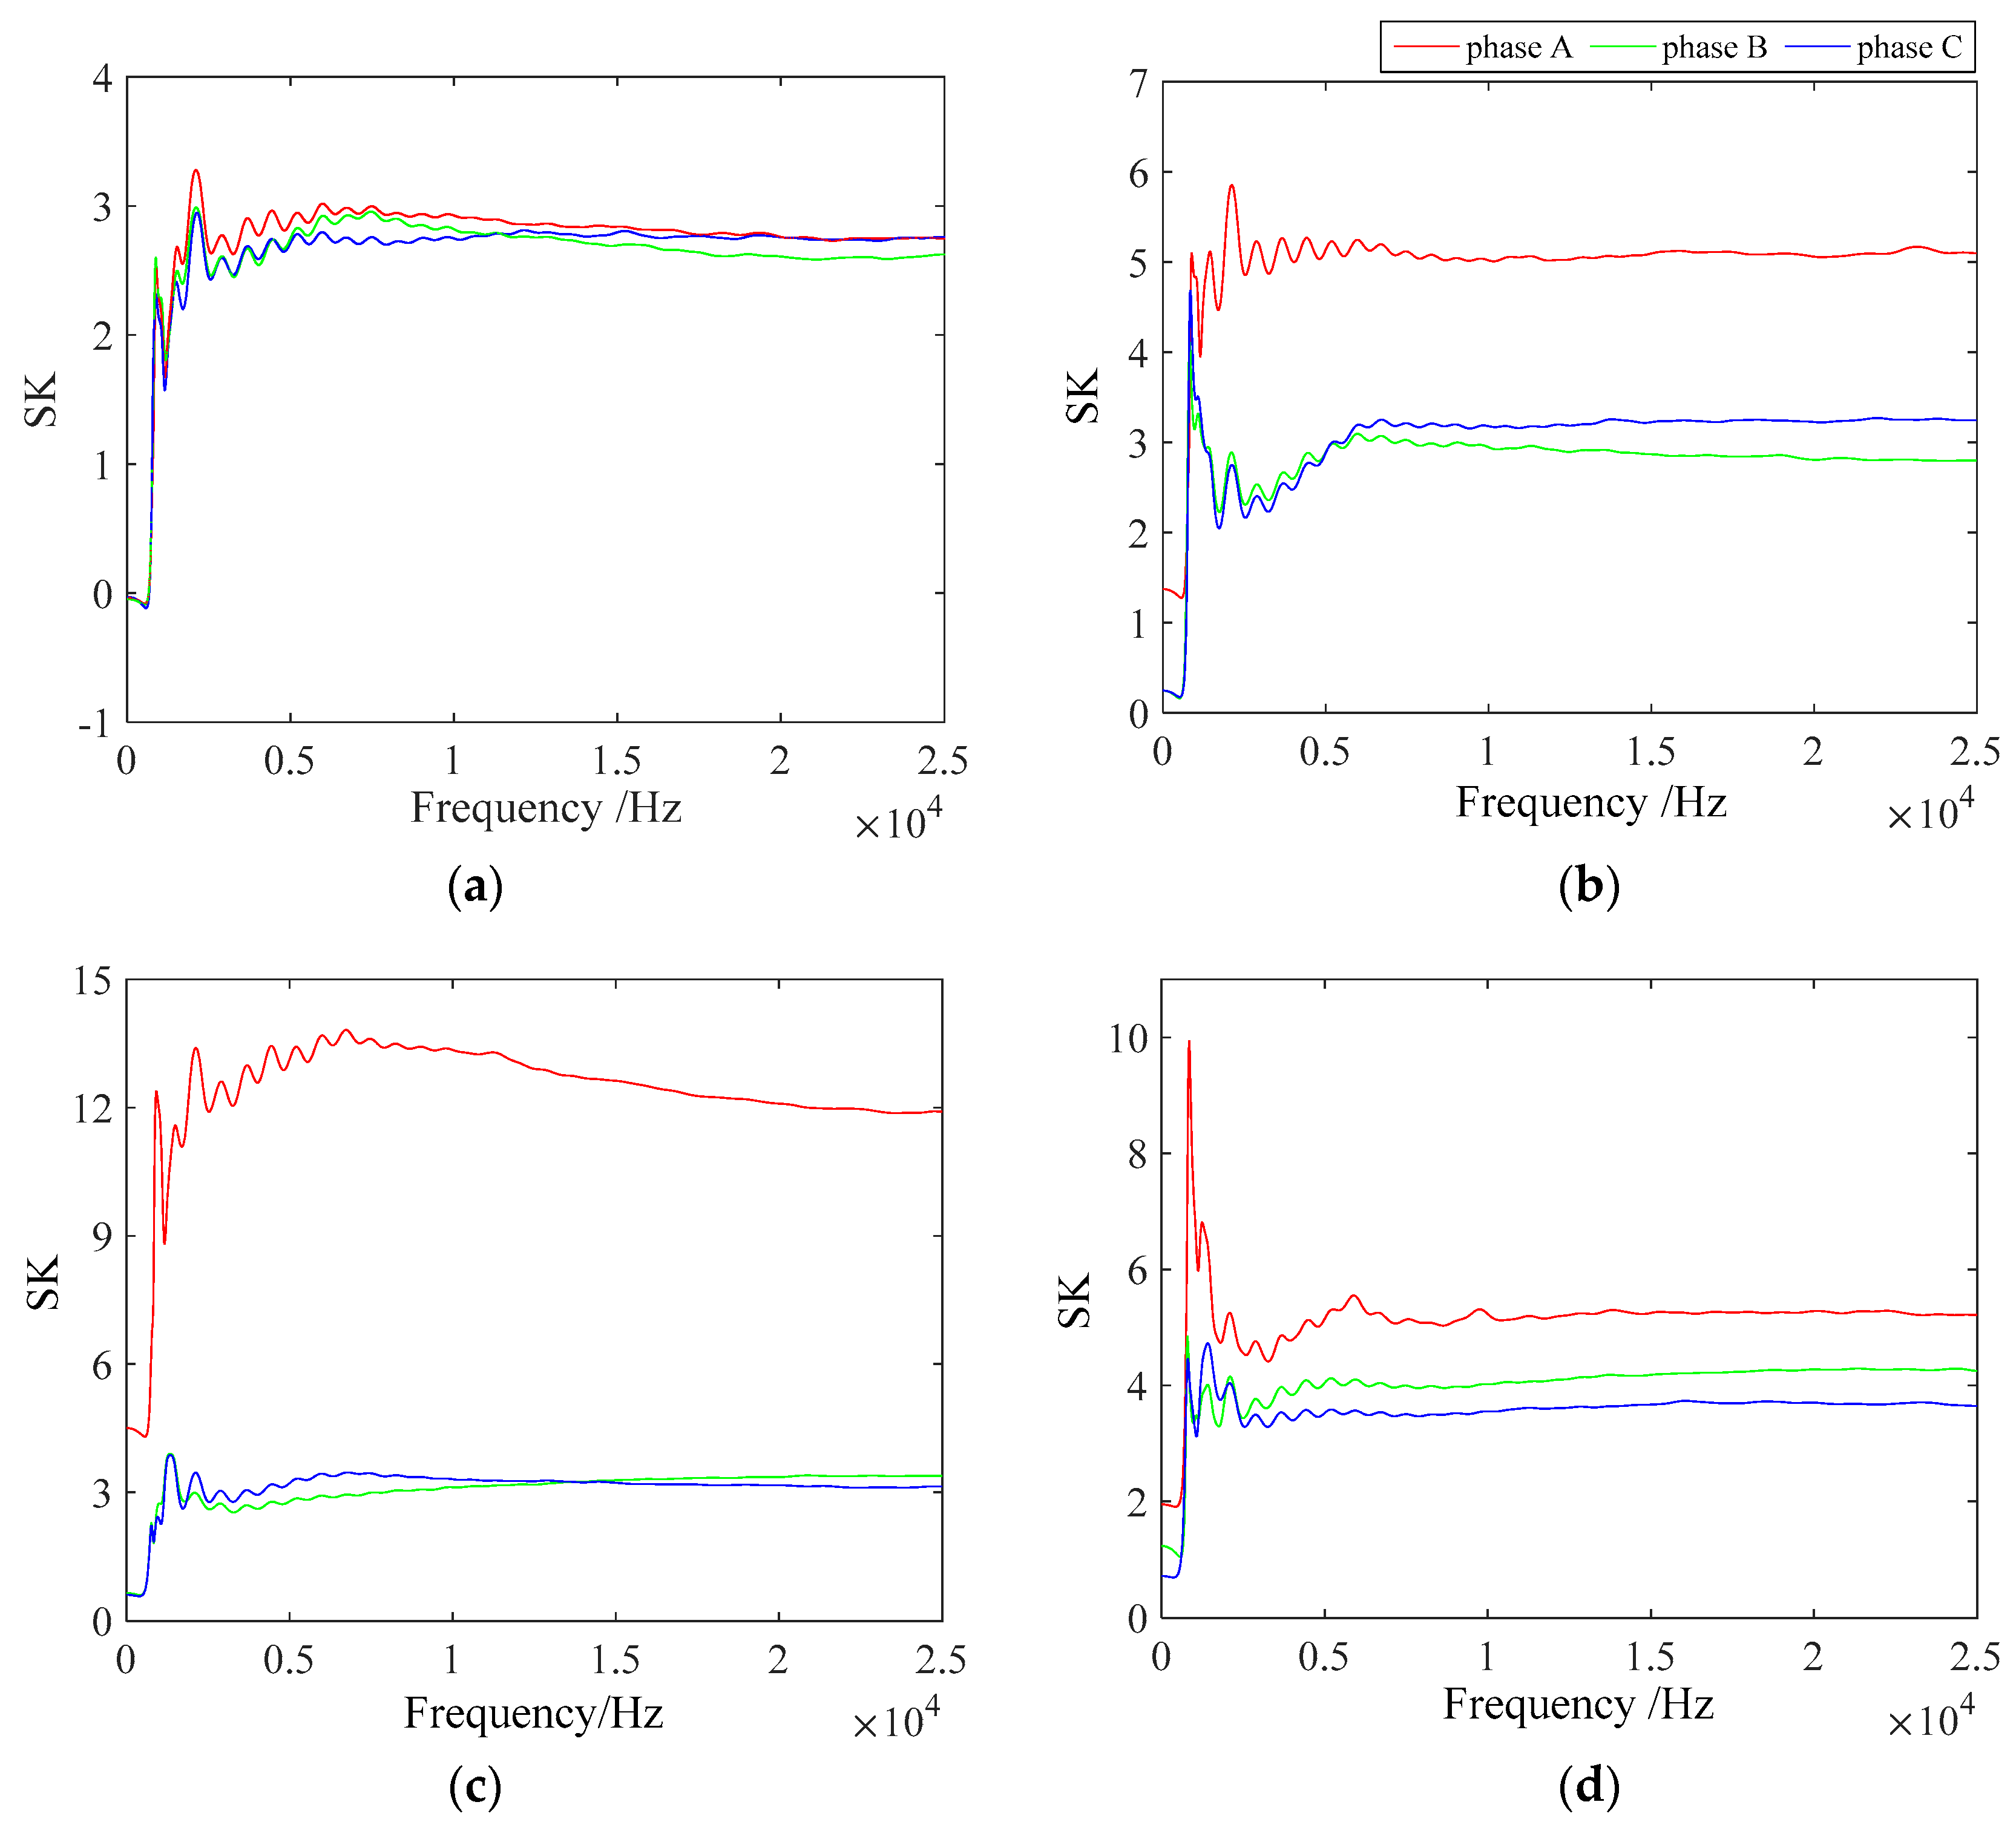
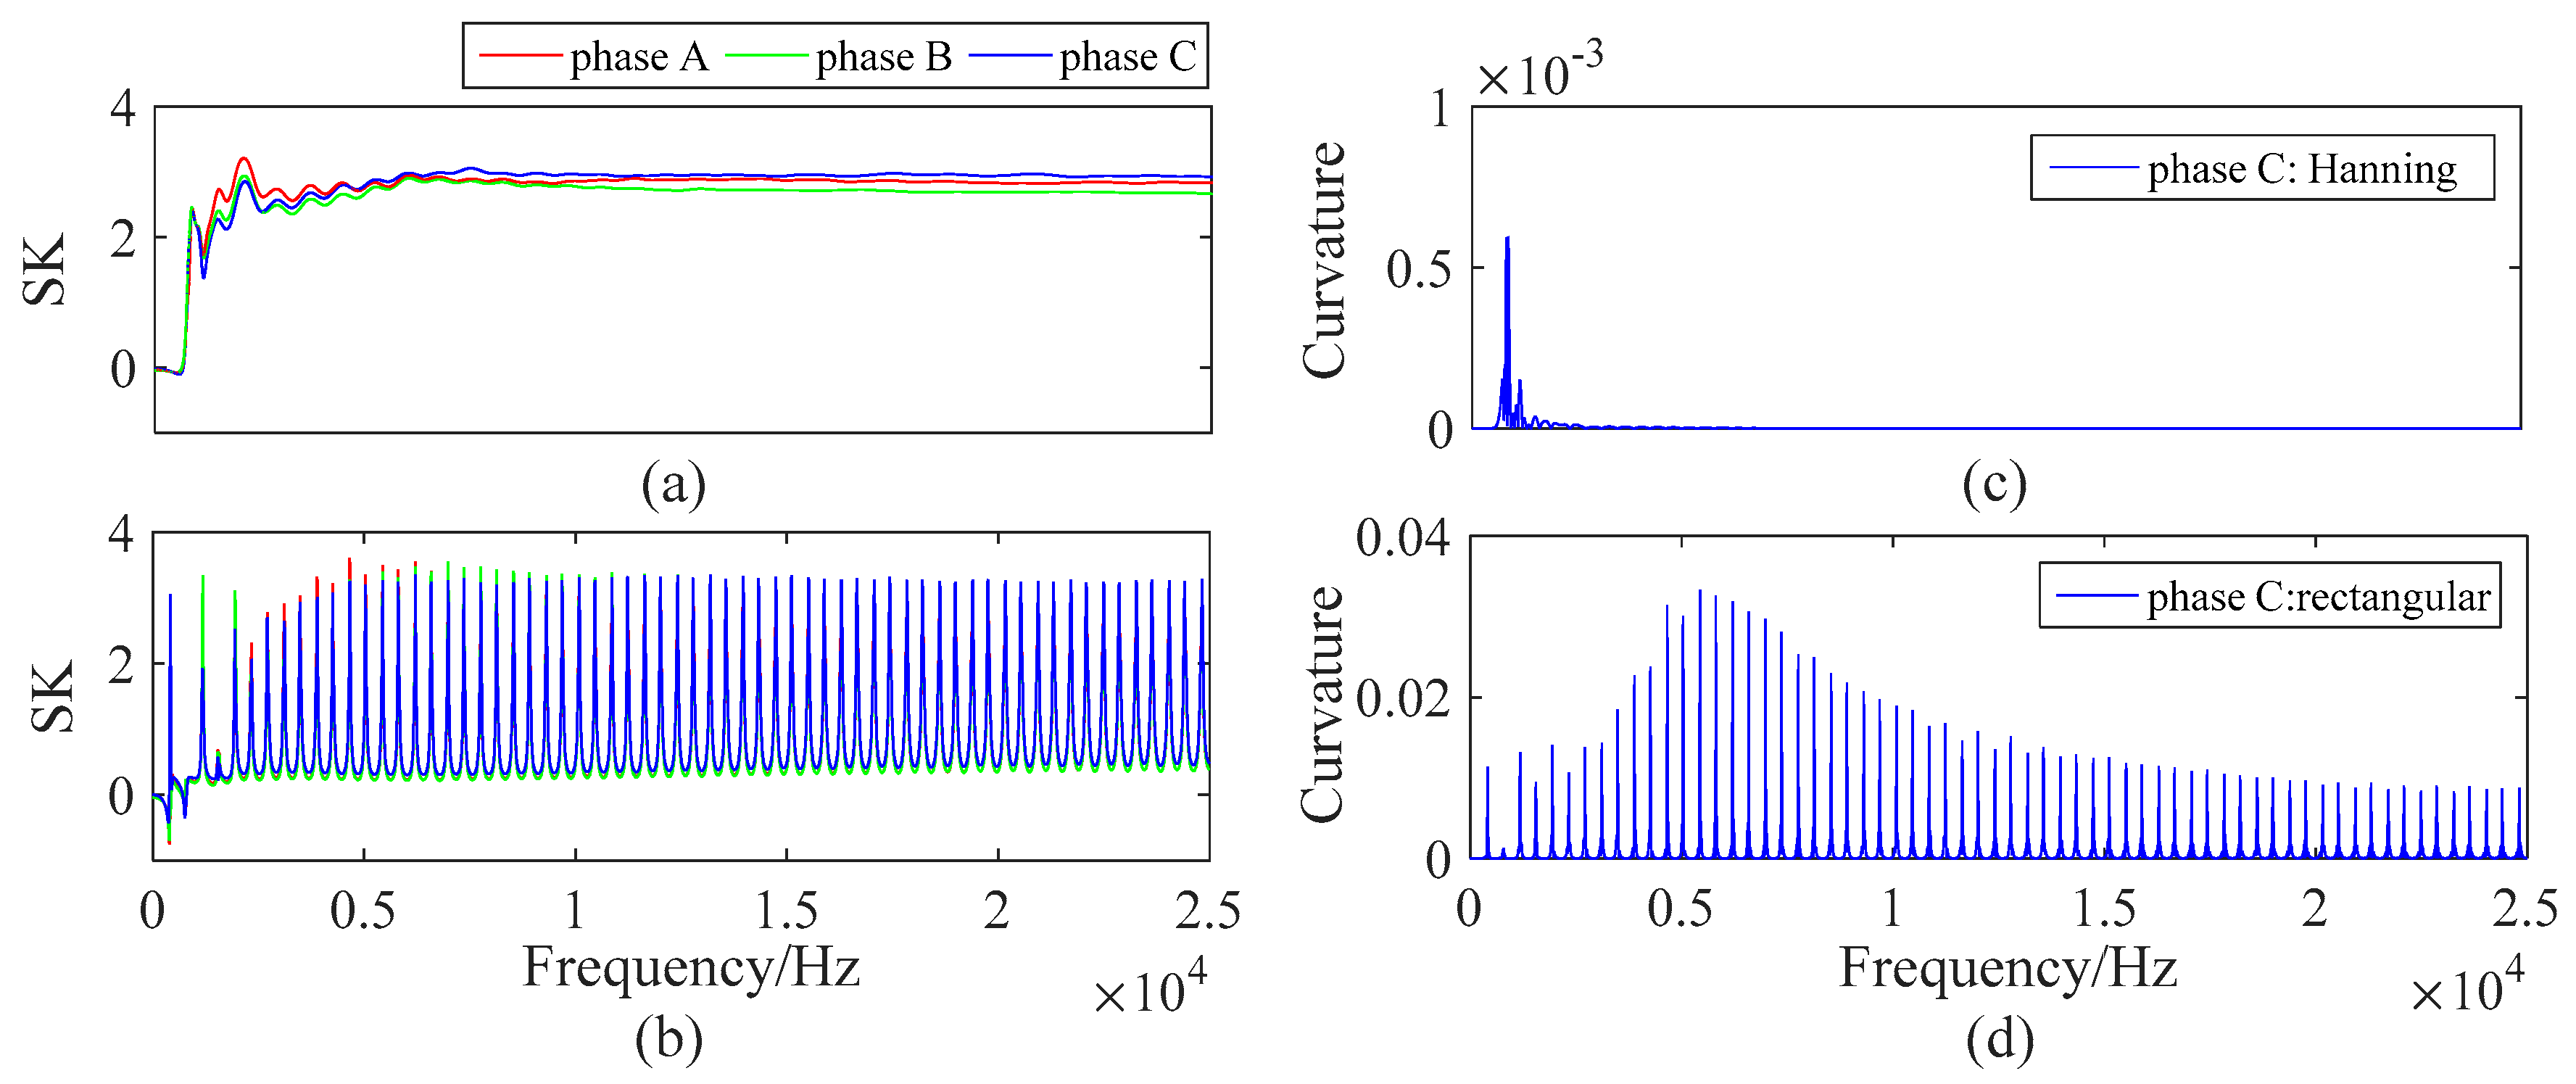
2.1. Spectral Kurtosis Based on Choi–Williams Distribution
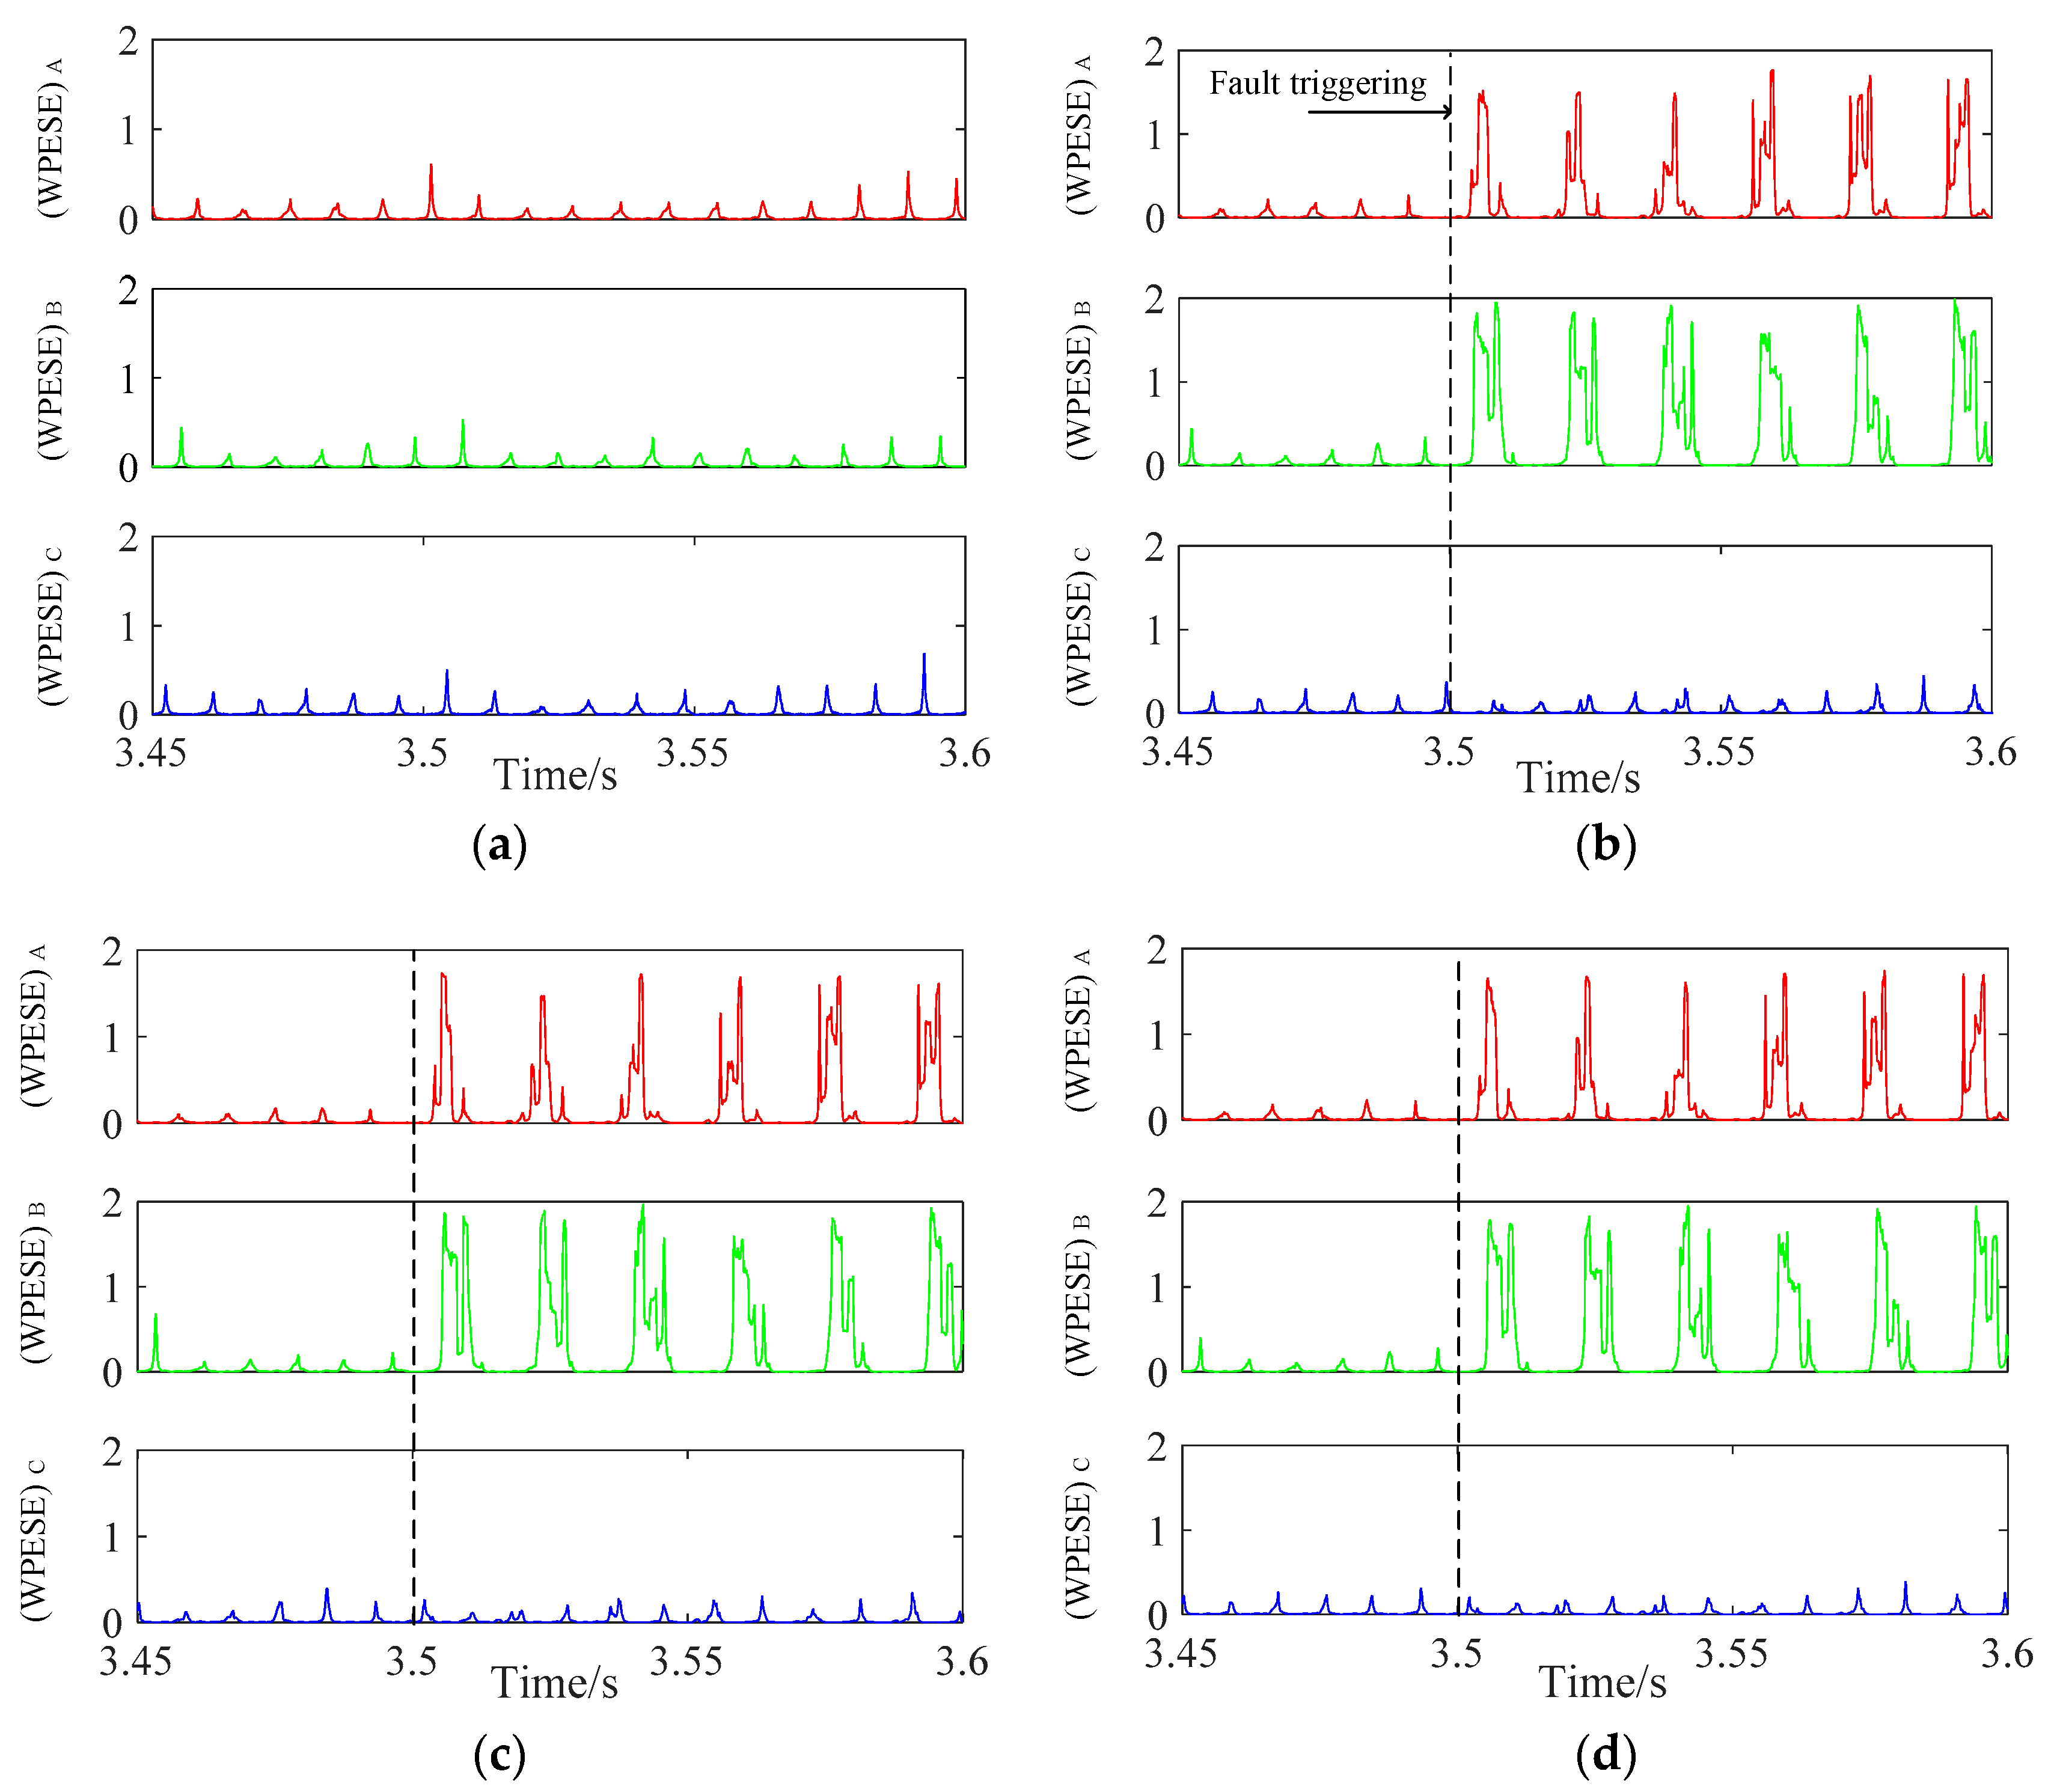
2.2. Wavelet-Packet Energy Shannon Entropy
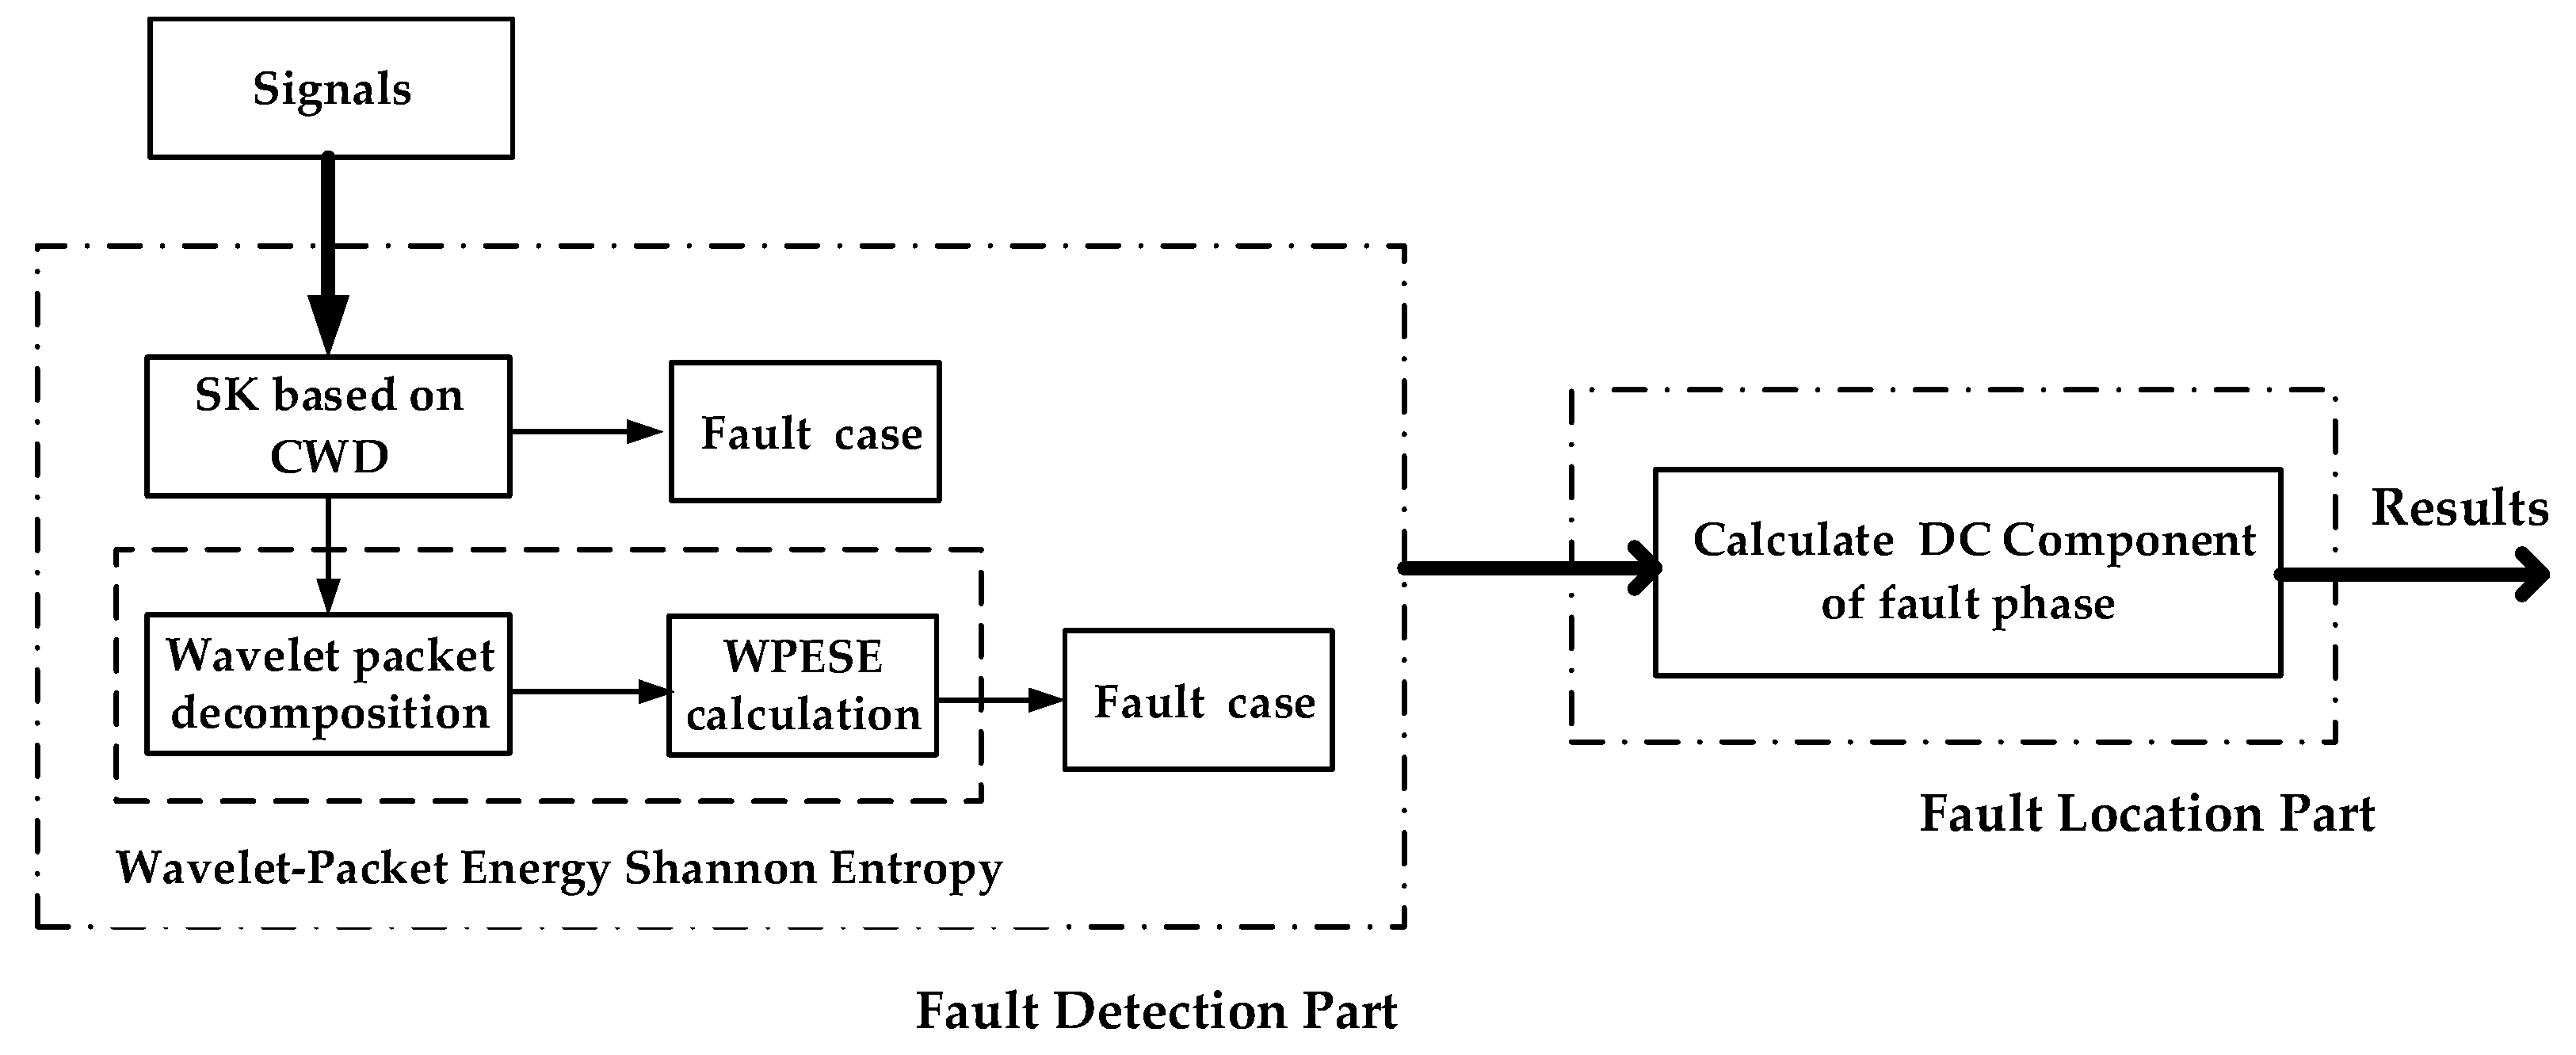
3. Diagnosis Plan
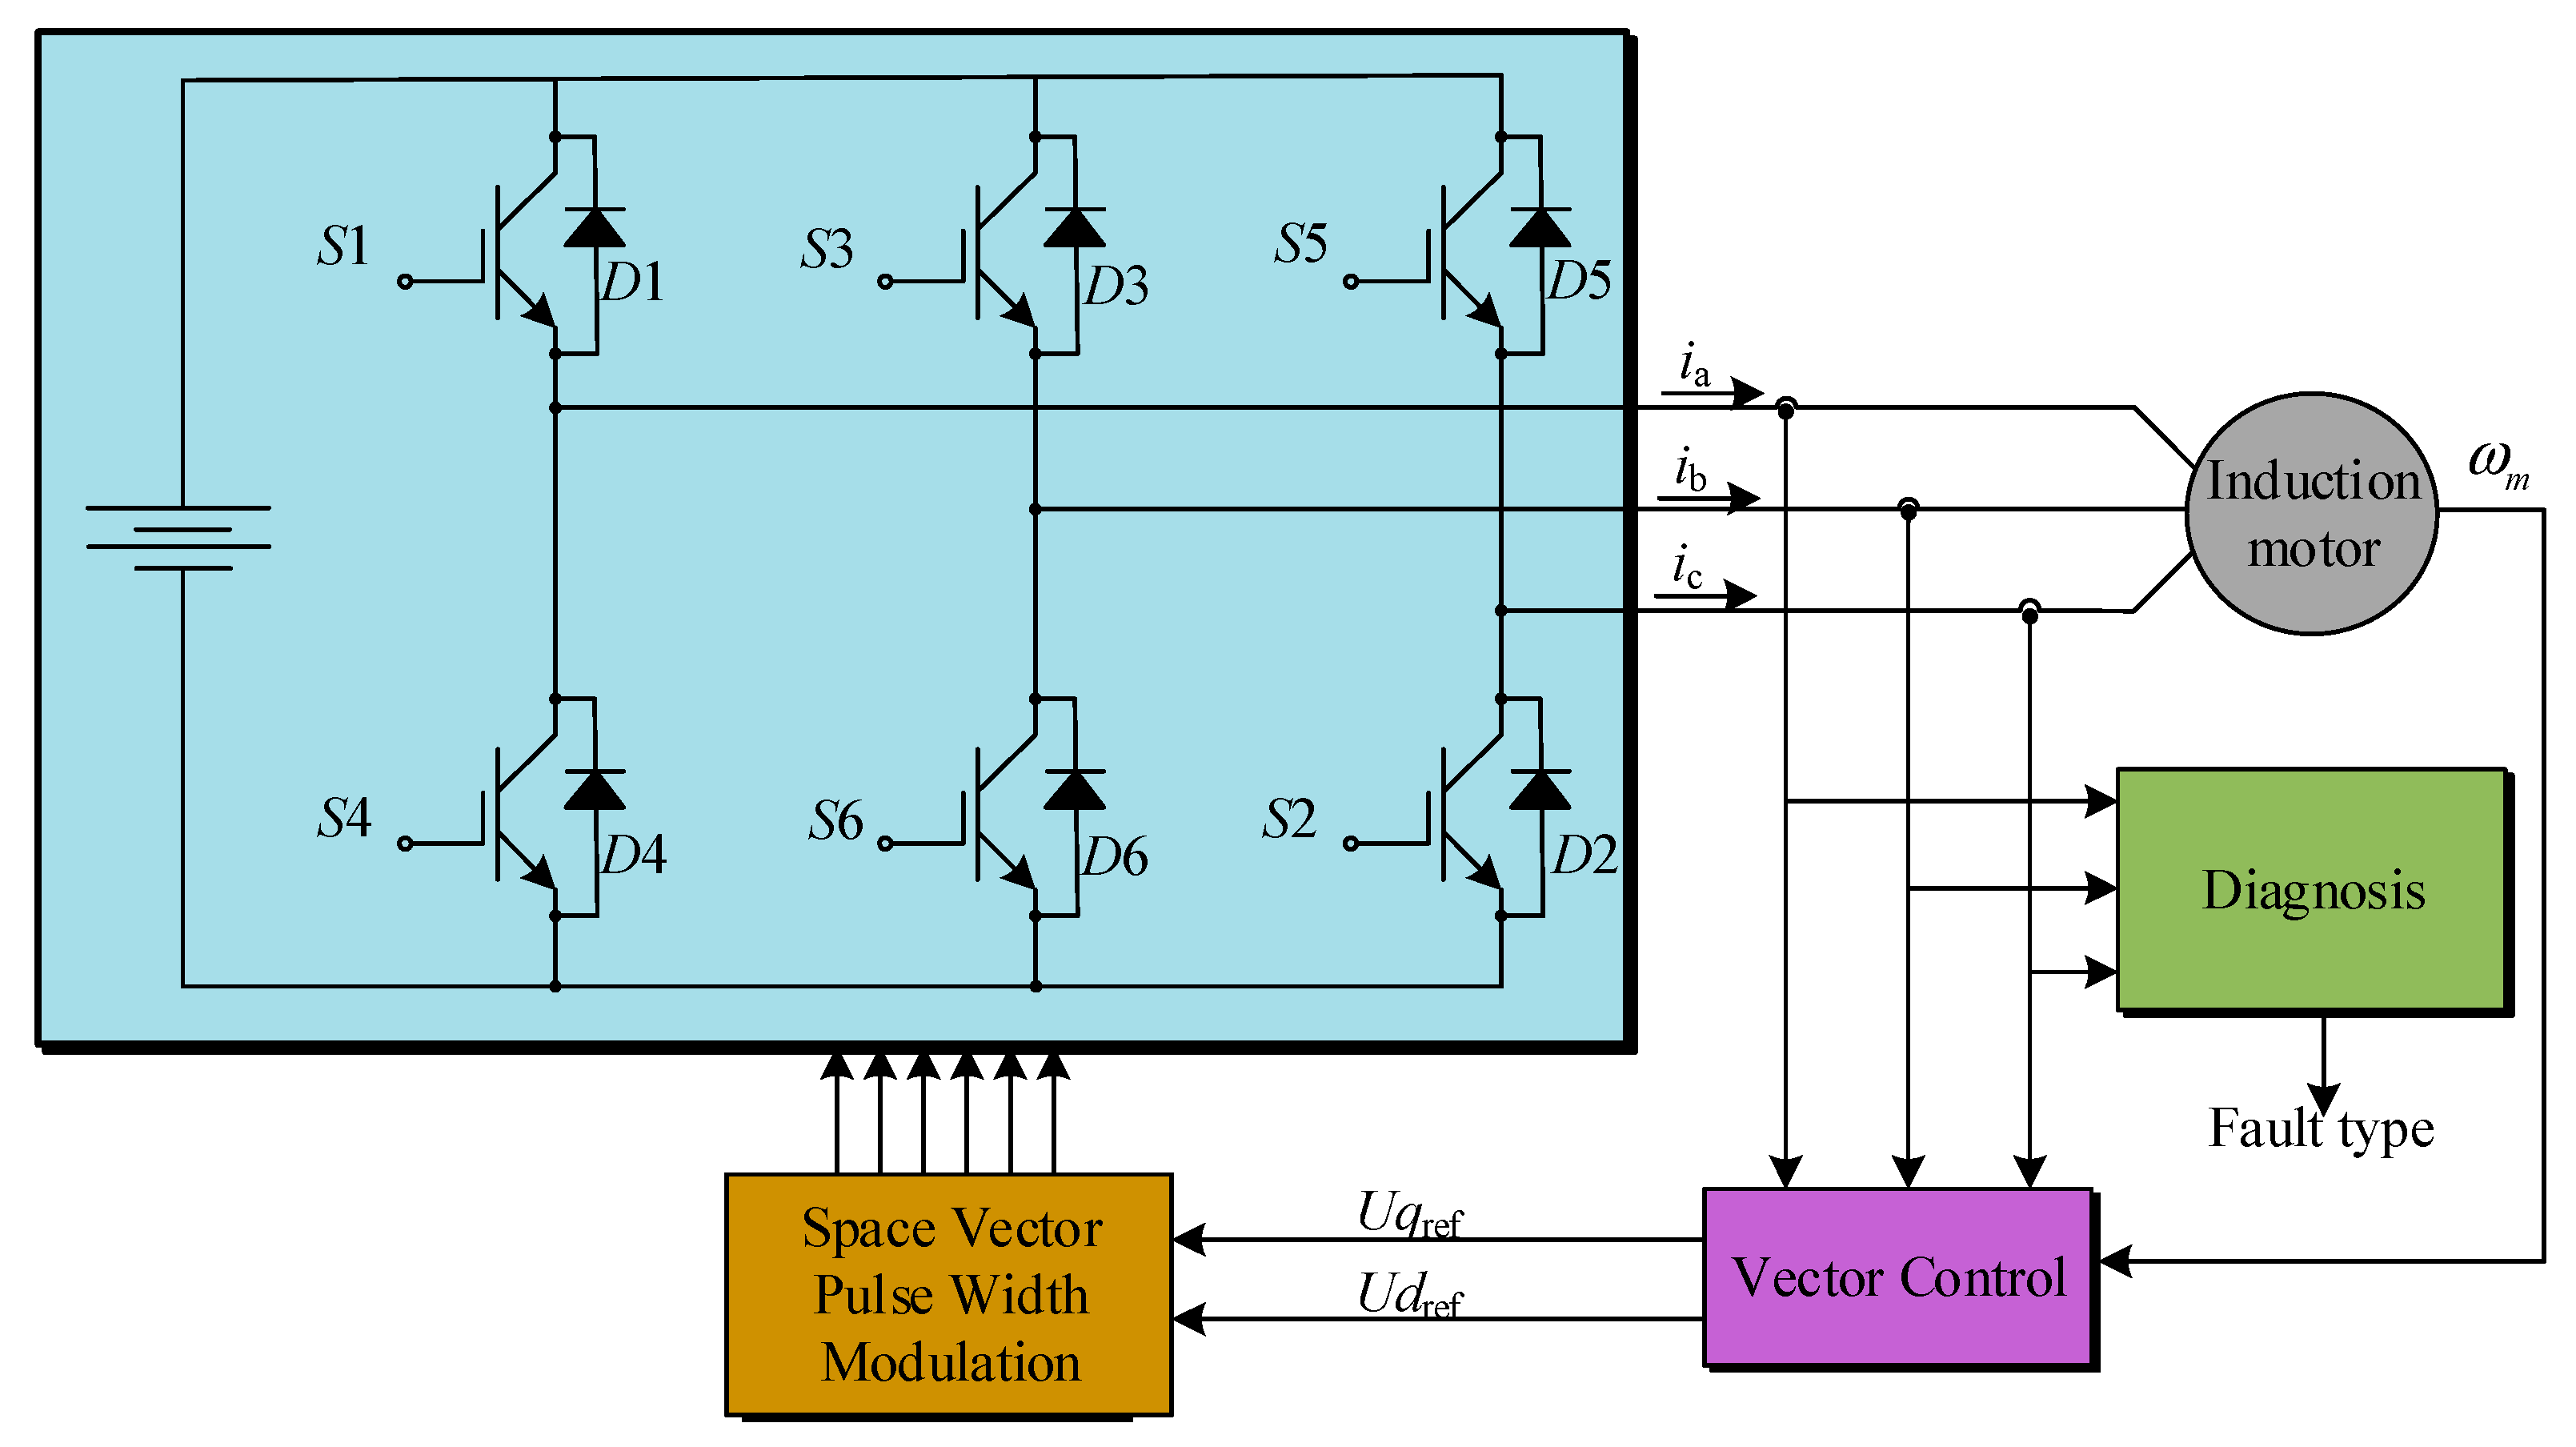
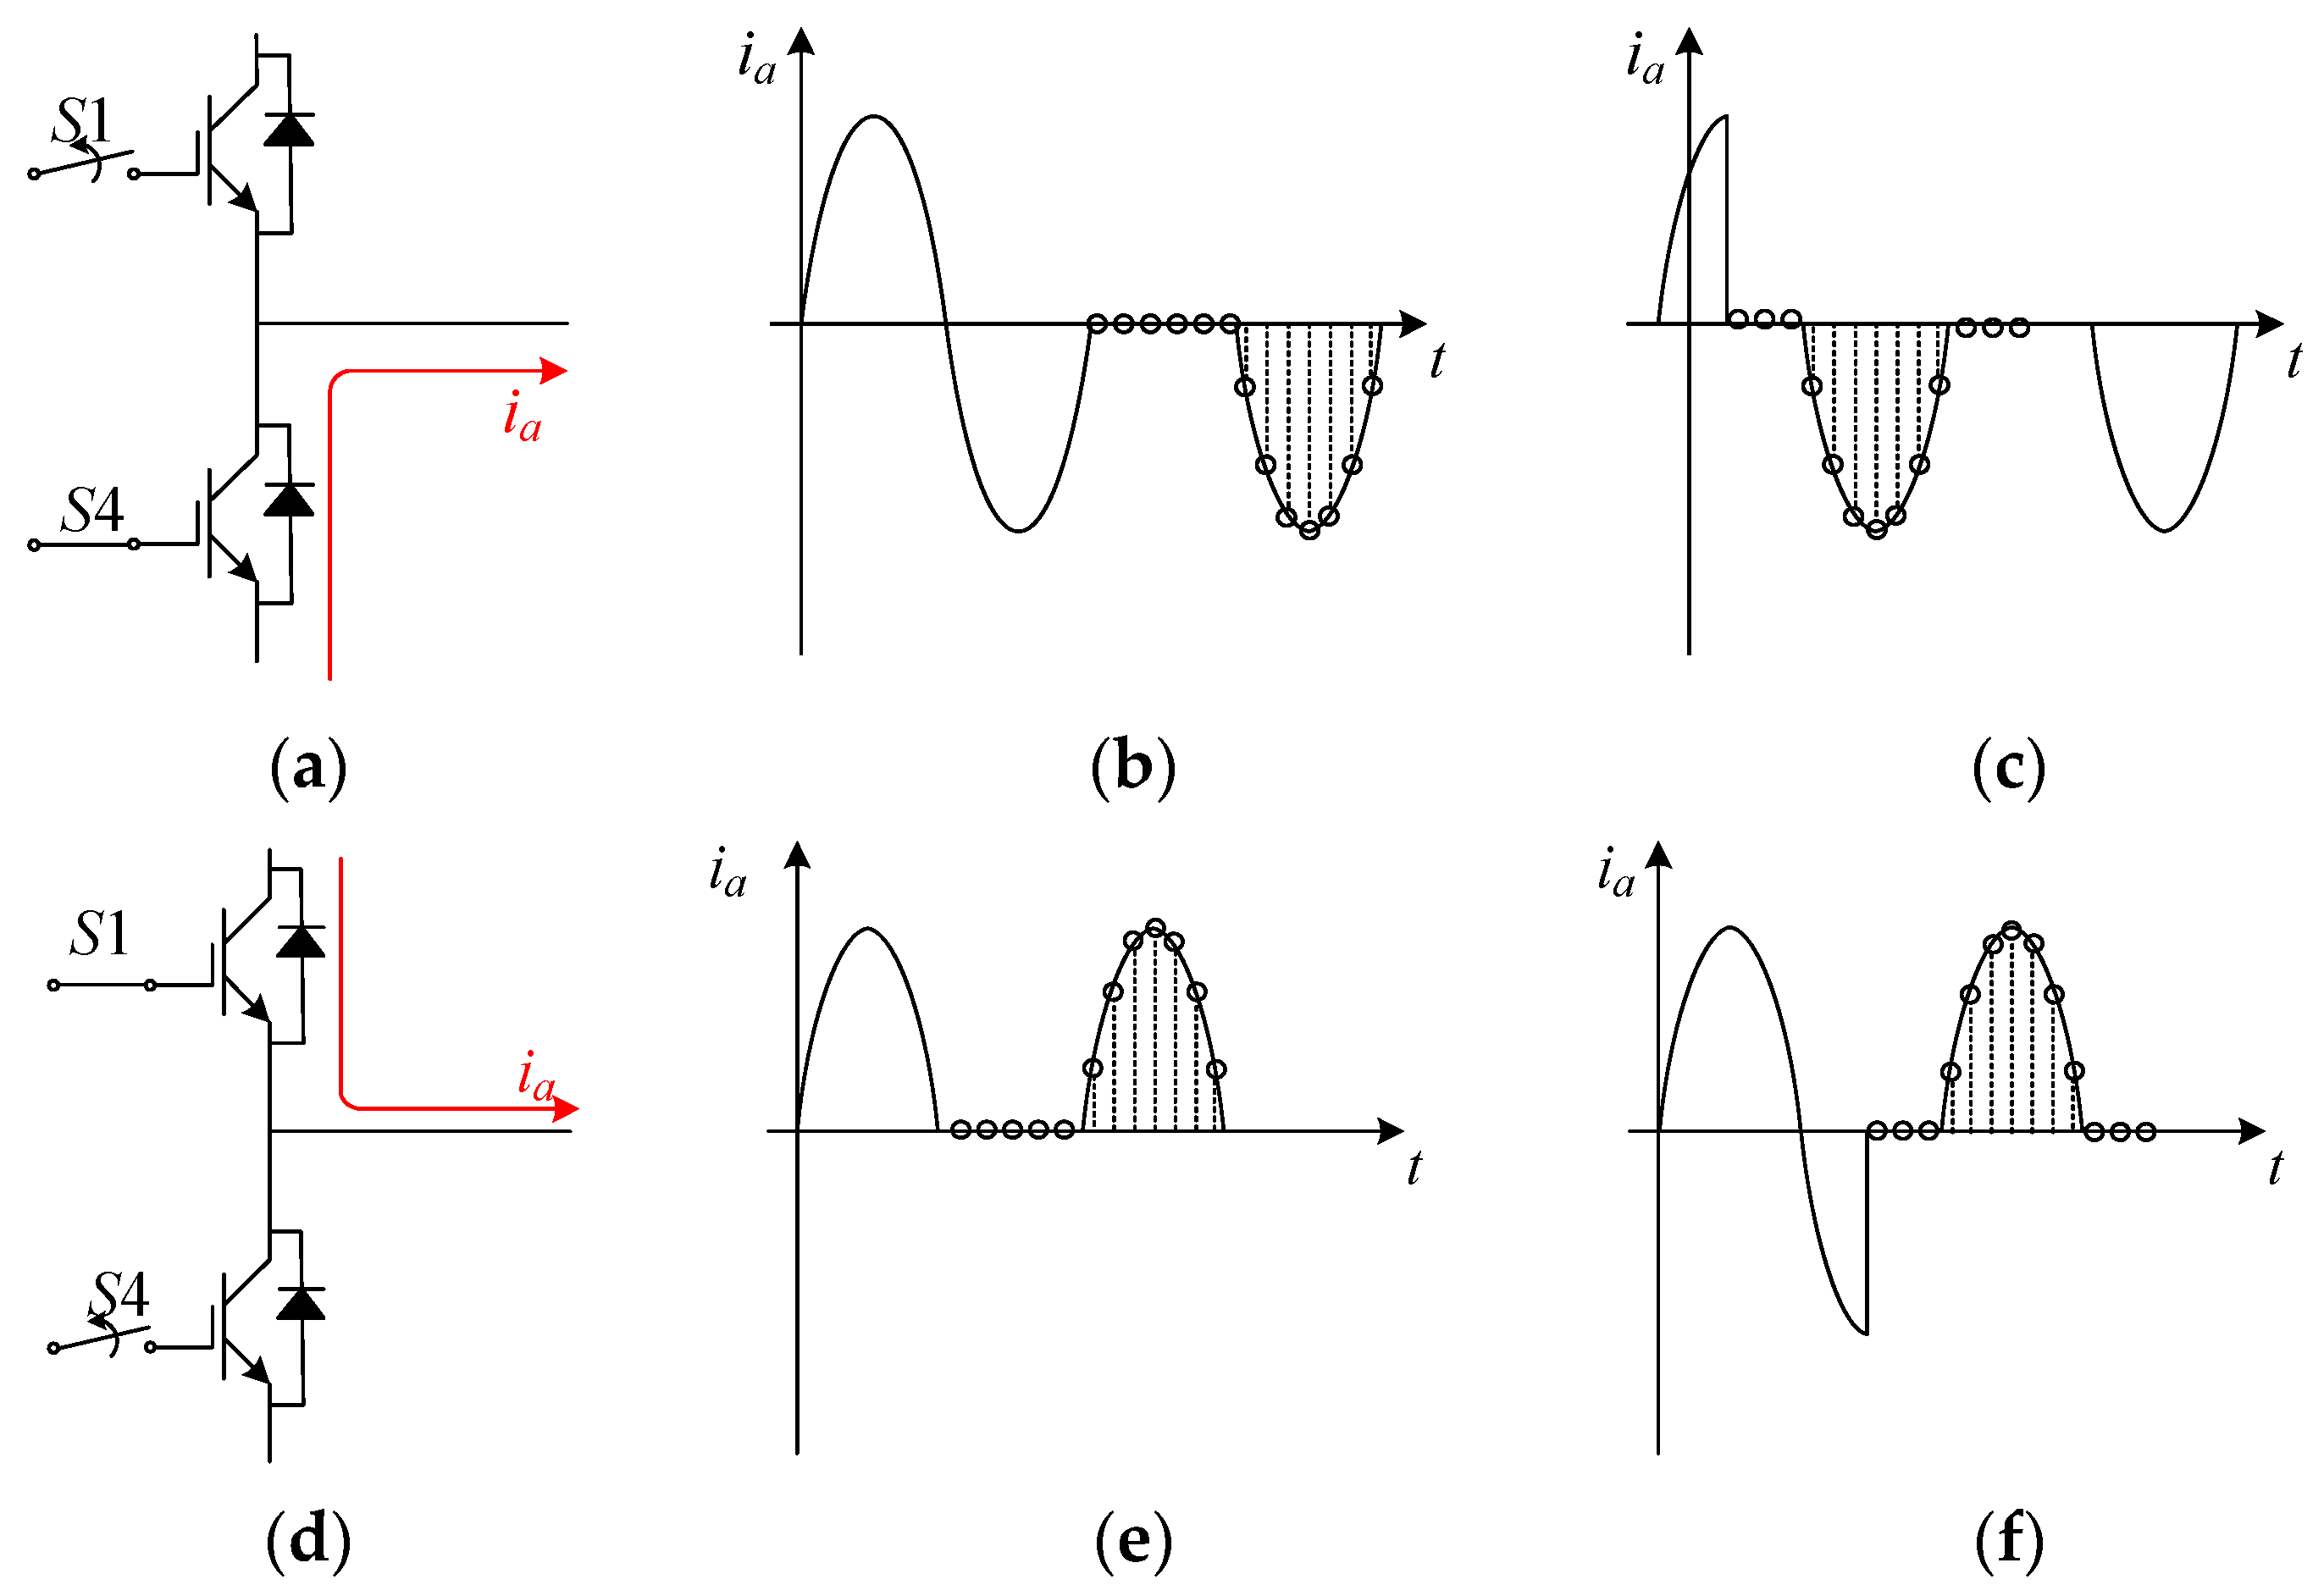
3.1. Analyses of Faults and Diagnosis Plan
- (a)
- Fault A case: Only an IGBT has a fault, such as S1;
- (b)
- Fault B case: Two IGBTs located on the different side of the half bridge arm have faults simultaneously, such as S1, S6;
- (c)
- Fault C case: Two IGBTs in the single phase have faults simultaneously, such as S1, S4;
- (d)
- Fault D case: Two IGBTs located on the same side of the half bridge arm have faults simultaneously, such as S1, S3.
3.2. Feature Extraction
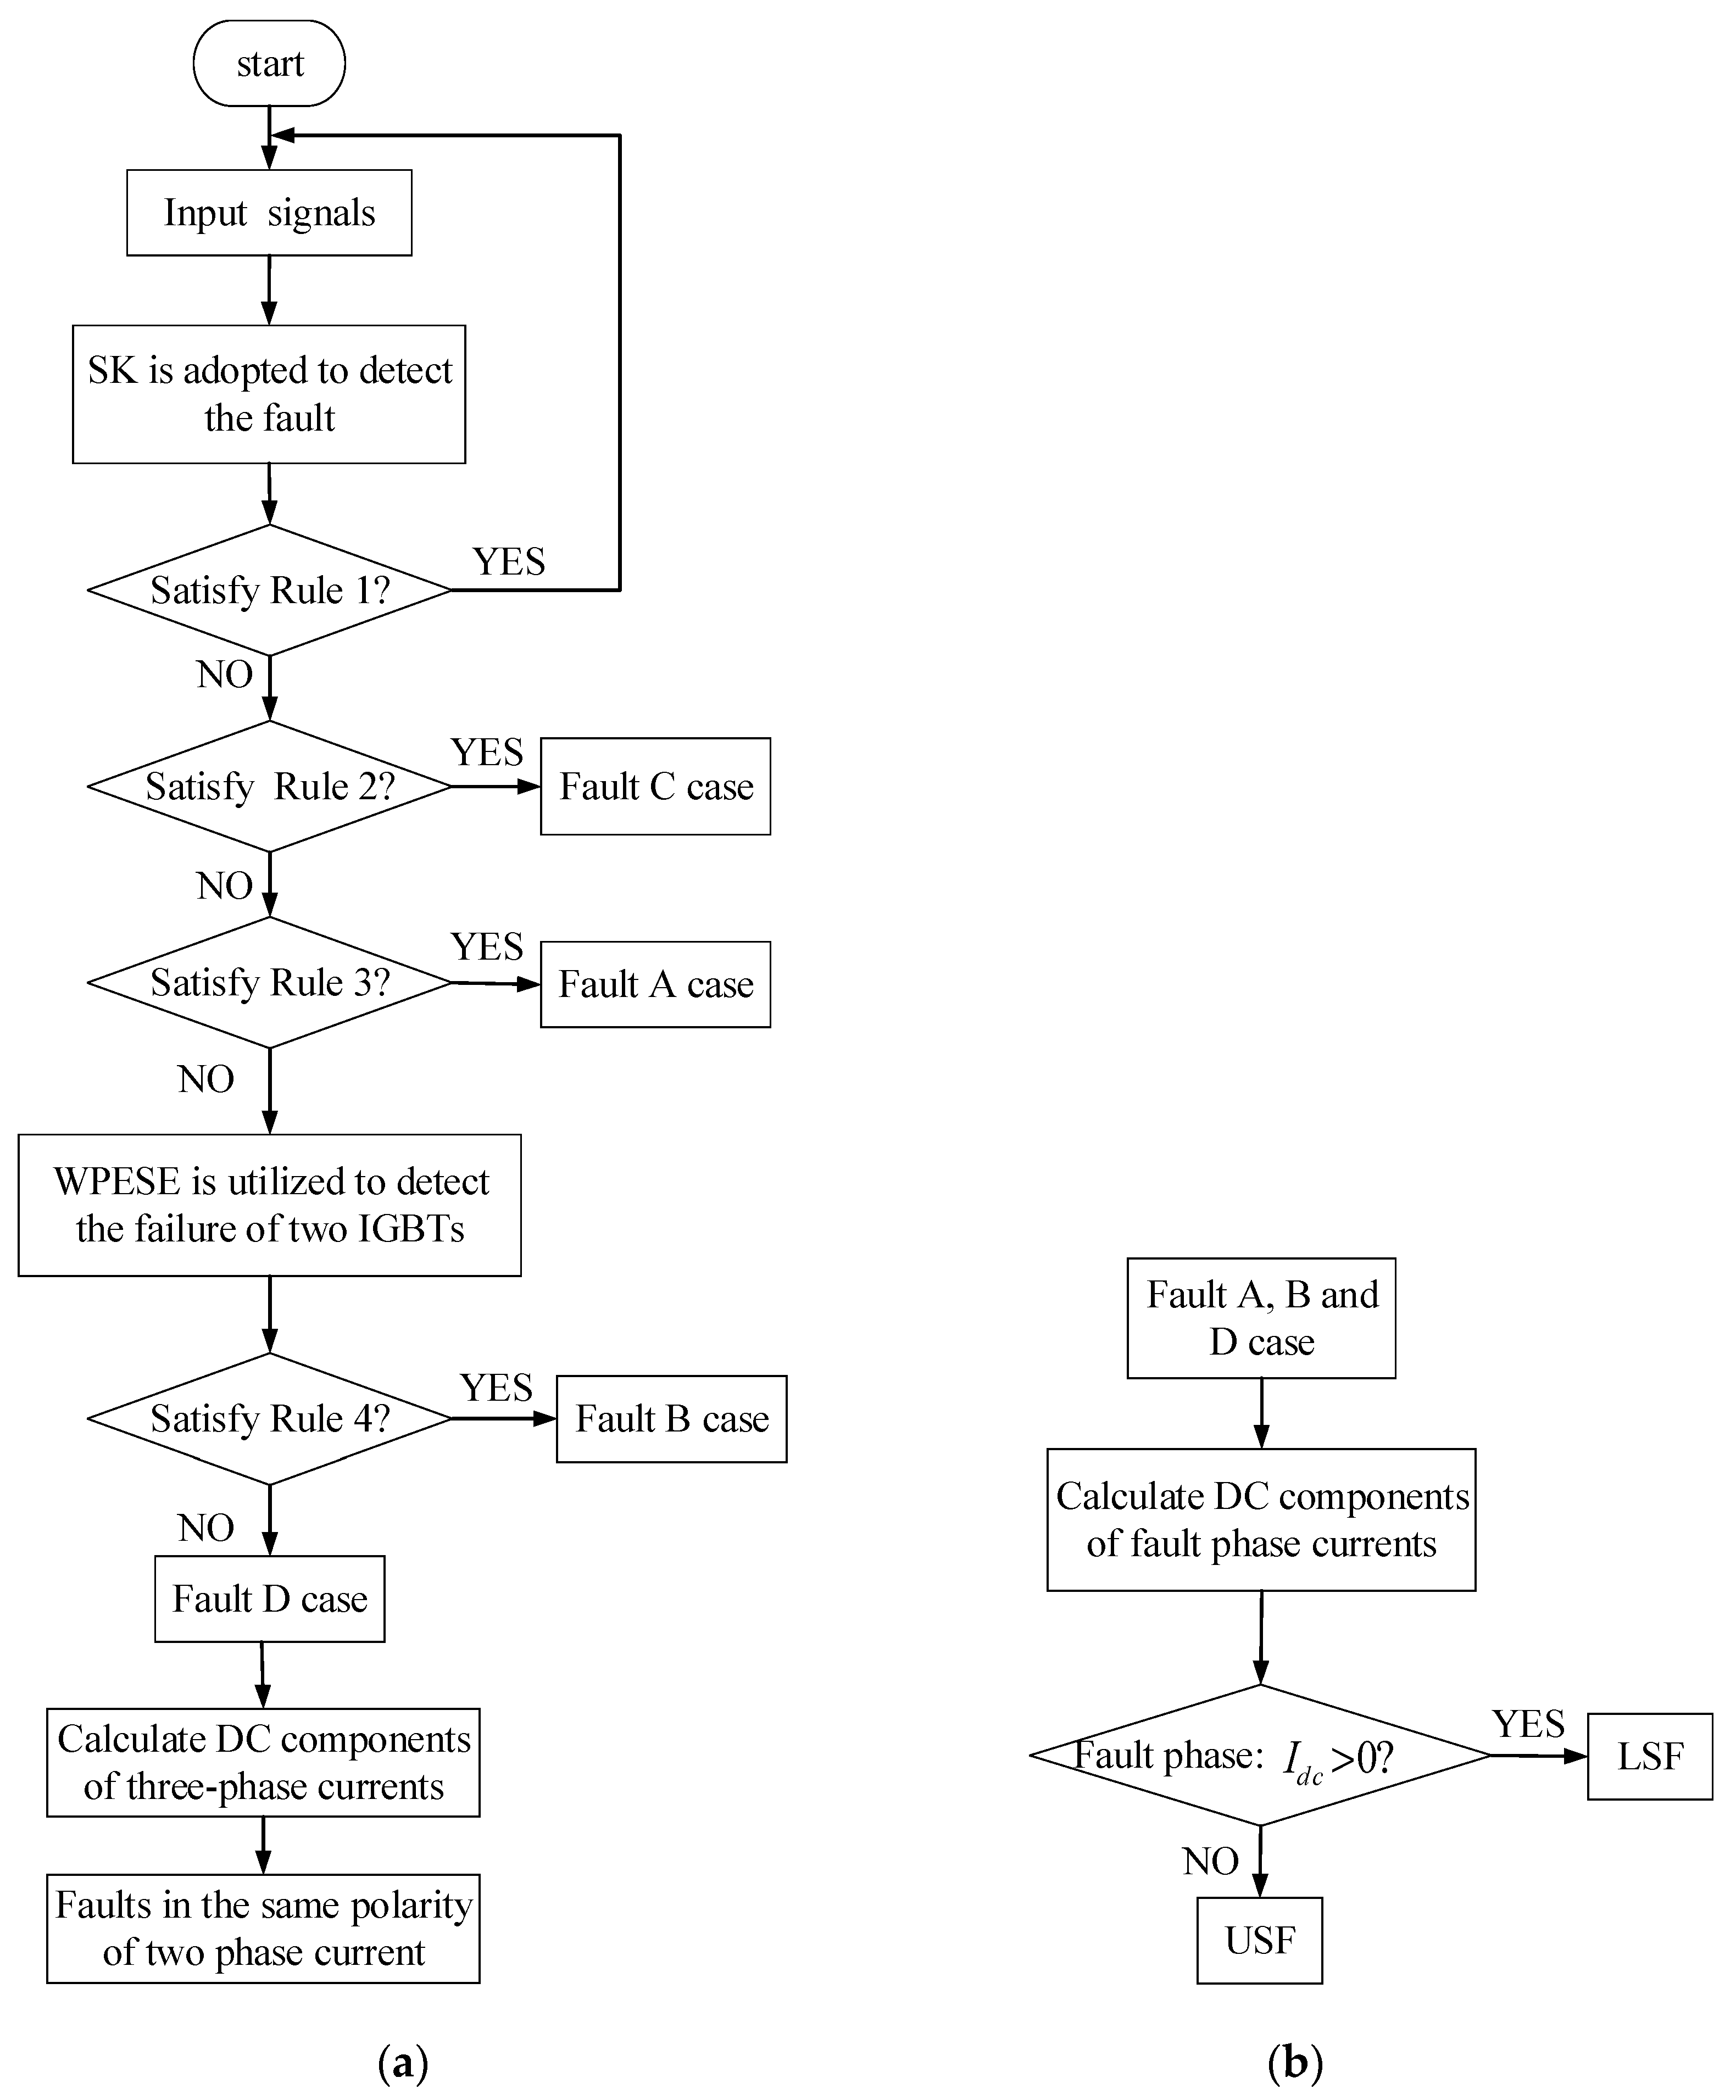
3.3. Diagnosis Flow
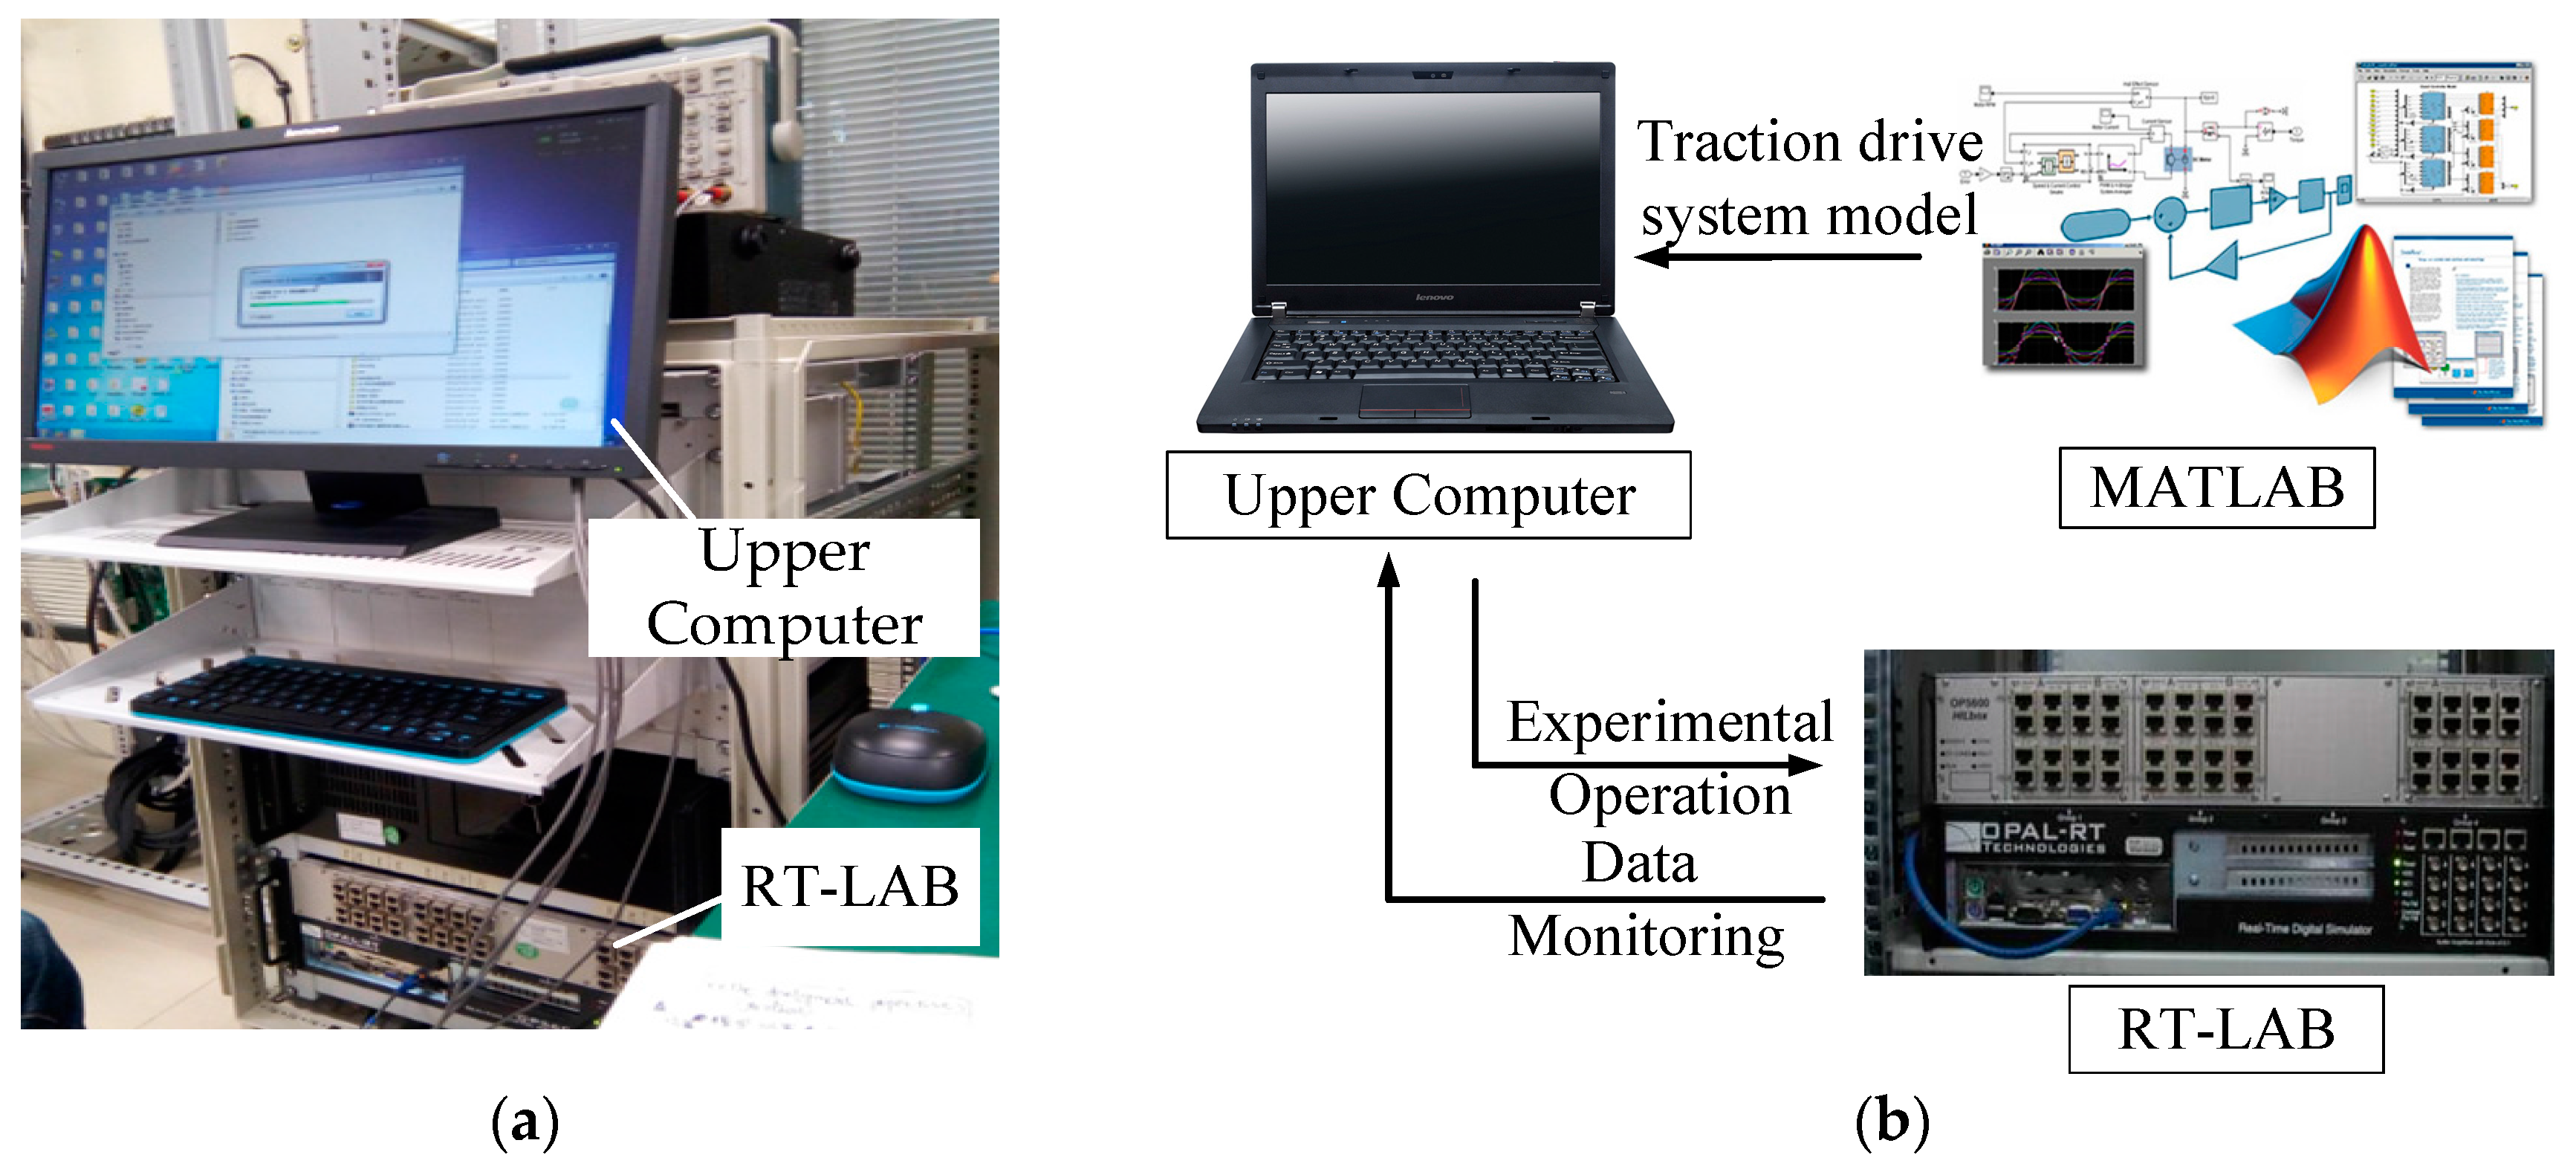
4. Algorithm Analysis, Experiment and Discussion
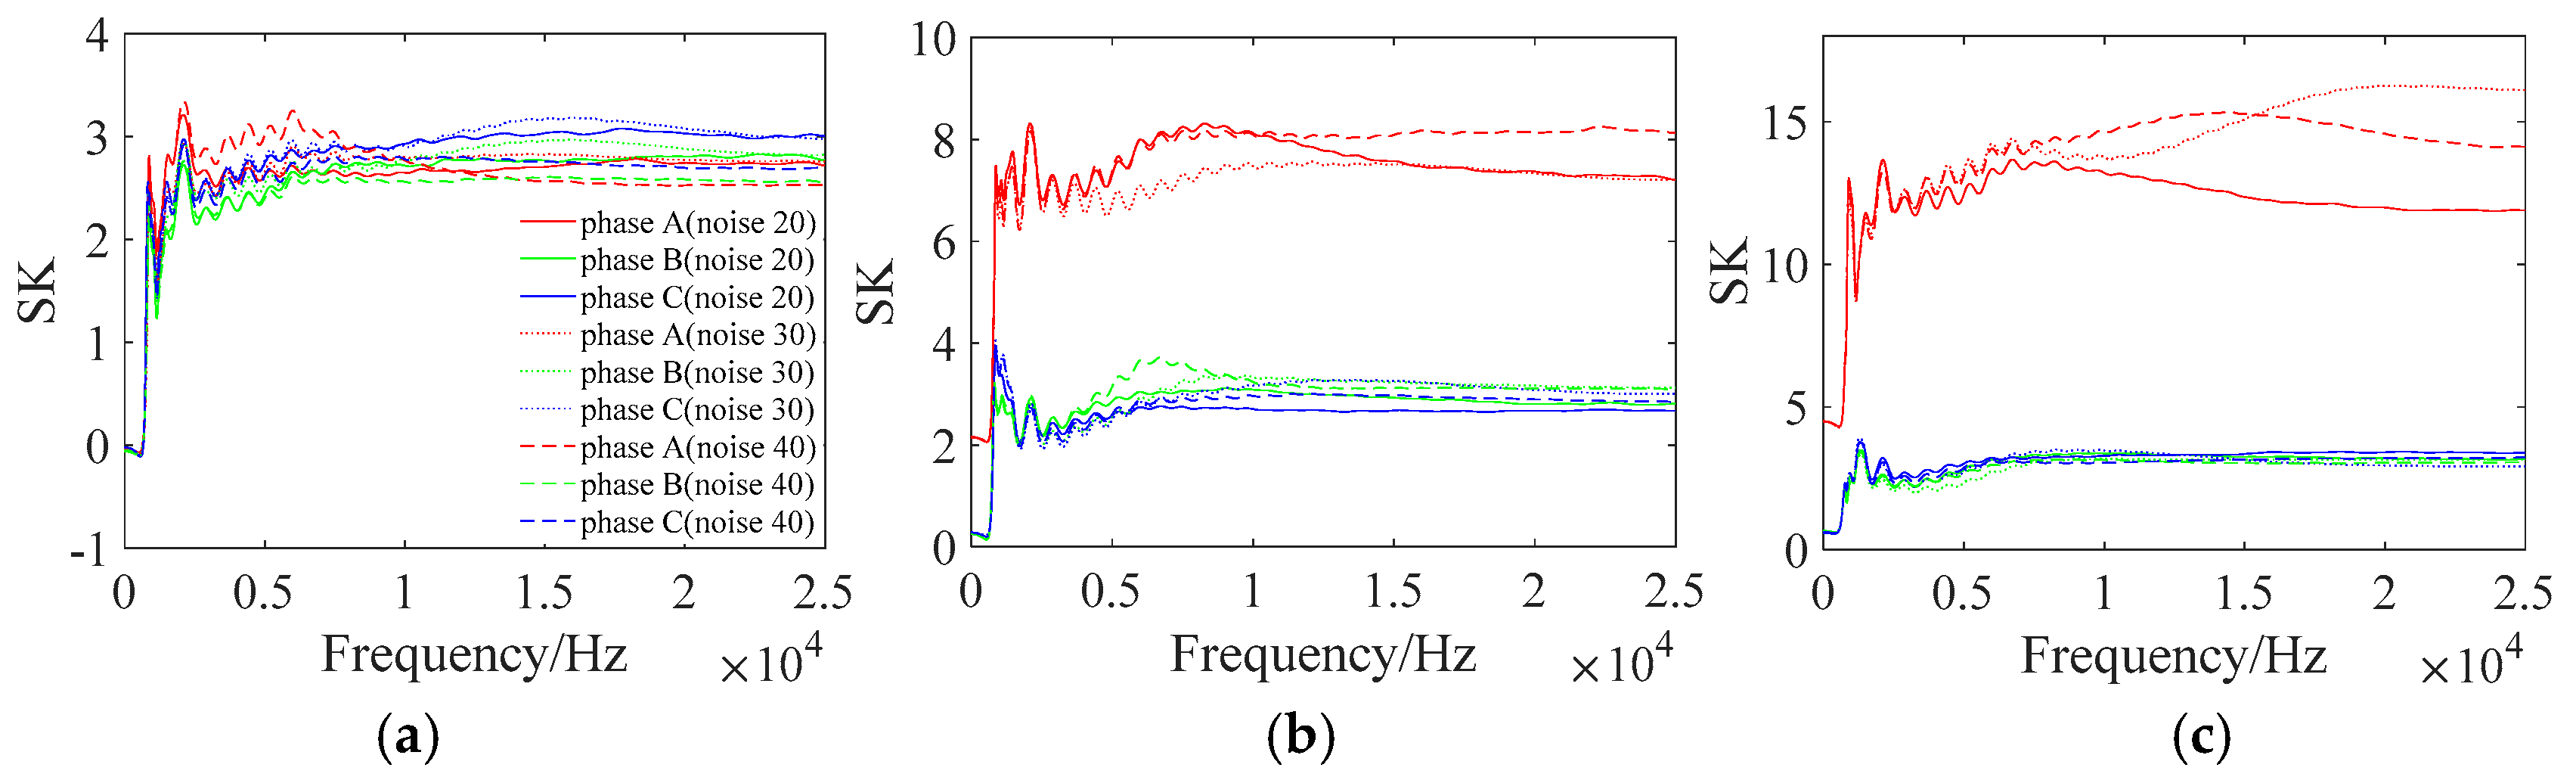
4.1. Accuracy Analyses of Methods
- (1)
- In the whole data set, the number of extrema and the number of zero-crossings must either be equal or differ at most by one;
- (2)
- At any point, the mean value of the envelope defined by local maxima and the envelope defined by the local minima is zero.
- (1)
- For a given signal x(t), it is first to determine its local maxima and minima. Then cubic spline line is adopted to connect all the local maxima and minima, respectively. Thus, the upper envelope and lower envelop can be obtained and the average value is calculated as m1(t). Denote:
- (2)
- If h1(t) satisfies the constraints of IMF, it can be the first IMF of the original signal. Else let x(t) = h1(t), and repeat the Steps (1) until h1k(t) satisfies the IMF constraints (h1(k−1)(t) − m1k(t) = h1k(t), k is the iteration number). Denote c1(t) = h1k(t), c1(t) is the first IMF of the original signal.
- (3)
- Separate c1(t) from x(t), and the residual can be obtained as below:
4.2. Experiment Results
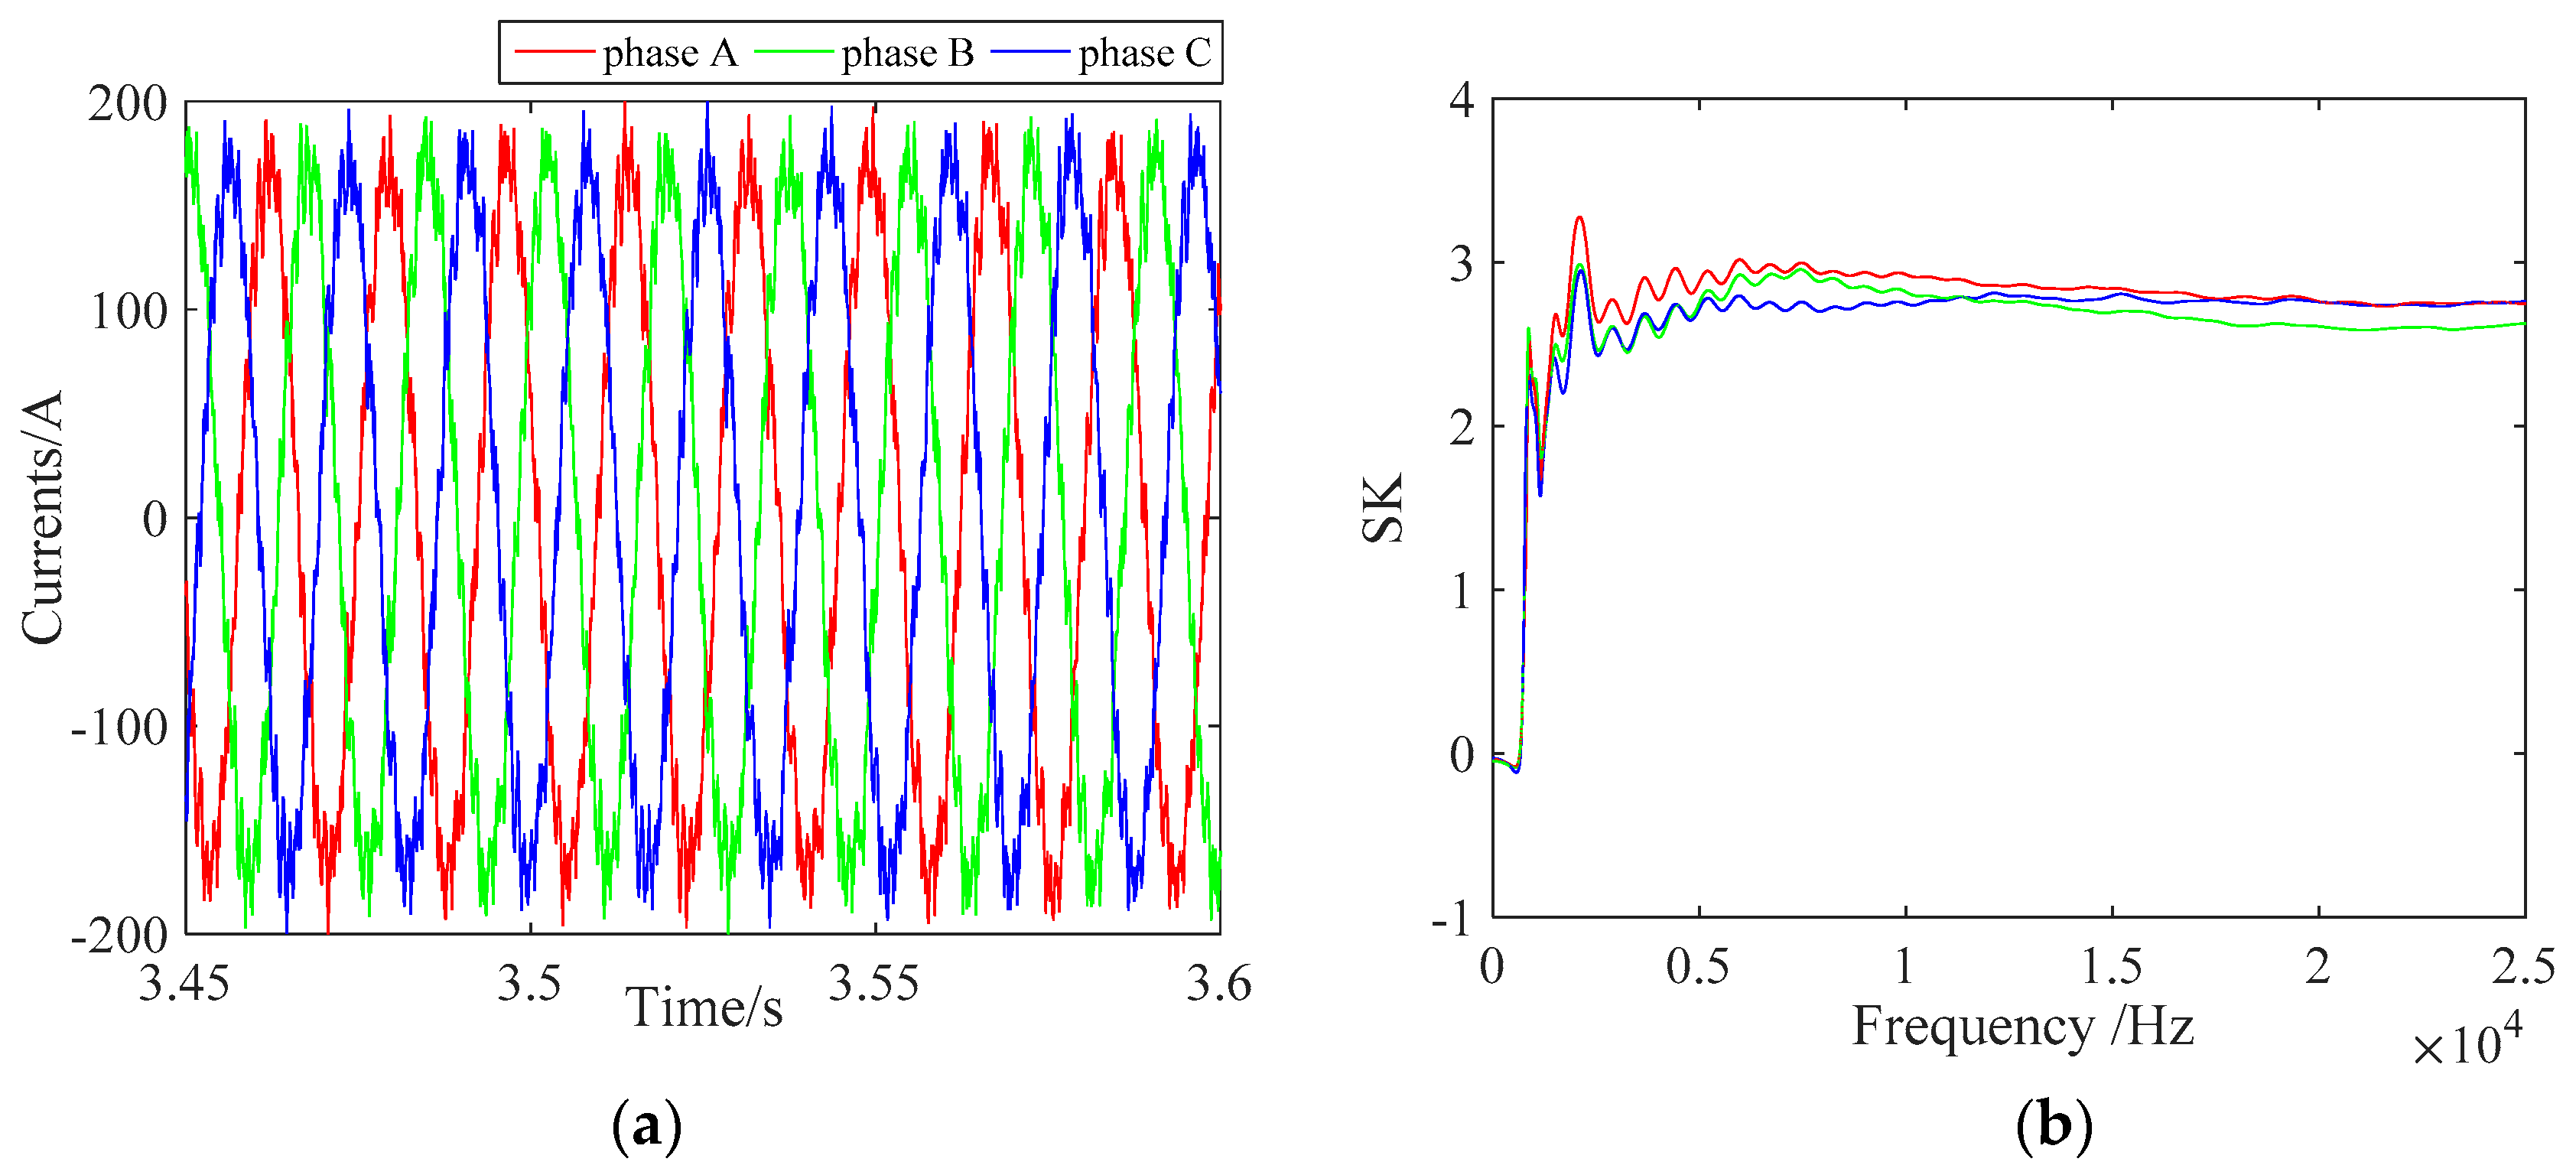
4.2.1. Fault-Free Case
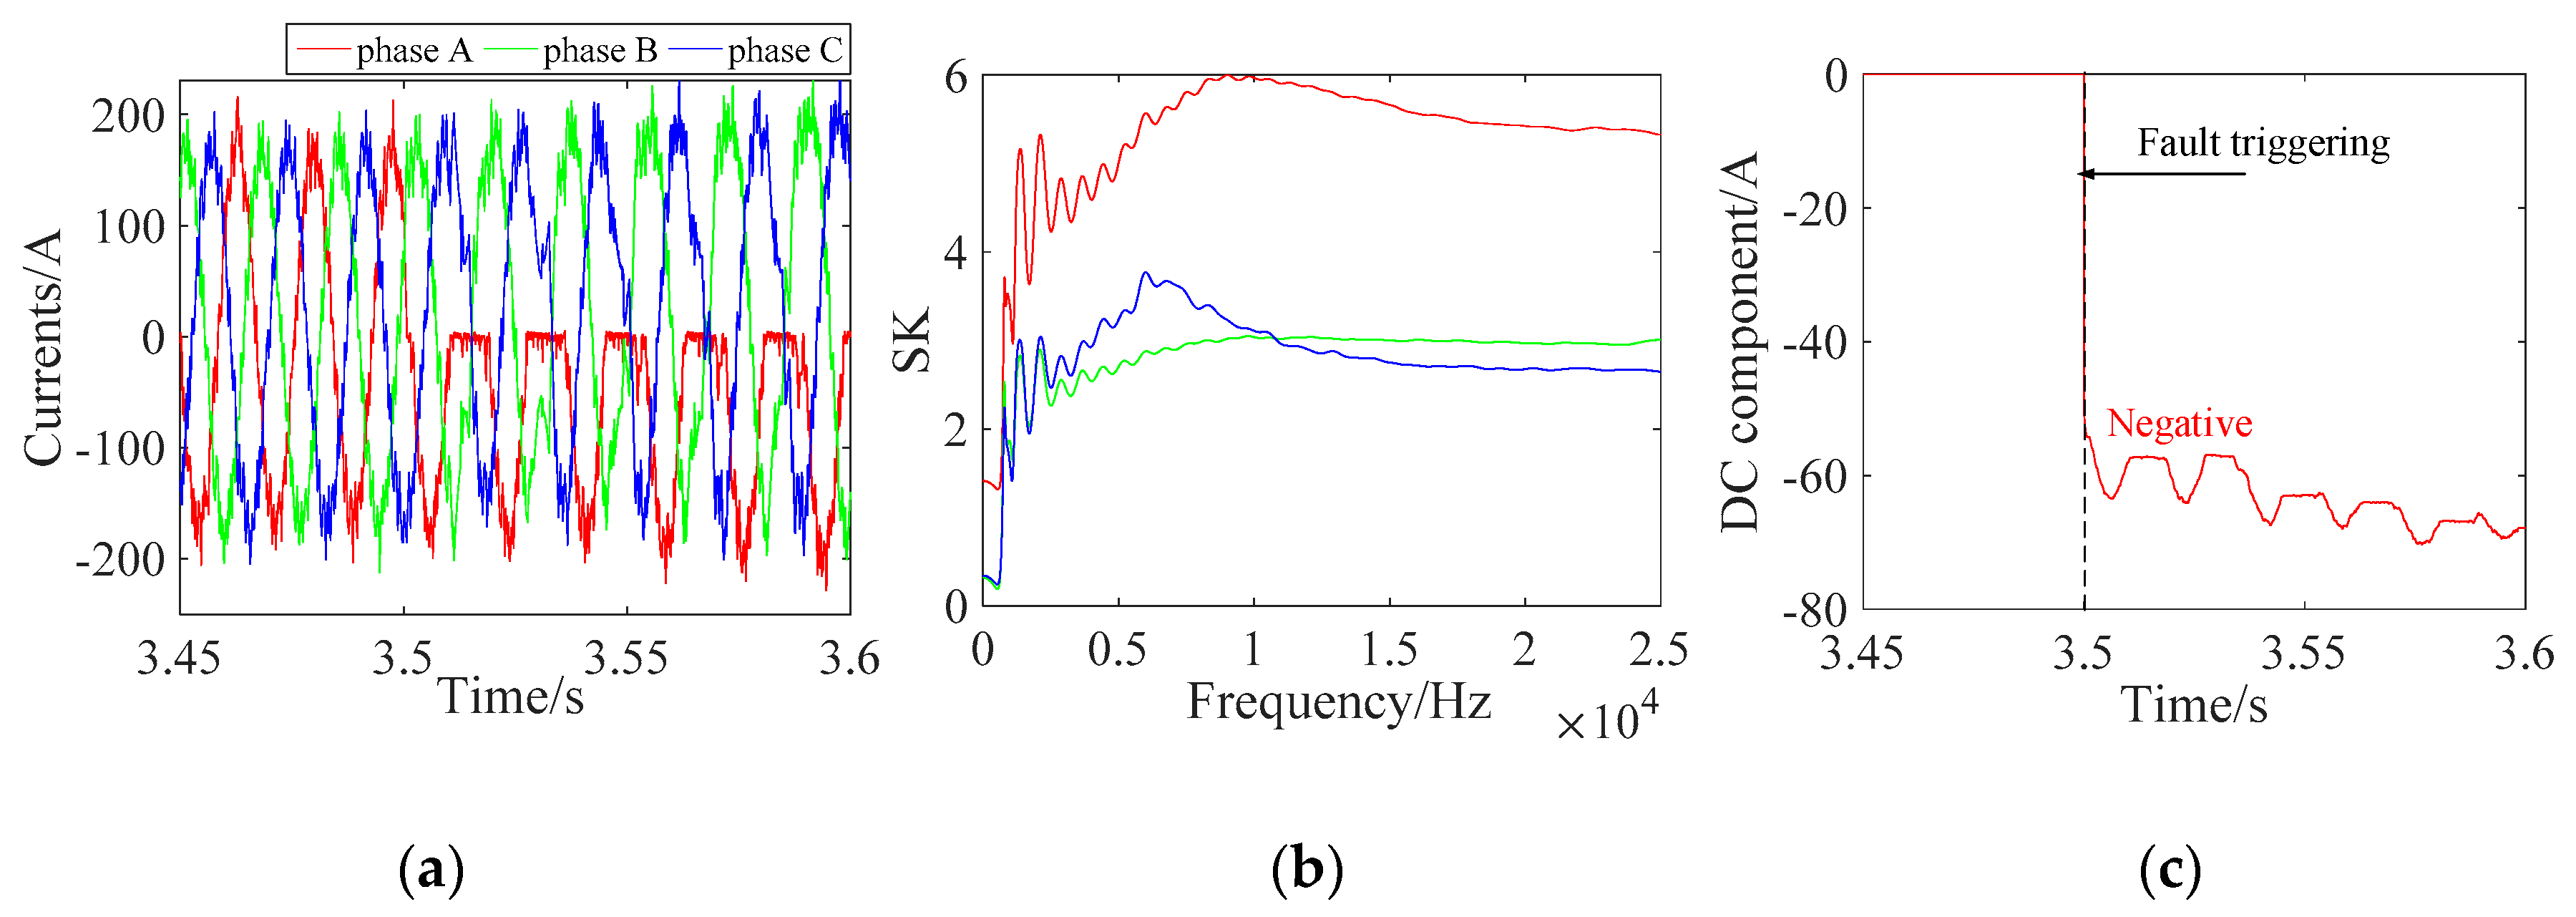
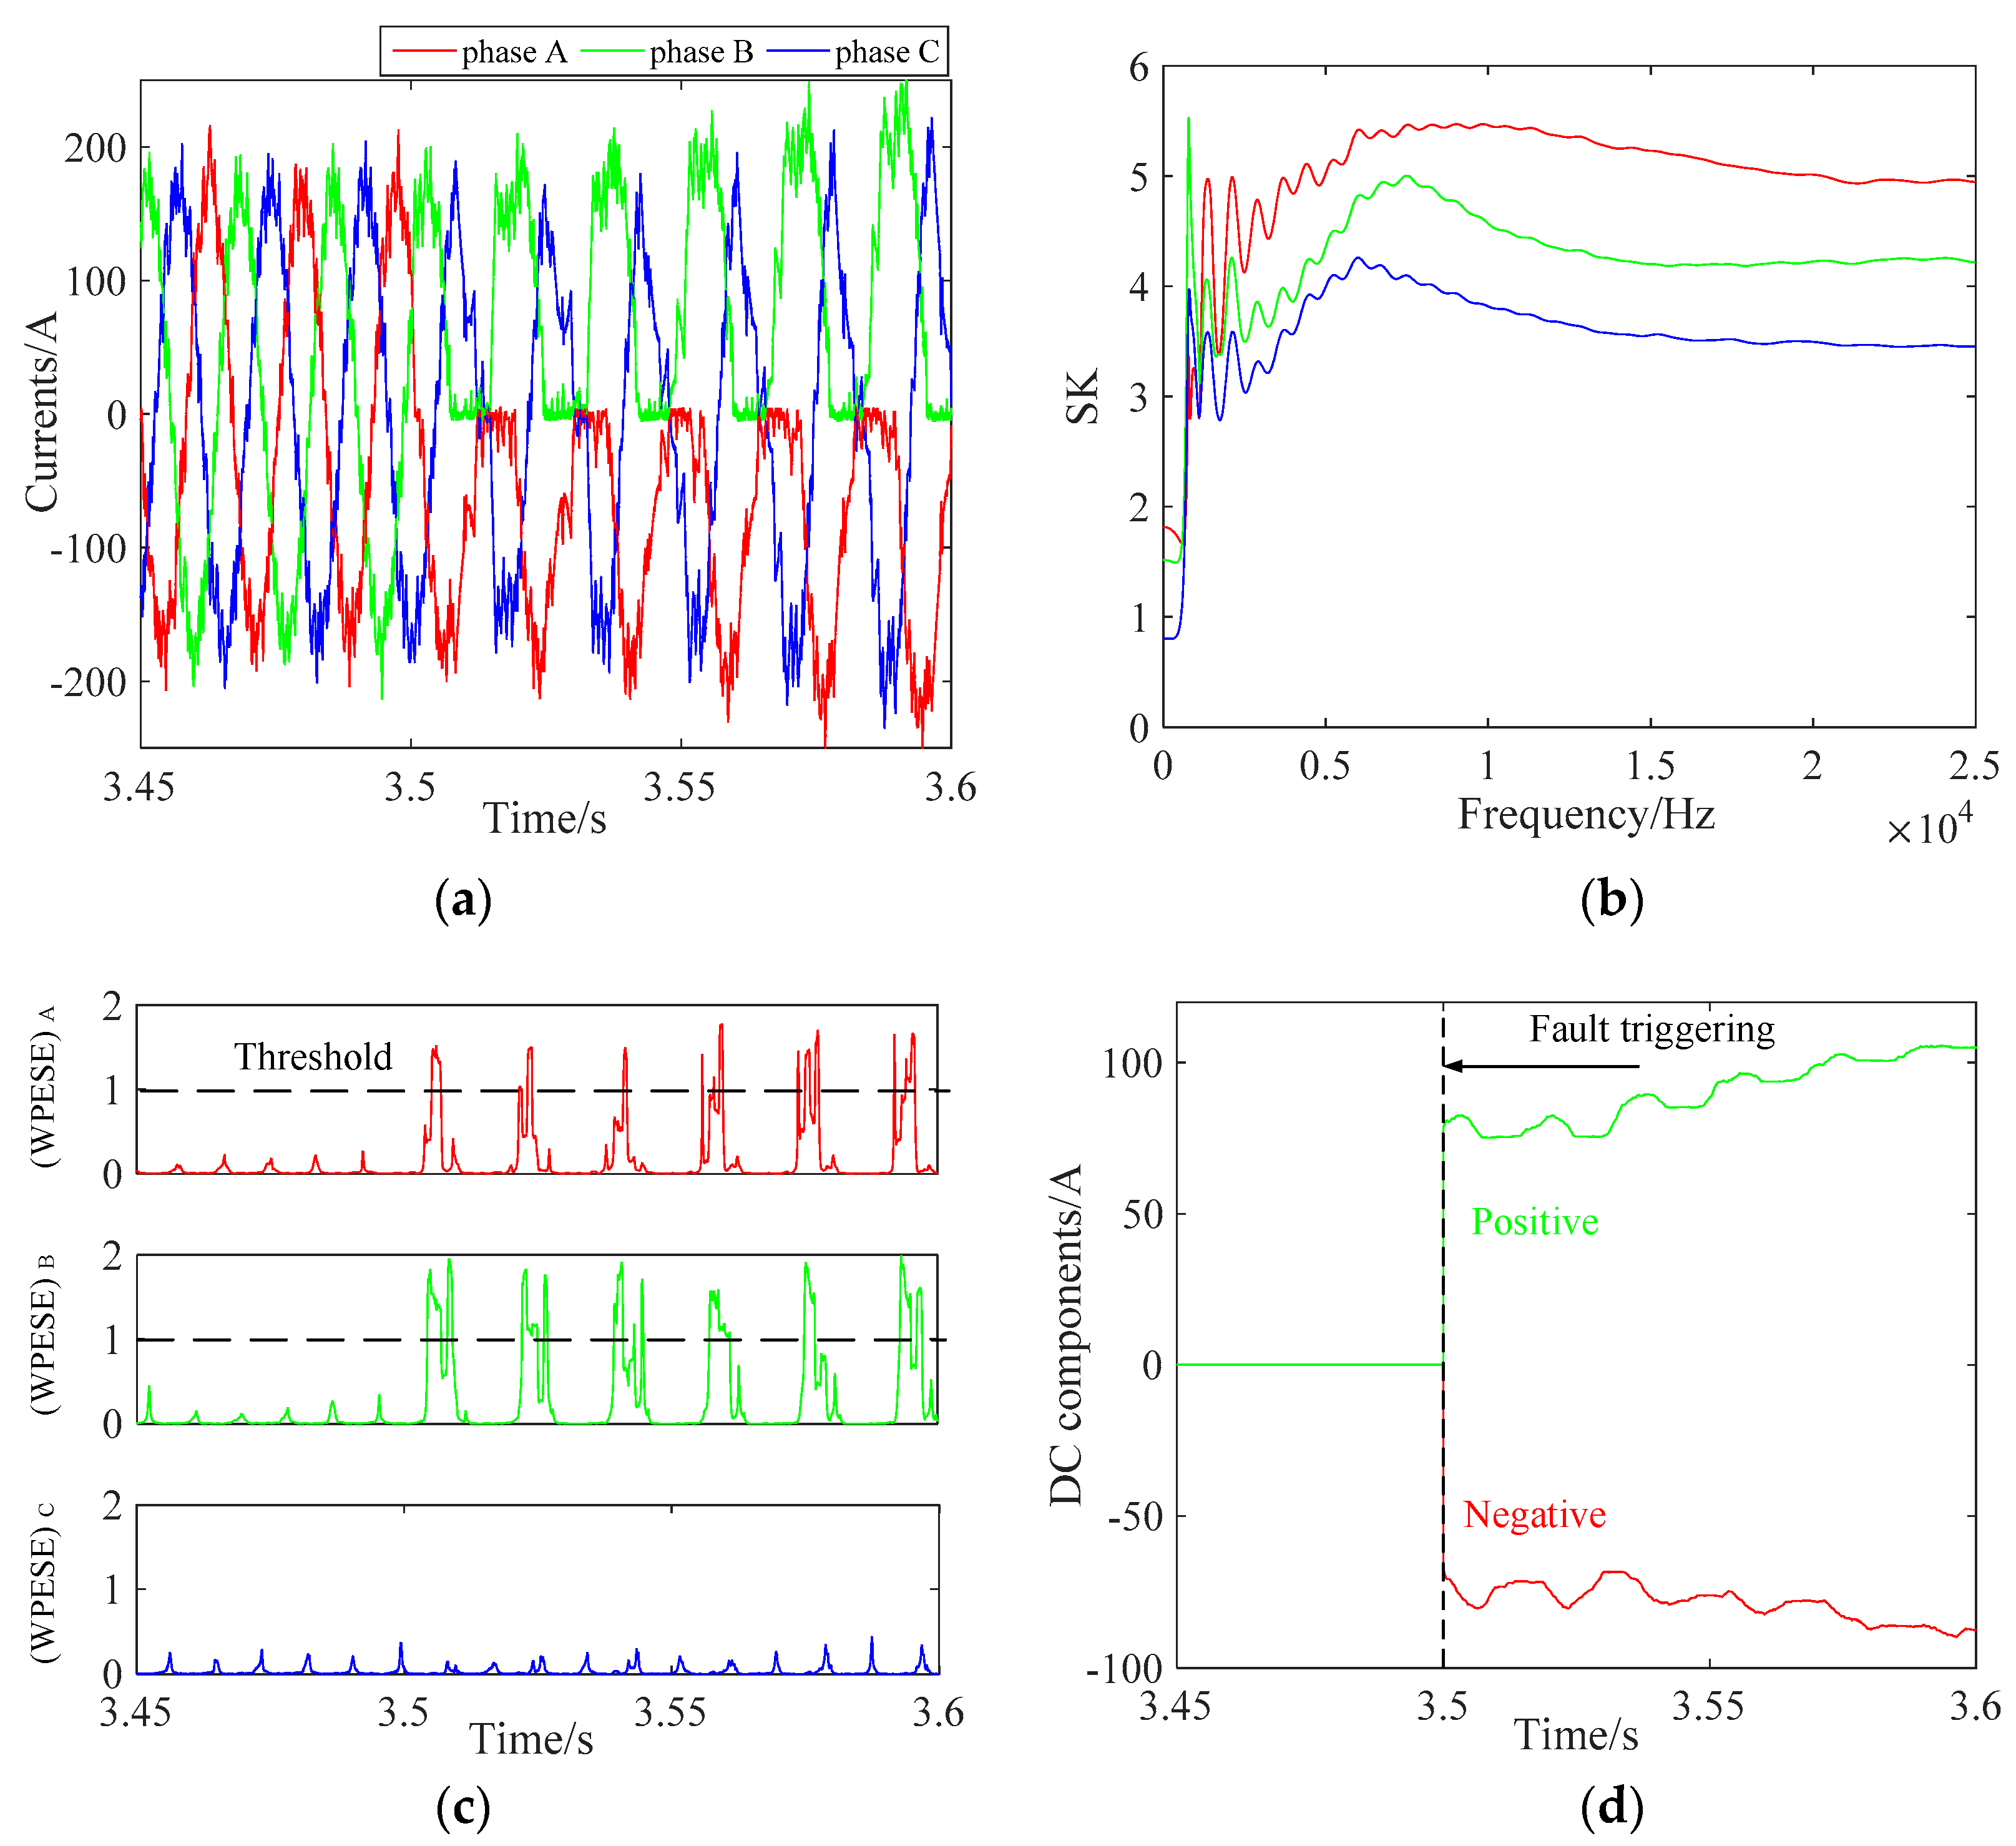
4.2.2. Fault A Case
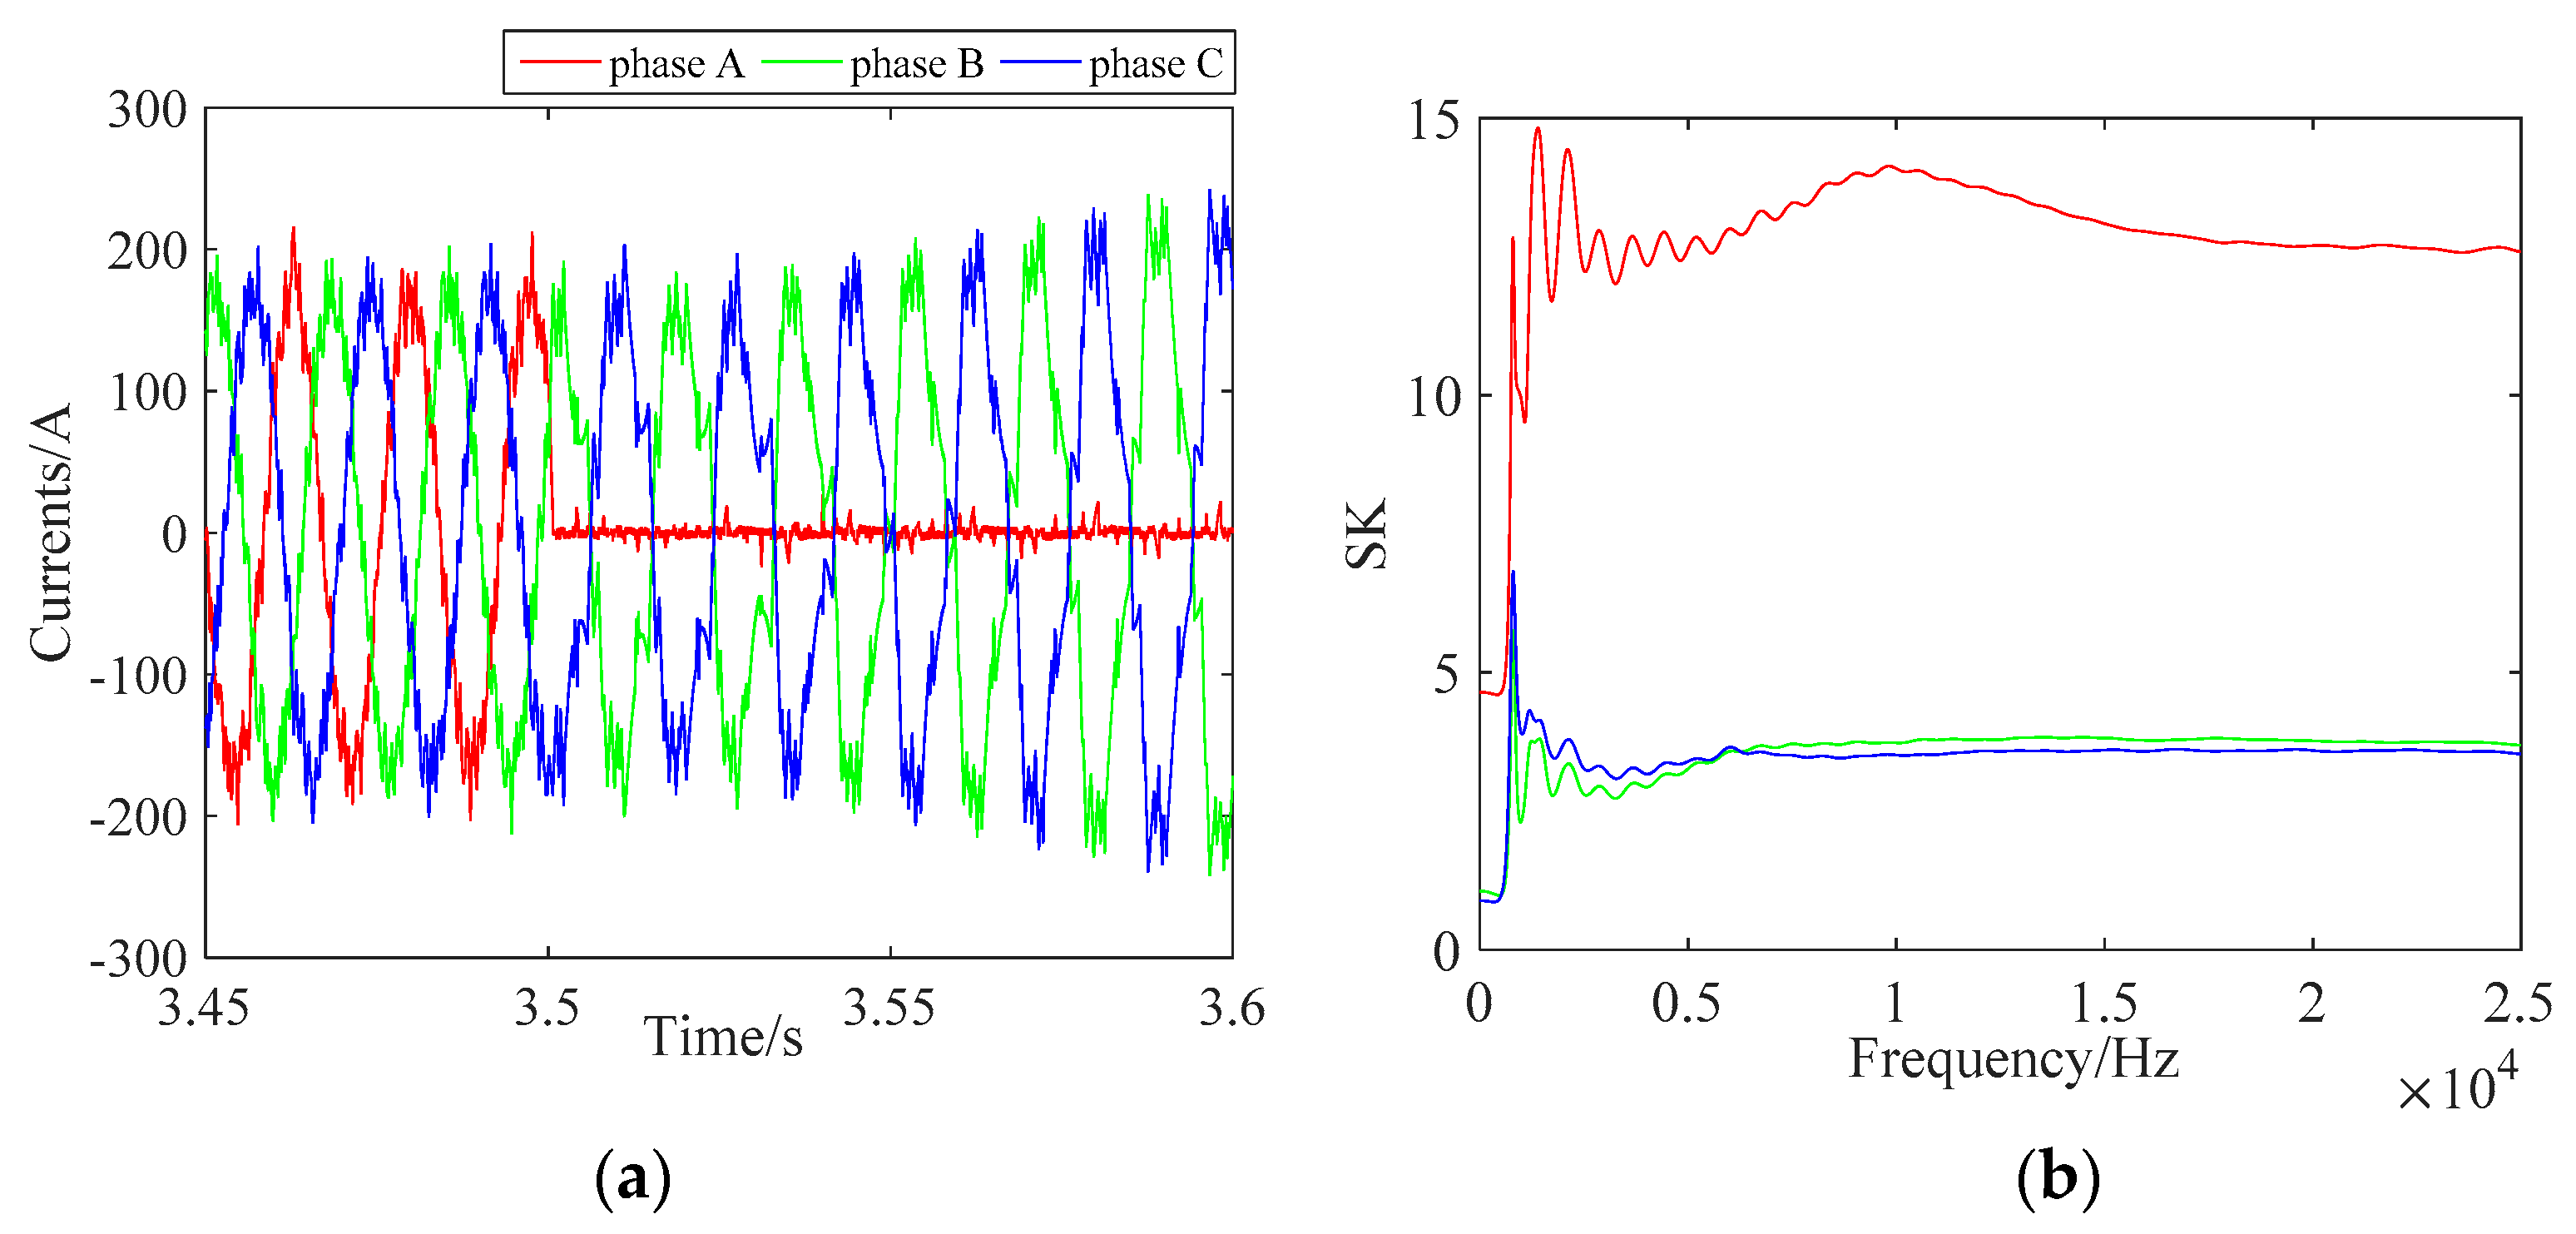
4.2.3. Fault B Case
4.2.4. Fault C Case
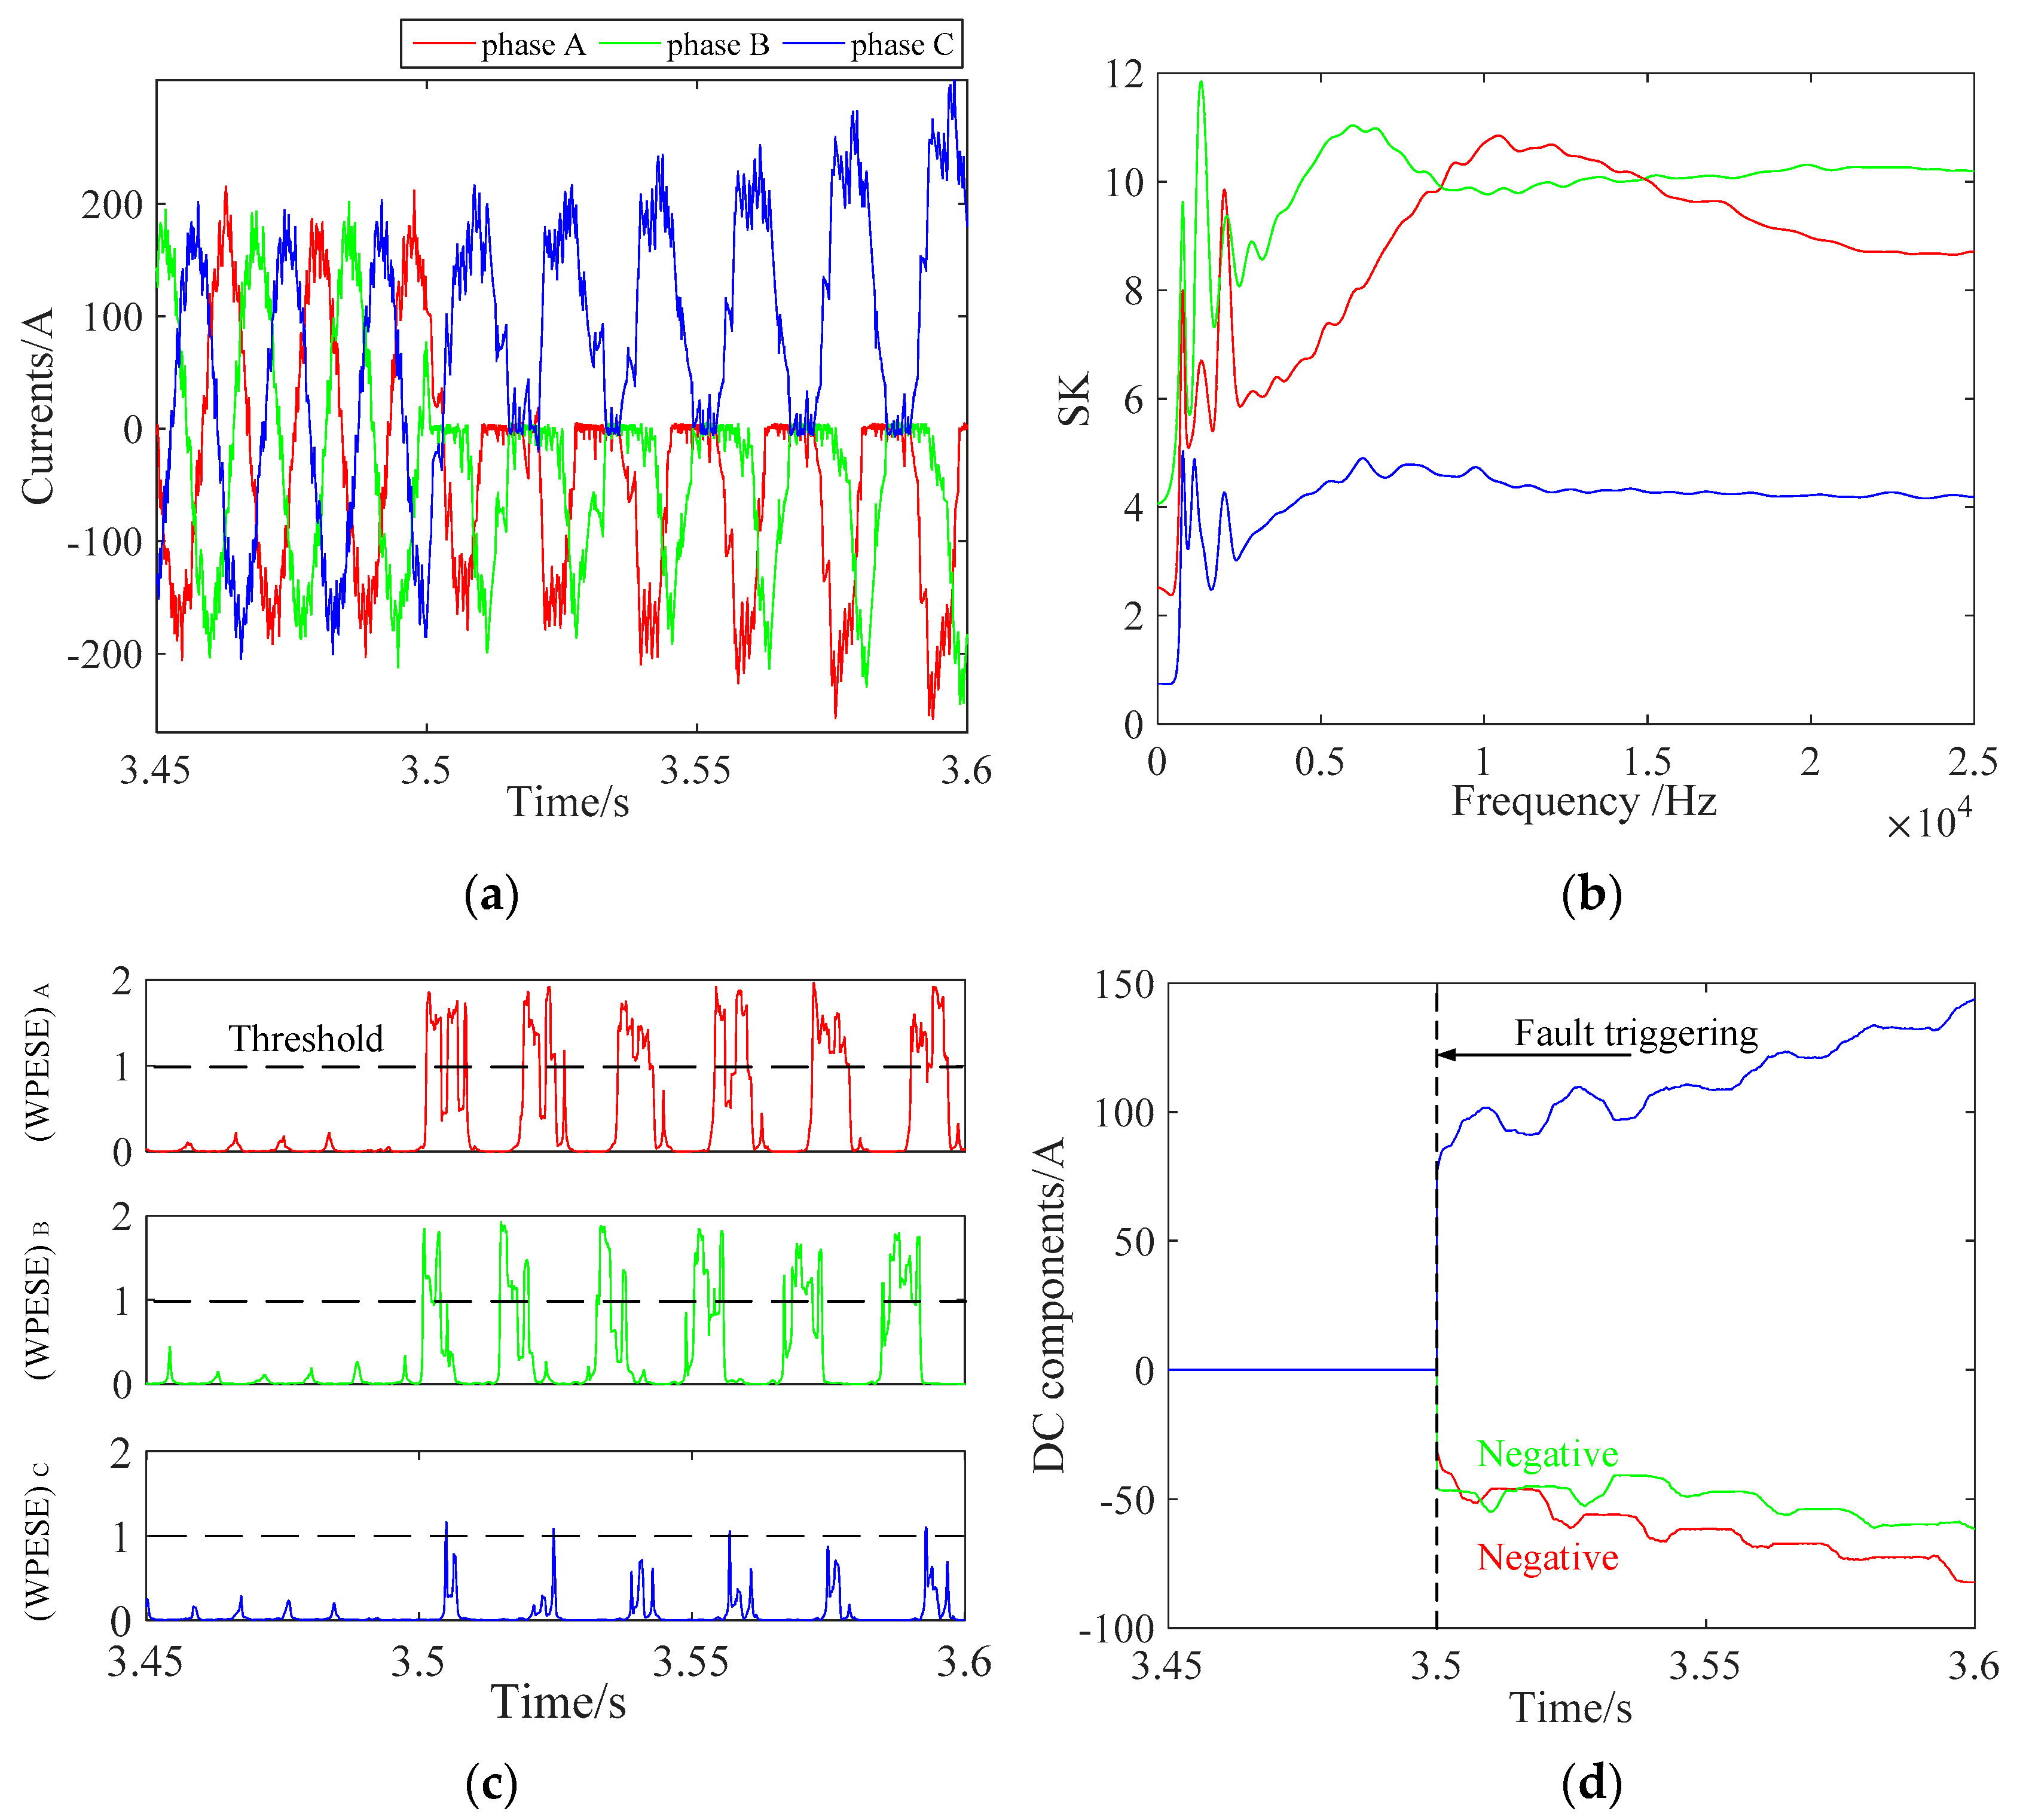
4.2.5. Fault D Case
5. Conclusions
- (1)
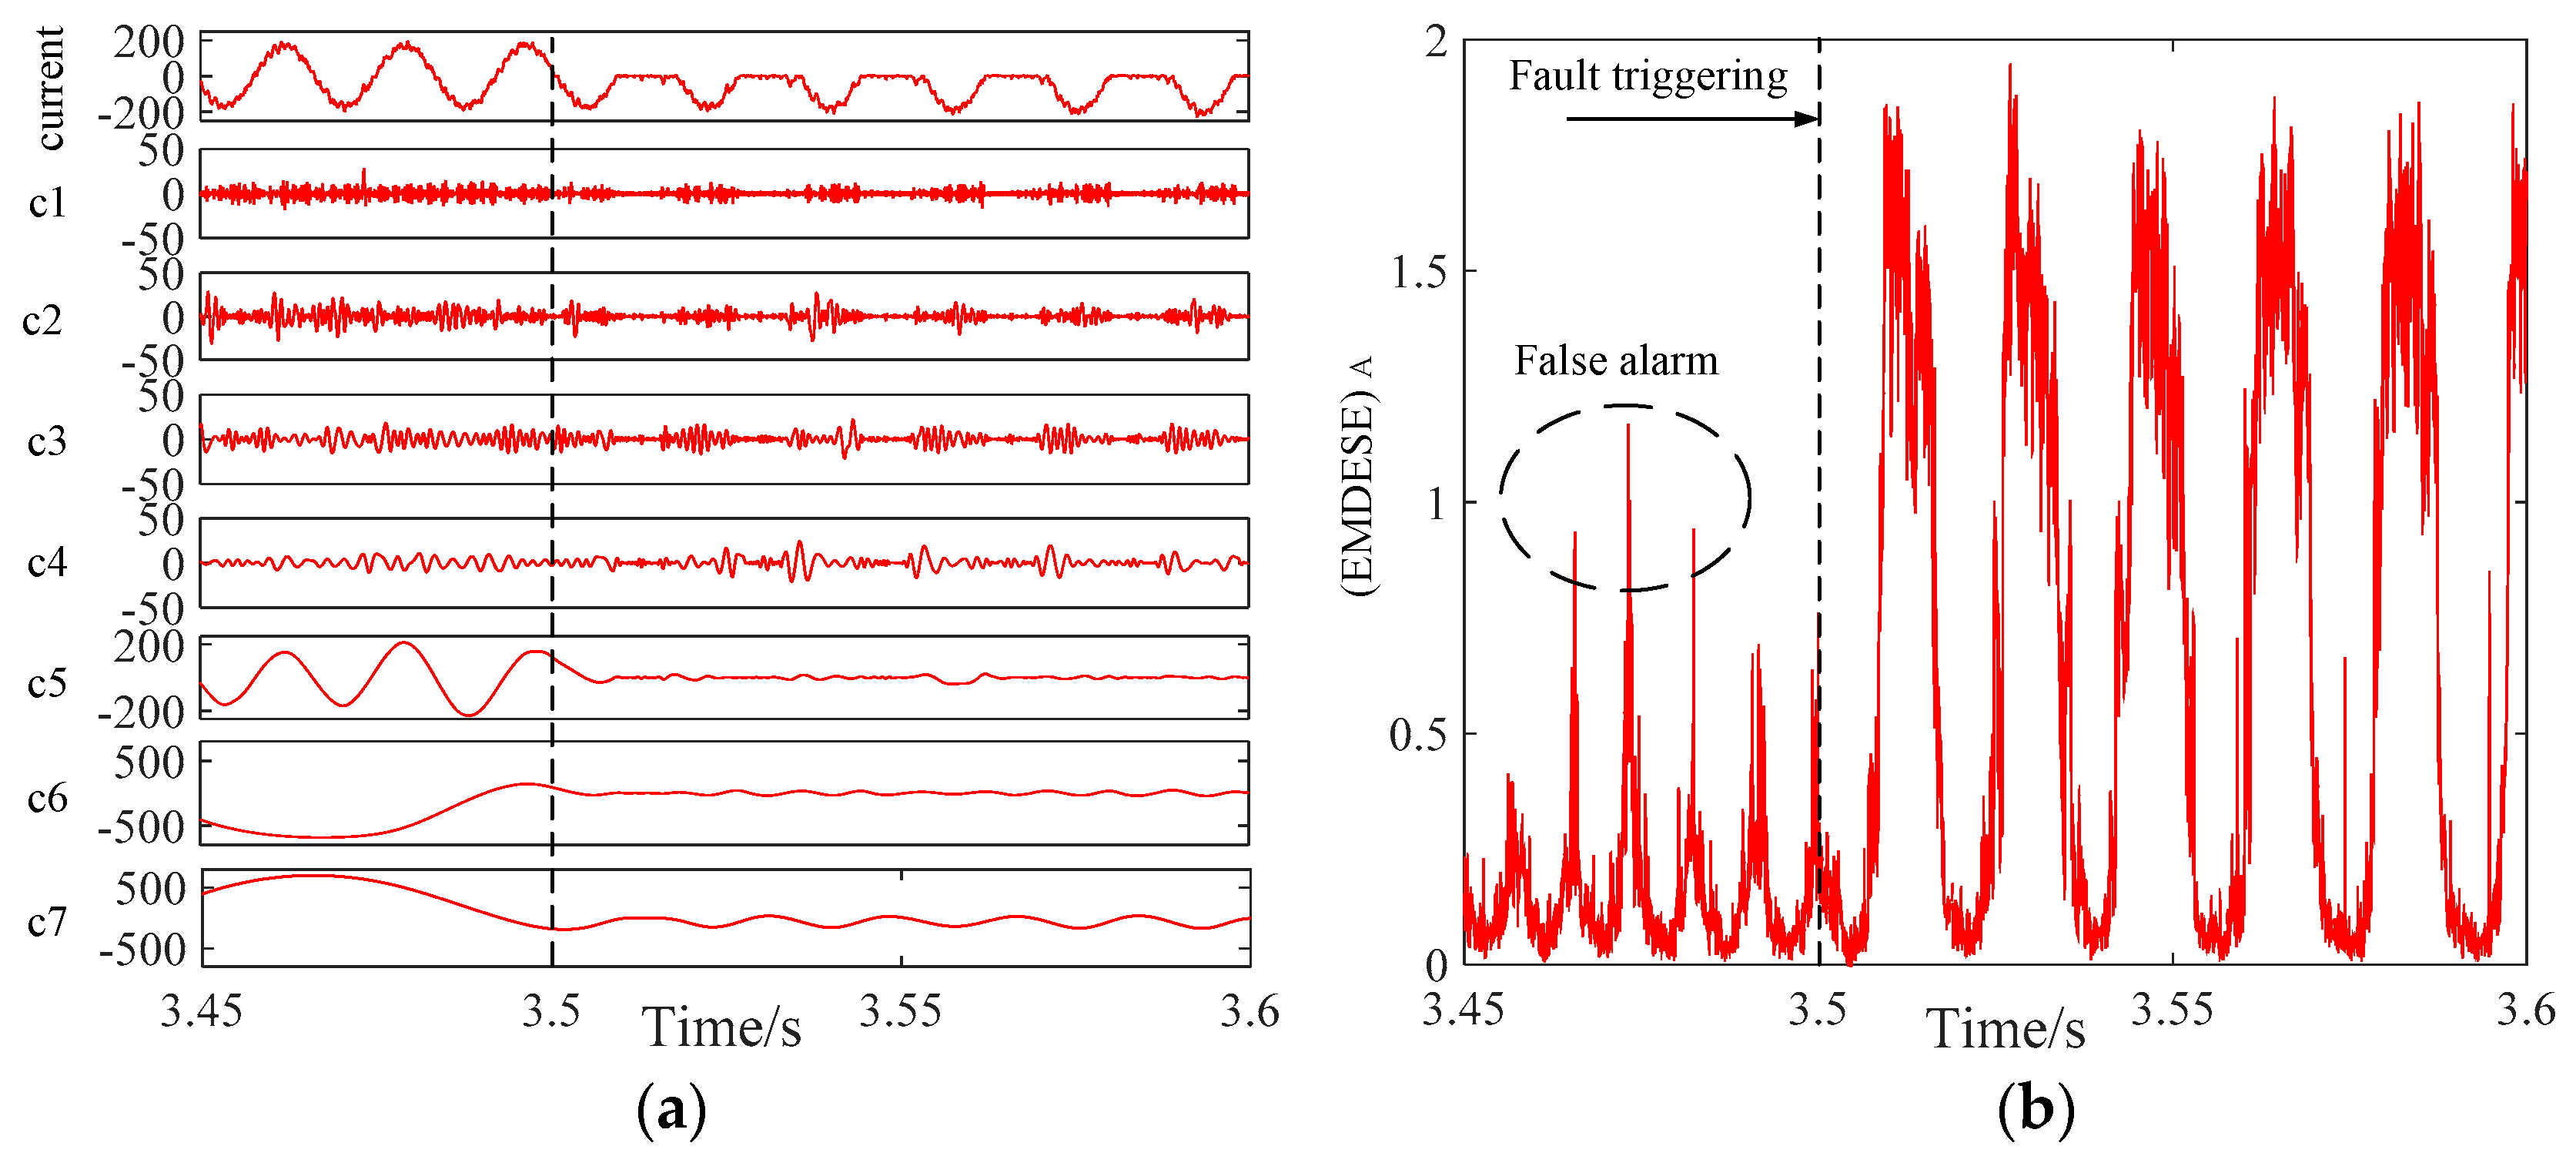
- SK based on CWD is not sensitive to the window functions and has an anti-noise ability, WPESE could diagnose the fault with accuracy compared with EMDESE. Therefore, the approach could solve the false alarm problem which would be caused by the system noise and has good robustness.
- (2)
- Compared with some previous methods, the method can realize the diagnosis of all single and two IGBTs fault cases and it can detect a fault and locate the open switch fault IGBTs with high accuracy.
- (3)
- The method is easily operated and requires no additional devices.
Acknowledgments
Author Contributions
Conflicts of Interest
Nomenclature
| CWD | Choi–Williams Distribution |
| EMD | Empirical mode decomposition |
| EMDESE | Empirical mode decomposition energy Shannon entropy |
| IGBT | Isolated Gate Bipolar Transistor |
| LSF | Lower Switch Fault |
| SNR | Signal-to-noise ratio |
| SK | Spectral kurtosis |
| SP | Signal processing |
| SPD | Semiconductor power devices |
| STFT | Short Time Fourier Transform |
| USF | Upper Switch Fault |
| WPESE | Wavelet-Packet Energy Shannon Entropy |
| WT | Wavelet Transform |
| WVD | Wigner–Ville Distribution |
References
- Smet, V.; Forest, F.; Huselstein, J.J.; Richardeau, F.; Khatir, Z.; Lefebvre, S.; Berkani, M. Ageing and failure modes of IGBT modules in high-temperature power cycling. IEEE Trans. Ind. Electron. 2011, 58, 4931–4941. [Google Scholar] [CrossRef]
- Yang, S.; Bryant, A.; Mawby, P.; Xiang, D.; Ran, L.; Tavner, P. An industry-based survey of reliability in power electronic converters. IEEE Trans. Ind. Appl. 2011, 47, 1441–1451. [Google Scholar] [CrossRef]
- An, Q.T.; Sun, L.Z.; Zhao, K.; Sun, L. Switching function model-based fast-diagnostic method of open- switch faults in inverters without sensors. IEEE Trans. Power Electron. 2011, 26, 119–126. [Google Scholar] [CrossRef]
- Wang, Q.; Wang, Y.R.; Zhang, Z.F.; Song, Z. A diagnosis method for inverter open-circuit faults of brushless DC motor driver systems. Proc. CSEE 2013, 33, 114–120. [Google Scholar]
- Ribeiro, R.L.D.; Jacobina, C.B.; da Silva, E.R.C.; Lima, A.M.N. Fault detection of open-switch damage in Voltage-Fed PWM motor drive systems. IEEE Trans. Power Electron. 2013, 18, 587–593. [Google Scholar] [CrossRef]
- Cui, B.W.; Ren, Z. Fault detection and isolation of inverter based on FFT and neural network. Trans. CES 2006, 21, 37–43. [Google Scholar]
- Cui, J.; Wang, Q.; Gong, C.Y. Inverter power switch fault diagnosis technique research based on wavelet and Concordia transform. Proc. CSEE 2015, 35, 3110–3116. [Google Scholar]
- Keswani, R.A.; Suryawanshi, H.M.; Ballal, M.S. Multi-resolution analysis for converter switch faults identification. IET Power Electron. 2015, 8, 783–792. [Google Scholar] [CrossRef]
- Aktas, M.; Turkmenoglu, V. Wavelet-based switching faults detection in direct torque control induction motor drives. IET Sci. Meas. Technol. 2010, 4, 303–310. [Google Scholar] [CrossRef]
- Kim, D.E.; Lee, D.C. Fault diagnosis of three-phase PWM inverters using wavelet and SVM. J. Power Electron. 2009, 9, 377–385. [Google Scholar]
- Estima, J.O.; Cardoso, A.J.M. A new approach for real-time multiple open-circuit fault diagnosis in voltage-source inverters. IEEE Trans. Ind. Appl. 2011, 47, 2487–2494. [Google Scholar] [CrossRef]
- Zhang, J.H.; Zhao, J.; Zhou, D.H.; Huang, C.G. High-performance fault diagnosis in PWM voltage-source inverters for vector-controlled induction motor drives. IEEE Trans. Power Electron. 2014, 29, 6087–6099. [Google Scholar] [CrossRef]
- Estima, J.O.; Freire, N.M.A.; Cardoso, A.J.M. Recent Advances in Fault Diagnosis by Park’s Vector Approach. In Proceedings of the 2013 IEEE Workshop on Electrical Machines Design Control and Diagnosis, Paris, France, 11–12 March 2013; pp. 279–288. [Google Scholar]
- Ferracuti, F.; Giantomassi, A.; Iarlori, S.; Ippoliti, G.; Longhi, S. Electric motor defects diagnosis based on kernel density estimation and Kullback–Leibler divergence in quality control scenario. Eng. Appl. Artif. Intell. 2015, 44, 25–32. [Google Scholar] [CrossRef]
- Villecco, F.; Pellegrino, A. Entropic measure of epistemic uncertainties in multibody system models by axiomatic design. Entropy 2017, 19, 291. [Google Scholar] [CrossRef]
- Villecco, F.; Pellegrino, A. Evaluation of uncertainties in the design process of complex mechanical systems. Entropy 2017, 19, 475. [Google Scholar] [CrossRef]
- Wang, D.; Tsui, K.L. Dynamic Bayesian wavelet transform: New methodology for extraction of repetitive transients. Mech. Syst. Signal Process. 2017, 88, 137–144. [Google Scholar] [CrossRef]
- Wang, D.; Peter, W.T.; Tsui, K.L. An enhanced Kurtogram method for fault diagnosis of rolling element bearings. Mech. Syst Signal Process. 2013, 35, 176–199. [Google Scholar] [CrossRef]
- Jia, F.; Lei, Y.; Shan, H.; Lin, J. Early fault diagnosis of bearings using an improved spectral kurtosis by maximum correlated kurtosis deconvolution. Sensors 2015, 15, 29363–29377. [Google Scholar] [CrossRef] [PubMed]
- Dwyer, R. Detection of non-Gaussian signals by frequency domain kurtosis estimation. In Proceedings of the IEEE International Conference on Acoustics, Speech, and Signal Processing (ICASSP 1983), Boston, MA, USA, 14–16 April 1983; pp. 607–610. [Google Scholar]
- Antoni, J. The spectral kurtosis: A useful tool for characterising non-stationary signals. Mech. Syst. Signal Process. 2006, 20, 282–307. [Google Scholar] [CrossRef]
- Liu, Z.G.; Zhang, Q.G. An approach to recognize the transient disturbances with spectral kurtosis. IEEE Trans. Instrum. Meas. 2014, 63, 46–55. [Google Scholar] [CrossRef]
- Wang, D. An extension of the infograms to novel Bayesian inference for bearing fault feature identification. Mech. Syst. Signal Process. 2016, 80, 19–30. [Google Scholar] [CrossRef]
- Gao, Y.; Villecco, F.; Li, M.; Song, W. Multi-Scale Permutation Entropy Based on Improved LMD and HMM for Rolling Bearing Diagnosis. Entropy 2017, 19, 176. [Google Scholar] [CrossRef]
- Guo, Y.; Xu, Q.; Li, P.; Sbert, M.; Yang, Y. Trajectory Shape Analysis and Anomaly Detection Utilizing Information Theory Tools. Entropy 2017, 19, 323. [Google Scholar] [CrossRef]
- Liu, Z.G.; Cui, Y.; Li, W.H. Combined power quality disturbances recognition using wavelet packet entropies and S-transform. Entropy 2015, 17, 5811–5828. [Google Scholar] [CrossRef]
- Liu, Z.G.; Han, Z.W.; Zhang, Y. Multiwavelet packet entropy and its application in transmission line fault recognition and classification. IEEE Trans. Neural Netw. Learn. Syst. 2014, 25, 2043–2052. [Google Scholar] [CrossRef] [PubMed]
- Hu, K.T.; Liu, Z.G.; Lin, S.S. Wavelet entropy-based traction inverter open switch fault diagnosis in high-speed railways. Entropy 2016, 18, 78. [Google Scholar] [CrossRef]
- Zhu, L.; Liu, Z.; Hu, Q.; Zhang, Q. School of Electrical Engineering, Southwest Jiaotong University. Recognition of transient power quality disturbances based on CWD spectral kurtosis. Electr. Power Autom. Equip. 2014, 34, 125–131. [Google Scholar]
- Campos-Delgado, D.U.; Espinoza-Trejo, D.R. An observer-based diagnosis scheme for single and simultaneous open-switch faults in induction motor drives. IEEE Trans. Ind. Electron. 2011, 58, 671–679. [Google Scholar] [CrossRef]
- Liu, Z.G.; Cui, Y.; Li, W.H. A classification method for complex power quality disturbances using EEMD and rank wavelet SVM. IEEE Trans. Smart Grid 2015, 6, 1678–1685. [Google Scholar] [CrossRef]
- Ding, W.L.; Gao, X.Y.; Su, Y.P.; Li, X.L. A movement smoothness measuring algorithm based on curvature estimation. High Technol. Lett. 2015, 25, 835–842. [Google Scholar]


| Conditions | Phase A | Phase B | Phase C |
|---|---|---|---|
| Fault-free | 2.7281 | 2.6036 | 2.6282 |
| Fault A case with S1 open | 5.1584 | 2.7789 | 3.0225 |
| Fault B case with S1, S6 open | 4.5847 | 4.4133 | 3.6025 |
| Fault C case with S1, S4 open | 12.3414 | 3.0736 | 3.1208 |
| Fault D case with S1, S3 open | 6.3627 | 6.3301 | 4.7299 |
| Window Functions | Smoothness |
|---|---|
| Rectangular | 5.9431 |
| Hanning | 0.0347 |
| Hamming | 0.0528 |
| Blackman | 0.0464 |
| Kaiser | 0.0638 |
| Parameter | Value | Parameter | Value |
|---|---|---|---|
| Stator resistance/Rs | 0.15 Ω | Inertia/J | 10 kg·m2 |
| Stator leakage inductance/Ls | 0.00142 H | Nominal line voltage | 2700 V |
| Rotator resistance/Rr | 0.16 Ω | Nominal frequency | 138 Hz |
| Rotator leakage inductance/Ls | 0.006 H | Pole pairs | 2 |
| Mutual inductance/Lm | 0.0254 H | Nominal power | kW |
© 2017 by the authors. Licensee MDPI, Basel, Switzerland. This article is an open access article distributed under the terms and conditions of the Creative Commons Attribution (CC BY) license (http://creativecommons.org/licenses/by/4.0/).
Share and Cite
Lin, S.; Liu, Z.; Hu, K. Traction Inverter Open Switch Fault Diagnosis Based on Choi–Williams Distribution Spectral Kurtosis and Wavelet-Packet Energy Shannon Entropy. Entropy 2017, 19, 504. https://doi.org/10.3390/e19090504
Lin S, Liu Z, Hu K. Traction Inverter Open Switch Fault Diagnosis Based on Choi–Williams Distribution Spectral Kurtosis and Wavelet-Packet Energy Shannon Entropy. Entropy. 2017; 19(9):504. https://doi.org/10.3390/e19090504
Chicago/Turabian StyleLin, Shuangshuang, Zhigang Liu, and Keting Hu. 2017. "Traction Inverter Open Switch Fault Diagnosis Based on Choi–Williams Distribution Spectral Kurtosis and Wavelet-Packet Energy Shannon Entropy" Entropy 19, no. 9: 504. https://doi.org/10.3390/e19090504