Article

How to Identify the Most Powerful Node in Complex Networks? A Novel Entropy Centrality Approach

1
School of Economics and Management, Beihang University, Beijing 100191, China
2
Key Laboratory of Complex System Analysis and Management Decision, Ministry of Education, Beijing 100191, China
*
Author to whom correspondence should be addressed.
Entropy 2017, 19(11), 614; https://doi.org/10.3390/e19110614
Submission received: 9 October 2017 / Revised: 12 November 2017 / Accepted: 13 November 2017 / Published: 15 November 2017
(This article belongs to the Section Complexity)

Abstract

:
Centrality is one of the most studied concepts in network analysis. Despite an abundance of methods for measuring centrality in social networks has been proposed, each approach exclusively characterizes limited parts of what it implies for an actor to be “vital” to the network. In this paper, a novel mechanism is proposed to quantitatively measure centrality using the re-defined entropy centrality model, which is based on decompositions of a graph into subgraphs and analysis on the entropy of neighbor nodes. By design, the re-defined entropy centrality which describes associations among node pairs and captures the process of influence propagation can be interpreted explained as a measure of actor potential for communication activity. We evaluate the efficiency of the proposed model by using four real-world datasets with varied sizes and densities and three artificial networks constructed by models including Barabasi-Albert, Erdos-Renyi and Watts-Stroggatz. The four datasets are Zachary’s karate club, USAir97, Collaboration network and Email network URV respectively. Extensive experimental results prove the effectiveness of the proposed method.

1. Introduction

A variety of problems in, e.g., management science, mathematics, computer science, chemistry, biology, sociology, epidemiology etc. deal with quantifying centrality in complex networks. Thus, numerous measures have been proposed including Freeman’s degree centrality [1], Katz’s centrality [2], Hubbell’s centrality [3], Bonacich’s eigenvector centrality designed for systematic networks [4], Bonacich and Lloyd’s alpha centrality conceptualized for asymmetric networks [5], Stephenson and Zelen’s information centrality [6], etc. Generally, methods mentioned above exclusively characterize limited parts of what it implies for an actor to be “vital” to the network. As was noted by Borgatti [7], centrality measures, or these measures’ probably well-known understandings, make certain presumptions about the way in which traffic flows through a network. For instance, Freeman’s closeness [1] counts exclusively geodesic routes, evidently accepting that nodes communicate with other nodes via the shortest routes. Other approaches such as flow betweenness [8] do not assume shortest paths but do assume proper paths in which no node is visited more than once (for more details, see [7]). Google’s PageRank algorithm [9] is constructed on the assumption that the probability of individuals surfing heterogeneous websites is equal, which does not correspond to reality. Thus, it is obvious to draw the following conclusions that centrality’s measures are then coordinated to the sorts of moves that they are suitable which implies a specific centrality is ideal for one application, yet is regularly imperfect for an alternate application. Despite that, methods mentioned above also has its’ own limitations and shortcomings. For instance, Freeman’s degree [1] focuses on a node’s local activity while the global activity is ignored and fails to describe the propagation of influence. Supposing that plenty of nodes are not included in other node pairs’ shortest path, consequently, the value of betweenness centrality will be zero. Since Katz centrality [2] takes all the paths between the nodes pairs in the process of calculating influence, its high computational complexity makes it hard to be applied in large-scale networks. Eigenvector centrality [4] owns slow convergence rate and may produce an endless loop. In addition, what is not often recognized by the neighborhood-based and path-based centrality measures mentioned above is that structural complexity and uncertainty plays a significant role in the analysis of network centrality. The graph entropy—the concept of which was first presented by Rashevsky [10] and Trucco [11]—has been applied extensively to evaluate networks’ structural complexity and uncertainty and describe social influence. Rashevsky treated the entropy of a graph G as its topological information content [10]. The value of graph entropy can be obtained by using various graph invariants such as the number of vertices [12], the vertex degree sequence [13] and extended degree sequences (i.e., second neighbor, third neighbor etc.) [14]. Bonchev [15] suggested that the structure of a given network can be treated as a consequence of an arbitrary function. Inspired by this novel insight, for a given network, Shannon’s information entropy is applied to compute its structural information content and measure its uncertainty. Since then, graph entropy based on Shannon’s theory plays an essential role in social networks analysis. However relatively little work [16,17,18] has been done to prove the efficiency of the application of Shannon’s theory to calculate network centrality.
Motivated by the above discussion, this paper is aimed to introduce a novel entropy centrality model based on decompositions of a graph into subgraphs and calculation on the entropy of neighbor nodes. By using entropy theory, the proposed method can be well qualified to depict the uncertain of social influence, consequently can be useful for detecting vital nodes. By quantifying the local influence of a node on its neighbors and the indirect influence on its two-hop neighbors (the definition of two-hop neighbor can be seen in Section 3), the proposed methods characterizes associations among node pairs and captures the process of influence propagation. We also provide the performance evaluation for our proposed model by using four real-world datasets and three artificial networks built by using Barabasi-Albert, Erdos-Renyi and Watts-Stroggatz. Other five methods including degree centrality, betweenness centrality, closeness centrality, eigenvector centrality and PageRank are also applied to the same selected networks for comparison. The extensive analytical results prove the effectiveness of the proposed model.
In the next section, we start our survey on centrality methods. In Section 3, we give a brief introduction of the definitions of graph. In Section 4 we provide an overview of Shannon’s entropy. In Section 5, we use entropy centrality to design an algorithm to quantify the influence of nodes in networks. In Section 6, we conduct experiments based on four real-world datasets with varied sizes and densities to validate the efficiency of the model presented by various models such as Barabasi-Albert, Erdos-Renyi and Watts-Stroggatz. Conclusion and future work of this paper can be seen in Section 7.

2. Literature Review

In this section, we investigated some of the most well-known methods that had been presented to identify the vital nodes in different network topologies such as the classical centrality measures and many other approaches. Diverse measures of centrality catch distinctive parts of what it implies for an actor to be “powerful” to the given networks. Thus, the definition of centrality varies from person to person. Freeman [1] argued that the centrality of a node could be determined by reference to any of three different structural attributes of that node: its degree, its betweenness, or its closeness. While degree centrality, the number of adjacencies for a node, is a straightforward index of the node’s activity; betweenness centrality, based upon the number of the shortest paths between pairs of other nodes that pass through the node is useful as an index of the potential of a node for network control; and closeness centrality, computed as the sum of shortest paths between the node and all other nodes, indicates its effectiveness or correspondence autonomy.
Katz [2] introduced a measure of centrality known as Katz centrality which computed influence by taking into consideration the number of walks between a pair of nodes. As noted by Katz, the attenuation factor α can be interpreted as the chance that an edge is effectively traversed. Also, the parameter α shows the relative significance of endogenous versus exogenous factors in the determination of centrality. Eigenvector centrality first suggested by Bonacich [4] has turned out to be one of symmetric network centrality’s standard measures and can identify the centrality power of a node in the light of the idea that associations with high-scoring nodes contribute more to the node’s score being referred to than rise to associations with low-scoring nodes. To deal with the condition of asymmetric network, Bonacich and Lloyd [5] supposed that the eigenvectors of asymmetric matrices were not orthogonal, so the equations were a bit different and conceptualized alpha centrality approach. Google’s PageRank [9], among others, is a case of alpha centrality. Stephenson and Zelen [6] defined the information centrality using the “information” contained in all possible paths between pairs of points. Estrada and Rodríguez-Velázquez [19] introduced the subgraph centrality which was obtainable mathematically from the spectra of the network’s adjacency matrix characterized the involvement of each actor in all subgraphs in the given network. A novel approach of centrality measuring based on game theoretical concepts could be found in Gómez et al. [20]. Gómez et al. [21] illustrated how to extend the classical betweenness centrality measure at the point when the issue is demonstrated as a bi-criteria network flow optimization issue. Newman [22] extended the conventional conception of betweenness which implicitly assumed that information spread only along those shortest paths and proposed a betweenness measure that relaxed this assumption, including contributions from essentially all paths between nodes, not just the shortest.
Recently, Du et al. [23] firstly introduced TOPIS as a mew measure of centrality. Gao et al. [24] improved the original evidential centrality by taking node degree distributions and global structure information into consideration. A novel measure of node influence based on comprehensive use of the degree method, H-index and coreness metrics was suggested by Lü et al. [25]. Considering the limitations of degree centrality and restriction of closeness centrality and betweenness centrality in large-scale networks, Chen et al. [26] proposed a semi-local centrality method. Also, Chen et al. [27] introduced a so-called ClusterRank method, which takes the influence of neighbor nodes and clustering coefficient into consideration. Zeng and Zhang [28] improved the established k-shell method by rethinking the significant connections between nodes and removed nodes and proposed a mixed degree decomposition method. Pei et al. [29] confirmed that the most influential actors are situated in the k-core across disparate social platforms. Martin et al. [30] made the point that the eigenvector centrality has lost the capacity to distinguish among the remaining nodes and introduced an alternative centrality definition called nonbacktracking centrality. The LeaderRank algorithm was modified by introducing a variant based on allocating degree-dependent weights onto associations constructed by ground nodes [31]. Zhao et al. [32] identified the most effective spreaders by using community-based theory. Consequently, the network is divided into serval independent sets with different colors. Min et al. [33] studied the human behavior and concluded that individuals who play a significant role in connecting various communities is expected to be an effective spreader of influence. Gleich [34] provided a comprehensive summary of the areas in which PageRank can be applied. Lü et al. [35] conducted a perturbative analysis in the adjacency matrix and explained centrality from the perspective of link predictability. Morone and Makse [36] recommended that the problem of finding the minimal set of influential spreaders can be cleverly mapped onto optimal percolation in networks.
Motivated by the original work owing to Shannon [37], Rashevsky [10] first studied the relations between the topological properties of graphs and their information content and introduced the concept of graph entropy. Mowshowitz [38] defined a measure of the structural information content of a graph and explored its mathematical properties. Since then, entropy measures are utilized to investigate networks’ structural complexity and play an essential part in varieties of application fields, including biology, chemistry and sociology. Everett [39] presented a new concept of role similarity generated from structural equivalence and introduced a new measure of structural complexity based on the entropy measure developed by Mowshowitz [38]. With the purpose of acquiring a continuous quantitative measure of robot team diversity, Balch [40] developed the concept of hierarchic social entropy—an application of Shannon’s information entropy metric to robotic groups. Tutzauer [41] offered an entropy-based measure of centrality that is suitable for traffic propagating by flows along paths and proved its extensive applicability. Emmert-Streib and Dehmer [42] elaborated the idea of calculating hierarchical structures’ topological entropy by assigning two probability distributions—for nodes and for edges—and proved that these entropic measures could be computed efficiently. Inspired by small scale-free networks’ discussion, the off-diagonal complexity (OdC) was proposed by Claussen [43] as a novel approach to quantify the complexity of undirected networks. For deriving graph entropy measures, Dehmer [44] outlined a different approach which took use of means of certain information functions to allocate a probability value to each node in a given graph. Kim and Wilhelm [45] presented various measures that could compute this complexity, such as the relative number of non-isomorphic one-edge-deleted subgraphs, denoted as C 1 e . Anand and Bianconi [46] illustrated how to characterize a network ensemble’s Shannon entropy and how it was connected with the Gibbs and von Neumann entropies of network ensembles. Dehmer and Mowshowitz [14] provided a more extensive overview on methods for measuring the entropy of graphs and demonstrated the wide applicability of entropy measures.
In a more recent contribution, Cao and Dehmer [16] showed a new graph entropy measure which depends on the number of vertex by introducing arbitrary information functional and investigated its’ mathematical properties. Furthermore, Cao and Dehmer [47] proved further extremal properties of the re-defined graph entropies. Chen and Dehmer [17] proved bounds for entropies based on the study of Cao and Dehmer [16] and came up with interrelations between different measures. Nikolaev et al. [18] presented a measure of centrality as flow destination’s entropy in a random walk flow with Markovian property. Nie et al. [48] investigated strategies for network attack and established a new design known as mapping entropy (ME) to recognize the significance of a node in the complex network based on the knowledge of the neighbors of a node. Fei and Deng [49] addressed the problem of how to identify influential nodes in complex networks by using relative entropy and the TOPSIS method, which combines the advantages of existing centrality measures and demonstrated the effectiveness of the proposed method based on experimental results. Peng et al. [50] characterized the features of mobile social networks and presented an evaluation model to quantify influence by analyzing and calculating the friend entropy and communication frequency entropy between users to depict the uncertainty and complexity of social influence.

3. Preliminaries

Given an undirected, unweighted graph G ( V , E ) , where V represents finite, nonempty set of nodes (vertices) and E are the set of edges. It is known that if e i j E , which means node i is adjacent to node j . Furthermore, node j is known as the neighbor of node i . The neighborhood of i V is the set of the neighbors of i V . Also, we can use the incidence matrix to characterize the incident relationship between nodes. The elements of incidence matrix b i j has two values which is 1 and 0, described as follows.
b i j = { 1 ,      if   i   and   j   are   connected   with   e i j 0 ,      otherwise
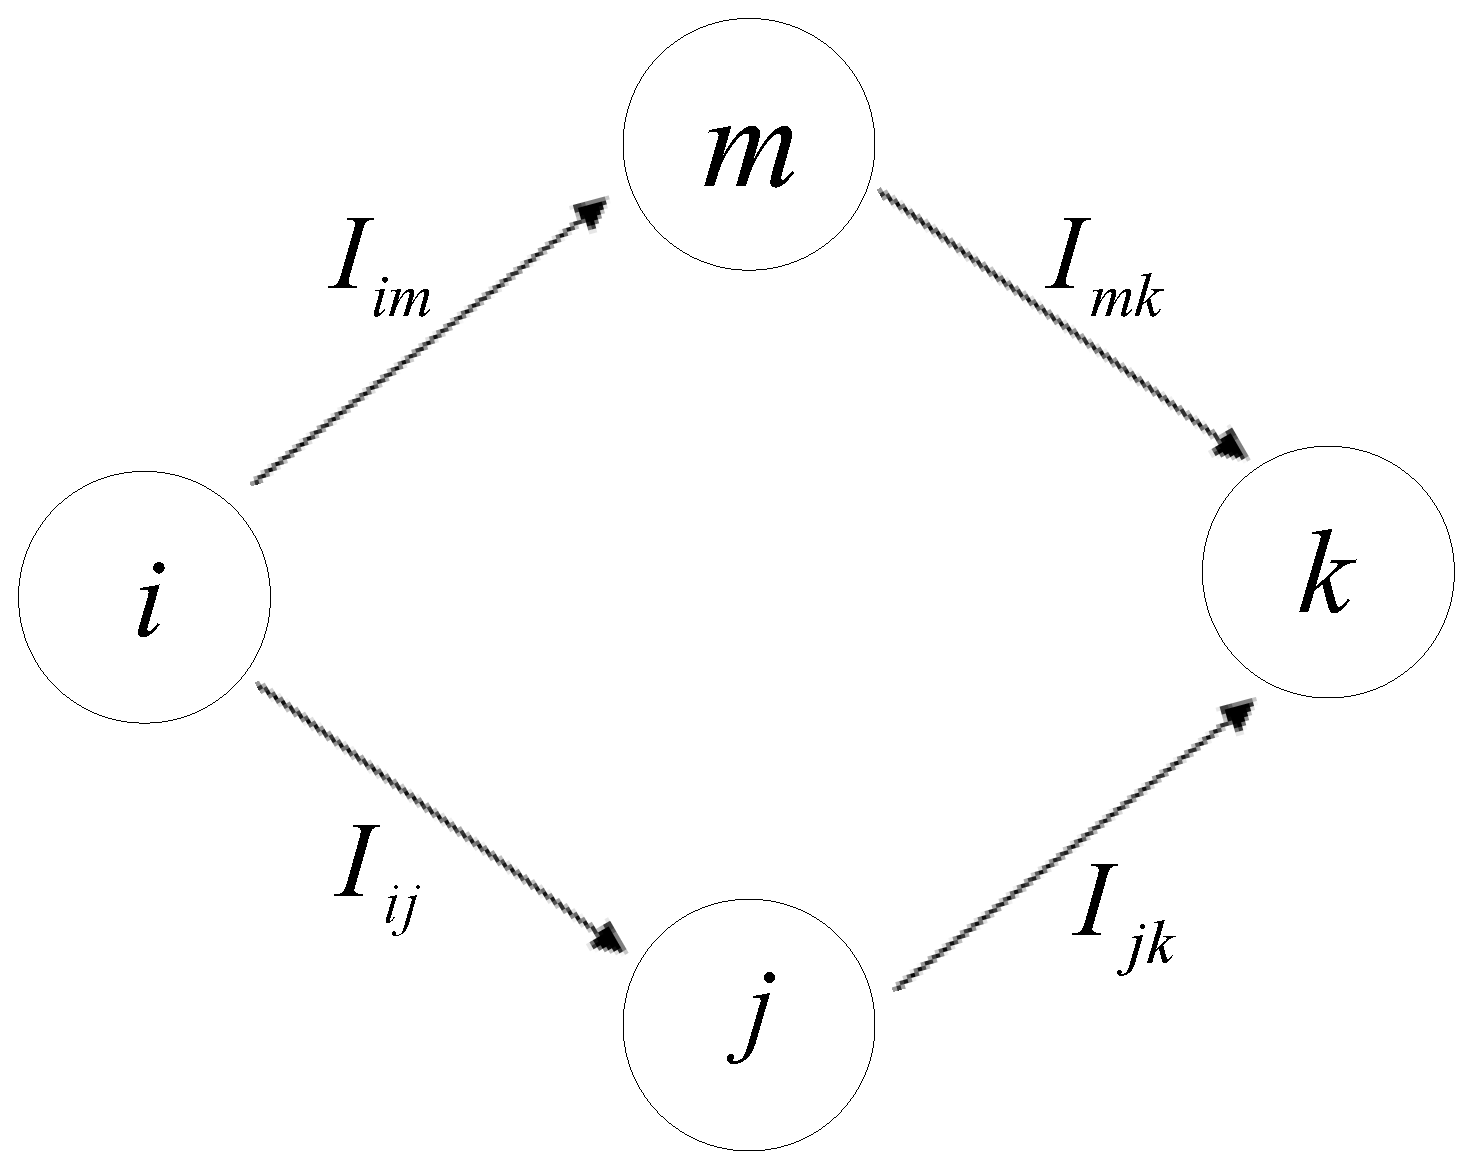
Now we introduce the definition of one-hop neighbors and two-hop neighbors. Given a directed or undirected graph G ( V , E ) with V nodes and E edges, if node i and node j are directly connected with edge e i j , namely, b i j = 1 , we call node i and node j are one-hop neighbors. That means node i only need to perform a simple one-hop jump in order to reach node j . The idea is inspired by wireless multi-hop network. In wireless multi-hop networks, node communicates neighbor nodes within its communication range. Consistent with wireless multi-hop networks, in social network, because of limited social power, individuals construct connections only with other individuals located in the neighborhood area or in so called local-world. Motivated by the above discussions, we now suppose that if node i and j are directly linked in the network, i possesses the effective power to influence j . Then the local influence of node i on its adjacent nodes can be defined as L I i . Analogously consider a connected network represented by graph G ( V , E ) with V nodes and E edges, if node i and node k are not directly connected, namely, b i j = 0 , while node i and k have common neighbor node j , which means there is a path from node i to k , that is,   i has one two-hop neighbor node k , or k has one two-hop neighbor node i . Communication or information transmission is achieved by two hops between node i   and k . Similarly, individual i has the capability to affect the way that k thinks or behaves through influencing their common neighbor node j and vice versa. According to the above analysis, thus the indirect impact of node i having on its two-hop neighbors can be defined as I I i . So, a network represented by a responding graph G ( V , E ) can be decomposed into sub-network, which is constructed by nodes and its’ neighbors. Based on these mathematical preliminaries, we present the following model to assess the power of each node via degree-based entropies.

4. Preliminaries of Information Entropy

We start this section by stating definition of Shannon’s entropy. of Given discrete random variables X with possible values x i whose probabilities of occurrence are p i ,   i = 1 , , n , namely, 0 p i 1 and i = 1 n p i = 1 , the entropy H of X is defined as follows [37].
H ( X ) = i = 1 n p i l o g b p i
Commonly 2, 10 and e is chosen to be the base of the logarithm. Dehmer suggested introducing a non-negative integer’s tuple ( λ 1 , λ 2 , , λ n ) in order to form a probability distribution p = ( p 1 , p 2 , , p n ) which is described as follows [12].
p i = λ i j = 1 n λ j    i = 1 , 2 , , n
where λ i represents the ith non-negative integer. Thus, the entropy can be written as
H ( X ) = i = 1 n p i l o g b p i = l o g b ( i 1 n λ i ) i = 1 n λ i j = 1 n λ j l o g b λ i
In the literature, Bonchev and Trinajstić [51] introduced a magnitude-based information measure to obtain the tuple ( λ 1 , λ 2 , , λ n ) . Also, Dehmer [12,52] proposed a partition-independent graph entropies approach which used an arbitrary information functional to capture the structural information of graphs. Recently, Cao et al. [16,47] defined an information functional based on degree powers of graphs. In this paper, a novel approach is introduced to get the tuple ( λ 1 , λ 2 , , λ n ) by using degree centrality. We are now ready to propose the evaluation model on nodes’ influence to reveal the characteristics of interactions among nodes.

5. Model Description

5.1. Computing on Local Influence

Let G ( V , E ) be an undirected, unweighted graph with V vertices and E edges. For a vertex v i V , v i and its one-hop neighbor which belongs to the one-hop neighbor set M of node v i construct a sub-network represented by a subgraph G i .
Definition 1.
The subgraph degree centrality (SDC) measure of node i and its one-hop neighbor node j in G i , denoted as S D C i , is defined as:
S D C i = j M b i j
where M is the number of one-hop neighbors of node i . And b i j = 1 , if there is an edge between node i and node j , otherwise, the value of b i j will be 0 . Notice that S D C i = D C i , where node i is the central node in the subgraph G i . Observe that i = 1 n p i = 1 in Equation (1), hence, the quantities p i can be interpreted as vertex probabilities. We now obtain one definition of the tuple ( λ 1 , λ 2 , , λ M + 1 ) , described as follows.
λ i = S D C i
Based on our definition, λ i which reflects the number of one-hop neighbors of node i can be interpreted as a measure of immediate influence. Generally, the scale of λ i is a reliable index to measure the power of a node in a given subgraph or so-called local world. As a result, the local influence of node i on its one-hop neighbors, denoted as L I i which equals the entropy of neighbor nodes I i n for node i is depicted as follows.
L I i = I i n = l o g b ( i 1 M + 1 S D C i ) i = 1 M + 1 S D C i i M + 1 S D C i l o g b S D C i

5.2. Computing on Indirect Influence

Consider a connected network represented by graph G ( V , E ) , if i has one two-hop neighbor node k , as discussed above, let N i k represent the common one-hop neighbor nodes between i and k . It is evident that N i k also denotes the number of paths from node i to k . Now assuming that node j is one of common neighbor nodes between i and k , we have already calculated the L I i and L I j based on our proposed model. Here is the question: how to quantify the influence of node i on k . In this paper, we treat L I i as influential probability of i on its one-hop neighbors, consequently, the higher of value of L I i , the more powerful effect of i on its one-hop neighbors. Let us take N i k = 1 for example, which means there is a path from node i to k . Thus, the indirect influence of node i on k is described as follows.
I I i k = I i j × I j k = L I i × L I j
Likewise, if N i k = 2 , there are two paths from node i to k , which is shown in Figure 1.
Suppose we grant both path the same weight, accordingly, the indirect influence of node i on k is described as follows.
I I i k = I i j × I j k + I i m × I m k 2 = L I i × L I j + L I i × L I m 2
Evidently, assumption that each path holds the equal weight will lead to
I I i k = k = 1 N i k L I i × L I j N i k
Respectively, the indirect influence of node i denoted as I I i is expressed as follows.
I I i = k = 1 M i I I i k M i
where M i indicates the number of i ’s two-hop neighbor nodes.
The idea that we consider two-hop subgraphs to quantify the indirect influence of each node is initially motivated by the three degrees of influence rule, the seminal work done by Christakis and Fowler [53,54]. Extensive exploration of various large datasets reveals that there is evidence that the association decays within a few degrees across networks [54]. Also, researchers like Brown [55] and Singh [56] reached a similar conclusion—that meaningful impacts can no longer be detected beyond a boundary of three degrees. Furthermore, Bliss et al. [57] made the point that happiness can be clustered to three degrees of separation by analyzing twitter datasets. Interestingly, Christakis confirmed that clustering of divorce to two degrees of separation [58] and clustering of sleep and drug use to four degrees of separation [59]. Thus, what matters most is not the true value of separation but the decay in the detectable influence individuals may have on others. With respect to the decline in meaningful impacts in social network, Christakis gave a reasonable explanation that relationships could be cut which makes associations beyond three degrees unstable [54]. In this paper, we assume that we could not affect nor be affected by people at three degrees and beyond. Let us take Figure 2 for example. Figure 2 depicts a simple friendship network with 5 nodes. The links represent the friendship. The assumption discussed above indicates that Bob might not influence nor be influenced by Naomi or Peter. In conclusion, the two degrees of influence that is used in this research is suitable for characterizing a decline in a meaningful effect to the extent where the effect cannot be detected and depicting the process of influence propagation.
On the basis of the above illustration, the overall influence of node i , denoted as I i can be calculated by Equation (12) as follows.
I i = ω 1 L I i + ω 2 I I i
where ω 1 and ω 2 the weight of the local influence and indirect influence. Note that ω 1 + ω 2 = 1 .
Algorithm 1 shows the computing process of power for all nodes.
Algorithm 1 Influence calculating algorithm
Input: A connected network represented by graph G ( V , E ) with V vertices and E edges.
Output: The overall influence of node i .
for i = 1 to V do
identify the subgraph G i constructed by node i and its one-hop neighbors;
calculate the local influence of node i on its one-hop neighbors using Equation (7);
calculate the indirect influence of node i using Equation (11);
calculate the overall influence of node i using Equation (12);
end for

5.3. Example Explanation

To illustrate how to identify influential nodes based on Algorithm 1, a small network is constructed to show the detailed steps of the proposed method as an example. The constructed network is shown in Figure 3.
Let us take node 1 for example, the subgraph G i constructed by node 1 and its one-hop neighbors is shown in Figure 4. Firstly, the values of S D C i of each node are calculated and the results are shown in Table 1.
Then, we set b = 10 , hence, the entropy of neighbor nodes I 1 n is obtained by Equation (7) as follows.
L I 1 = I 1 n = l o g 10 ( i 1 4 S D C i ) i = 1 4 S D C i i 4 S D C i l o g 10 S D C i = 0.5737
Next, using Equation (11), the indirect influence of node 1 denoted as I I 1 is given by: I I 1 = ( L I 1 × L I 2 + ( L I 1 × L I 2 + L I 1 × L I 4 + L I 1 × L I 6 ) / 3 + L I 1 × L I 6 ) / 3 = 0.3584 .
At last, In the light of Equation (12), we set specific values for ω 1 and ω 2 : ω 1 =   0.6   and   ω 2 =   0.4 . The overall influence of node 1 denoted as I 1 can be computed as follows.
I 1 = ω 1 L I 1 + ω 2 I I 1 = 0.4876
According to above illustration, the overall influence of each node can be obtained and the results is listed in Table 2. Based on the value of overall influence for each node, the ranking results are illustrated in Table 3.

6. Performance Evaluation

To verify the efficiency of the proposed model, in this paper, we conduct several experiments on real social network data and compare with other centrality models to examine the relative drawbacks and disadvantages. The experiment is conducted using four datasets with varying sizes and densities including: (i) Zachary’s karate club (for more details, see [60]): in Zachary’s study [60], 34 members of a university-based karate club were observed for a period of three years, from 1970 to 1972. Also, the network was built on the basis of friendships between members; (ii) USAir97 (The data can be downloaded from http://mrvar.fdv.uni-lj.si/pajek/): the undirected network, which is constructed by 332 nodes and 2126 edges, depicts the direct air line between American airports. Each node indicates an airport and an edge represents a direct route between the two airports; (iii) Co-authorships in network science [61]: the undirected network compiled by M. Newman reflects collaboration of scientists engaged in research of network theory; (iv) E-mail network URV: the social network describes email exchanges among users in University at Rovira i Virgili [62].
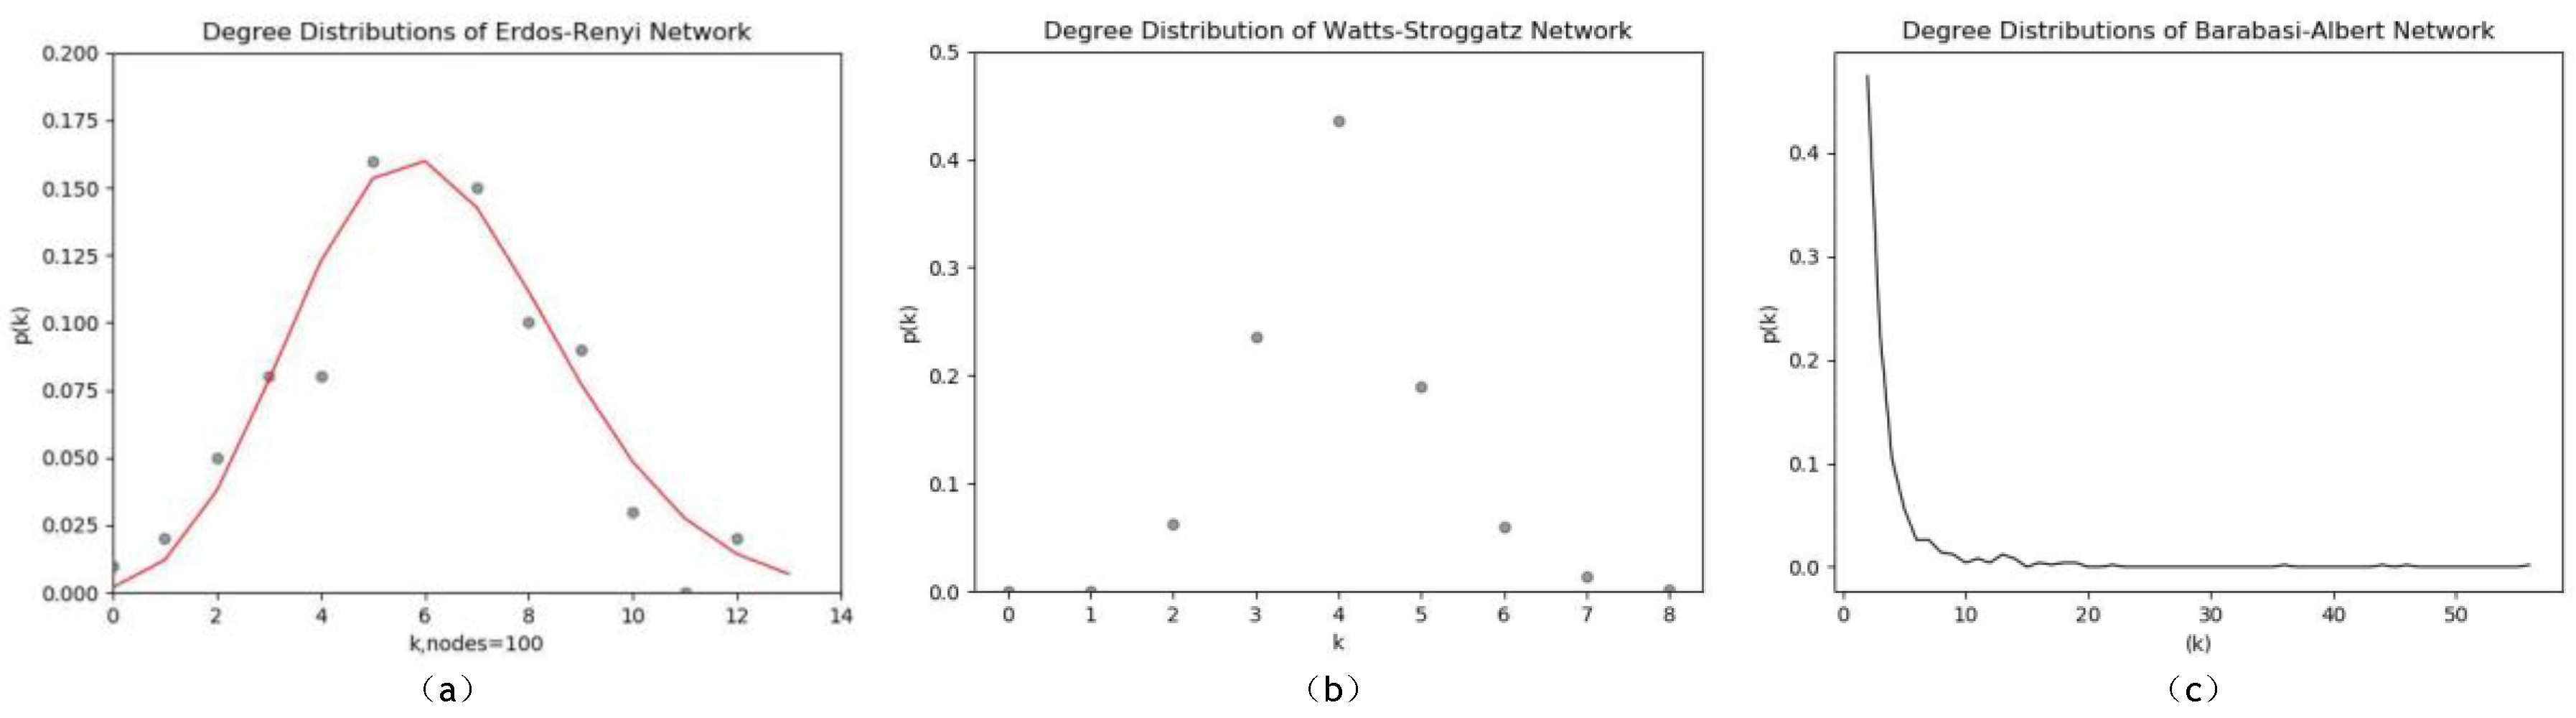
We also analyze how the proposed method works for artificial networks modeled by the following three models including: Erdos-Renyi, Watts-Stroggatz and Barabasi-Albert. The description of the three artificial networks are stated as follows: (i) Erdos-Renyi graph in G ( 100 , 0.0625 ) . The network consists of 100 nodes and 308 edges; (ii) A small world network constructed by using Watts-Stroggatz model. The network has 500 nodes and 1000 edges. Each node in this network owns 5 neighbors and the random reconnection probability is 0.3; (iii) We generate a Barabasi-Albert scale-free network with 500 nodes, 996 edges. Degree distributions of the three artificial networks are illustrated in Figure 5.
In order to evaluate the efficiency of the proposed model, other five classical centrality measures which comprise Degree Centrality (DC), Betweenness Centrality (BC), Closeness Centrality (CC), Eigenvector Centrality (EC) and PageRank (PR) are also applied to the same networks for comparison. First, we employ the proposed model and the other measures mentioned above to identify the ten most vital nodes of the karate club network. The results are shown in Table 4. Similarly, the results of the remaining networks are shown in Table 5, Table 6, Table 7, Table 8, Table 9 and Table 10 respectively.
According to the results shown in Table 4, in karate club network there are eight and nine same nodes between the proposed method and BC and CC in the top-10 list. Furthermore, the proposed method shares the same nine nodes with EC. Note that the top 10 nodes are the same using the proposed methods, DC approach and PR measure. It can be concluded that the top-10 ranked nodes categorized by our proposed model are more vital than other nodes in the karate club network. Based on the result shown in Table 5, in UsAir97 network, the number of the same nodes in the top-10 list between the proposed model and other five centrality measures is nine, five, seven and seven, respectively in DC, BC, CC and PR. It is worth noting the top 10 nodes are the same using the proposed methods and EC measure. In collaboration network, the seven same nodes are identified by the proposed model and PR. What’s more, the proposed model and EC has detected the same top 4 nodes. In addition, the fact that the 10 most vital nodes are the same based on the DC and proposed methods is really noteworthy. In E-mail network URV, five same nodes in the top-10 list are identified by the proposed model, EC, DC as well as PR. Furthermore, the most influential node is the same by using the proposed model, EC, DC and PR.
As is shown in Table 8, in Erdos-Renyi network, in comparison with the proposed model and DC, CC or BC, there are seven same actors in the top-10 list. Moreover, there are eight same nodes in the top-10 list between the proposed model and BC. The top-3 lists applying DC, BC, CC, PR and the proposed model are the same. In Watts-Stroggatz network, in comparison with the proposed model and DC, PR or EC, there are five same actors in the top-10 list. Also, the most vital nodes are the same by using DC, EC, PR and the proposed model. In Barabasi-Albert network, the fact the 10 most influential nodes identified by PR, BC, DC and the proposed model are the same is notable. Also, the number of the same actors in the top-10 list between the proposed model and the other two measures are eight and nine, respectively in EC and CC. As deliberated above, it can be concluded that the proposed method is proved to be effective on identifying the ten most influential nodes in the selected networks.
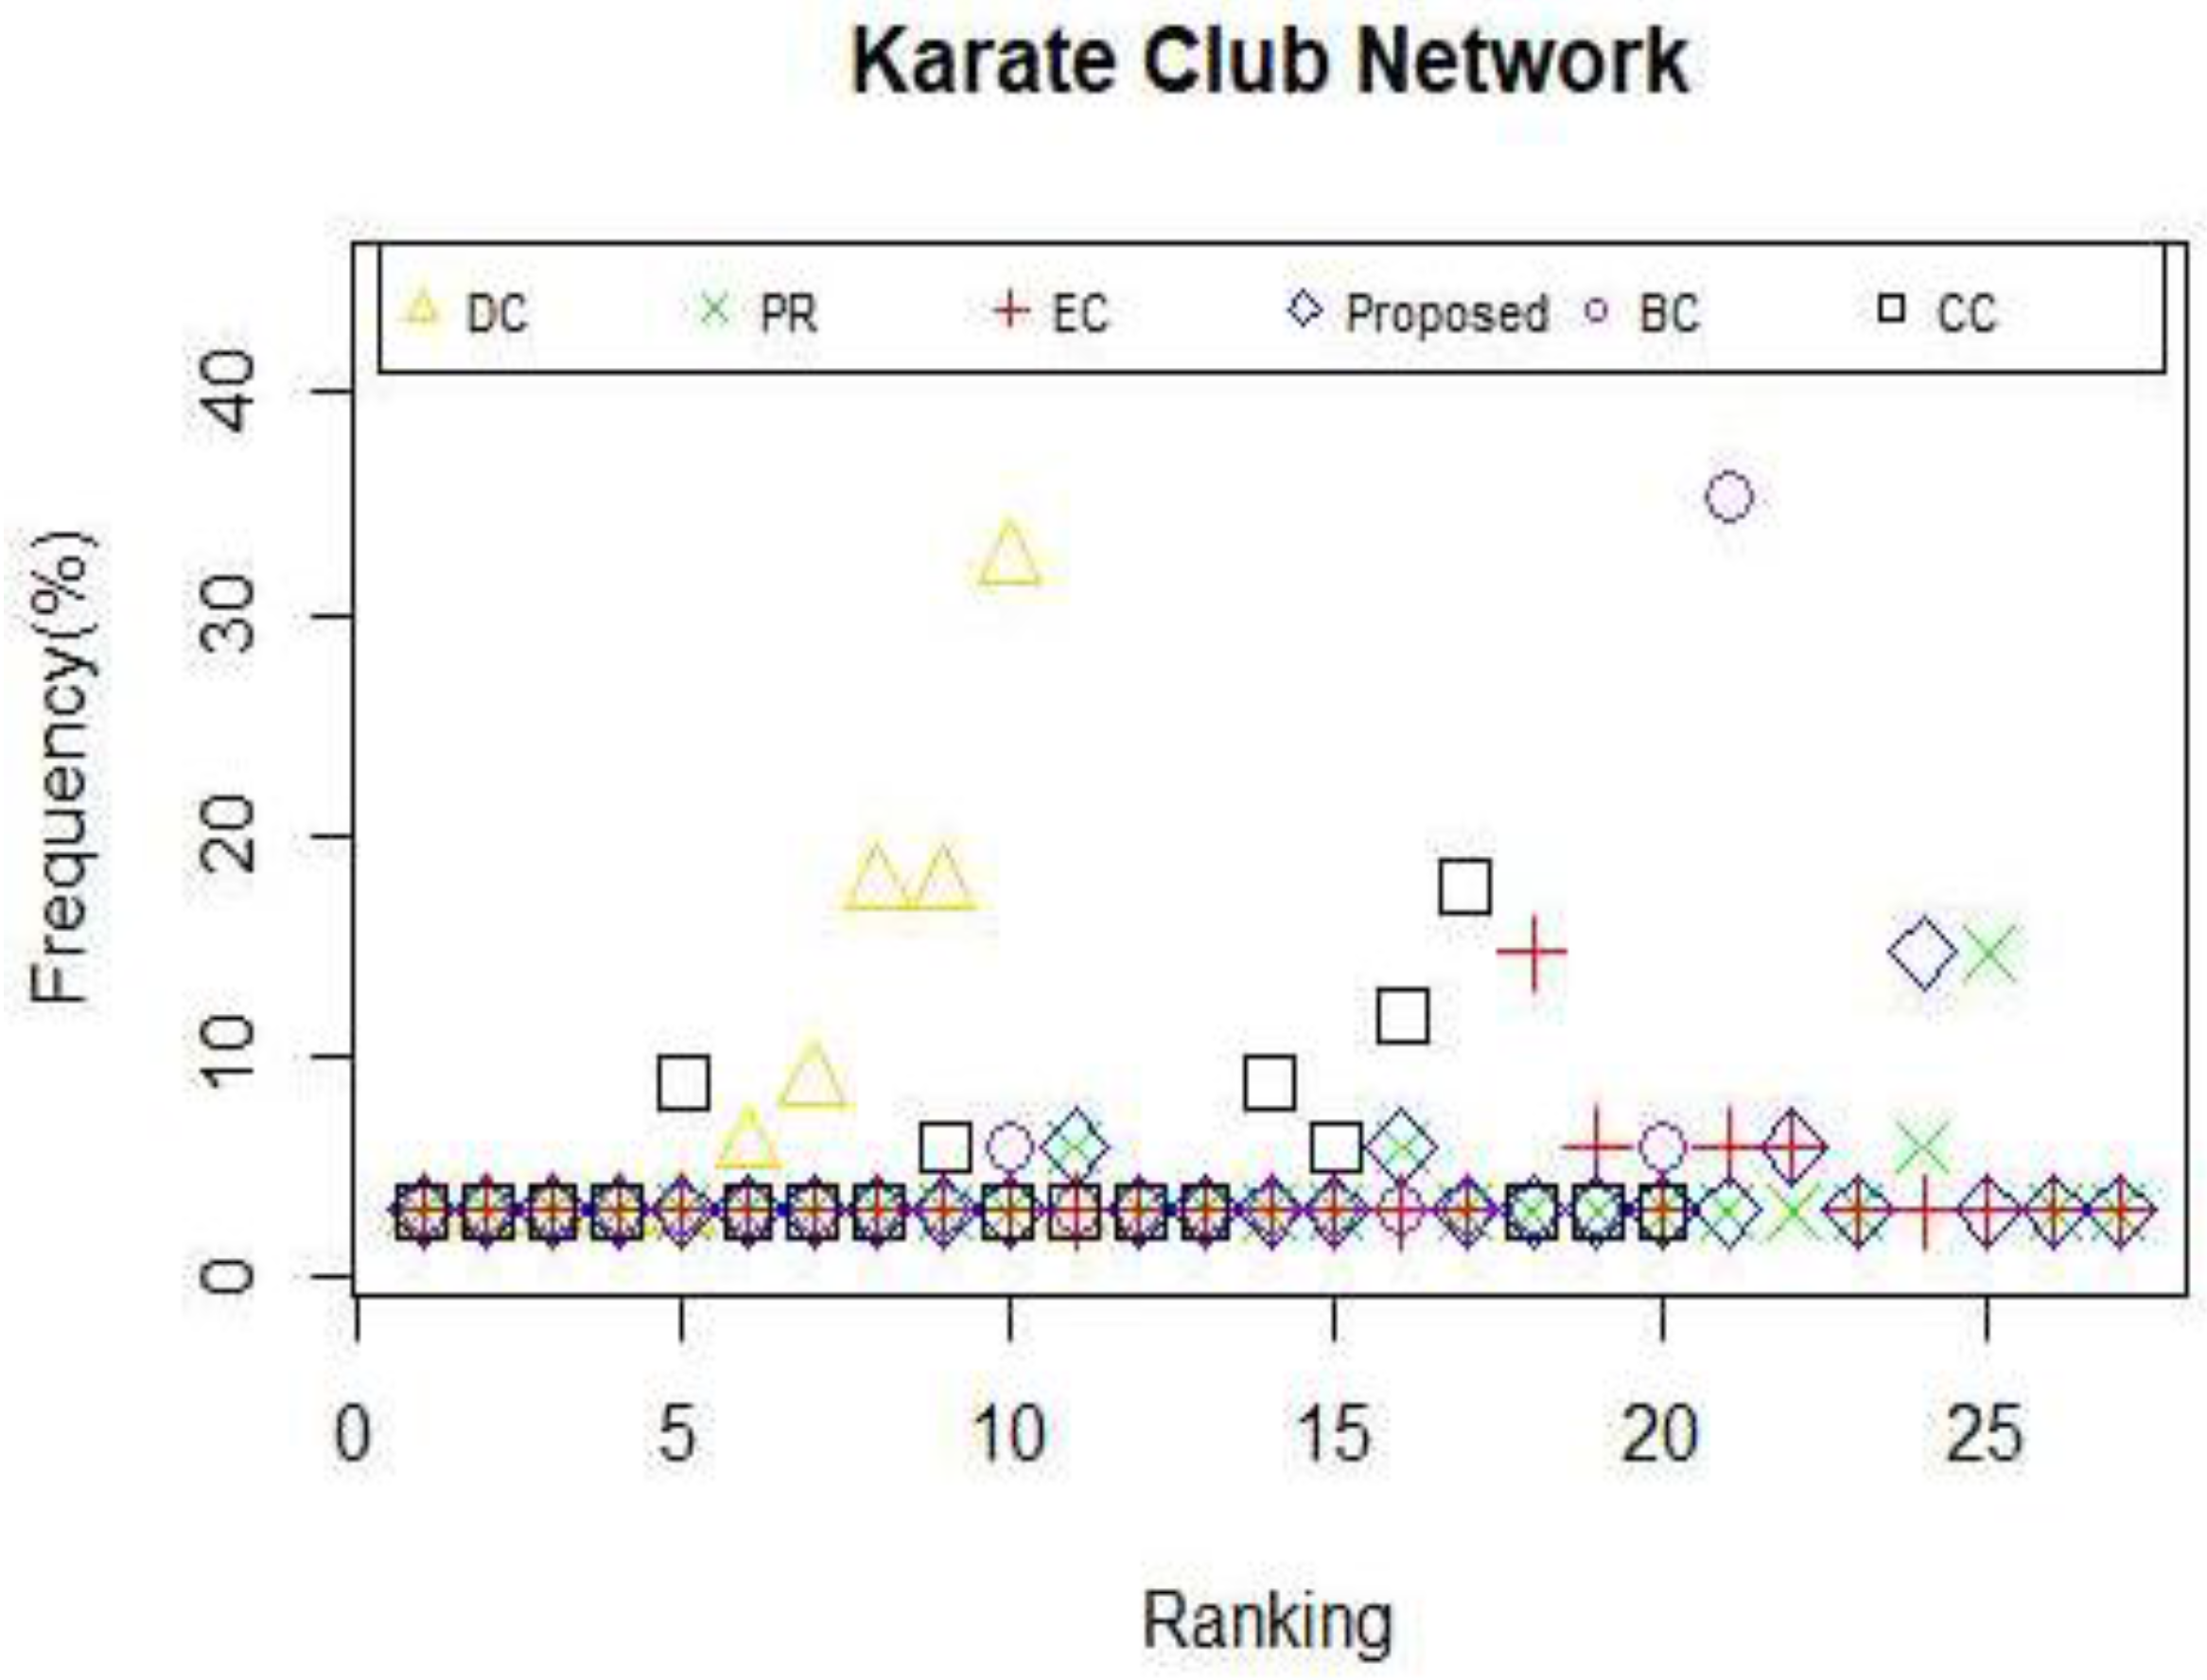
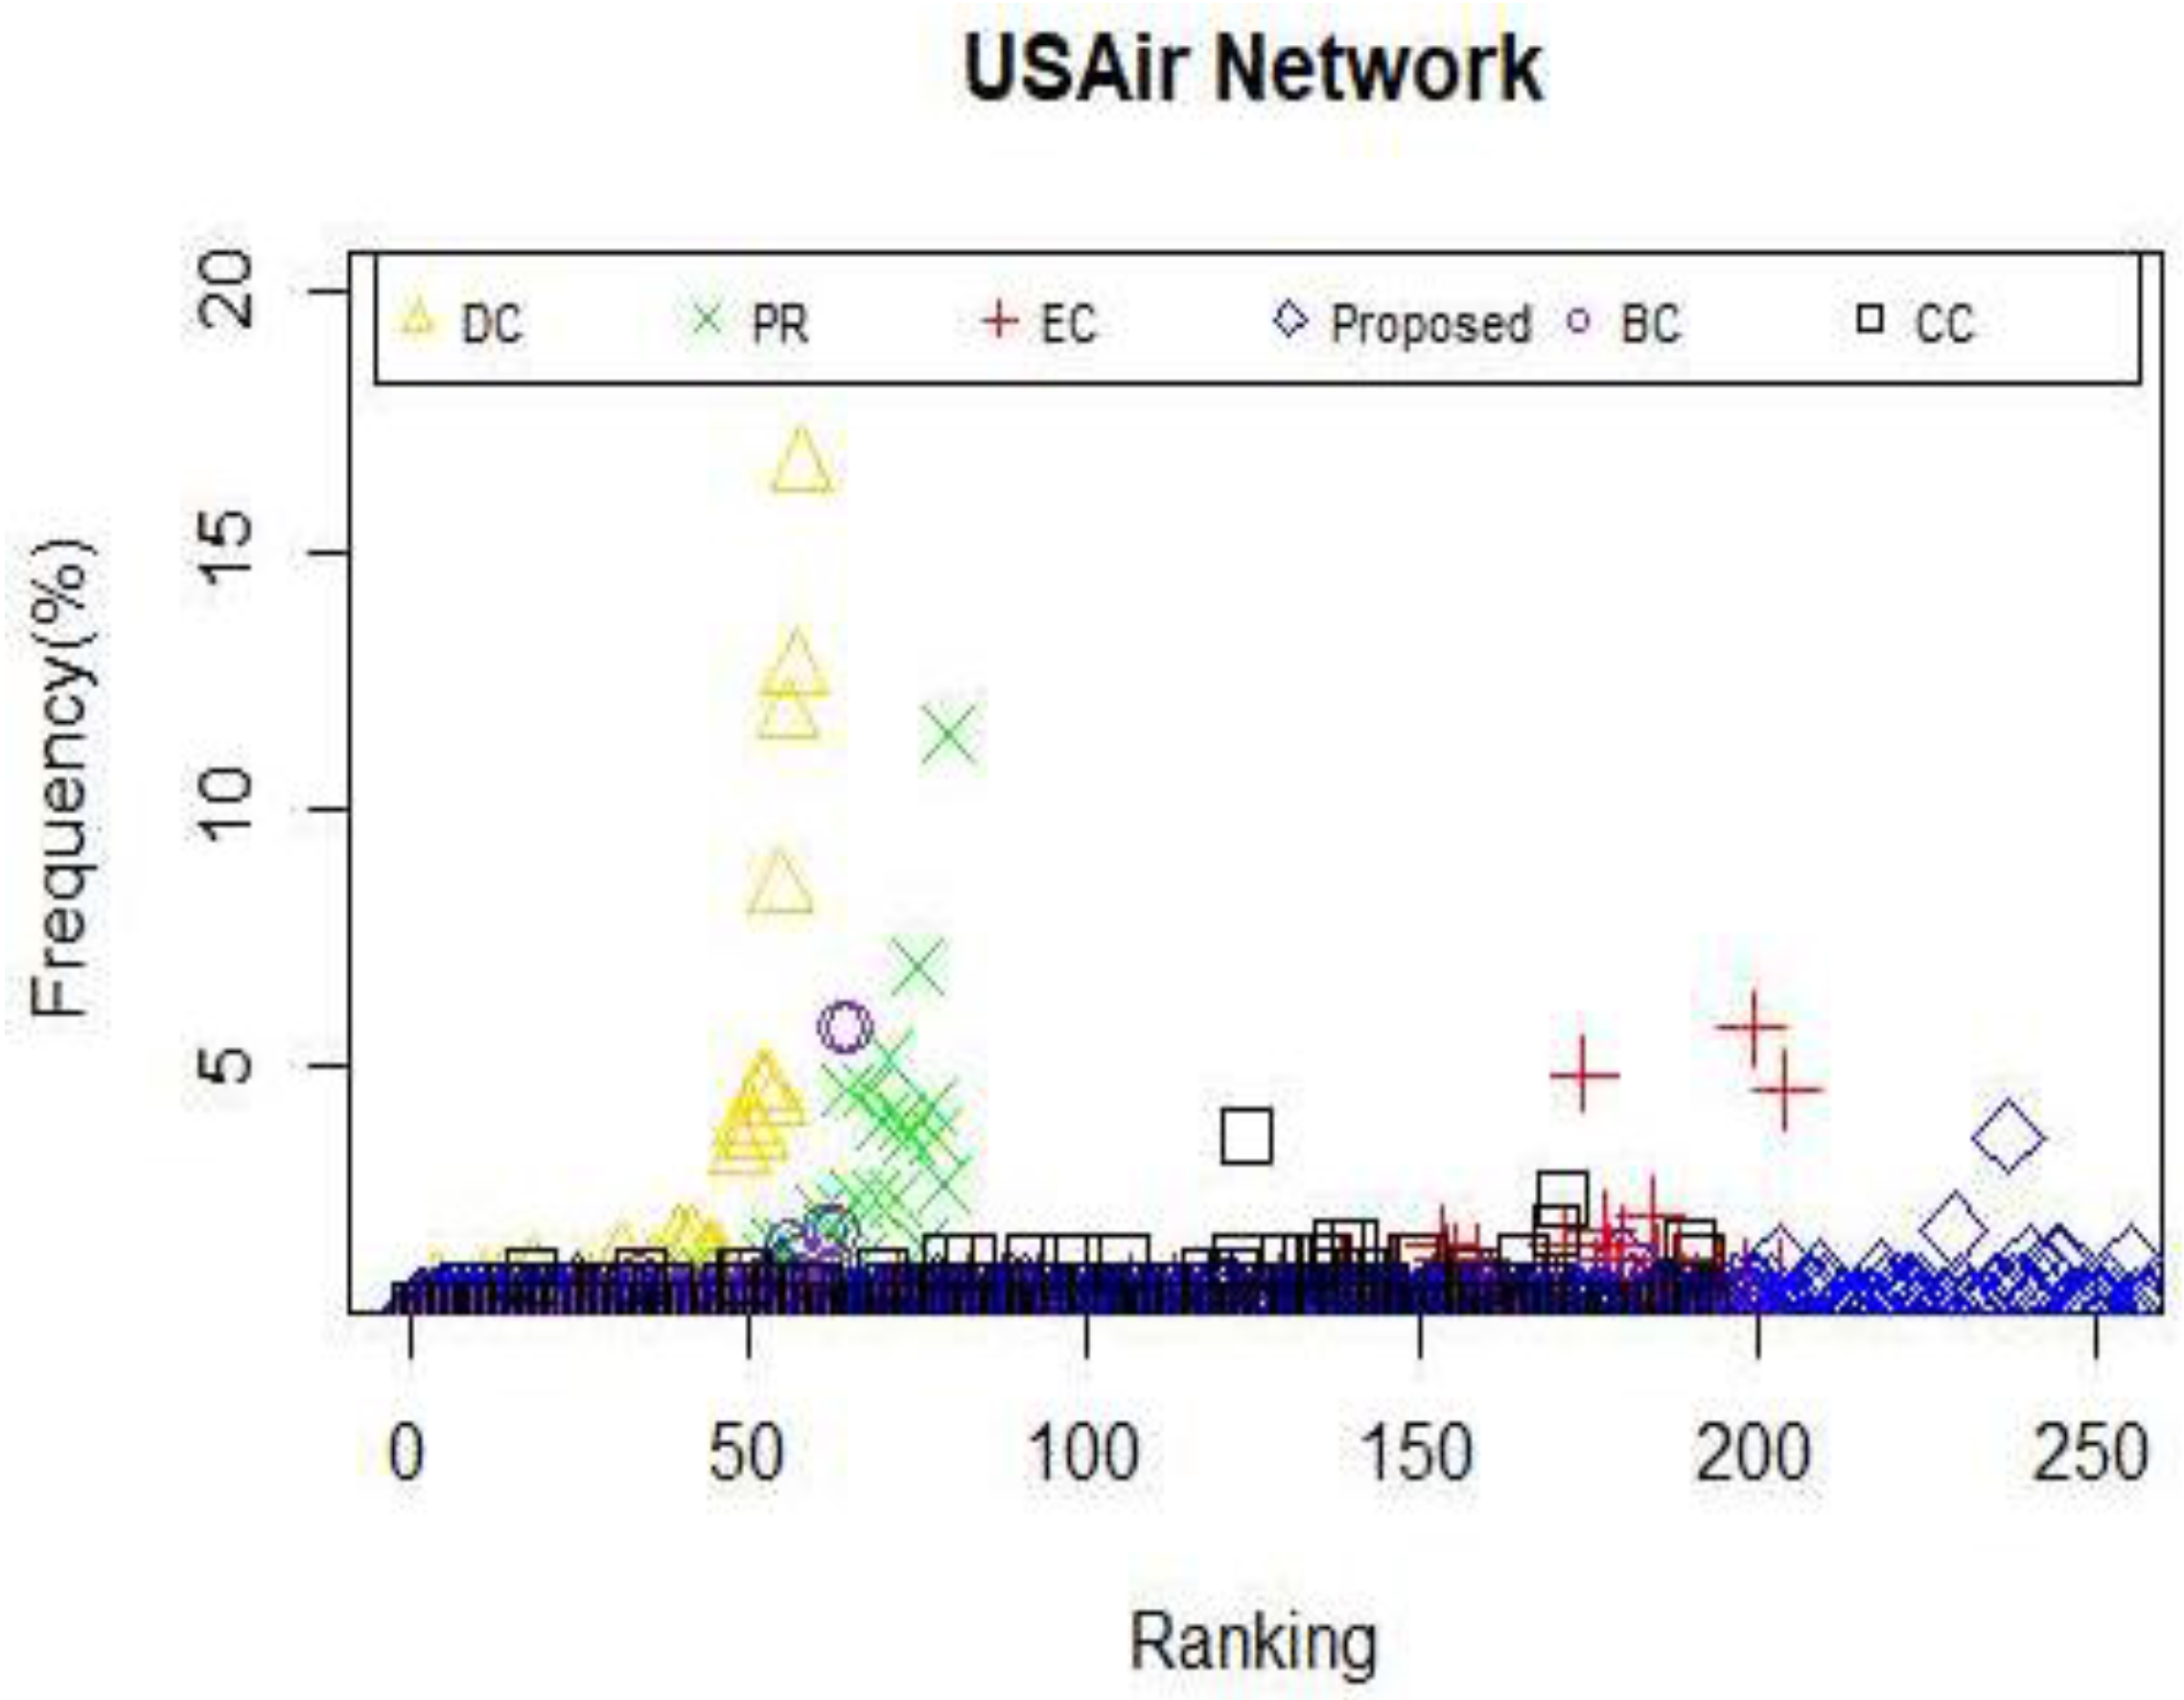
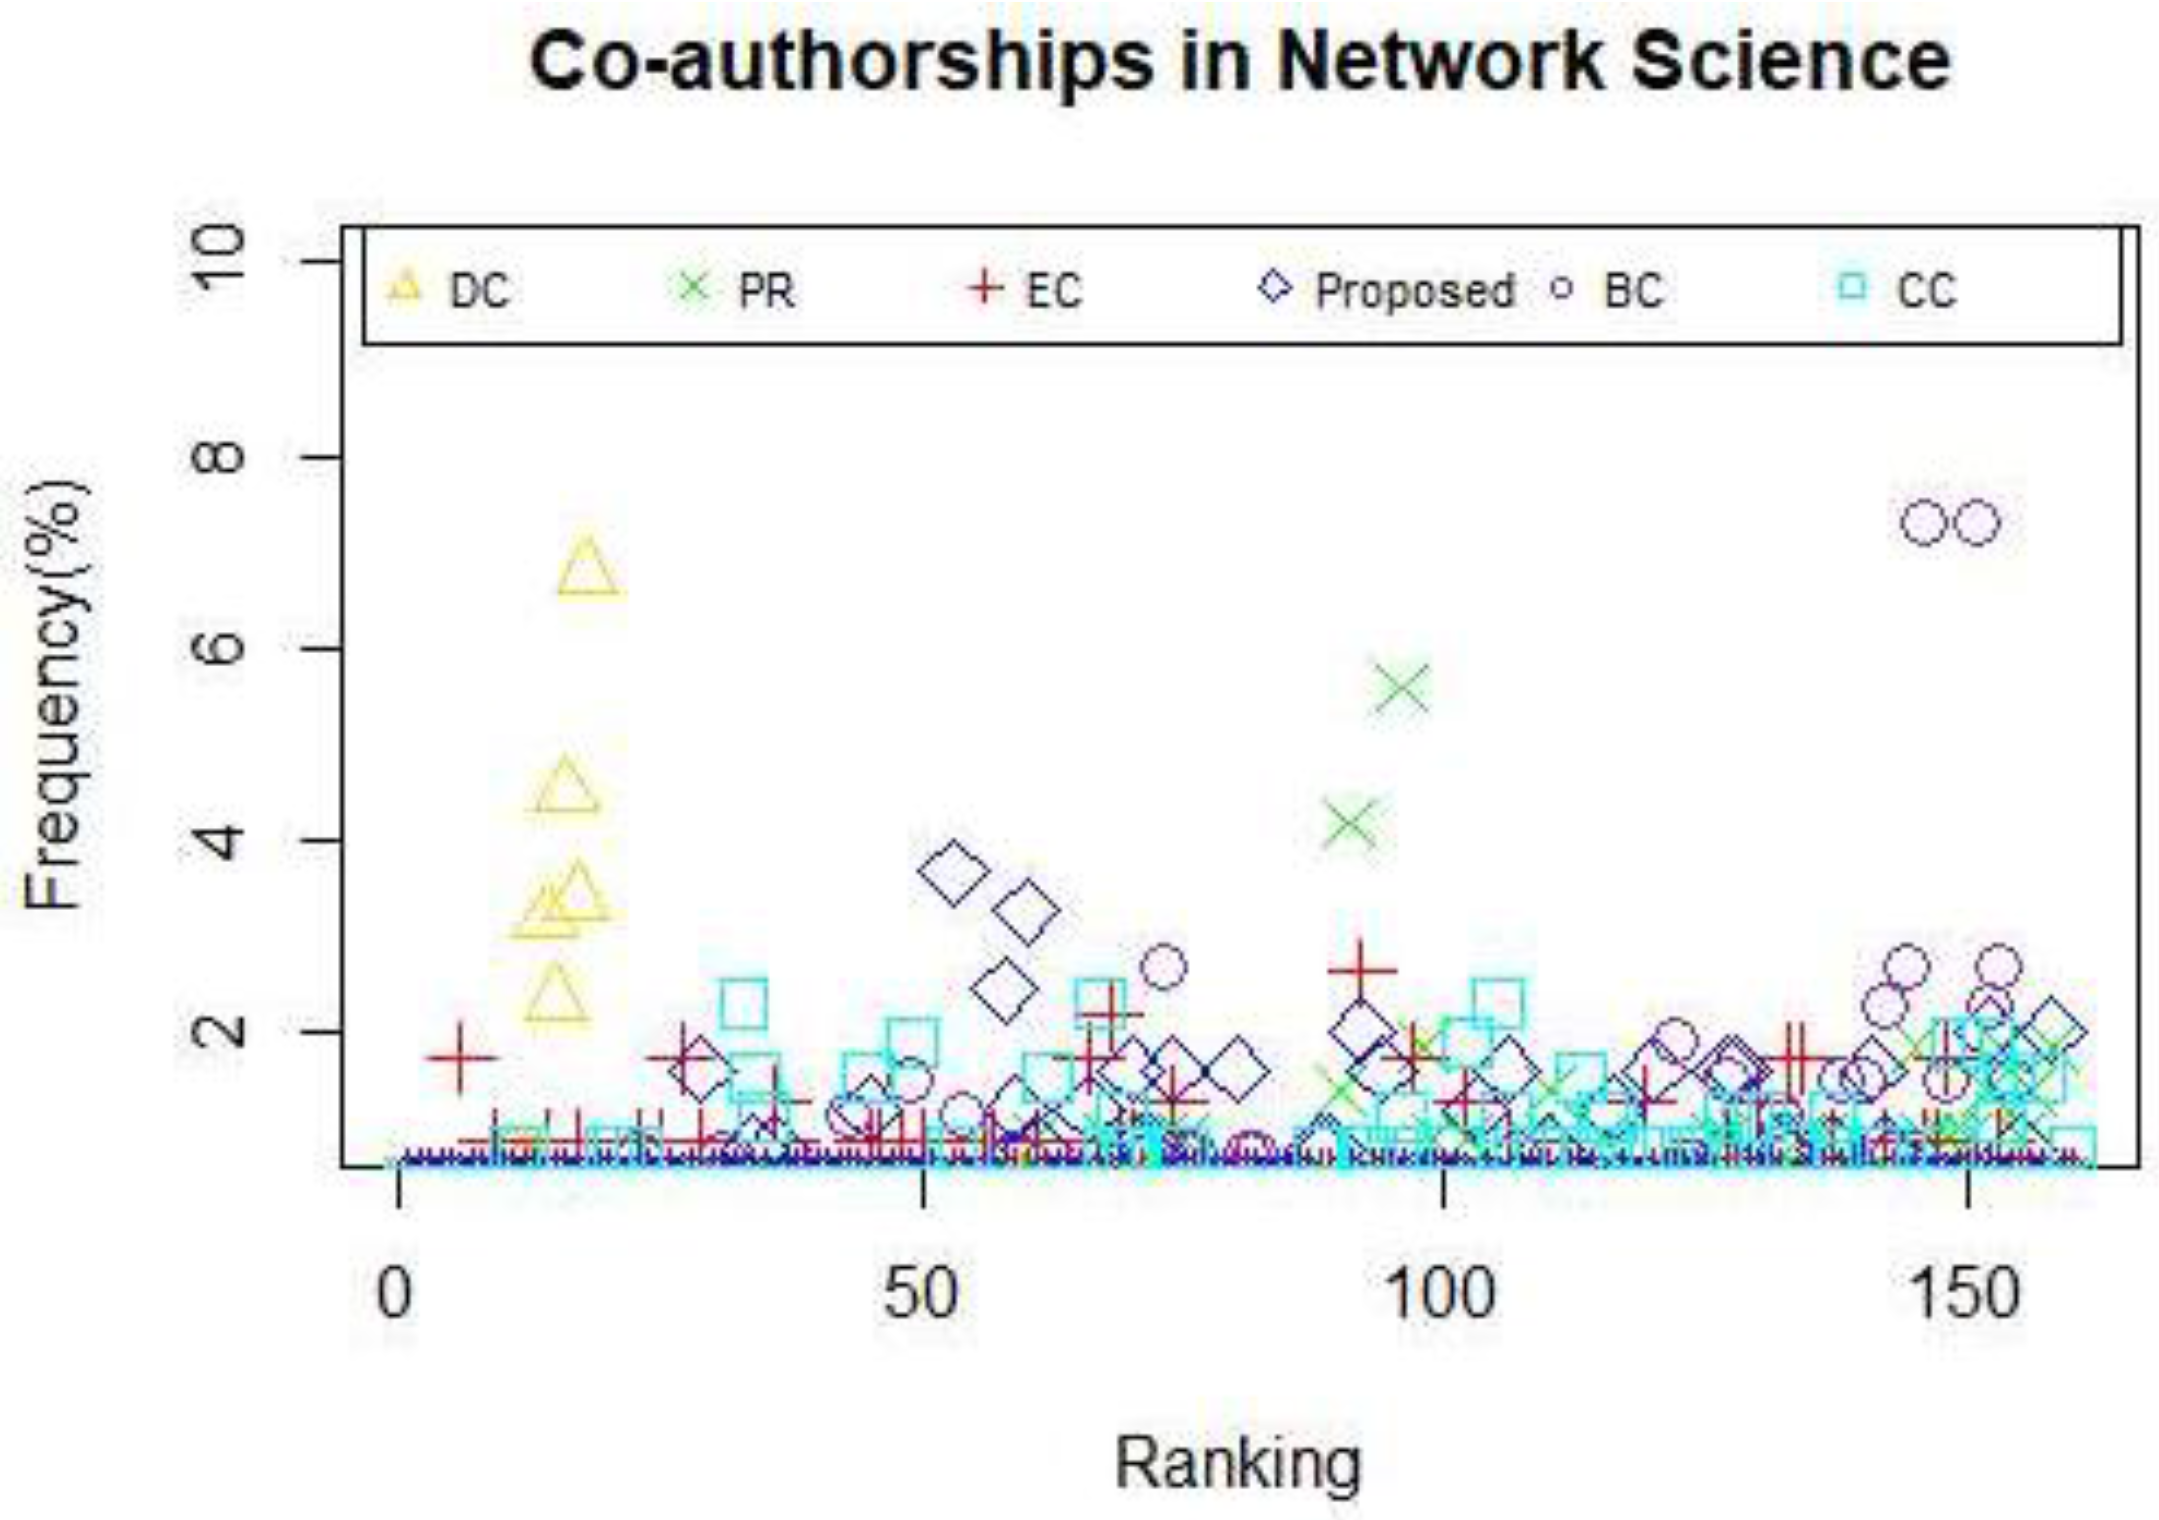
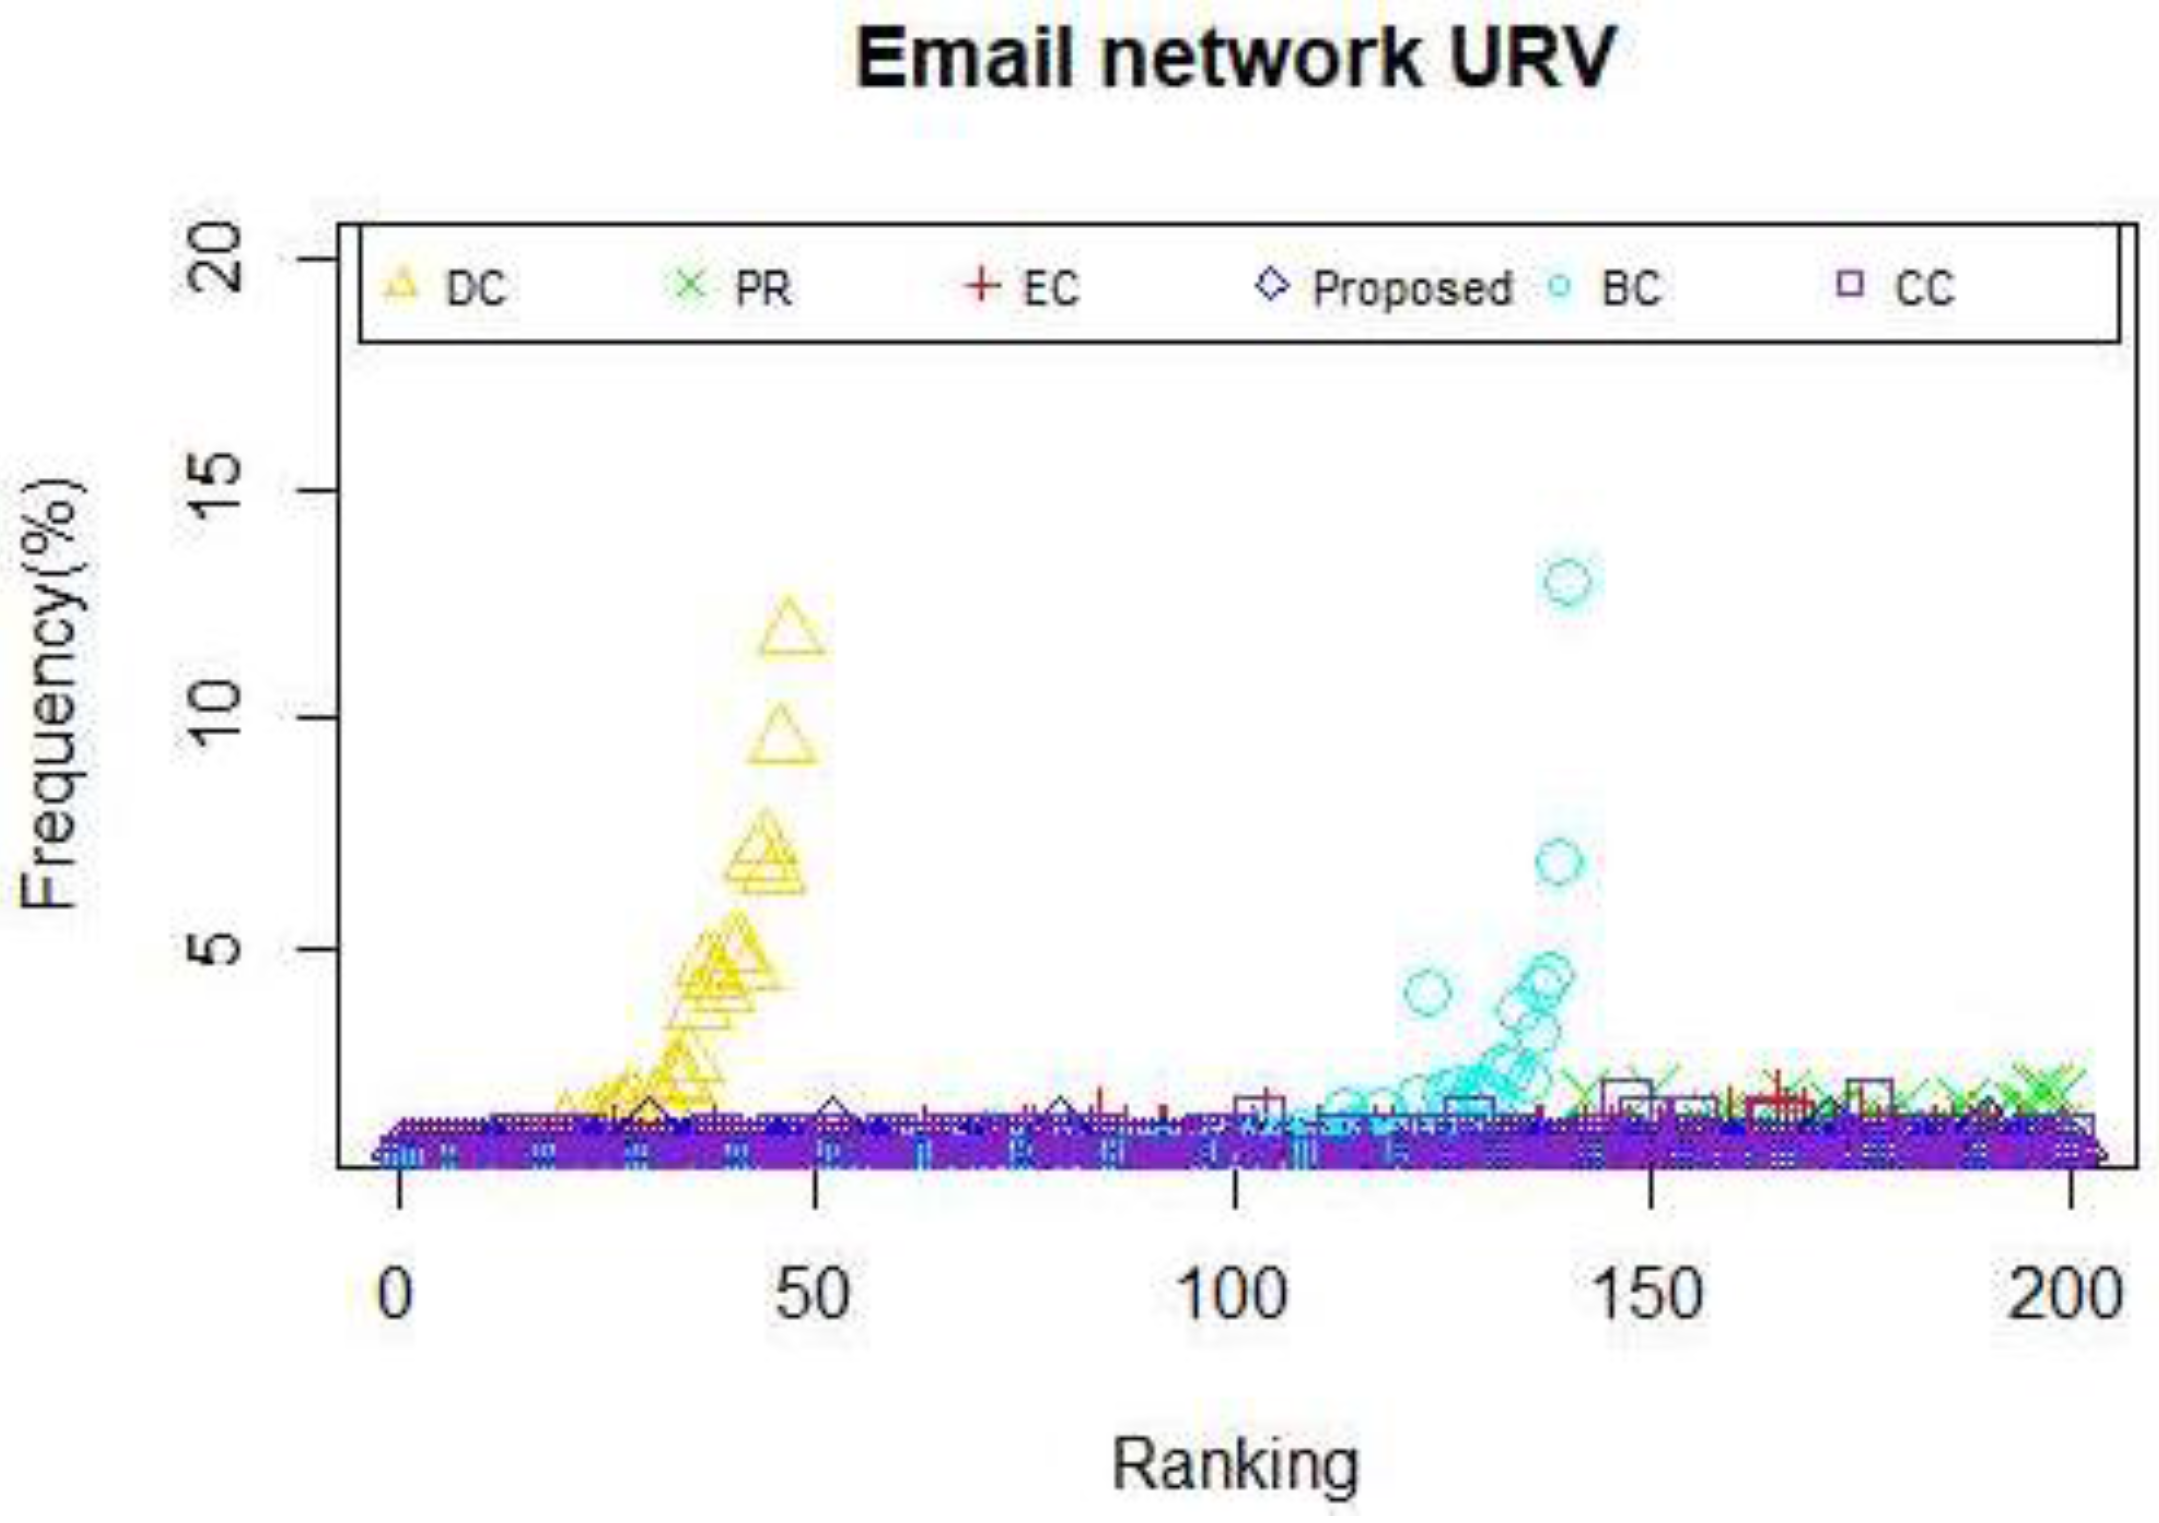
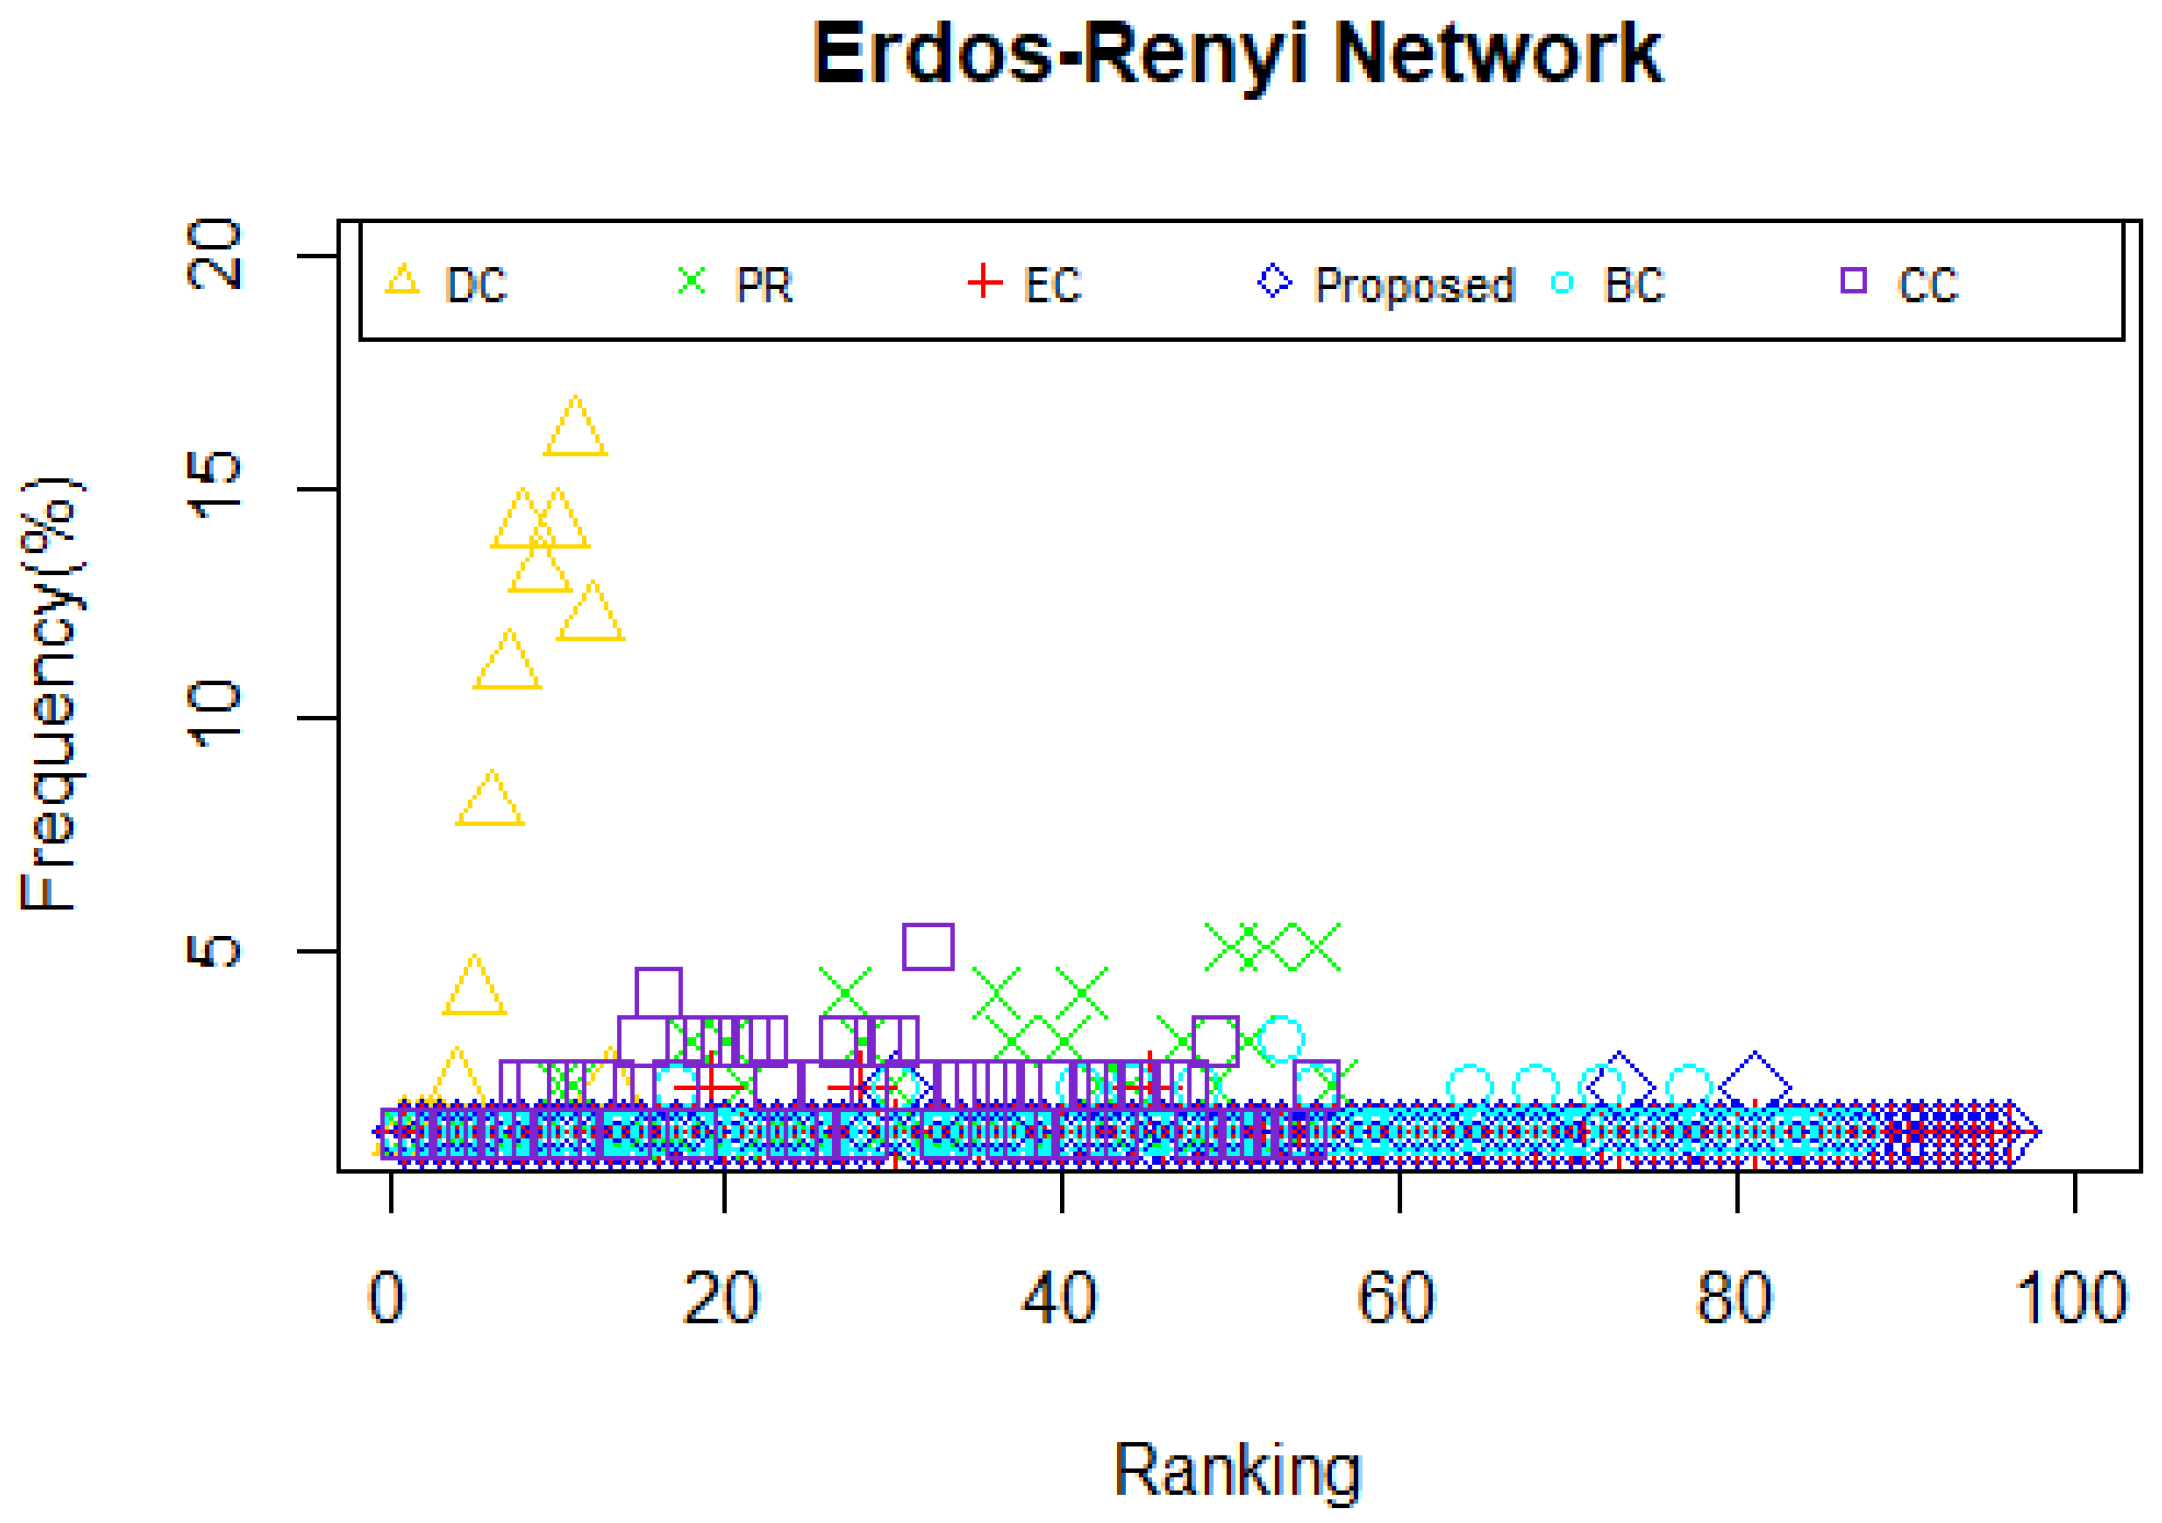
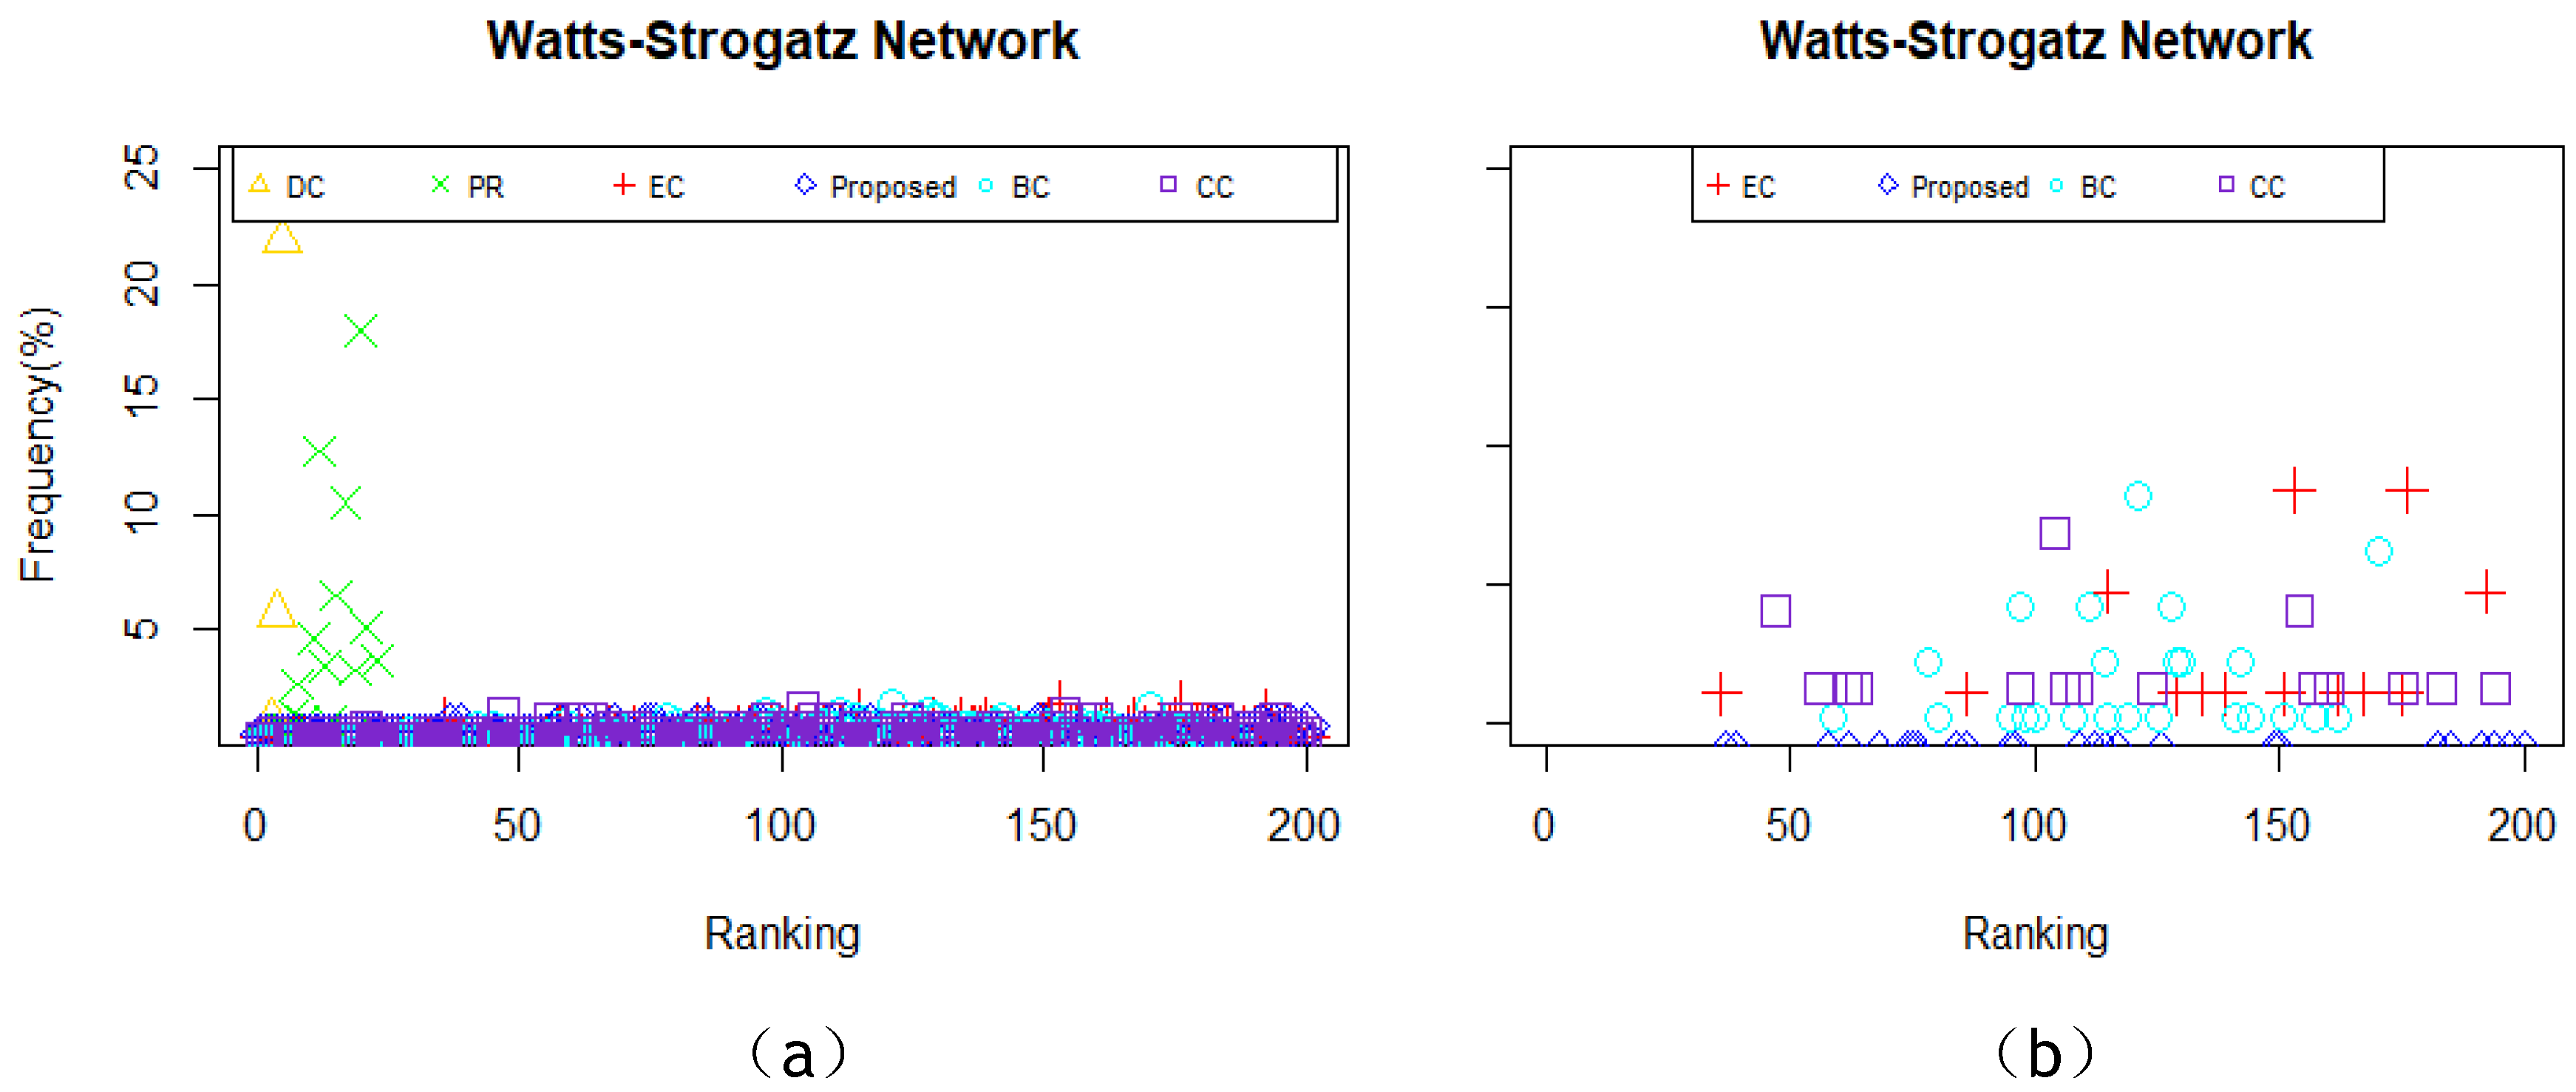
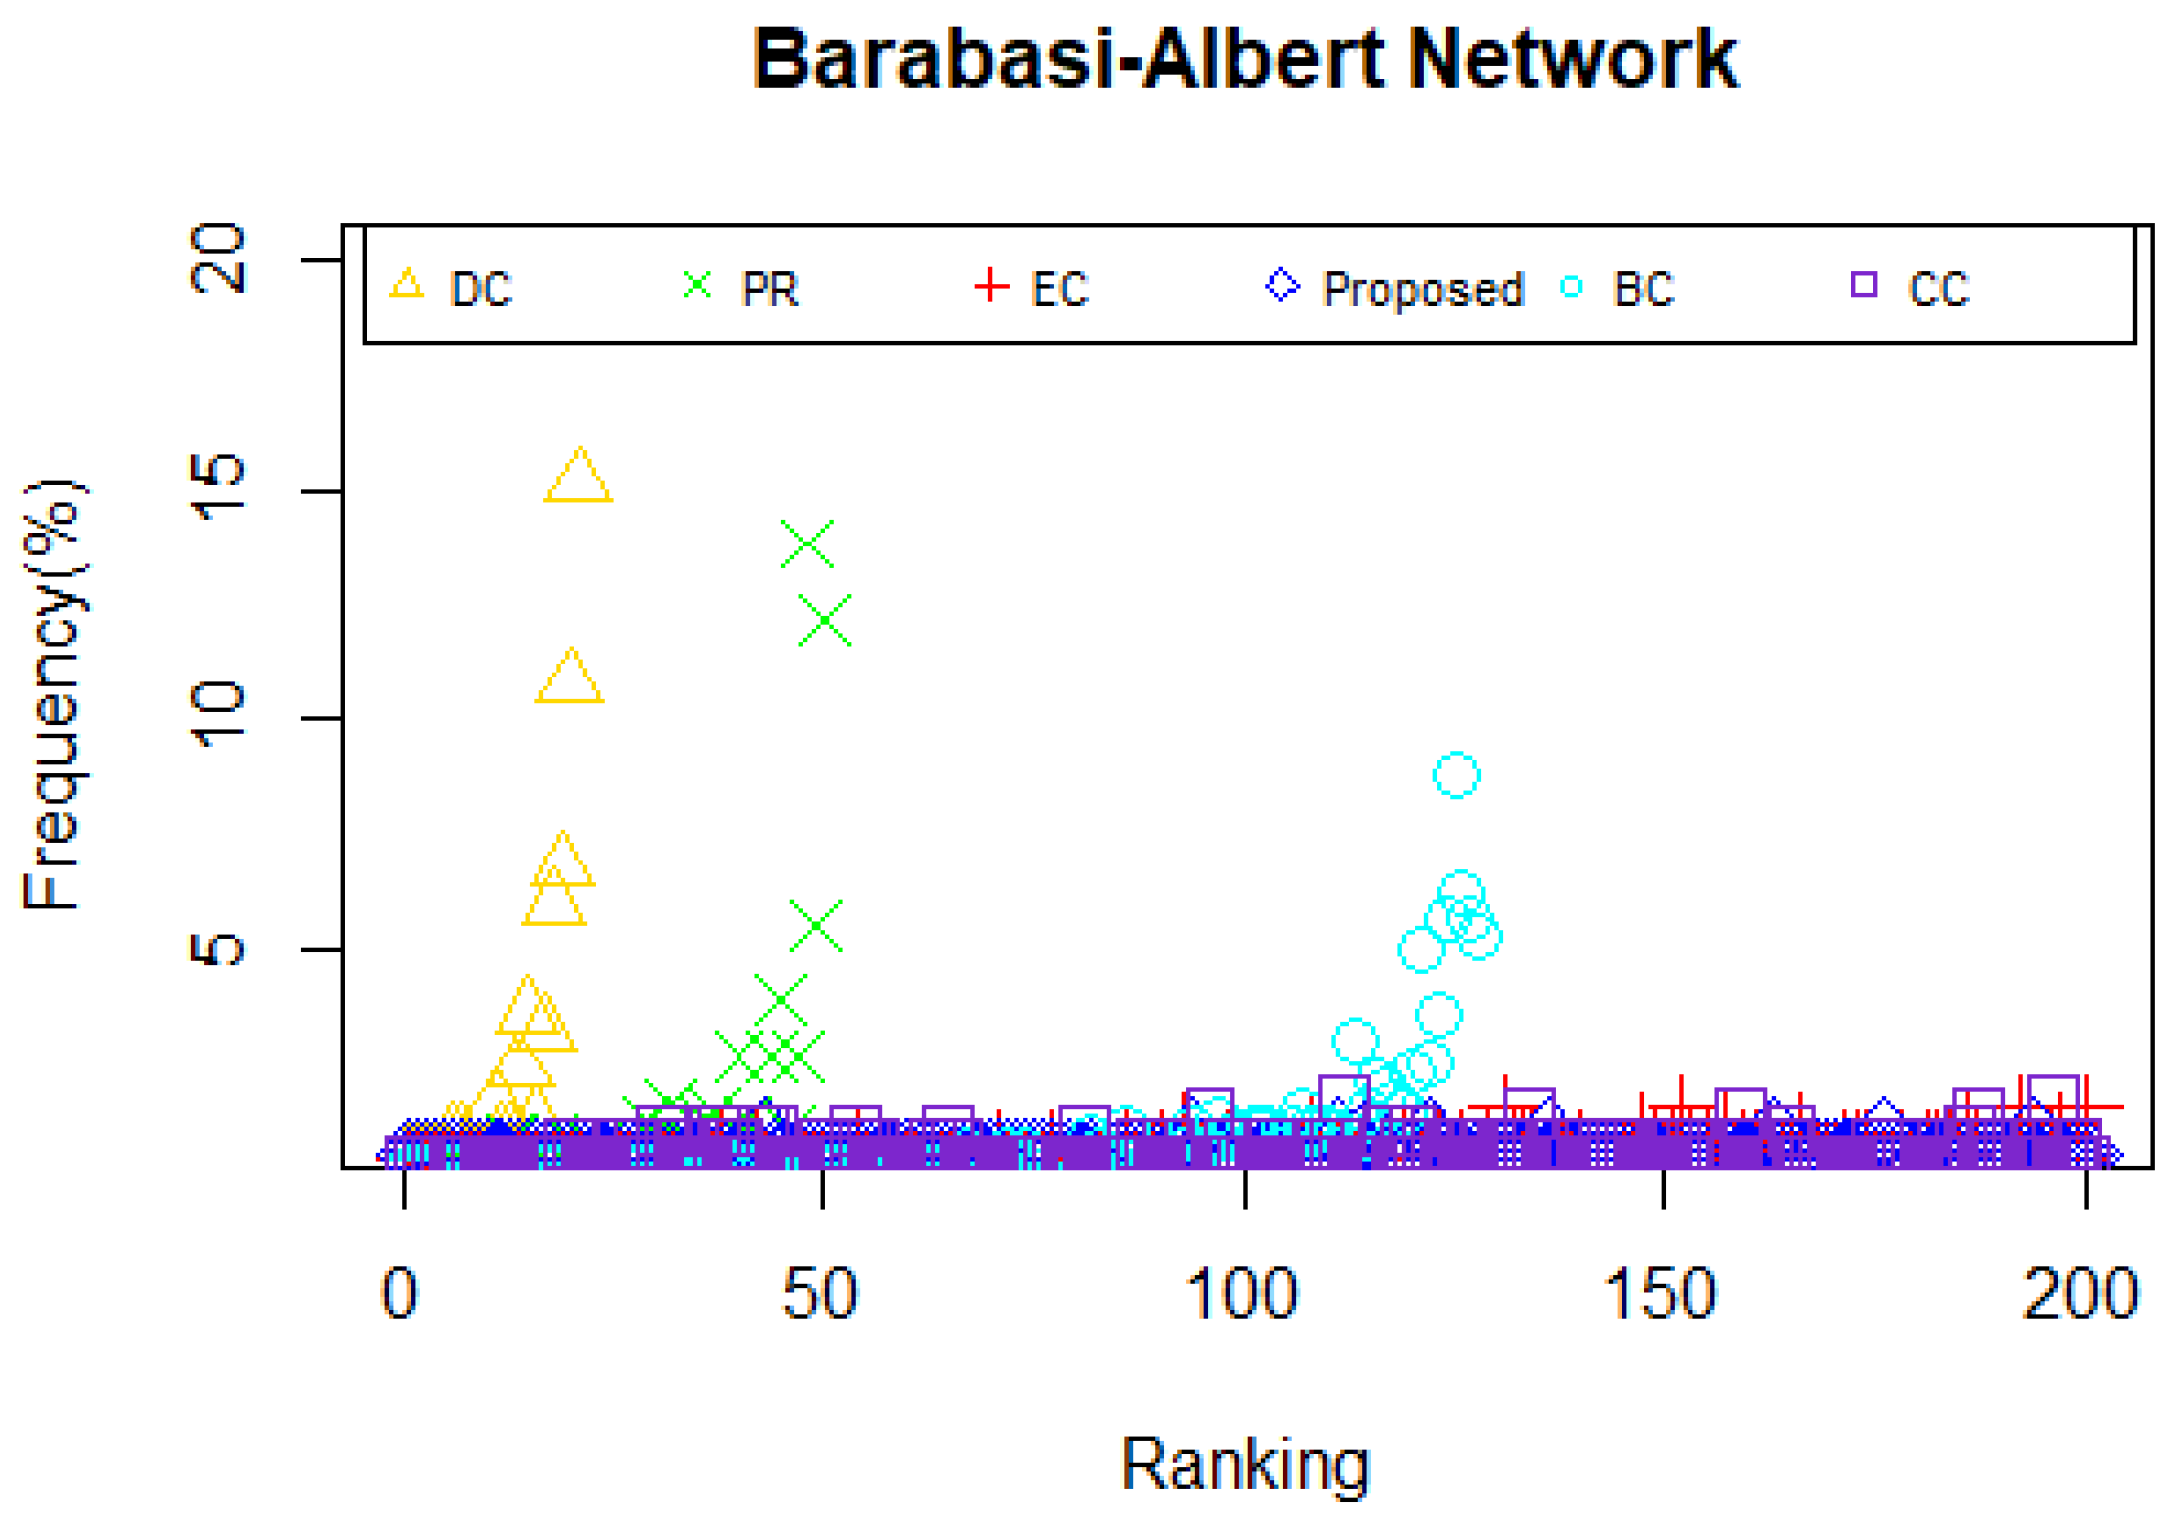
When applying the centrality method such as DC and CC, the situation that multiple nodes possess the same centrality value appear. Moreover, if a node does not belong to the shortest path of other node pairs, consequently, the value of BC of that node will be zero, which is exactly the dilemma we face when betweenness centrality is utilized to identify the powerful nodes in Zachary’s karate club network and USAir network. What occurs when we use a measure that leads to multiple nodes with the same centrality value? One of two things must happen: either the capability to explain the given measure is completely lost or we can only obtain poor answers. Consistent with what we have discussed above, we can draw the conclusion that an effective or a distinguished approach grant the overwhelming majority of nodes different weight during the calculation so that nodes in a given network can be categorized. Therefore, the frequency of nodes with the same centrality value is considered as a key indicator to assess the efficiency of a certain model. Clearly, the relationship between the efficiency and the frequency is negative. Motivated by this idea, we explore other properties of the proposed model and other centrality methods mentioned above by computing the frequency of nodes with the same centrality value in the selected networks. The results are shown in Figure 6, Figure 7, Figure 8, Figure 9, Figure 10, Figure 11 and Figure 12.
From the results illustrated in Figure 6 and Figure 7, it can be reckoned that the proposed model owns the least nodes with the same centrality value. So do PR and EC. In contrast, other measures have too many nodes with the same centrality value to identify the influential nodes. As for the collaboration network, the proposed model has a better performance compared with DC, PR and CC, which can be seen in Figure 8. As is illustrated in Figure 9, the proposed model is more suitable for detecting vital nodes than other methods.
As is showed in Figure 10, the proposed model and EC owns the least number of nodes with same centrality value. As is illustrated in Figure 11a, DC and PR is no longer fit to identify vital nodes, thus, we remove these two methods and draw a new image of the frequency of nodes with the same centrality value. The results can be seen in Figure 11b. It is clear that the proposed model beats all the other four from this perspective. Moreover, the conclusion that the proposed model and EC outperforms the remaining measures can be drawn based on the results in Figure 12.
Consistent with these results, a conclusion can be drawn that the proposed model is more valid than others to identify vital nodes from this perspective.
Note that even though the top 10 nodes of the karate club network are the same using the proposed methods and PR measure, the sequences are still different. Then the question arises. How can we prove that the proposed model is more effective compared with the wildly used PR method? In this research, we intend to introduce the susceptible-infectious (SI) model which describes the transmission of infectious diseases between susceptible and infective individuals and also can be used to characterize social influence’s propagation dynamics process. In the process of epidemic spreading, each node can be in two discrete states, either susceptible or infected. SI model supposes that nodes in susceptible can be infected by the infected nodes with the probability, denoted as β , which indicates the power of the infected nodes. Fei and Deng [49] point out, in the unweighted network, the value of β can be obtain by using the equation stated as follows.
β = ( 1 2 ) α
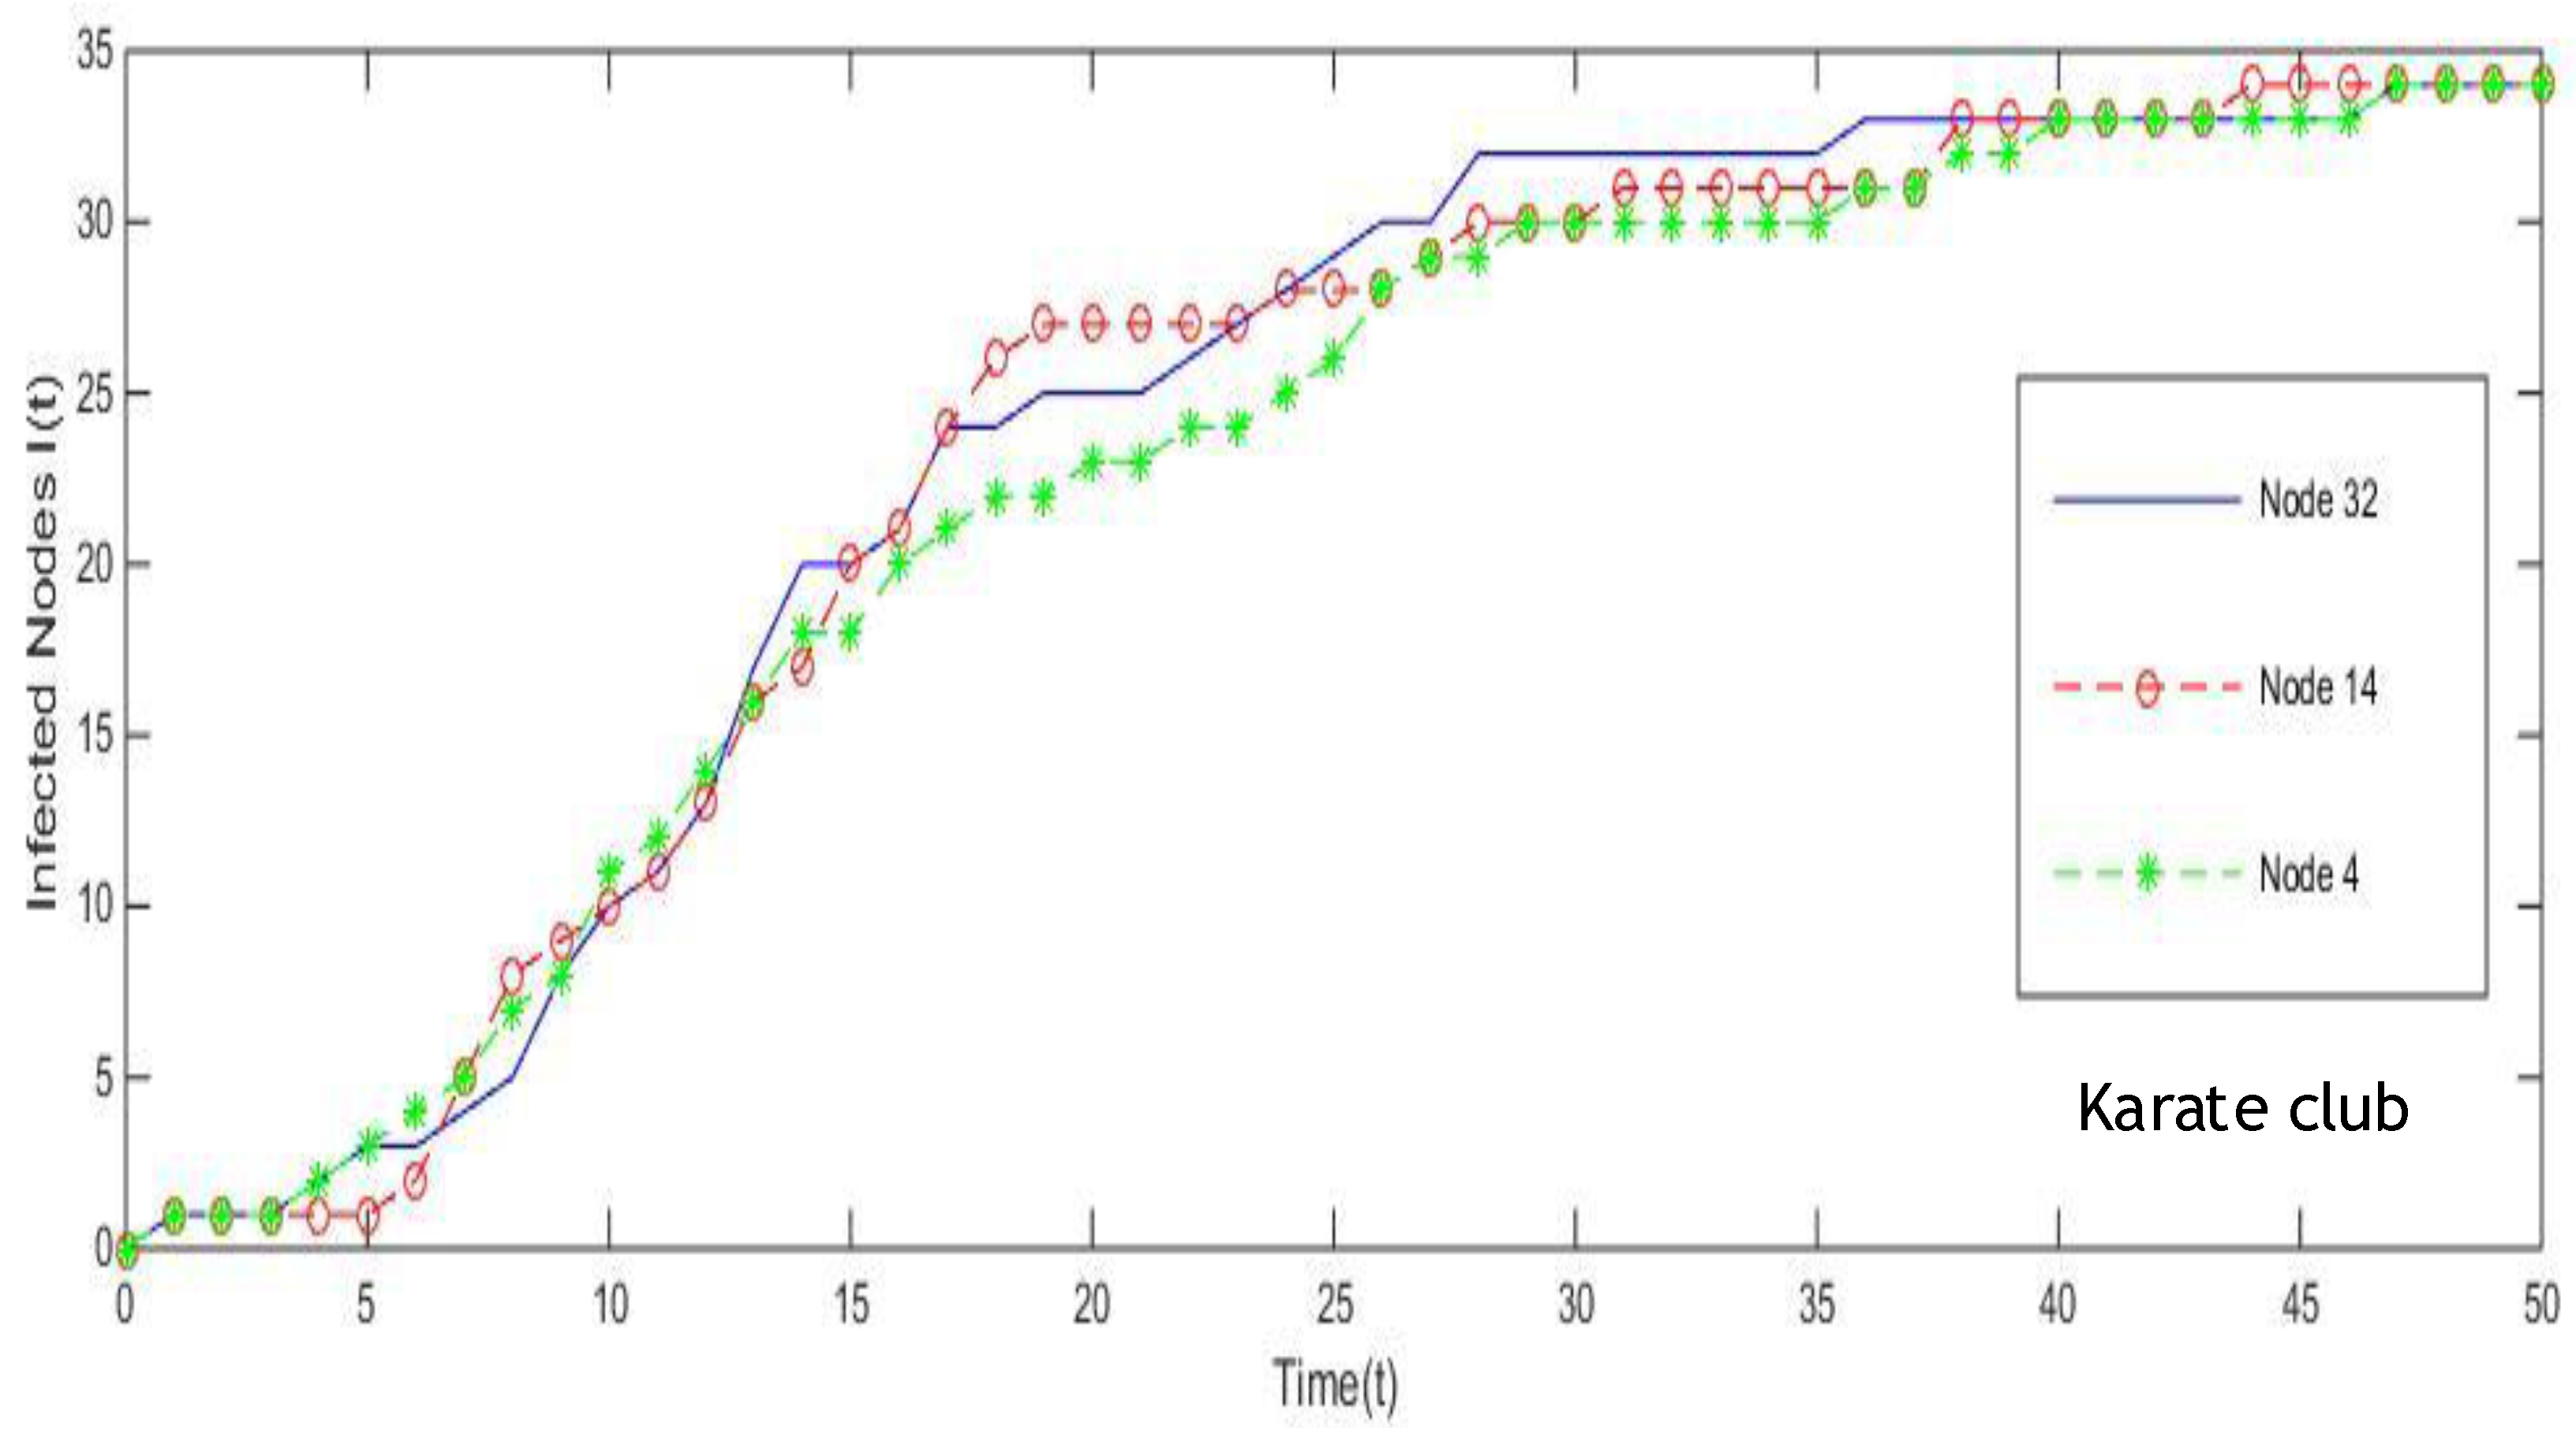
Now let us recall the Zackary’s karate club case, note that node 14, node 32 and node 4 all rank 7th in the top 10 list when EC, PR and the proposed model are respectively adopted to measure centrality. The results can also be seen in 
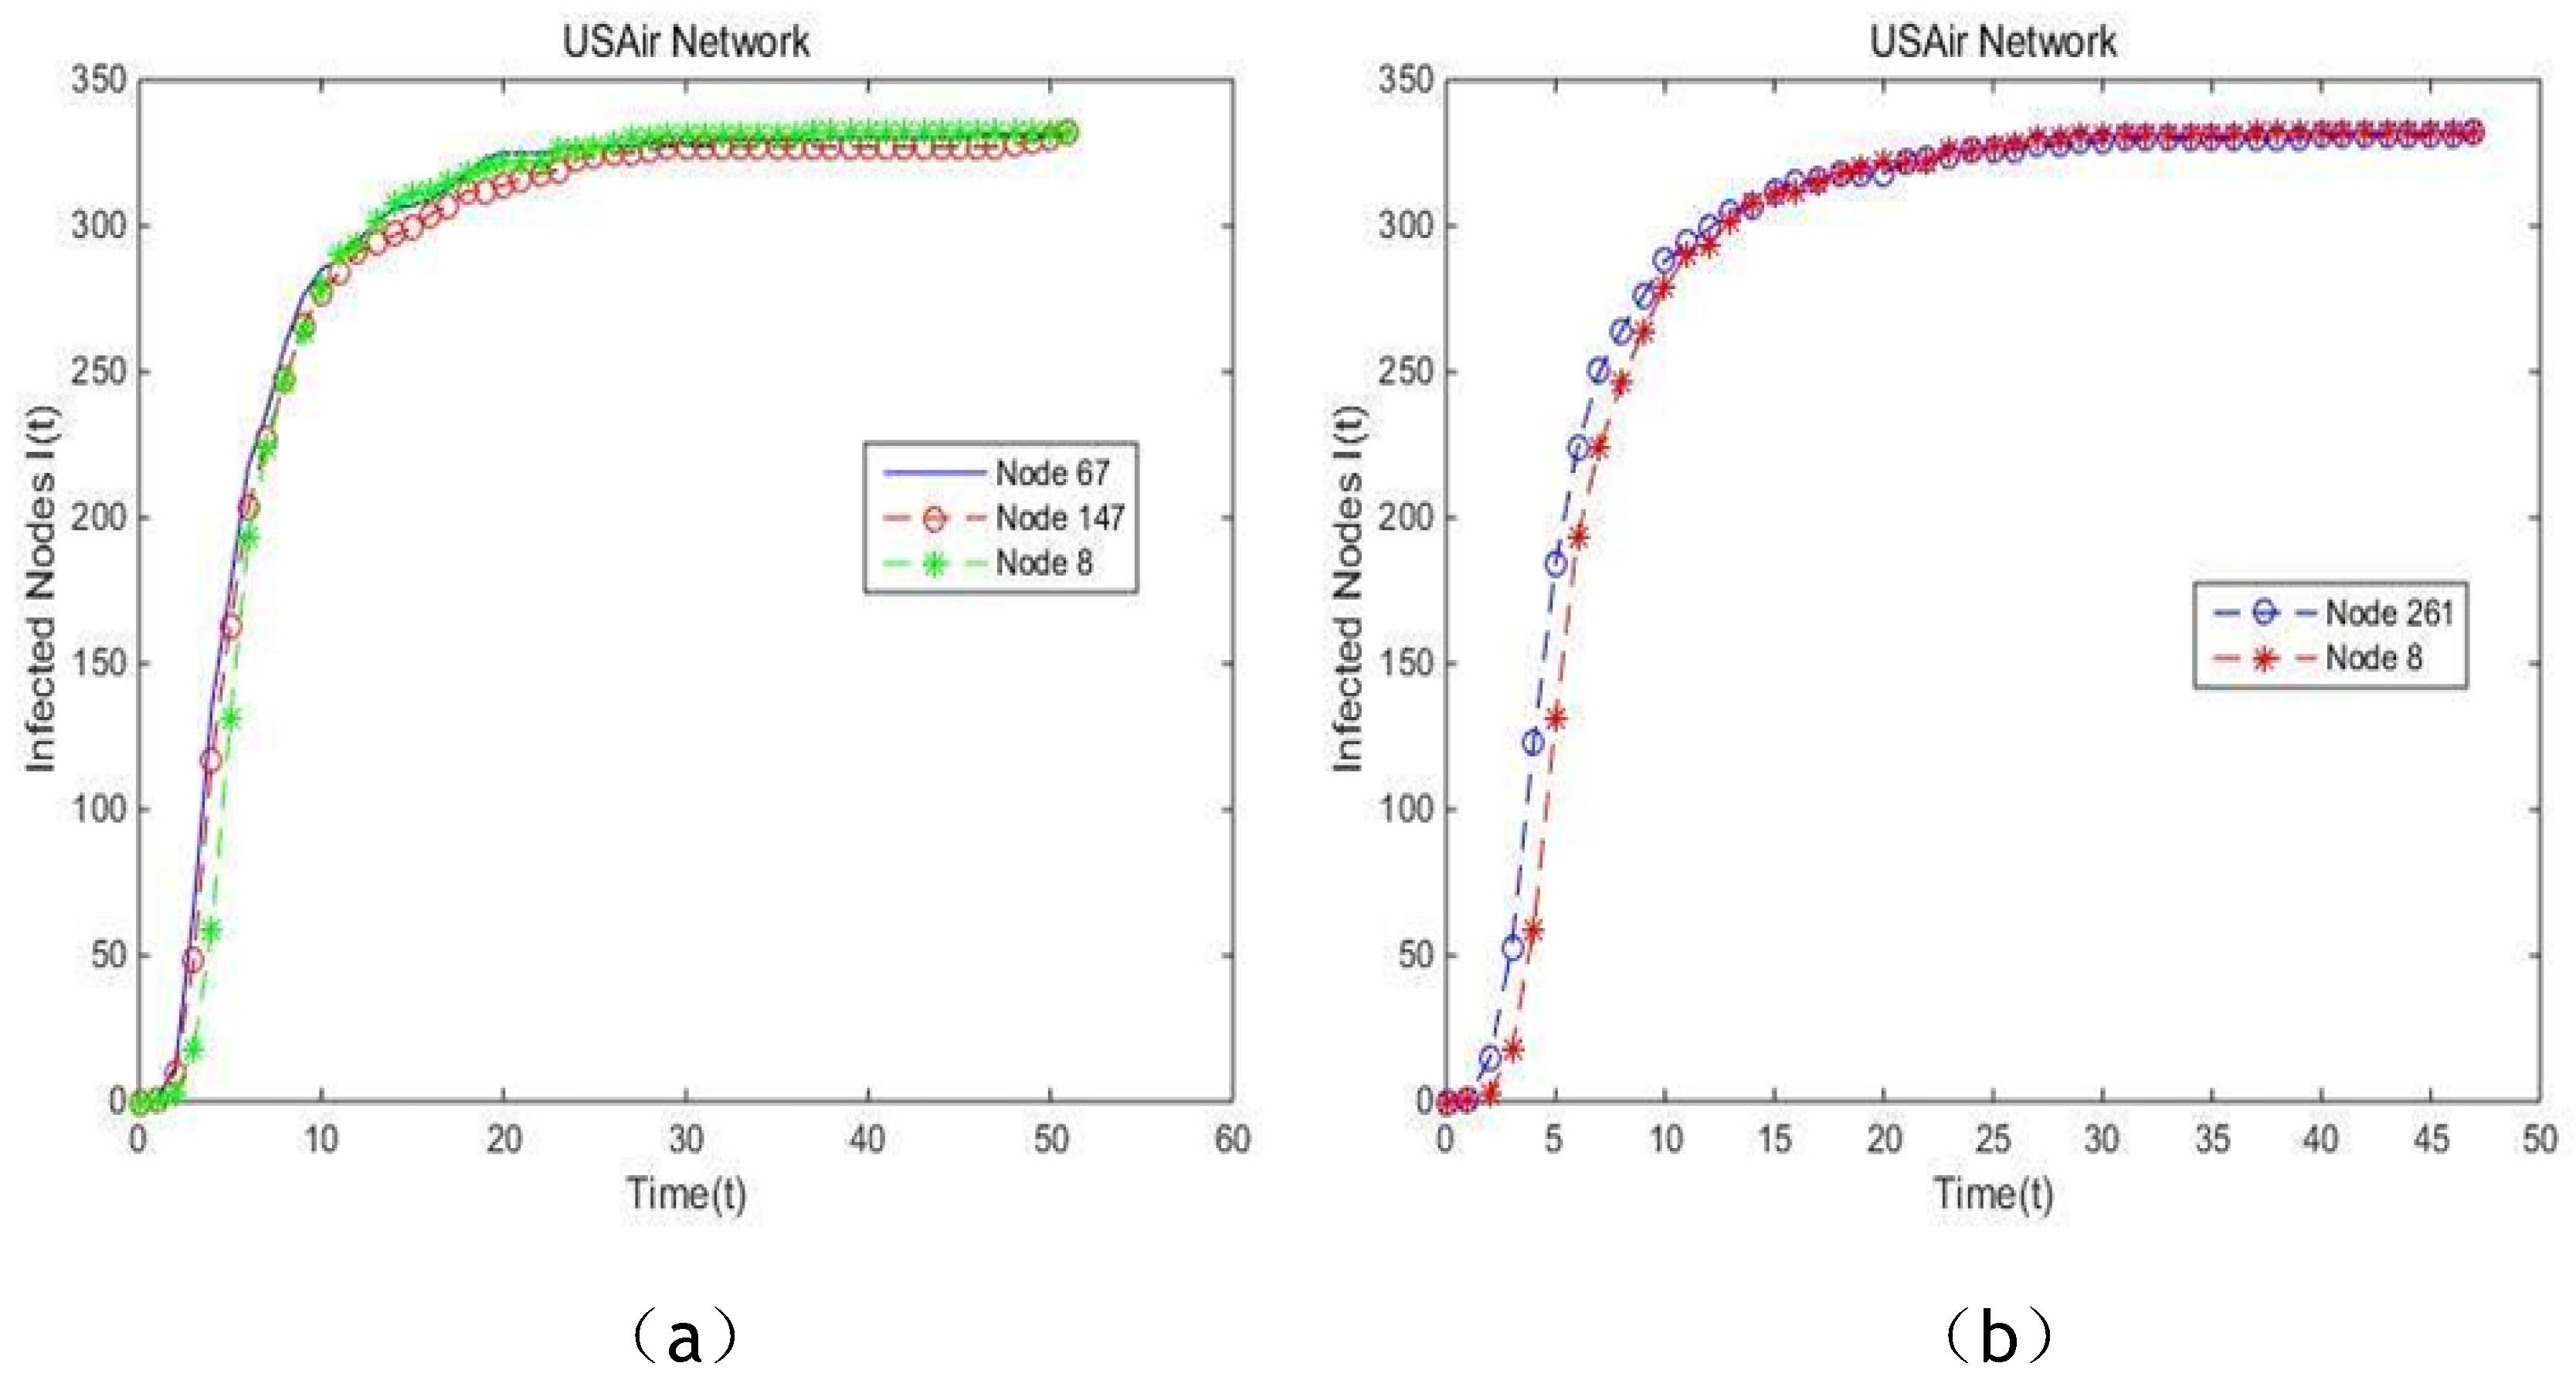
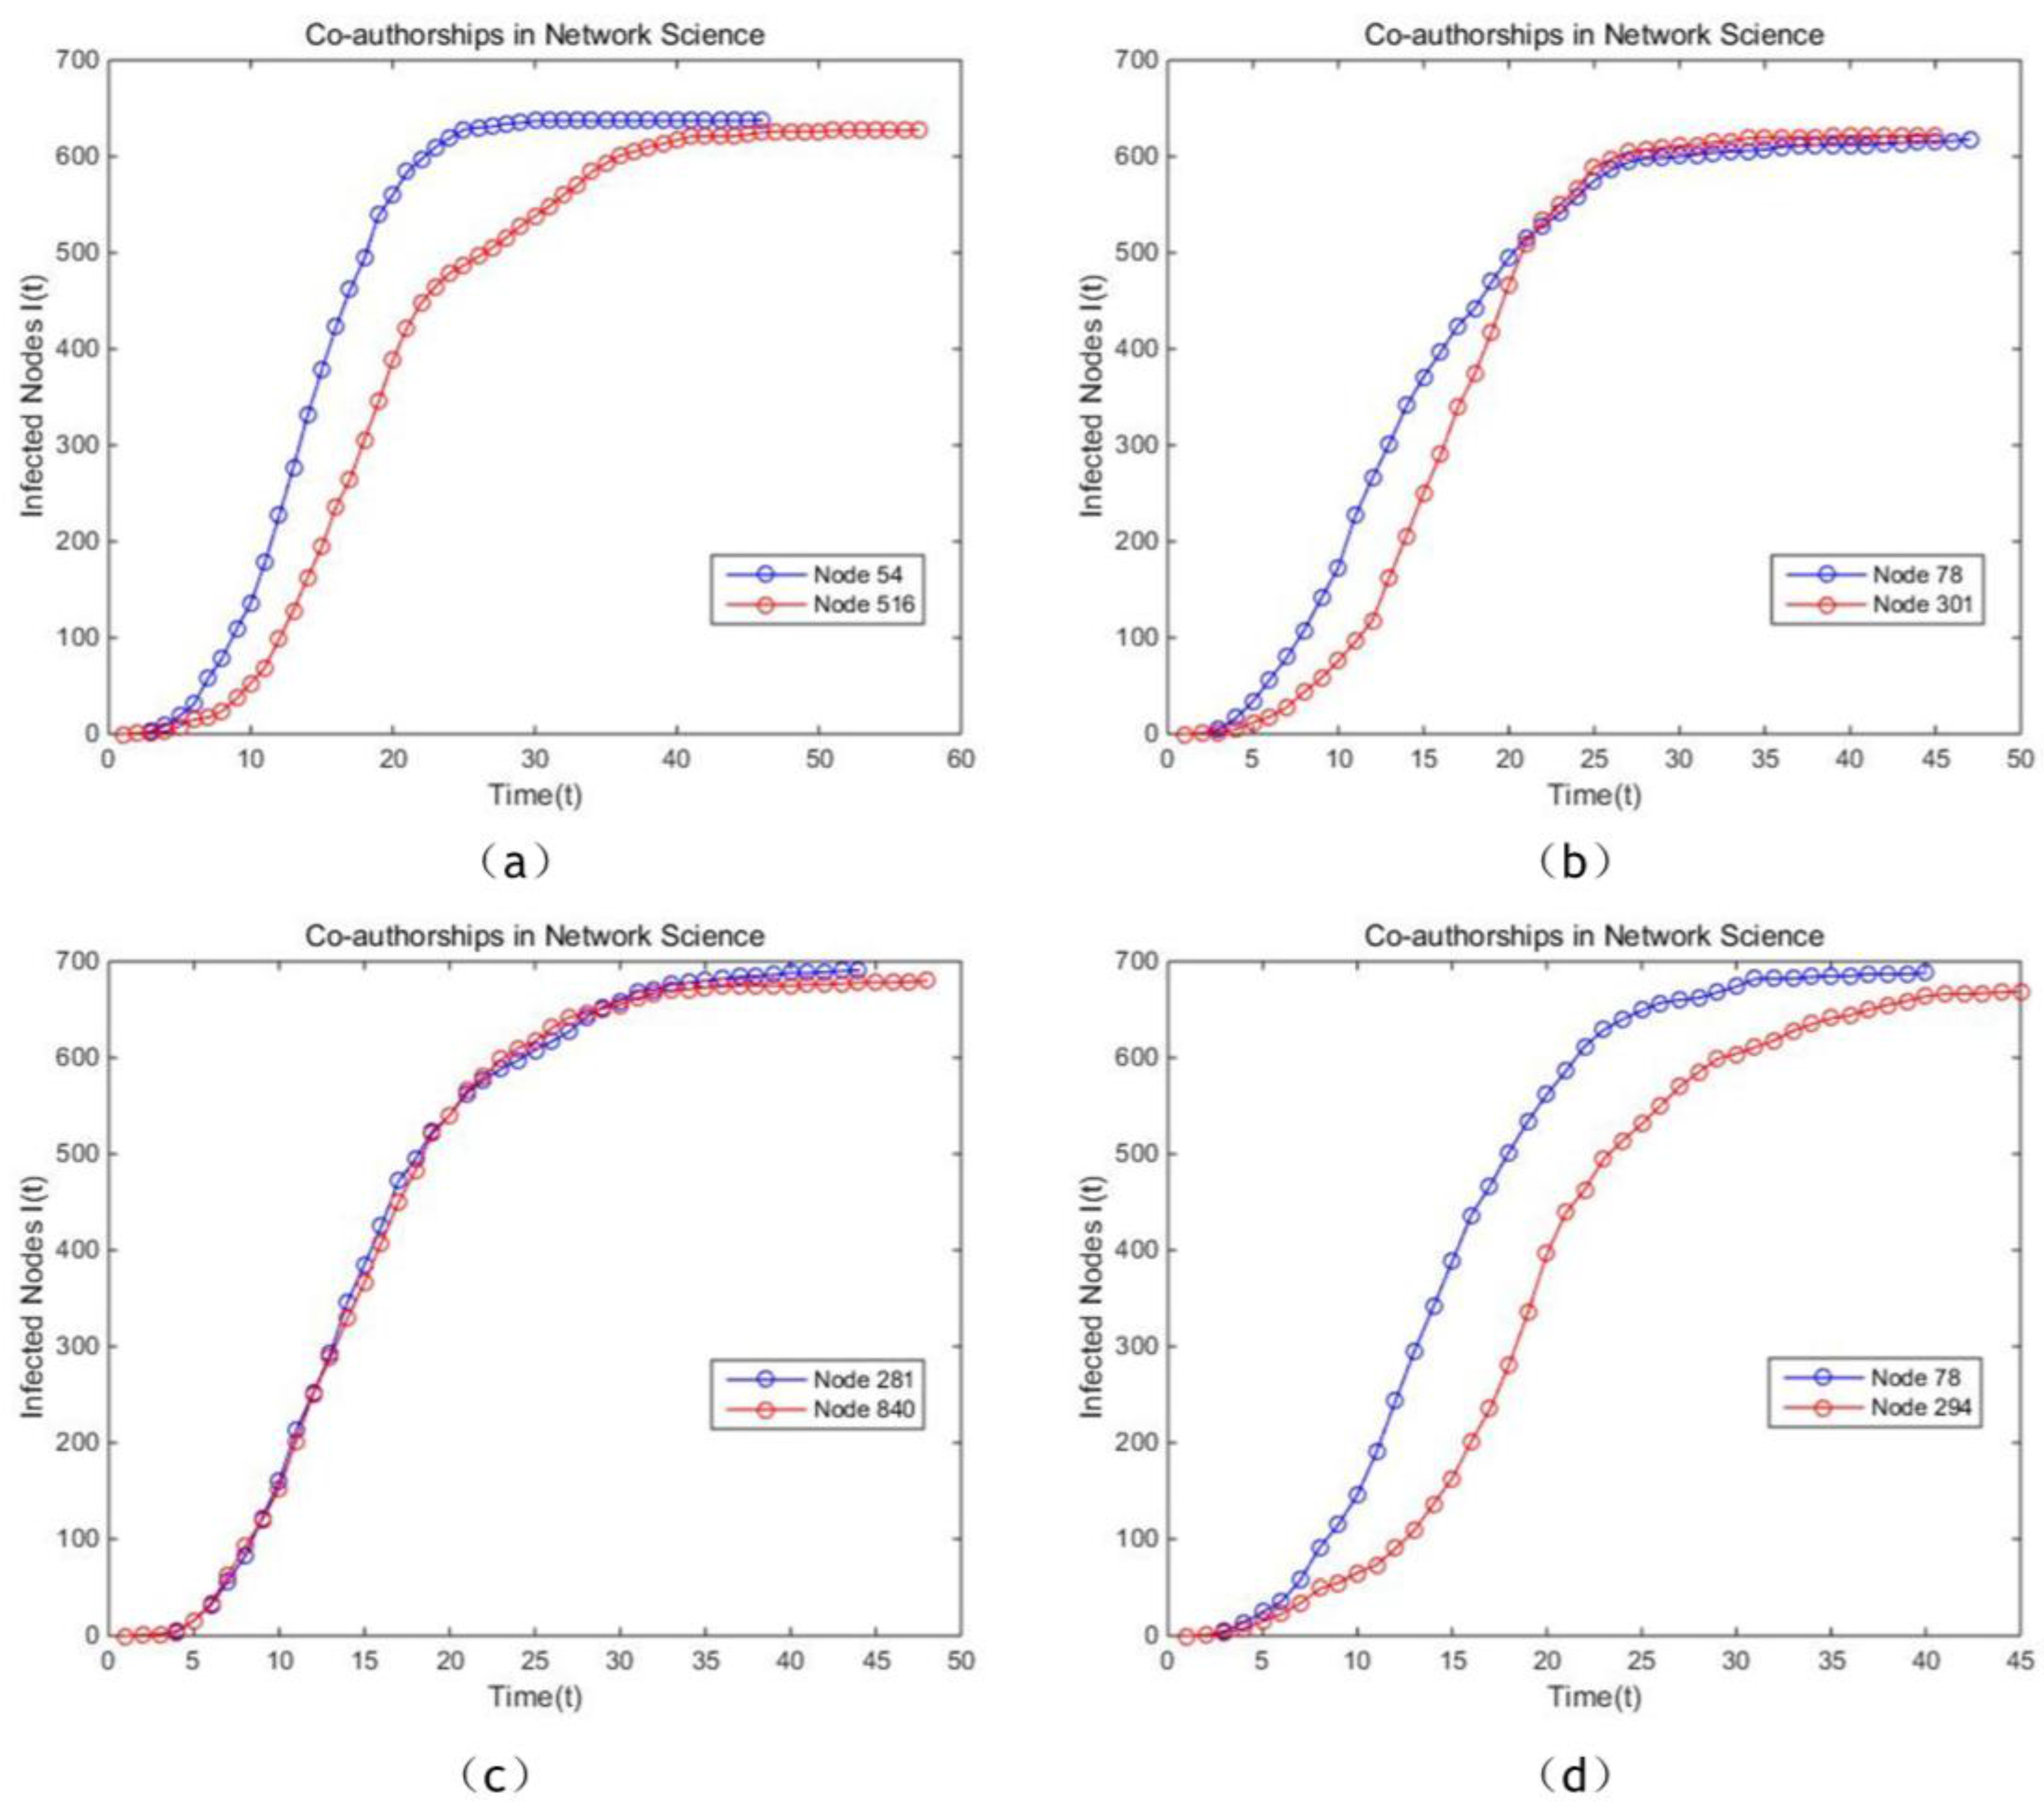
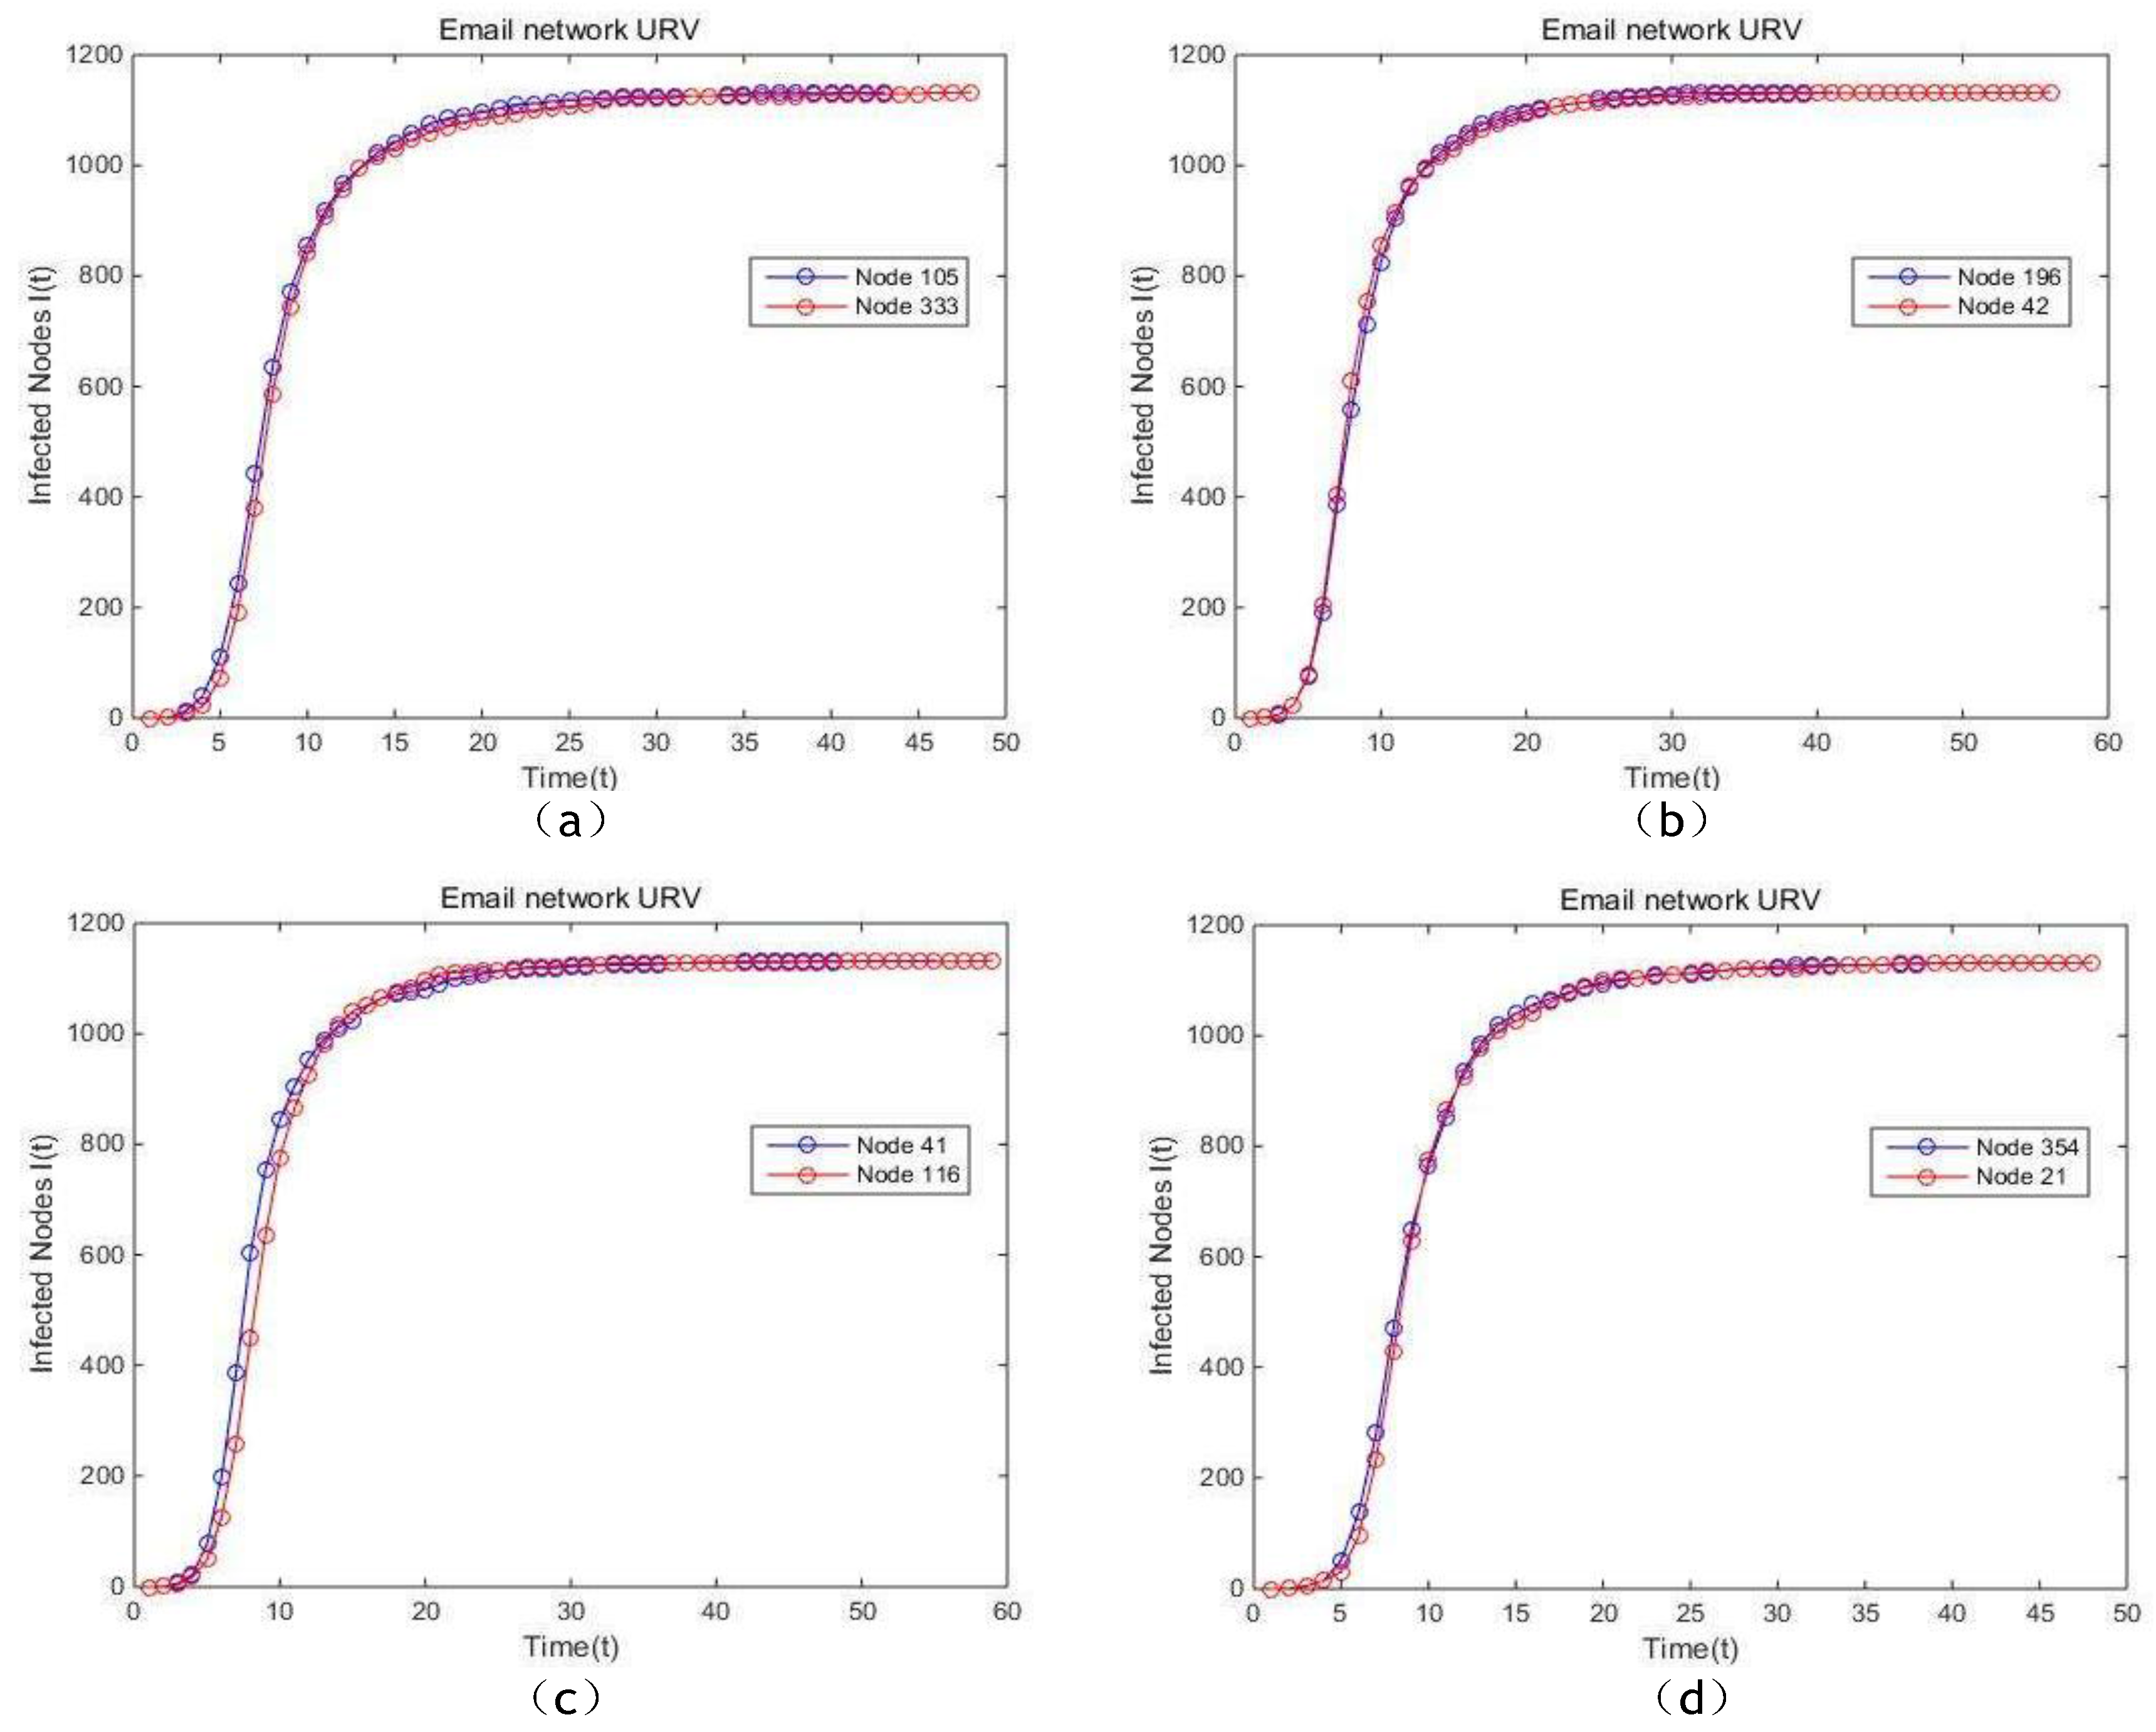
Table 4. In addition, the same situation in which node 147, node 8 and node 67 all rank 8th in the top 10 list when EC, PR and the proposed model are respectively adopted to measure centrality in USAir97 network appears. Also, node 261 and node 8 rank 2nd on the condition that BC and the proposed model are respectively applied in USAir97 network. The same situation also appears in Collaboration network and Email network. Inspired by SI model, we treat node 14, node 32 and node 4 as infectious source which spread t   ( t = 1 , 2 , , T ) times in karate club network, then the number of infected nodes N i t will be counted when the end of the dissemination. That is the spreading ability of single node is considered as an index to evaluate the effectiveness of the proposed model and the existing centrality measures. By introducing SI model, the results of experiments on four real networks are shown in Figure 13, Figure 14, Figure 15 and Figure 16, respectively. Figure 17, Figure 18 and Figure 19 illustrates the results of the other three artificial networks, respectively.
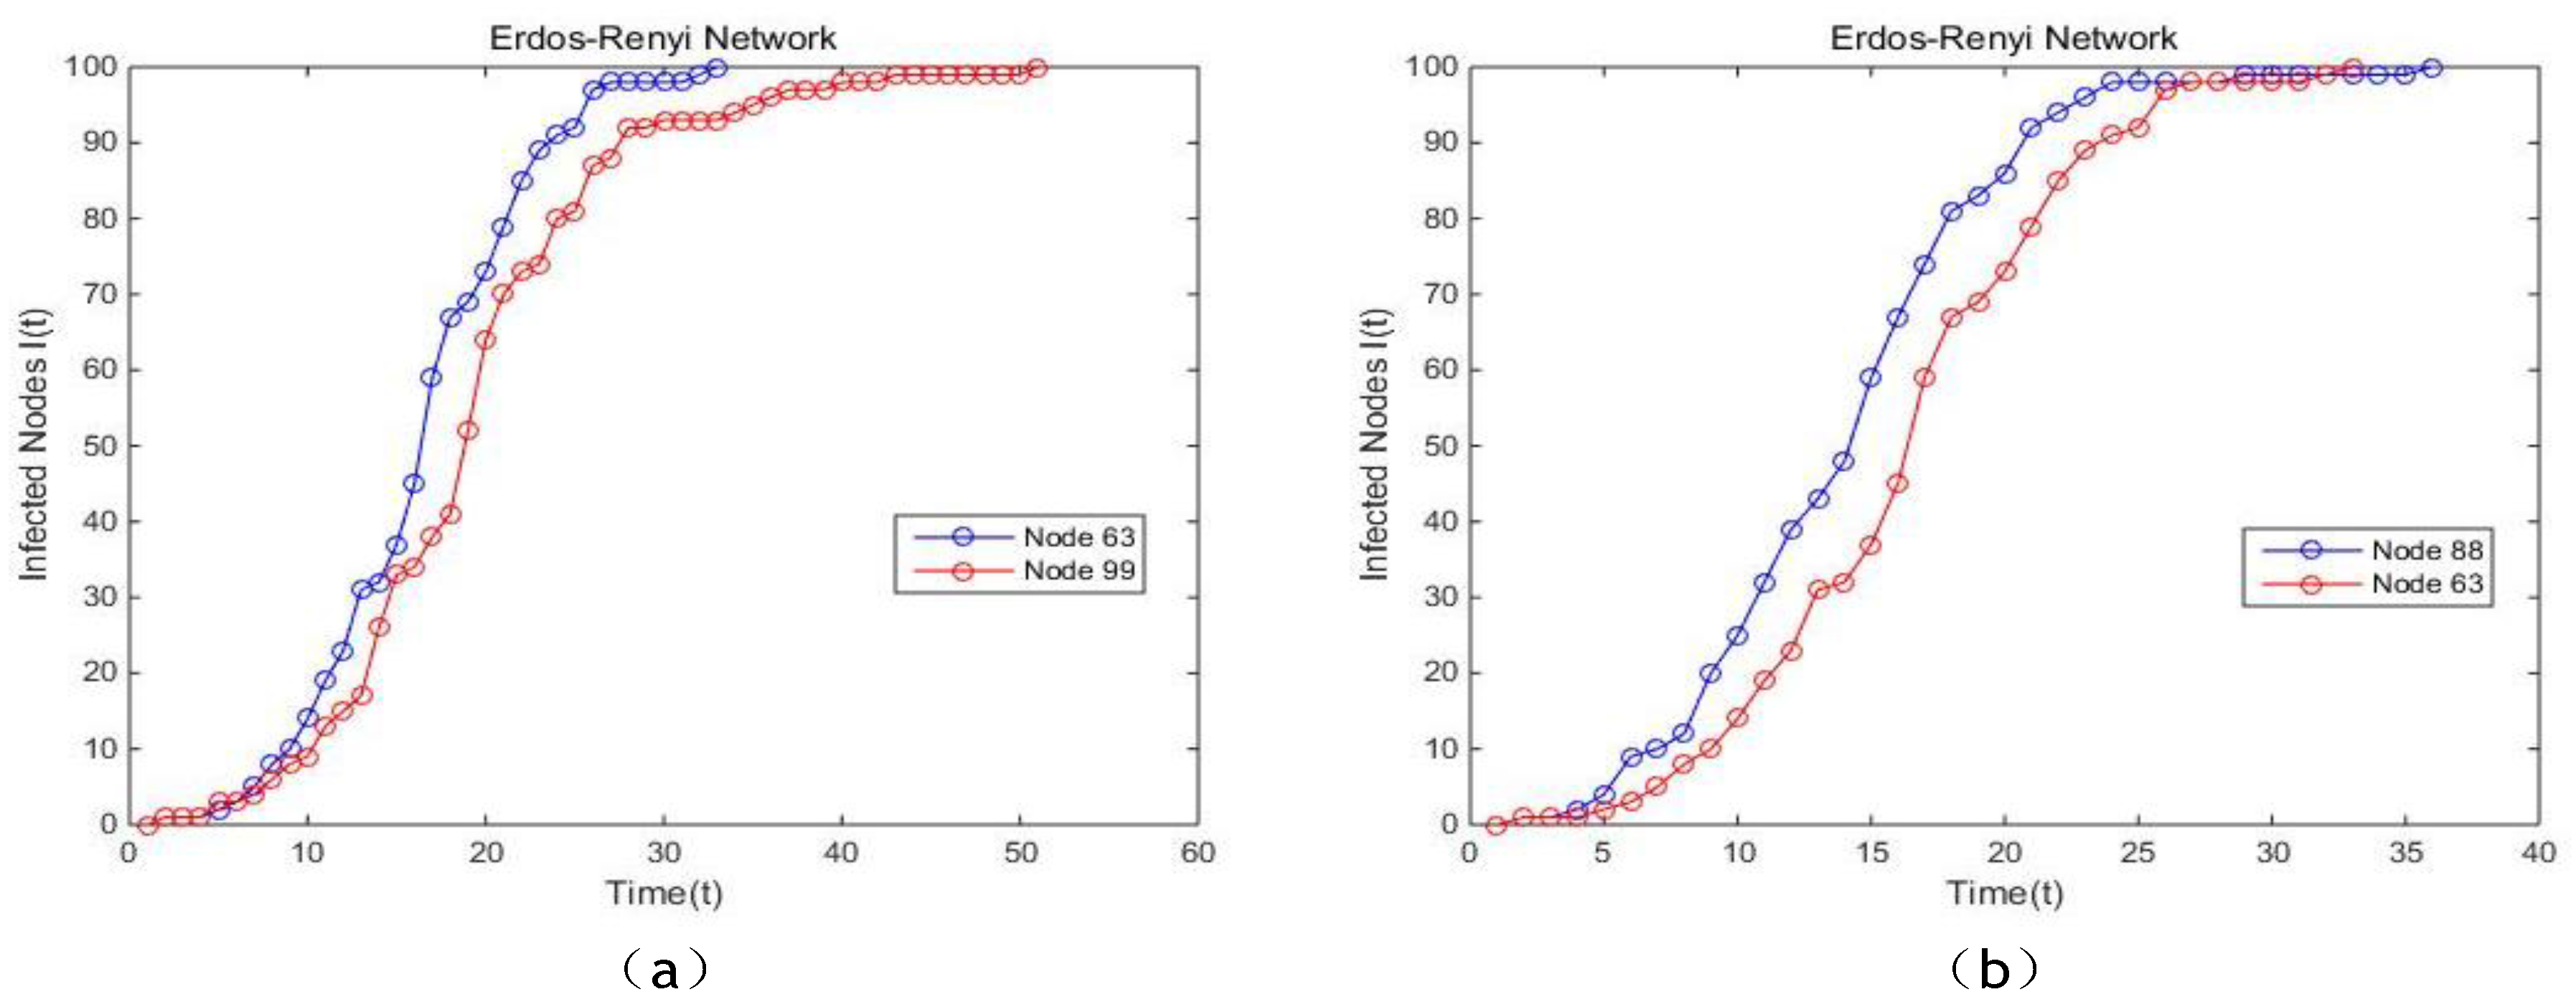
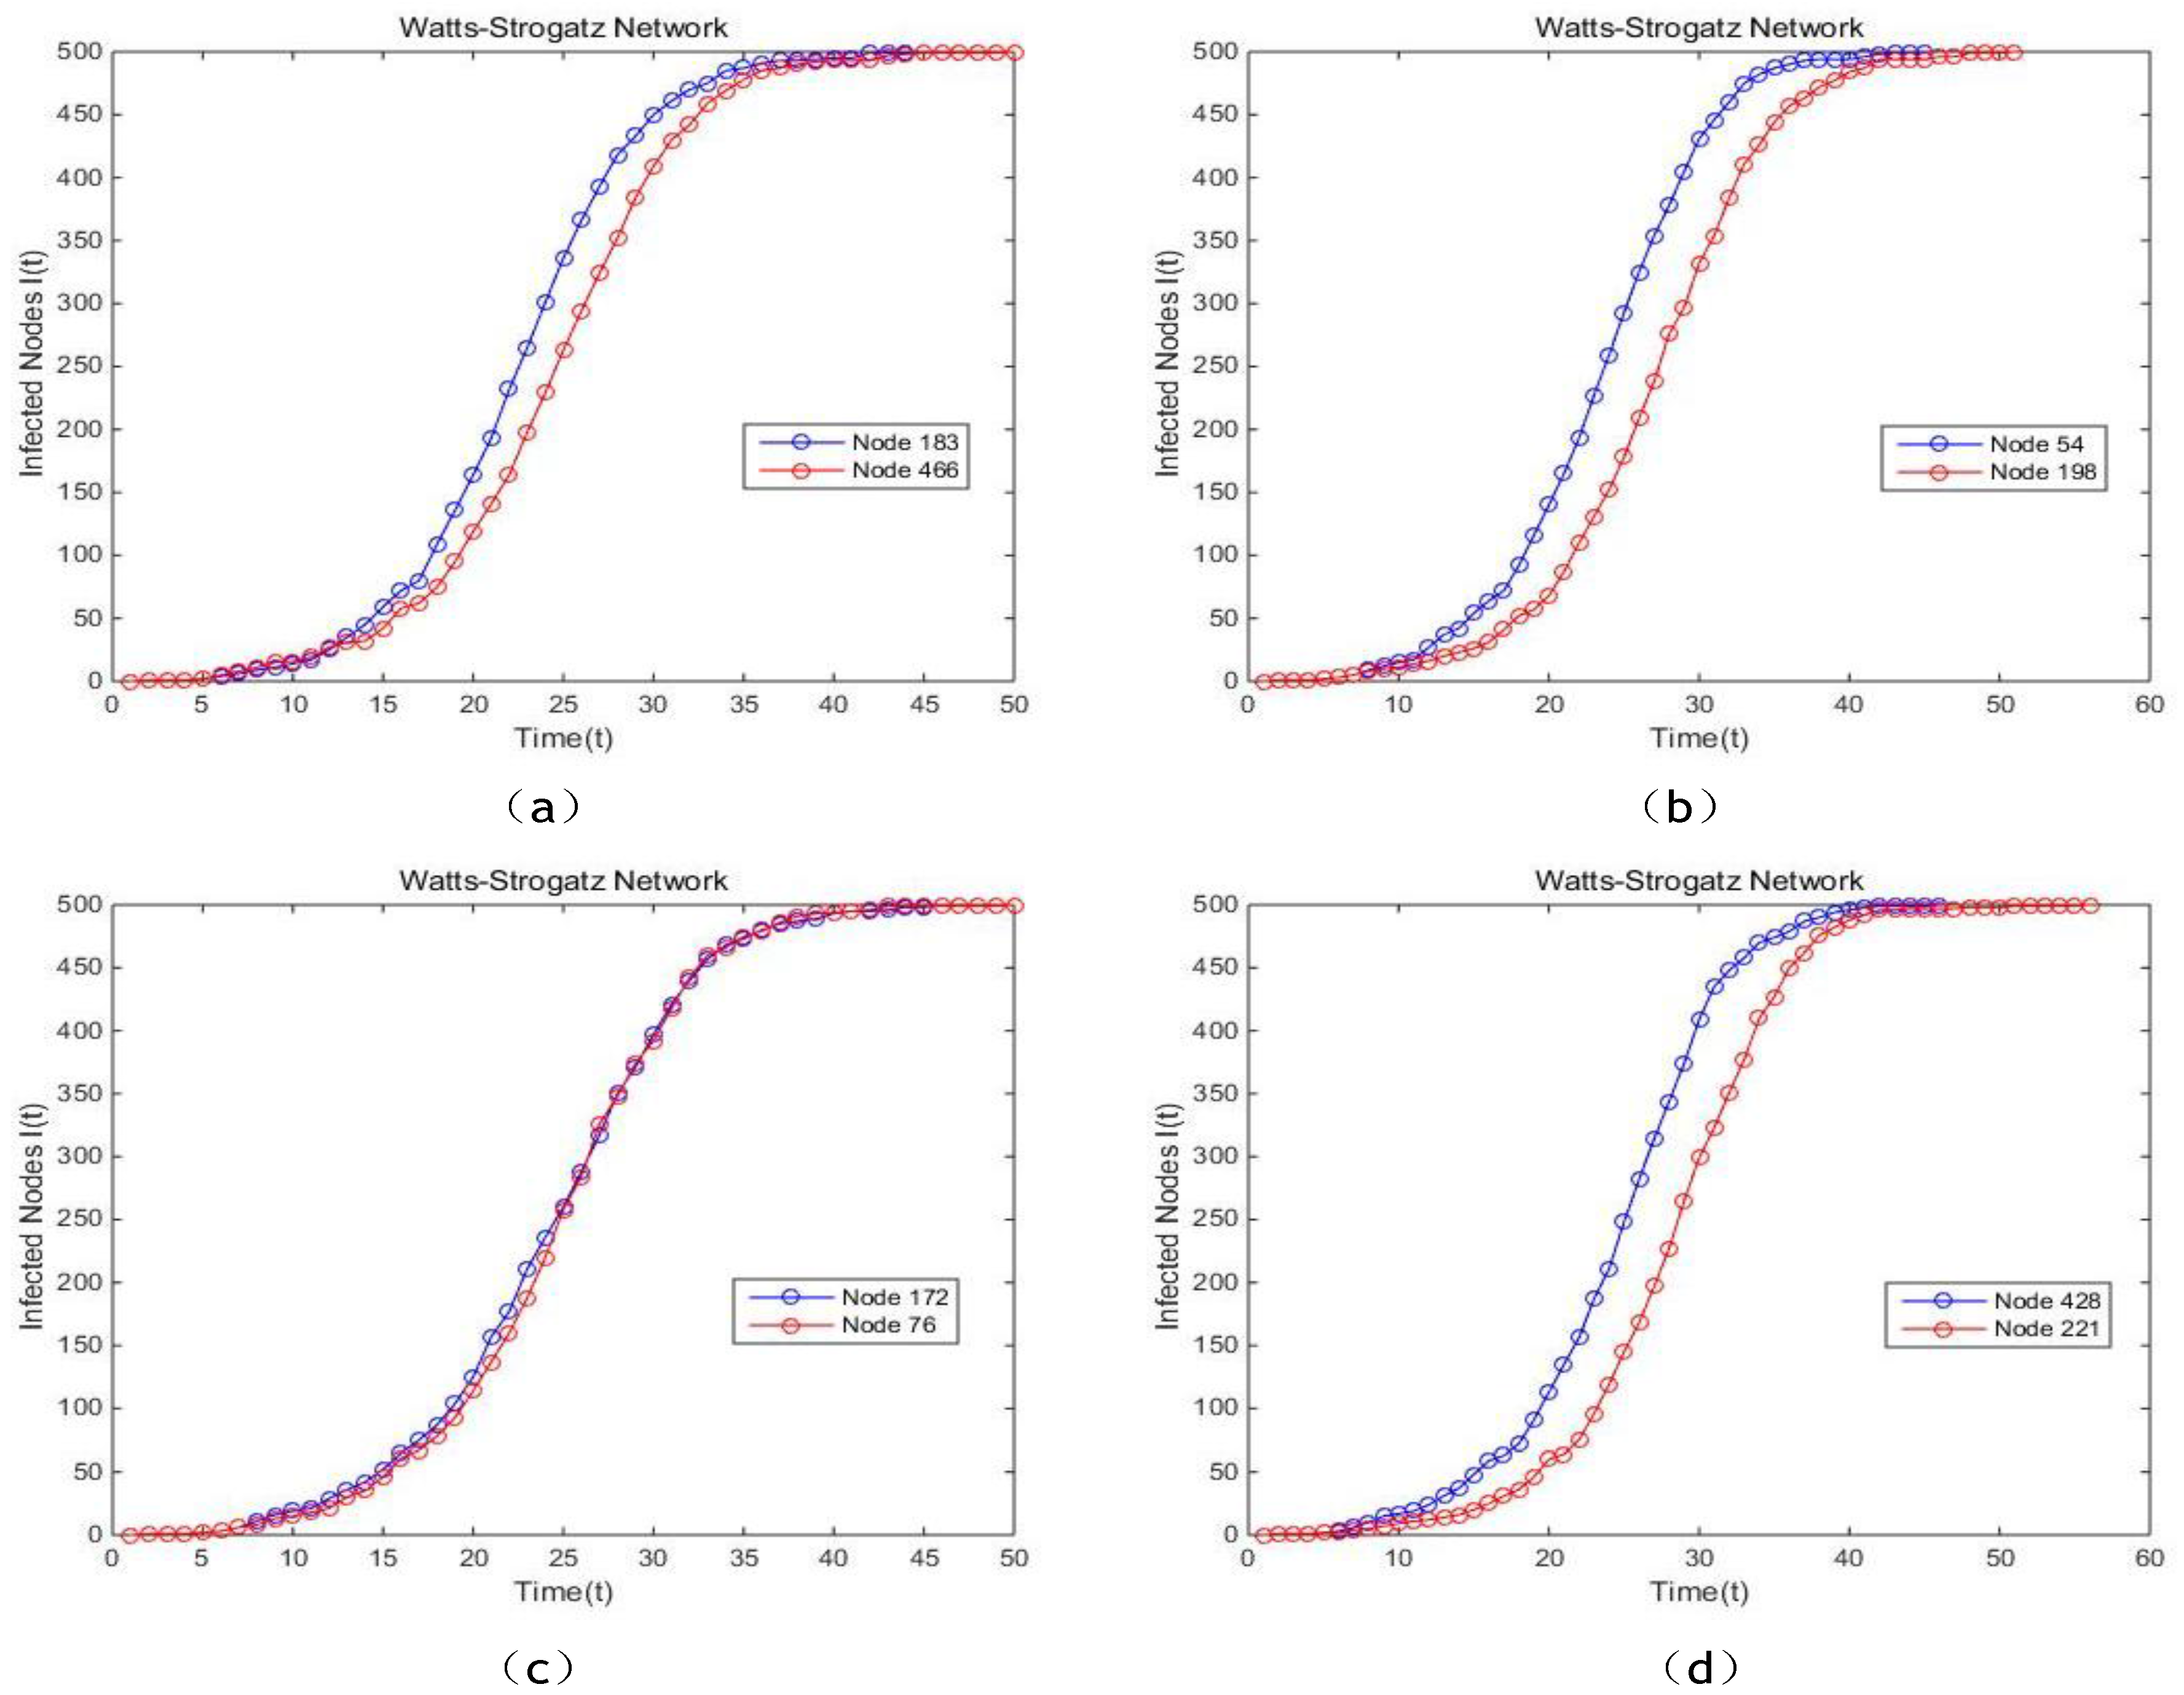
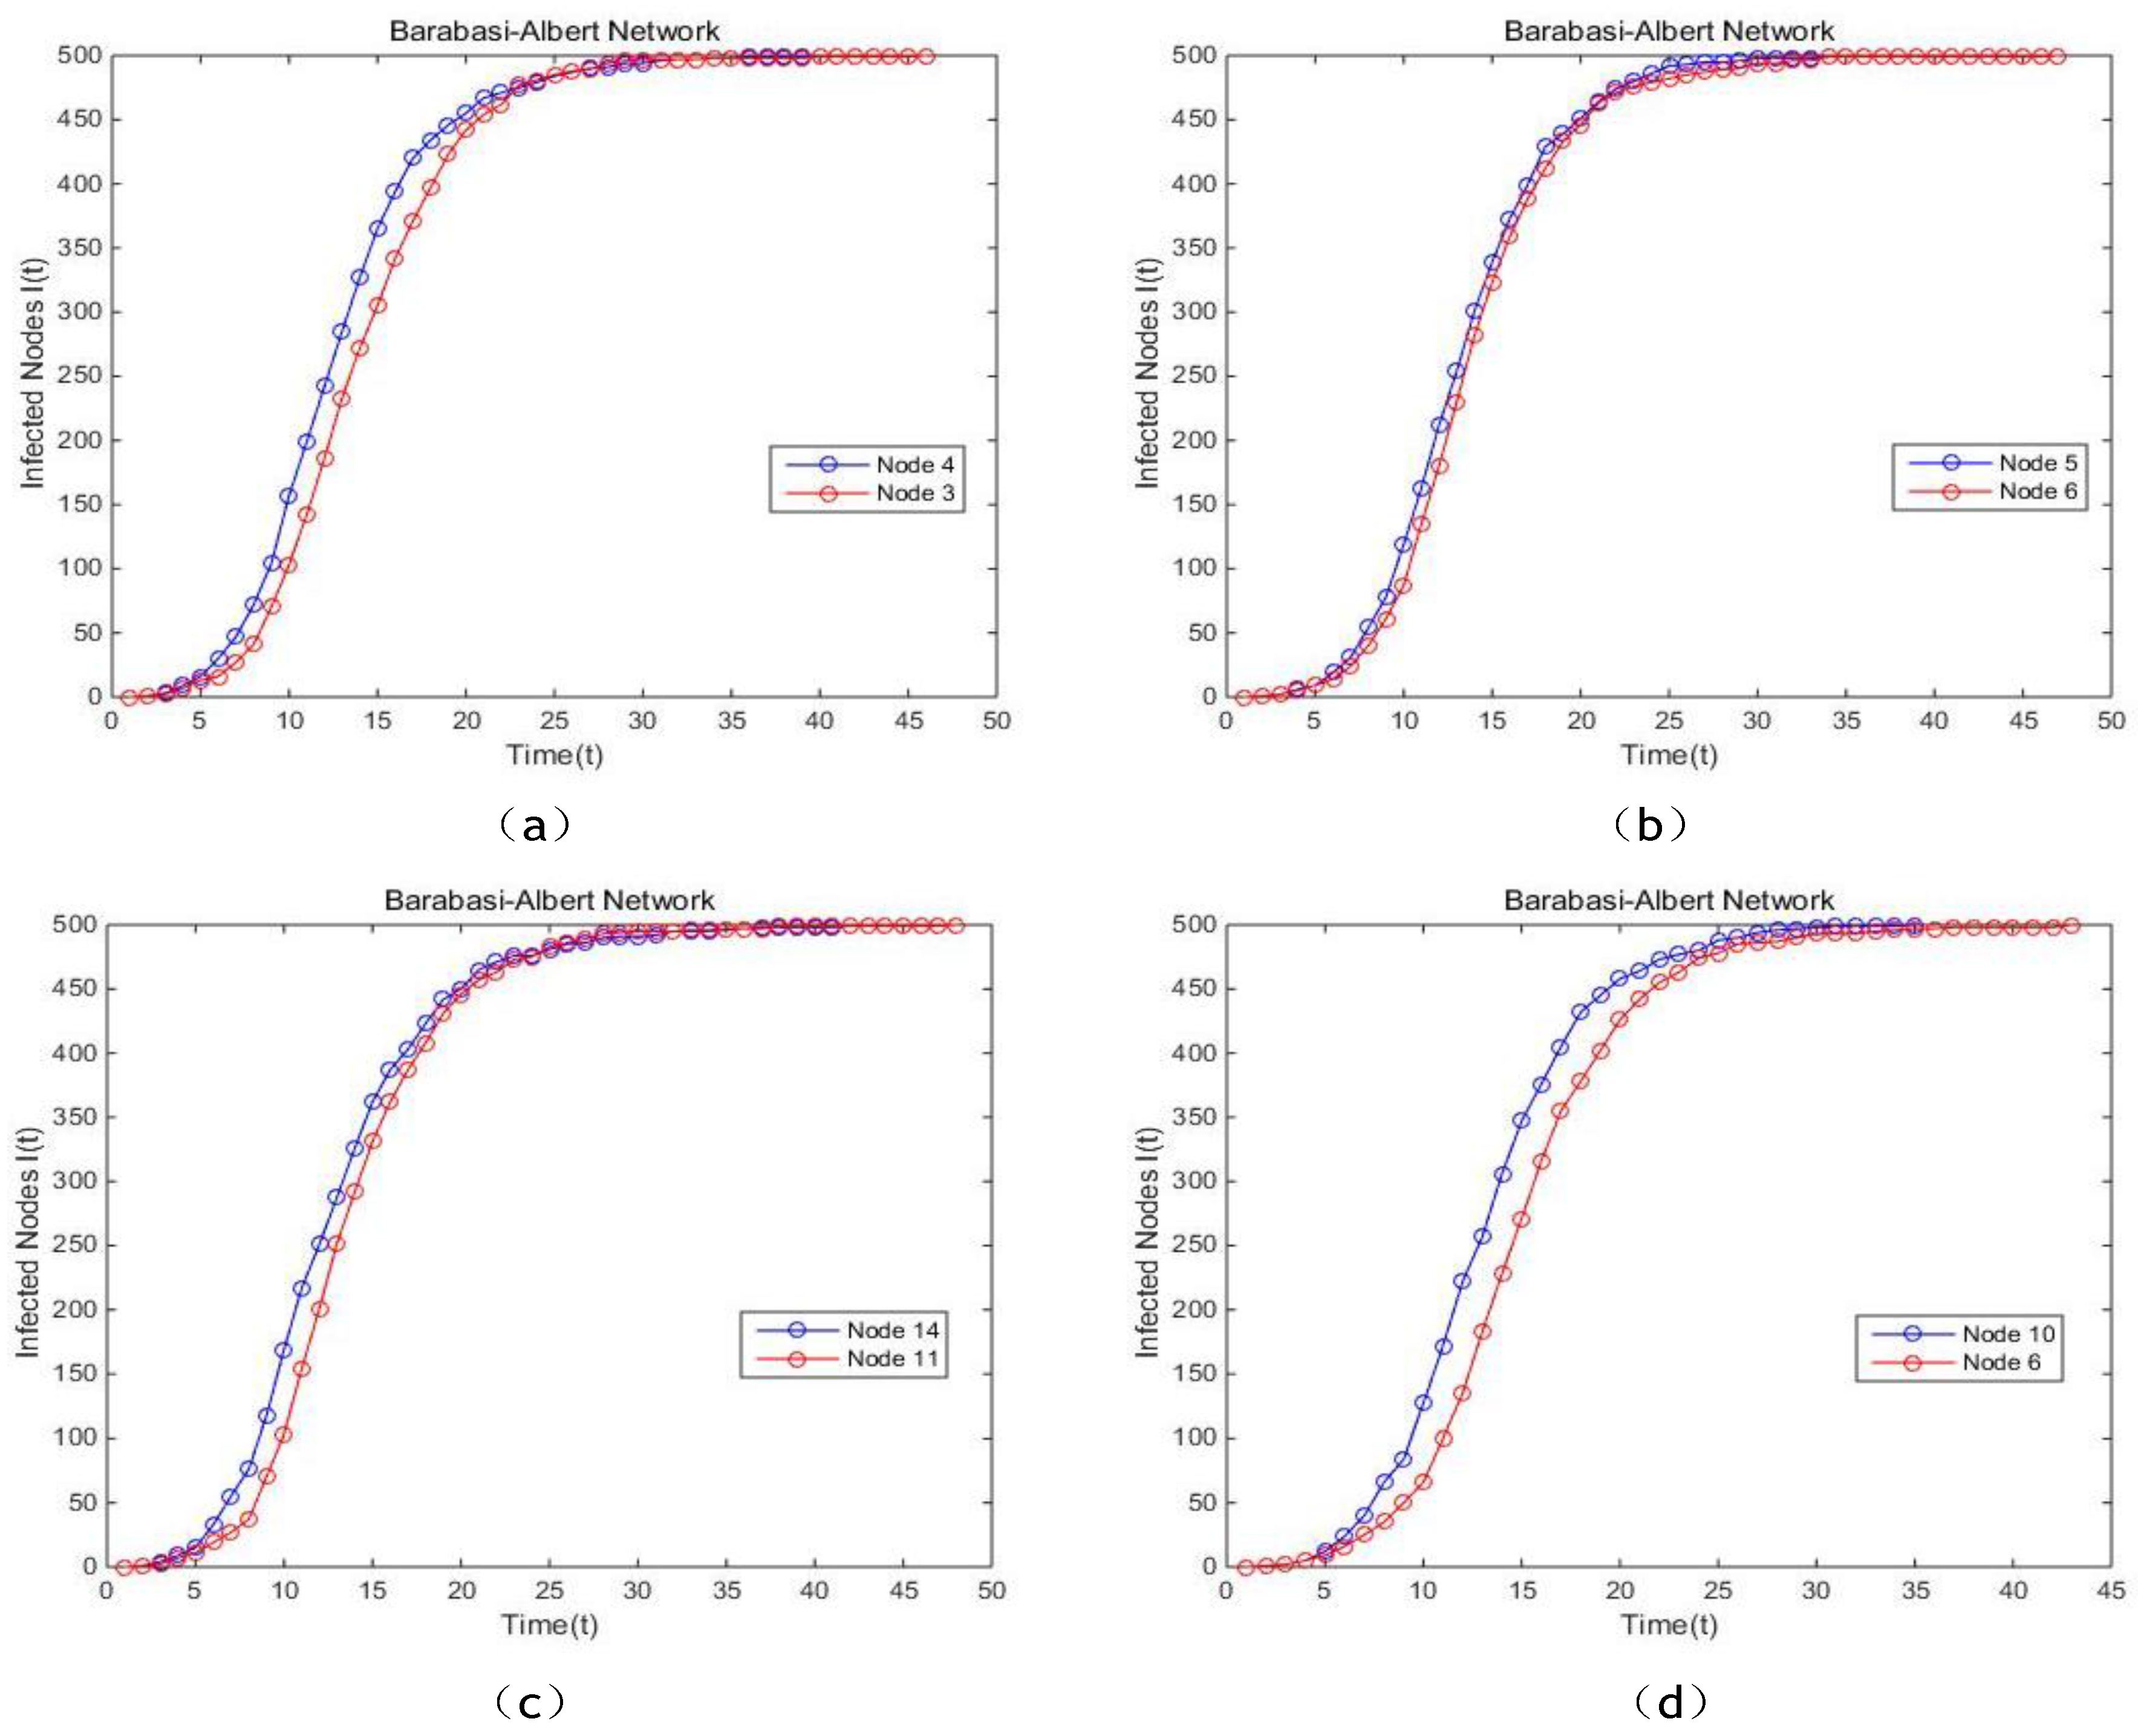
In general, the number of infected nodes increases as propagation time and finally reaches a stable value. From Figure 13, in karate club network, PR shows similar efficiency with the proposed method for their curves are almost overlapping. While the proposed model outperforms PR and EC for the spreading rate, which means node 32 is more influential compared with node 14 and node 4. Also, this comparison is in line with our approach. In UsAir97 network, the curve generated from the proposed method is smoother and steeper in comparison with the curve of BC, which can be seen in Figure 14b. Indicated by Figure 14a, the same conclusion that the proposed model outperforms slightly PR and EC and has higher stability. In Collaboration network, time step of this simulation is set for 10,000, in order to reduce calculation time. It is apparent that the proposed model is more effective for identifying the vital node compared with BC, CC and PR, since the curve of the proposed model is smoother, which is supported by Figure 15a,b,d. Also, nodes sorted by our method show higher spread speed and finally infect more nodes in comparison with the nodes ranked by BC, EC and PR. Moreover, the proposed model indicates comparable effectiveness with EC, which can be concluded from Figure 15c. In the Email network, the curves of the proposed model, BC, CC and PR almost completely coincide, which means theses four methods show similar effectiveness. From the results shown in Figure 16c, the slope of the curve of the proposed model is slightly higher compared with the curves of EC, which indicates that the spread rate of nodes ranked by us is higher. In addition, the total infectious time of the nodes sorted by the proposed model is significantly shorter.
In the artificial network modeled by Erdos-Renyi, it is apparent that the proposed model is more suitable for identifying the vital node compared with BC, CC and PR, because the curves generated by our method is steeper and smoother, which indicates that the spreading speed of nodes ranked by our method is higher, as well as proves that single node selected by the proposed model is more influential. In Watts-Stroggatz network, based on the results illustrated in Figure 18a,b,d, it can be concluded that the single node sorted by our method possess significantly higher spreading rate, consequently infects all the other nodes in a shorter time. The curves of the proposed model and EC are almost overlapping, which means they present a similar performance. In Barabasi-Albert network, it is not difficult to come to the conclusion that the proposed model has a better performance compared with BC, EC and PR because of the faster speed of the dissemination. Also, the curves generated by the proposed model are more stable and smoother. In conclusion, the proposed method is validated to be preferable to other centrality methods referred above.

7. Conclusions and Discussion

In this paper, on the purpose of quantifying influence in networks, we introduce a novel type of centrality measure based on decompositions of a graph into subgraphs and calculation on the entropy of neighbor nodes. The efficiency of the proposed model is analyzed on the foundation of real-world data sets and three artificial networks which consists of Barabasi-Albert network, Erdos-Renyi network and Watts-Stroggatz network. The four datasets are Zackary’s karate club, USAir97, Collaboration network and Email network URV respectively. The extensive analytical results show that the proposed model outperforms the well-known measures including degree centrality, betweenness centrality, closeness centrality, eigenvector centrality and PageRank.
In our work, we define a new centrality metric and prove its effectiveness by using various real-world networks with different sizes and densities. It is obvious that perfect mechanisms, free of any presumptions or limitations, do not exist. The method proposed by us also has its own limitations and relies on specific assumptions. We try to summarize the presumptions and biases that present in our method. First, Equation (11) used to characterize how influence propagates through the network is subject to certain assumption that paths between nodes and their two-hop neighbors are endowed with the equal weight. Second, in this paper we assume that we may not hold steady connections to friends, neighbors or partners at three degrees of separation, which indicates that we could not affect nor be affected by people at three degrees and beyond. Furthermore, it is clear that the computational complexity can be significantly reduced by accepting this assumption. Now, we would like to identity and explore all the potential limitations in our proposed model. The real-world networks based on which we test the effectiveness of the proposed model are undirected, unweighted and static. Even though these networks vary from diverse sizes and densities. With respect to weighted networks, appropriate modifications must be made to Equation (5). Another noteworthy limitation of the work is an exclusive focus on undirected graphs. The concept that a directed graph can be changed into another undirected graph may be a reasonable explanation. However, the proposed method loses the capacity to capture the dynamic process, which is described by scientists such as Grindrod and Higham [63,64], Barrat et al. [65], Lentz et al. [66], Gómez et al. [67], Lambiotte et al. [68] and Liu et al. [69]. Albeit with the limitations and constraints, we invite other researchers to innovate and suggest alternatives. We hope our work will play a role in stimulating interest in this area. Also, we are fond of applying new and better models regarding how to measure influence in complex networks.
As for the future work, more graphs with different structures will be used to validate our proposed method. It is also possible that the proposed model which relies on local network structure characterized by its edges can be functional for social network community detection and visualization. Besides, we will investigate the potential properties of the proposed model and extend its application areas.

Acknowledgments

The authors sincerely thank Yangyang Tian, Ganjun Yu, Yunhao Yan, Yingjie Pan, Yongli Li and Chen Liu for their insightful and helpful comments. And the authors are very grateful for the insightful comments and suggestions of the anonymous reviewers and the editor, which have helped to significantly improve this article. Furthermore, this research was supported by the National Natural Science Foundation of China (No. 71371025), the Fundamental Research Funds for the Central Universities (No. YWF-17-XGB-008), Aviation Science Fund (No. 2016ZG51058) and Teaching Reform Fund of Beihang University.

Author Contributions

Conceptualization, methodology, algorithms, writing the original draft is done by Tong Qiao. Topic selection, framework construction, problem formulation, formal analysis and manuscript revision is done by Wei Shan. Code writing, computations, visualization is provided by Chang Zhou. All the authors equally contribute in proofreading the paper.

Conflicts of Interest

The authors declare no conflict of interest.

References

  1. Freeman, L.C. Centrality in networks: I. Conceptual clarification. Soc. Netw. 1979, 1, 215–239. [Google Scholar] [CrossRef]
  2. Katz, L. A new index derived from sociometric data analysis. Psychometrika 1953, 18, 39–43. [Google Scholar] [CrossRef]
  3. Hubbell, C.H. An input-output approach to clique identification. Sociometry 1965, 28, 377–399. [Google Scholar] [CrossRef]
  4. Bonacich, P. Factoring and weighting approaches to status scores and clique identification. J. Math. Sociol. 1972, 2, 113–120. [Google Scholar] [CrossRef]
  5. Bonacich, P.; Lloyd, P. Eigenvector-like measures of centrality for asymmetric relations. Soc. Netw. 2001, 23, 191–201. [Google Scholar] [CrossRef]
  6. Stephenson, K.; Zelen, M. Rethinking centrality: Methods and examples. Soc. Netw. 1989, 11, 1–37. [Google Scholar] [CrossRef]
  7. Borgatti, S.P. Centrality and network flow. Soc. Netw. 2005, 27, 55–71. [Google Scholar] [CrossRef]
  8. Freeman, L.C.; Borgatti, S.P.; White, D.R. Centrality in valued graphs: A measure of betweenness based on network flow. Soc. Netw. 1991, 13, 141–154. [Google Scholar] [CrossRef]
  9. Langville, A.N.; Meyer, C.D. Google’s PageRank and Beyond: The Science of Search Engine Rankings; Princeton University Press: Princeton, NJ, USA, 2011. [Google Scholar]
  10. Rashevsky, N. Life information theory and topology. Bull. Math. Biophys. 1955, 17, 229–235. [Google Scholar] [CrossRef]
  11. Trucco, E. A note on the information content of graphs. Bull. Math. Biol. 1956, 18, 129–135. [Google Scholar] [CrossRef]
  12. Dehmer, M. Information processing in complex networks: Graph entropy and information functionals. Appl. Math. Comput. 2008, 201, 82–94. [Google Scholar] [CrossRef]
  13. Dehmer, M.; Kraus, V. On extremal properties of graph entropies. Match Commun. Math. Comput. Chem. 2012, 68, 889–912. [Google Scholar]
  14. Dehmer, M.; Mowshowitz, A. A history of graph entropy measures. Inf. Sci. 2011, 181, 57–78. [Google Scholar] [CrossRef]
  15. Bonchev, D. Complexity in Chemistry, Introduction and Fundamentals; Taylor & Francis: Boca Raton, FL, USA, 2003. [Google Scholar]
  16. Cao, S.; Dehmer, M.; Shi, Y. Extremality of degree-based graph entropies. Inf. Sci. 2014, 278, 22–33. [Google Scholar] [CrossRef]
  17. Chen, Z.; Dehmer, M.; Shi, Y. Bounds for degree-based network entropies. Appl. Math. Comput. 2015, 265, 983–993. [Google Scholar] [CrossRef]
  18. Nikolaev, A.G.; Razib, R.; Kucheriya, A. On efficient use of entropy centrality for social network analysis and community detection. Soc. Netw. 2015, 40, 154–162. [Google Scholar] [CrossRef]
  19. Estrada, E.; Rodríguez-Velázquez, J.A. Spectral measures of bipartivity in complex networks. Phys. Rev. E 2005, 72, 046105. [Google Scholar] [CrossRef] [PubMed]
  20. Gómez, D.; González-Arangüena, E.; Manuel, C.; Owen, G.; Pozo, M.D.; Tejada, J. Centrality and power in social networks: A game theoretic approach. Math. Soc. Sci. 2003, 46, 27–54. [Google Scholar] [CrossRef]
  21. Gómez, D.; Figueira, J.R.; Eusébio, A. Modeling centrality measures in social network analysis using bi-criteria network flow optimization problems. Eur. J. Oper. Res. 2013, 226, 354–365. [Google Scholar] [CrossRef]
  22. Newman, M.E.J. A measure of betweenness centrality based on random walks. Soc. Netw. 2005, 27, 39–54. [Google Scholar] [CrossRef]
  23. Du, Y.; Gao, C.; Hu, Y.; Mahadevan, S.; Deng, Y. A new method of identifying influential nodes in complex networks based on topsis. Physica A 2014, 399, 57–69. [Google Scholar] [CrossRef]
  24. Gao, C.; Wei, D.; Hu, Y.; Mahadevan, S.; Deng, Y. A modified evidential methodology of identifying influential nodes in weighted networks. Physica A 2013, 392, 5490–5500. [Google Scholar] [CrossRef]
  25. Lü, L.; Zhou, T.; Zhang, Q.M.; Stanley, H.E. The H-index of a network node and its relation to degree and coreness. Nat. Commun. 2016, 7, 10168. [Google Scholar] [CrossRef] [PubMed]
  26. Chen, D.; Lü, L.; Shang, M.S.; Zhang, Y.C.; Zhou, T. Identifying influential nodes in complex networks. Physica A 2012, 391, 1777–1787. [Google Scholar] [CrossRef]
  27. Chen, D.B.; Gao, H.; Lü, L.; Zhou, T. Identifying influential nodes in large-scale directed networks: The role of clustering. PLoS ONE 2013, 8, e77455. [Google Scholar] [CrossRef] [PubMed]
  28. Zeng, A.; Zhang, C.J. Ranking spreaders by decomposing complex networks. Phys. Lett. A 2013, 377, 1031–1035. [Google Scholar] [CrossRef]
  29. Pei, S.; Muchnik, L.; Andrade, J.S., Jr.; Zheng, Z.; Makse, H.A. Searching for superspreaders of information in real-world social media. Sci. Rep. 2014, 4, 5547. [Google Scholar] [CrossRef] [PubMed]
  30. Martin, T.; Zhang, X.; Newman, M.E. Localization and centrality in networks. Phys. Rev. E 2014, 90, 052808. [Google Scholar] [CrossRef] [PubMed]
  31. Li, Q.; Zhou, T.; Lü, L.; Chen, D. Identifying influential spreaders by weighted leaderrank. Physica A 2014, 404, 47–55. [Google Scholar] [CrossRef]
  32. Zhao, X.Y.; Huang, B.; Tang, M.; Zhang, H.F.; Chen, D.B. Identifying effective multiple spreaders by coloring complex networks. EPL 2014, 108, 6. [Google Scholar] [CrossRef]
  33. Min, B.; Liljeros, F.; Makse, H.A. Finding influential spreaders from human activity beyond network location. PLoS ONE 2015, 10, e0136831. [Google Scholar] [CrossRef] [PubMed]
  34. Gleich, D.F. Pagerank beyond the web. SIAM Rev. 2015, 57, 321–363. [Google Scholar] [CrossRef]
  35. Lü, L.; Pan, L.; Zhou, T.; Zhang, Y.C.; Stanley, H.E. Toward link predictability of complex networks. Proc. Natl. Acad. Sci. USA 2015, 112, 2325–2330. [Google Scholar] [CrossRef] [PubMed]
  36. Morone, F.; Makse, H. Influence maximization in complex networks through optimal percolation. Nature 2015, 527, 544. [Google Scholar] [CrossRef] [PubMed]
  37. Shannon, C.E.; Weaver, W.; Wiener, N. The Mathematical Theory of Communication; University of Illinois Press: Urbana, IL, USA, 1949. [Google Scholar]
  38. Mowshowitz, A. Entropy and the complexity of graphs. II. The information content of digraphs and infinite graphs. Bull. Math. Biophys. 1968, 30, 225–240. [Google Scholar] [CrossRef]
  39. Everett, M.G. Role similarity and complexity in social networks. Soc. Netw. 1985, 7, 353–359. [Google Scholar] [CrossRef]
  40. Balch, T. Hierarchic social entropy: An information theoretic measure of robot group diversity. Autonom. Robot. 2000, 8, 209–238. [Google Scholar] [CrossRef]
  41. Tutzauer, F. Entropy as a measure of centrality in networks characterized by path-transfer flow. Soc. Netw. 2007, 29, 249–265. [Google Scholar] [CrossRef]
  42. Emmert-Streib, F.; Dehmer, M. Global information processing in gene networks: Fault tolerance. Physica A 2008, 388, 541–548. [Google Scholar] [CrossRef]
  43. Claussen, J.C. Offdiagonal complexity: A computationally quick complexity measure for graphs and networks. Physica A 2007, 375, 365–373. [Google Scholar] [CrossRef]
  44. Dehmer, M. Information-theoretic concepts for the analysis of complex networks. Appl. Artif. Intell. 2008, 22, 684–706. [Google Scholar] [CrossRef]
  45. Kim, J.; Wilhelm, T. What is a complex graph? Physica A 2008, 387, 2637–2652. [Google Scholar] [CrossRef]
  46. Anand, K.; Bianconi, G. Entropy measures for networks: Toward an information theory of complex topologies. Phys. Rev. E 2009, 80, 045102. [Google Scholar] [CrossRef] [PubMed]
  47. Cao, S.; Dehmer, M. Degree-based entropies of networks revisited. Appl. Math. Comput. 2015, 261, 141–147. [Google Scholar] [CrossRef]
  48. Nie, T.; Guo, Z.; Zhao, K.; Lu, Z.M. Using mapping entropy to identify node centrality in complex networks. Physica A 2016, 453, 290–297. [Google Scholar] [CrossRef]
  49. Fei, L.; Deng, Y. A new method to identify influential nodes based on relative entropy. Chaos Solitons Fractals 2017, 104, 257–267. [Google Scholar] [CrossRef]
  50. Peng, S.; Yang, A.; Cao, L.; Yu, S.; Xie, D. Social influence modeling using information theory in mobile social networks. Inf. Sci. 2017, 379, 146–159. [Google Scholar] [CrossRef]
  51. Bonchev, D.; Trinajstić, N. Information theory, distance matrix and molecular branching. J. Chem. Phys. 1977, 67, 4517–4533. [Google Scholar] [CrossRef]
  52. Dehmer, M.; Varmuza, K.; Borgert, S.; Emmert-streib, F. On entropy-based molecular descriptors: Statistical analysis of real and synthetic chemical structures. J. Chem. Inf. Model. 2009, 49, 1655–1663. [Google Scholar] [CrossRef] [PubMed]
  53. Christakis, N.A.; Fowler, J.H. Connected: The Surprising Power of Our Social Networks and How They Shape Our Lives; Little, Brown: New York, NY, USA, 2011. [Google Scholar]
  54. Christakis, N.A.; Fowler, J.H. Social contagion theory: Examining dynamic social networks and human behavior. Stat. Med. 2013, 32, 556–577. [Google Scholar] [CrossRef] [PubMed]
  55. Brown, J.J.; Reingen, P.H. Social ties and word of mouth referral behavior. J. Consum. Res. 1987, 14, 350–362. [Google Scholar] [CrossRef]
  56. Singh, J. Collaborative networks as determinants of knowledge diffusion patterns. Manag. Sci. 2005, 51, 756–770. [Google Scholar] [CrossRef]
  57. Bliss, C.A.; Kloumann, I.M.; Harris, K.D.; Danforth, C.M.; Dodds, P.S. Twitter reciprocal reply networks exhibit assortativity with respect to happiness. J. Comput. Sci. 2012, 3, 388–397. [Google Scholar] [CrossRef]
  58. McDermott, R.; Fowler, J.H.; Christakis, N.A. Breaking up is hard to do, unless everyone else is doing it too: Social network effects on divorce in a longitudinal sample. Soc. Forces 2013, 92, 491. [Google Scholar] [CrossRef] [PubMed]
  59. Mednick, S.C.; Christakis, N.A.; Fowler, J.H. The spread of sleep loss influences drug use in adolescent social networks. PLoS ONE 2010, 5, e9775. [Google Scholar] [CrossRef] [PubMed] [Green Version]
  60. Zachary, W.W. An information flow model for conflict and fission in small groups. J. Anthropol. Res. 1977, 33, 452–473. [Google Scholar] [CrossRef]
  61. Newman, M.E.J. Finding community structure in networks using the eigenvectors of matrices. Phys. Rev. E 2006, 74, 036104. [Google Scholar] [CrossRef] [PubMed]
  62. Guimerà, R.; Danon, L.; Díaz-Guilera, A.; Giralt, F.; Arenas, A. Self-similar community structure in a network of human interactions. Phys. Rev. E 2003, 68, 065103. [Google Scholar] [CrossRef] [PubMed]
  63. Grindrod, P.; Higham, D.J. A matrix iteration for dynamic network summaries. SIAM Rev. 2013, 55, 118–128. [Google Scholar] [CrossRef] [Green Version]
  64. Grindrod, P.; Higham, D.J. A dynamical systems view of network centrality. Proc. Math. Phys. Eng. Sci. 2014, 470, 20130835. [Google Scholar] [CrossRef] [PubMed]
  65. Barrat, A.; Fernandez, B.; Lin, K.K.; Young, L.S. Modeling temporal networks using random itineraries. Phys. Rev. Lett. 2013, 110, 158702. [Google Scholar] [CrossRef] [PubMed]
  66. Lentz, H.H.; Selhorst, T.; Sokolov, I.M. Unfolding accessibility provides a macroscopic approach to temporal networks. Phys. Rev. Lett. 2013, 110, 118701. [Google Scholar] [CrossRef] [PubMed]
  67. Gómez, S.; Díazguilera, A.; Gómezgardeñes, J.; Pérezvicente, C.J.; Moreno, Y.; Arenas, A. Diffusion dynamics on multiplex networks. Phys. Rev. Lett. 2013, 110, 028701. [Google Scholar] [CrossRef] [PubMed]
  68. Lambiotte, R.; Sinatra, R.; Delvenne, J.C.; Evans, T.S.; Barahona, M.; Latora, V. Flow graphs: Interweaving dynamics and structure. Phys. Rev. E 2011, 84, 017102. [Google Scholar] [CrossRef] [PubMed]
  69. Liu, J.G.; Lin, J.H.; Guo, Q.; Zhou, T. Locating influential nodes via dynamics-sensitive centrality. Sci. Rep. 2015, 6, 032812. [Google Scholar] [CrossRef] [PubMed]
Figure 1. Double path.
Entropy 19 00614 g001
Figure 2. A friendship network for example.
Entropy 19 00614 g002
Figure 3. A network for example.
Entropy 19 00614 g003
Figure 4. The subgraph G i constructed by node 1 and its one-hop neighbors.
Entropy 19 00614 g004
Figure 5. (a) Degree distributions of Erdos-Renyi network; (b) Degree distributions of Watts-Stroggatz network; (c) Degree distributions of Barabasi-Albert network.
Entropy 19 00614 g005
Figure 6. The frequency of nodes with the same centrality value using different measures in the karate club network.
Entropy 19 00614 g006
Figure 7. The frequency of nodes with the same centrality value using different measures in USAir club network.
Entropy 19 00614 g007
Figure 8. The frequency of nodes with the same centrality value using different measures in Collaboration network.
Entropy 19 00614 g008
Figure 9. The frequency of nodes with the same centrality value using different measures in Email network.
Entropy 19 00614 g009
Figure 10. The frequency of nodes with the same centrality value using different measures in Erdos-Renyi network.
Entropy 19 00614 g010
Figure 11. (a) The frequency of nodes with the same centrality value using different measures in Watts-Stroggatz network; (b) The frequency of nodes with the same centrality value using EC, BC, CC and the proposed measures in Watts-Stroggatz network.
Entropy 19 00614 g011
Figure 12. The frequency of nodes with the same centrality value using different measures in Barabasi-Albert network.
Entropy 19 00614 g012
Figure 13. Comparing the spreading capacity of single node in karate club network between the proposed model and EC, PR.
Entropy 19 00614 g013
Figure 14. (a) A comparison of the spreading capacity of single node in USAir network between the proposed model and EC, PR; (b) A comparison of the spreading capacity of single node in USAir network between the proposed model and BC.
Entropy 19 00614 g014
Figure 15. (a) A comparison of the spreading capacity of single node in Collaboration network between the proposed model and BC; (b) A comparison of the spreading capacity of single node in Collaboration network between the proposed model and CC; (c) A comparison of the spreading capacity of single node in Collaboration network between the proposed model and EC; (d) A comparison of the spreading capacity of single node in Collaboration network between the proposed model and PR.
Entropy 19 00614 g015
Figure 16. (a) A comparison of the spreading capacity of single node in Email network between the proposed model and BC; (b) A comparison of the spreading capacity of single node in Email network between the proposed model and CC; (c) A comparison of the spreading capacity of single node in Email network between the proposed model and EC; (d) A comparison of the spreading capacity of single node in Email network between the proposed model and PR.
Entropy 19 00614 g016
Figure 17. (a) A comparison of the spreading capacity of single node in Erdos-Renyi network between the proposed model and BC; (b) A comparison of the spreading capacity of single node in Erdos-Renyi network between the proposed model and CC; (c) A comparison of the spreading capacity of single node in Erdos-Renyi network between the proposed model and EC; (d) A comparison of the spreading capacity of single node in Erdos-Renyi network between the proposed model and PR.
Entropy 19 00614 g017aEntropy 19 00614 g017b
Figure 18. (a) A comparison of the spreading capacity of single node in Watts-Stroggatz network between the proposed model and BC; (b) A comparison of the spreading capacity of single node in Watts-Stroggatz network between the proposed model and CC; (c) A comparison of the spreading capacity of single node in Watts-Stroggatz network between the proposed model and EC; (d) A comparison of the spreading capacity of single node in Watts-Stroggatz network between the proposed model and PR.
Entropy 19 00614 g018
Figure 19. (a) A comparison of the spreading capacity of single node in Barabasi-Albert network between the proposed model and BC; (b) A comparison of the spreading capacity of single node in Barabasi-Albert network between the proposed model and CC; (c) A comparison of the spreading capacity of single node in Barabasi-Albert network between the proposed model and EC; (d) A comparison of the spreading capacity of single node in Barabasi-Albert network between the proposed model and PR.
Entropy 19 00614 g019
Table 1. The values of S D C i of nodes in the subgraph G i .
Node S D C i
13
22
42
61
Table 2. Value of total influence for each node.
NodeLocal InfluenceIndirect InfluenceTotal Influence
10.57370.35840.4876
20.68360.45100.5906
30.57370.39340.5016
40.59330.41930.5237
50.74570.44390.6250
60.57370.37850.4956
70.57370.38200.4970
80.45150.25900.3745
Table 3. The results of ranking.
NodeNo.
51
22
43
34
75
66
17
88
Table 4. The top-10 ranked nodes of karate club network by degree centrality (DC), closeness centrality (CC), betweenness centrality (BC), eigenvector centrality (EC), pagerank (PR) and the proposed method.
Karate Club Network
RankDCBCCCECPRProposed Model
1341134341
213431134
333333433333
433323333
52329222
649149324
73223314432
8914204249
91420232914
102464311424
Table 5. The top-10 ranked nodes of USAir97 network by degree centrality (DC), closeness centrality (CC), betweenness centrality (BC), eigenvector centrality (EC), pagerank (PR) and the proposed method.
USAir97 Network
RankDCBCCCECPRProposed Model
1118118118118118118
22618261261261261
325526167255182255
4182201255182152152
515247201152255182
6230182182230230230
716625547112166166
86715224867201147
911231316616667112
1020113112147867
Table 6. The top-10 ranked nodes of the collaboration network by degree centrality (DC), closeness centrality (CC), betweenness centrality (BC), eigenvector centrality (EC), pagerank (PR) and the proposed method.
Collaboration Network
RankDCBCCCECPRProposed Model
1337878337833
234150281343334
378516150543454
4542817565328153
529421630113229478
6623415113321662
72167563413454219
821930113156196216
9281131759562150294
1053203112384046281
Table 7. The top-10 ranked nodes of e-mail network URV by degree centrality (DC), closeness centrality (CC), betweenness centrality (BC), eigenvector centrality (EC), pagerank (PR) and the proposed method.
E-mail Network URV
RankDCBCCCECPRProposed Model
1105333333105105105
233310523162316
3162310519633342
4235784220441196
542764142423
641233764916333
71961352335623349
8233415211635541
92135513533321354
107642378324332
Table 8. The top-10 ranked nodes of Erdos-Renyi network by degree centrality (DC), closeness centrality (CC), betweenness centrality (BC), eigenvector centrality (EC), pagerank (PR) and the proposed method.
Erdos-Renyi Network
RankDCBCCCECPRProposed Model
1747474747474
2888863888888
3232323632323
4999988399963
5686868686868
6256339234639
7463926693946
863429925255
939762726636
1042132278699
Table 9. The top-10 ranked nodes of Watts-Stroggatz network by degree centrality (DC), closeness centrality (CC), betweenness centrality (BC), eigenvector centrality (EC), pagerank (PR) and the proposed method.
Watts-Stroggatz Network
RankDCBCCCECPRProposed Model
1466466466466466183
218319854183183466
322154291185162398
454130130428221428
532213128429322221
61621621985419854
71982211671985497
84041143376271172
911183211467294198
10131281336963454
Table 10. The top-10 ranked nodes of Barabasi-Albert network by degree centrality (DC), closeness centrality (CC), betweenness centrality (BC), eigenvector centrality (EC), pagerank (PR) and the proposed method.
Barabasi-Albert Network
RankDCBCCCECPRProposed Model
1222222
2000000
3999493
4443349
5534954
6366635
7115115116
86111111014
9101057610
10141410601411

