Article

Exergy Analysis of a Syngas-Fueled Combined Cycle with Chemical-Looping Combustion and CO2 Sequestration

by
Álvaro Urdiales Montesino
,
Ángel Jiménez Álvaro
*,
Javier Rodríguez Martín
and
Rafael Nieto Carlier
Department of Energy Engineering, ETSII, Technical University of Madrid, José Gutiérrez Abascal 2, 28006 Madrid, Spain
*
Author to whom correspondence should be addressed.
Entropy 2016, 18(9), 314; https://doi.org/10.3390/e18090314
Submission received: 30 May 2016 / Revised: 29 July 2016 / Accepted: 17 August 2016 / Published: 25 August 2016

Abstract

:
Fossil fuels are still widely used for power generation. Nevertheless, it is possible to attain a short- and medium-term substantial reduction of greenhouse gas emissions to the atmosphere through a sequestration of the CO2 produced in fuels’ oxidation. The chemical-looping combustion (CLC) technique is based on a chemical intermediate agent, which gets oxidized in an air reactor and is then conducted to a separated fuel reactor, where it oxidizes the fuel in turn. Thus, the oxidation products CO2 and H2O are obtained in an output flow in which the only non-condensable gas is CO2, allowing the subsequent sequestration of CO2 without an energy penalty. Furthermore, with shrewd configurations, a lower exergy destruction in the combustion chemical transformation can be achieved. This paper focus on a second law analysis of a CLC combined cycle power plant with CO2 sequestration using syngas from coal and biomass gasification as fuel. The key thermodynamic parameters are optimized via the exergy method. The proposed power plant configuration is compared with a similar gas turbine system with a conventional combustion, finding a notable increase of the power plant efficiency. Furthermore, the influence of syngas composition on the results is investigated by considering different H2-content fuels.

1. Introduction

The carbon capture and storage (CCS) is seen as a potential option for the mitigation of the greenhouse gas (GHG) emissions produced by power generation. Thus, it could facilitate the transition to the use of new sources of clean energy.
Nevertheless, the high energy penalty involved in the separation of carbon dioxide from a gaseous stream seriously questions the viability of CCS in thermal power plants in practice. Conventional separation methods, such as separation by membrane, chemical absorption or adsorption and cryogenic separation are used, e.g., Chiesa and Consonni [1] describes a capture method via amine chemical absorption in the case of a “post-combustion” strategy. In the thermochemical gasification of solid fuels, a previous decarbonization to a mixture of gases (synthesis gas or merely syngas), mainly composed of H2, CO and CO2 and impurities, takes place. In this case, a “pre-combustion” strategy is preferred, since CO2 is quite more concentrated in the syngas than it is in the air after combustion. The energy penalty is lower, but still important. Several methods are assessed by [2]. Another interesting option is the “oxy-combustion” strategy, in which the fuel is burned into oxygen instead of into air, and then, nearly pure CO2 is obtained after the condensation of water. However, although energy savings strategies have been recently proposed to minimize the impact [3], a significant energy consumption occurs here again in the oxygen separation from air.
The alternative technique of chemical-looping combustion (CLC) was first proposed by [4], and afterwards, several researchers have contributed to the development of this technology, e.g., [5]. Nevertheless, most efforts regarding CLC applied to gas turbine systems have been dedicated to the study of methane as fuel, although alternative fuels, such as methanol, have been proposed, as well [6]. There is also prior work on thermodynamic analysis of a CLC gas turbine system with syngas as fuel. For instance, Anheden et al. [7,8] give a very interesting insight on CLC systems, but only the gas turbine cycle is analyzed instead of a combined gas-steam cycle power plant, and the energy savings in the capture of CO2 are not quantified. In a more recent work, Jiménez et al. [9] provide an energetic analysis of a syngas fueled combined cycle with CCS from a first law point of view. The scope of the present work is to complement that analysis with a second law approach in order to provide a further understanding of such systems. The overall exergetic performance of a CLC combined cycle power plant with integrated CO2 capture and fueled by syngas is studied. Details on the behavior of the proposed power plant in a range of operating conditions are provided, and a comparison with a similar gas turbine system with conventional combustion is given. Furthermore, in order to investigate the influence of syngas composition on the results, different H2-content fuels are considered.

1.1. The Chemical-Looping Combustion Concept

The idea of the CLC system is illustrated in Figure 1. The gaseous fuel is introduced into the reduction reactor and put in contact with an oxygen carrier, typically a metal oxide. We denote it generically by “MeO”. The fuel is then oxidized, and the metal oxide is reduced. For both a generic hydrocarbon and carbon monoxide, the reduction reactions (from the oxygen carrier’s point of view) are given by:
( 2 n + m ) MeO + C n H 2 m ( 2 n + m ) Me + m H 2 O + n CO 2
MeO + CO Me + CO 2
Thus, the output stream from reduction reactor contains a gaseous mixture of CO2 and H2O, so that the only non-condensable gas in that flow is CO2. The reduced metal oxide “Me” is then transferred to the oxidation reactor, where it is oxidized in the presence of air in accordance with:
Me + 1 2 O 2 MeO
As a result, at the outlet of this reactor, oxygen-depleted air is obtained, i.e., basically N2 and O2 in a certain proportion.
Depending on both the fuel and oxygen carrier, the reduction reactions (1) and (2) can be endothermic or exothermic, while the oxidation reaction (3) is always exothermic. If one or both of the reduction reactions is/are endothermic and they take place at low/medium temperature (in comparison with temperatures normally achieved in a conventional combustor), then it would be possible to supply the required heat from a medium temperature source. In a gas turbine system, this medium temperature source can be the exhaust gases’ stream. If this is the case, since, according to Hess’ law, the overall amount of heat released in reduction and oxidation reactions must be equal to the fuel’s heat of combustion, the oxidation reaction must have a heat of reaction higher than the conventional combustion:
Δ H comb = Δ H red + Δ H oxi < 0 ; Δ H red > 0 Δ H oxi > Δ H comb
As a result, for the same amount of fuel, more heat would be released at high temperature in comparison with a conventional combustion. As is well known, the exergy content of heat is greater the higher the temperature at which it is released. Thus, CLC acts as a “chemical heat pump” transforming energy with a lower exergy content into energy with a higher exergy content [10]. In other words, the overall exergy destruction due to irreversibility is lower with CLC than with conventional combustion. A very interesting recent theoretical analysis of this kind of “chemical energy amplification” can be found in [11].
On the other hand, and more importantly, the carbon dioxide that results from the fuel oxidation is not diluted in air or any other non-condensable gas. Contrarily, it is obtained in a relatively pure form after the condensation of water, as was the case for the “oxy-combustion” technique mentioned above. This avoids any energy penalty due to the separation of the carbon dioxide from other gases or of the oxygen from air. The previous two aspects, and particularly the last one, are the major advantages of CLC. Furthermore, it can also be mentioned that in the CLC combustion process, the fuel and air pass through different reactors without flame, which provides an opportunity to minimize NOx formation [12].
The CLC scheme in Figure 1 can be implemented in practice in different ways, depending on the oxide’s physical characteristics, the type of reactor and the operating conditions [13]. Typically, fluidized-bed reactors are used, in which the metal oxides “float” as fine particles, guaranteeing enough contact area so that the chemical reactions with oxygen (oxidation) and with fuel (reduction) take place. Some inert material or any catalyst may be added to improve the physical properties and stability of the metal oxide particles and chemical kinetics, although this is not investigated in this work.

2. Description of the Study

2.1. Cycle Description and Operating Conditions

The thermodynamic cycle that has been analyzed is taken from [9] and is depicted in Figure 2. The main gas turbine is the one referred to as GT1, where depleted air is expanded from the pressure at the oxidation reactor to around atmospheric pressure. In order to maximize the power production, two ideas for an optimized components configuration taken from previous works have been incorporated:
  • Introduction of an air pre-heater in order to take advantage of the solids’ heat capacity to increase the air mass flow through GT1. This idea is proposed by [6].
  • The oxidation and reduction reaction must be pressure-linked due to the chemical looping followed by the oxygen carrier. As suggested by [7], a second gas turbine (GT2) is then introduced to convert into work the pressurized CO2 and H2O mixture generated in the reduction reaction. This work is maximized by heating this stream from the highest available temperature heat source, the oxidation reactor.
The cycle parameters have been chosen as given in [9]:
  • Ambient conditions: 15 C ( 288.15 K ), 1 atm ( 101.325 kPa ), 60% RH (relative humidity).
  • Fuel conditions: 153.4 C ( 426.58 K ), 27.24 bar .
  • Pressure drop at the air filter: 1 kPa .
  • Isentropic efficiency of compressors: 0.845.
  • Isentropic efficiency of gas turbines: 0.895.
  • Pressure drop in reactors: 4%.
  • Heat losses in reactors: 0.5% in the oxidation reactor, 0.2% in the reduction reactor.
  • Pressure drop in the heat recovery steam generator (HRSG): 3.5%.
  • Pressure drop in other heat exchangers: 1%.
  • Pinch point in heat exchanges: 10 C in gas–gas exchanges, 50 C in the air pre-heater.
  • Temperature of flue gases at the HRSG outlet: dew point and never under 90 C ( 363.15 K ).
  • Final pressure for CO2 storage: 85 bar .
For the steam cycle (not included in Figure 2), a one-level pressure conventional steam cycle has been considered. Condensation pressure is fixed at 0.07 bar ; pressure at the boiler economizer inlet is set to 76 bar ; and steam pressure at the boiler outlet is 67 bar . The steam temperature at the boiler output is assumed 20 C lower than the exhaust gas temperature and never higher than 545 C ( 818.15 K ).
All of the previous values are reasonable and within their typical range in combined cycle power plants [6,13,14]. Fuel conditions have been taken from available preliminary data on gasification processes [15]. Regarding the final compression pressure for CO2, it allows storage or transport as high-density supercritical fluid. The particular value 85 bar is used here since it was previously adopted by [13]; nevertheless, if higher pressures were considered more suitable, the penalty for additional compression power would not be excessive, as the compression ratio would not increase significantly in any case. The compression setup has been modeled to take place in two stages with the same compression ratio, giving:
p 17 = p 15 p 18
The rest of the free parameters of the cycle have been set to their optimal values from the point of view of power production. These optimal values are adjusted as a function of GT1 turbine inlet temperature (TIT) and the reactors pressure ( p r ).
At this point, it must be remarked that several practical issues (e.g., pressurization of the oxygen carrier particles looping, ensuring mass transfer between reactors, de-dusting before turbine GT2, etc.) should be resolved in order to materialize this cycle scheme in practice. These aspects are out of the scope of the present work.
The overall exergetic performance of the power plant shown in Figure 2 is evaluated after analysis and optimization. For the purpose of comparison, a conventional Brayton cycle has also been simulated taking the equivalent values of pressure drops and heat losses and the same isentropic efficiency of compressors and turbines as those of the CLC cycle. The Brayton cycle is shown in Figure 3.

2.2. Oxygen Carrier

Many metal oxides, typically nickel, iron, copper and manganese oxides, e.g., the pairs NiO/Ni, Fe2O3/Fe3O4, CuO/Cu, CuO/Cu2O, Mn2O3/Mn3O4, have been proposed to act as oxygen carriers for CLC when CH4 is used as fuel. However, when the fuel is a syngas, the gases to be oxidized are H2 and CO instead of CH4. The only pair among those checked that satisfies the requirement of providing an endothermic reduction reaction is Fe2O3/FeO:
Fe 2 O 3 + H 2 FeO + H 2 O ; Δ H 298 = 39.611 kJ/mol Fe 2 O 3 + CO FeO + CO 2 ; Δ H 298 = 1.564 kJ/mol
where Δ H 298 represents the standard enthalpy of reaction at 25 C ( 298.15 K ) and 1 bar . Since an important proportion of H2 is present in syngases, the combined heat of reactions (4) is positive, leading to an oxidation reaction with a heat of reaction higher than the fuel’s lower heating value (LHV) as discussed in Section 1.1:
2 FeO + 1 2 O 2 Fe 2 O 3 ; Δ H 298 = 281.438 kJ/mol
It has been reported that some amount of inert material might be necessary to ensure that the solid particles achieve the appropriate physical characteristics related to the stability against important changes of temperature. Since it is thought [8] that YSZ (yttria-stabilized ZrO2) acts as a catalyst in reactions (4), a mass of 0.27 mol of ZrO2 per mol of FeO has been added to the oxygen carrier streams for this purpose. This amount of inert material is an intermediate value between those proposed in [7] and [13] (0.2 and 0.34, respectively). The ZrO2 does not participate in any chemical reaction and merely acts as a heat carrier between the two reactors.

2.3. Fuels under Study

As the hydrogen content of fuel increases, an additional amount of heat is required in order to enforce the first of the reduction reactions (4). The heat balances and also the thermodynamic equilibrium in CLC reactors are considerably influenced by the fuel composition. In order to quantify the impact of the hydrogen content on the CLC performance, three different syngas compositions have been tried. Table 1 gives the exact composition of each syngas under study together with their LHV and standard chemical exergy. Since the exergetic approach is intended along this paper, the fuel’s chemical exergy will be taken as the reference for the quantification of the power plant efficiency instead of its LHV, as discussed in a later section.
Syngases A and B are obtained from thermochemical gasification of biomass substrates, wood waste and miscanthus (a herbaceous energy crop), respectively. Rather, the one called Syngas C comes from the gasification of an American coal, “Pittsburgh n8”. The first two present a significantly different amount of hydrogen, and the third one has an intermediate value between them and at the same time gives an example of a quite different amount of carbon monoxide. The rest of the syngas components (others than H2 and CO) do not take part in the involved chemical reactions, but they might influence the chemical equilibrium eventually reached.

2.4. The Exergy Method

The limit of first law analysis is that it does not account for energy quality. However, we know from the second law that many energetic transformations occur only in one way and not in the opposite. For instance, converting from mechanical to thermal energy is an easy, straightforward process, while the opposite is quite complex. Therefore, not all energy flows can be said to possess the same capability to induce a desired effect, and the concept of exergy arises in order to quantify that capability. A common definition of exergy would state that “exergy is the maximum theoretical useful work obtainable as the system interacts to equilibrium, heat transfer occurring only with the environment”. The exergy method allows one to compare the actual performance of systems and processes with the best that could be obtained in accordance with the impositions from not only the first law, but also from the second law. Therefore, it makes it possible to detect and quantify the possibilities of improving thermal and chemical processes and systems.
The expression of the exergy balance in an open system that describes a stationary process is given by:
i outputs n ˙ i e i i inputs n ˙ i e i = ( Q ˙ T 0 J s ˙ ) W ˙ I ˙
where:
  • n ˙ is the molar flow rate of a stream;
  • e is the thermodynamic function of state flow exergy;
  • Q ˙ is the heat flow rate exchanged by the system;
  • J s ˙ is the entropy transfer rate associated with heat flow. For a single temperature system:
    J s ˙ = đ Q ˙ T ; for a multi-temperature system: J s ˙ = k đ Q k ˙ T k ;
  • W ˙ is the mechanical power extracted from the system;
  • I ˙ is the exergy destruction rate due to internal irreversibilities.
When a particular system exchanges heat that cannot be useful for a given purpose, i.e., the heat exchanges are merely heat losses to the environment, the heat flow terms in (6) can be included together with the exergy destruction rate term in a total exergy loss rate term:
I ˙ t = I ˙ ( Q ˙ T 0 J s ˙ )
Including this in the exergy balance:
i outputs n ˙ i e i i inputs n ˙ i e i = W ˙ I ˙ t
The flow exergy function e represents the work per mol of a substance that could be obtained from a stream as the system comes to equilibrium with the environment, involving any auxiliary devices. Every imbalance between a stream and the environment may result in additional work to be generated. In general, the flow exergy is usually split into two terms:
  • The so-called physical exergy involves thermal and mechanical imbalances with the environment. Disregarding kinetic and potential energy, this term can be shown to be equal to:
    e PH = ( h h 0 ) T 0 ( s s 0 )
    As usual, h and s are the molar enthalpy and entropy of the stream, respectively, at its current temperature and pressure. The subscript “0” represents the inert state, i.e., the referred thermodynamic function is evaluated considering that stream at ambient temperature and pressure.
  • The so-called chemical exergy involves diffusive and chemical imbalances with the environment. The process by which equilibrium would be attained should happen at constant temperature equal to T 0 (ambient temperature). It can be shown that the maximum theoretical work per mol of substance produced in such a process is the opposite to the change of the specific Gibbs function:
    w T 0 max = Δ g
    For a pure substance, this can also be split into two terms:
    -
    The first one represents the change of the Gibbs function per mol of substance that happens in a degradation chemical transformation until chemical equilibrium with the environment:
    Δ g ( 1 ) = Δ G deg
    For instance, in the case of a fuel, this would be referred to as the combustion reaction. In the case of substances present in the atmosphere in the same form, this term would not exist, e.g., nitrogen, oxygen, carbon dioxide, water, etc.
    -
    Since this degradation chemical reaction should occur considering that the involved reactionand products are taken from or given to the environment in a manner that the diffusive equilibrium is also satisfied, a second term is needed to account for the change of the Gibbs function per mol of substance required for the chemical potentials of the substances to get equal to their actual values in the environment:
    Δ g ( 2 ) = j ν j deg μ j env μ j pure ( T 0 , p 0 )
    where p 0 is the ambient pressure, μ j represents the chemical potential of substance j involved in the degradation reaction (in pure form or its actual value in the environment) and ν j deg denotes the stoichiometric coefficient of substance j in that reaction. For the case of gases, usually, the atmosphere is considered to behave as an ideal gas mixture, giving μ j env μ j pure ( T 0 , p 0 ) = R T 0 ln x j atm , where x j atm is the molar fraction of gas j in the atmosphere. As an example, for the case of methane, the degradation reaction would be the combustion CH 4 + 2 O 2 2 H 2 O + CO 2 (with ν O 2 deg = 2 , ν H 2 O deg = + 2 , ν CO 2 deg = + 1 ), and:
    Δ g ( 2 ) = R T 0 ln x H 2 O atm 2 x CO 2 atm x O 2 atm 2
    Thus, the chemical exergy of a pure substance is calculated as:
    e CH = Δ G deg j ν j deg μ j env μ j pure ( T 0 , p 0 )
    There are several sources that tabulate the standard chemical exergy of pure substances. In this work, we base the calculations on the values given by [16].
    Finally, for a mixture of substances, the chemical exergy could be calculated as the average chemical exergy of the individual components taking part, plus an additional term that accounts for the change of the specific Gibbs function associated with the separation of the mixture into its components in pure form at ambient temperature and pressure. Considering a mixture with C components, this would be:
    e CH = g M + j = 1 C x j e CH , j
    where x j is the molar fraction of the component j in the mixture. If it can be seen as an ideal Lewis–Randall mixture, the specific mixing Gibbs function is given by g M = R T 0 j x j ln x j .
Defining for every stream E ˙ i = n ˙ i e PH + e CH i , the exergy balance can be reordered as follows:
i inputs E ˙ i = i outputs E ˙ i + W ˙ + I ˙ t
This exergy balance equation can be used to calculate the total exergy loss in a whole thermodynamic cycle, but also, and more interestingly, for each component individually. In this way, it is possible to detect the points of the cycle with a bad performance from a “combined first and second law” point of view, raising the possibility of improving thermal and chemical processes and systems.

2.5. Simulation Methodology

The simulation of the CLC-based combined cycle power plant shown in Figure 2 has been carried out relying on the PATITUG library, an own software for thermodynamic analysis developed by the Applied Thermodynamics Group of the Technical University of Madrid. The PATITUG library contains a number of modules for representing each cycle component and, conveniently assembled, provides an accurate thermodynamic characterization of the cycle. Several models are included to handle pure substances, mixtures and chemical transformations. A variety of equations of state, as ideal gas, virial gas, the Lee–Kesler equation and IAPWS-IF97 for water can be selected. Furthermore, different expressions for the specific heat of gases at nil pressure are available. A deeper description of PATITUG can be found in [14,17].

2.6. Thermodynamic Modeling

We give here a brief summary of the thermodynamic assumptions. A much more detailed description on the thermodynamic modeling of the proposed CLC system can be found in [9]. Regarding gaseous substances, the following equations of state have been applied:
  • The IAPWS-IF97 equation of state for water where temperature exceeds the water boiling temperature at that pressure.
  • The virial gas equation of state truncated after the second term for gaseous water in the cycle points where temperature is below the water boiling temperature at that pressure (but exceeds the water boiling temperature at water’s partial pressure at that point, so water is found in the gaseous state).
  • The virial gas equation of state truncated after the second term for all non-condensable gases when their specific volume is at least twice the critical specific volume.
  • Lee–Kesler’s equation of state for the rest of the cases, i.e., non-condensable gases, where specific volume is lower than twice the critical specific volume, and supercritical fluids.
For solids, the functional dependence of molar enthalpy and entropy with temperature has been taken from the NIST Chemistry Webbook [18]. A slight correction to account for the variation of enthalpy with pressure has been applied.
Thermochemical data, such as the standard heat of formation and standard molar entropy, have been taken from [19], while the standard chemical exergy values have been read from [16] for all substances.

3. Results and Discussion

3.1. Chemical Equilibrium

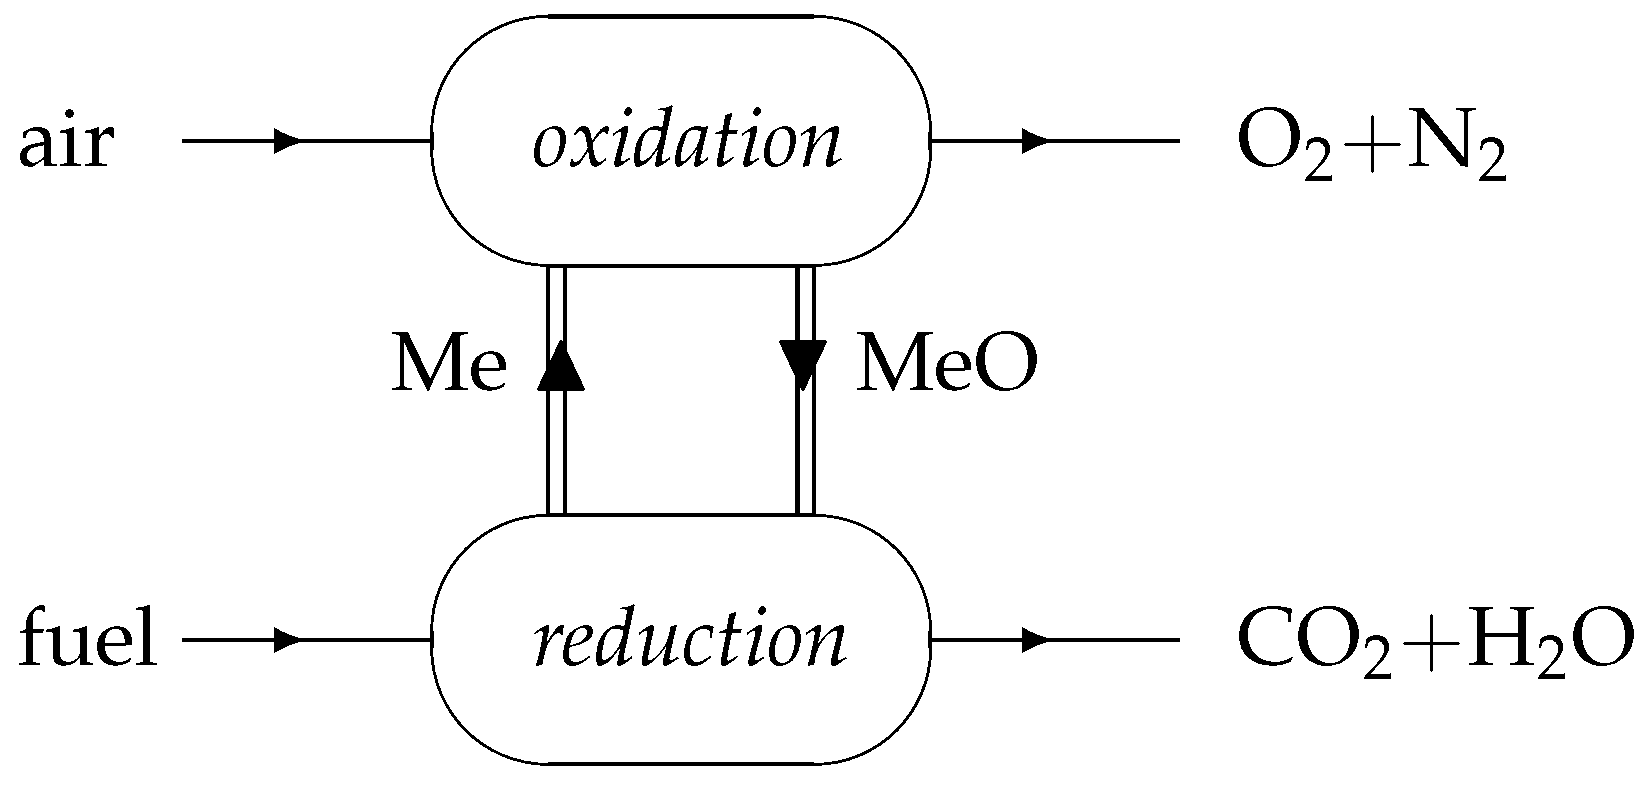
The conversion of fuel into the oxidation products CO2 and H2O is subject to the chemical equilibrium constraint. Assuming that the reactants’ residence time is high enough in comparison with the characteristic chemical kinetics times (catalysis may be necessary), the chemical composition of the gas stream at the reduction reactor’s outlet can be determined as a function of temperature from the chemical equilibrium equation:
K a ( T ) = exp Δ G ( T ) R T
where Δ G ( T ) is the standard Gibbs’ function of reaction at temperature T, and the equilibrium constant K a can be related to the molar fractions of gases at equilibrium.
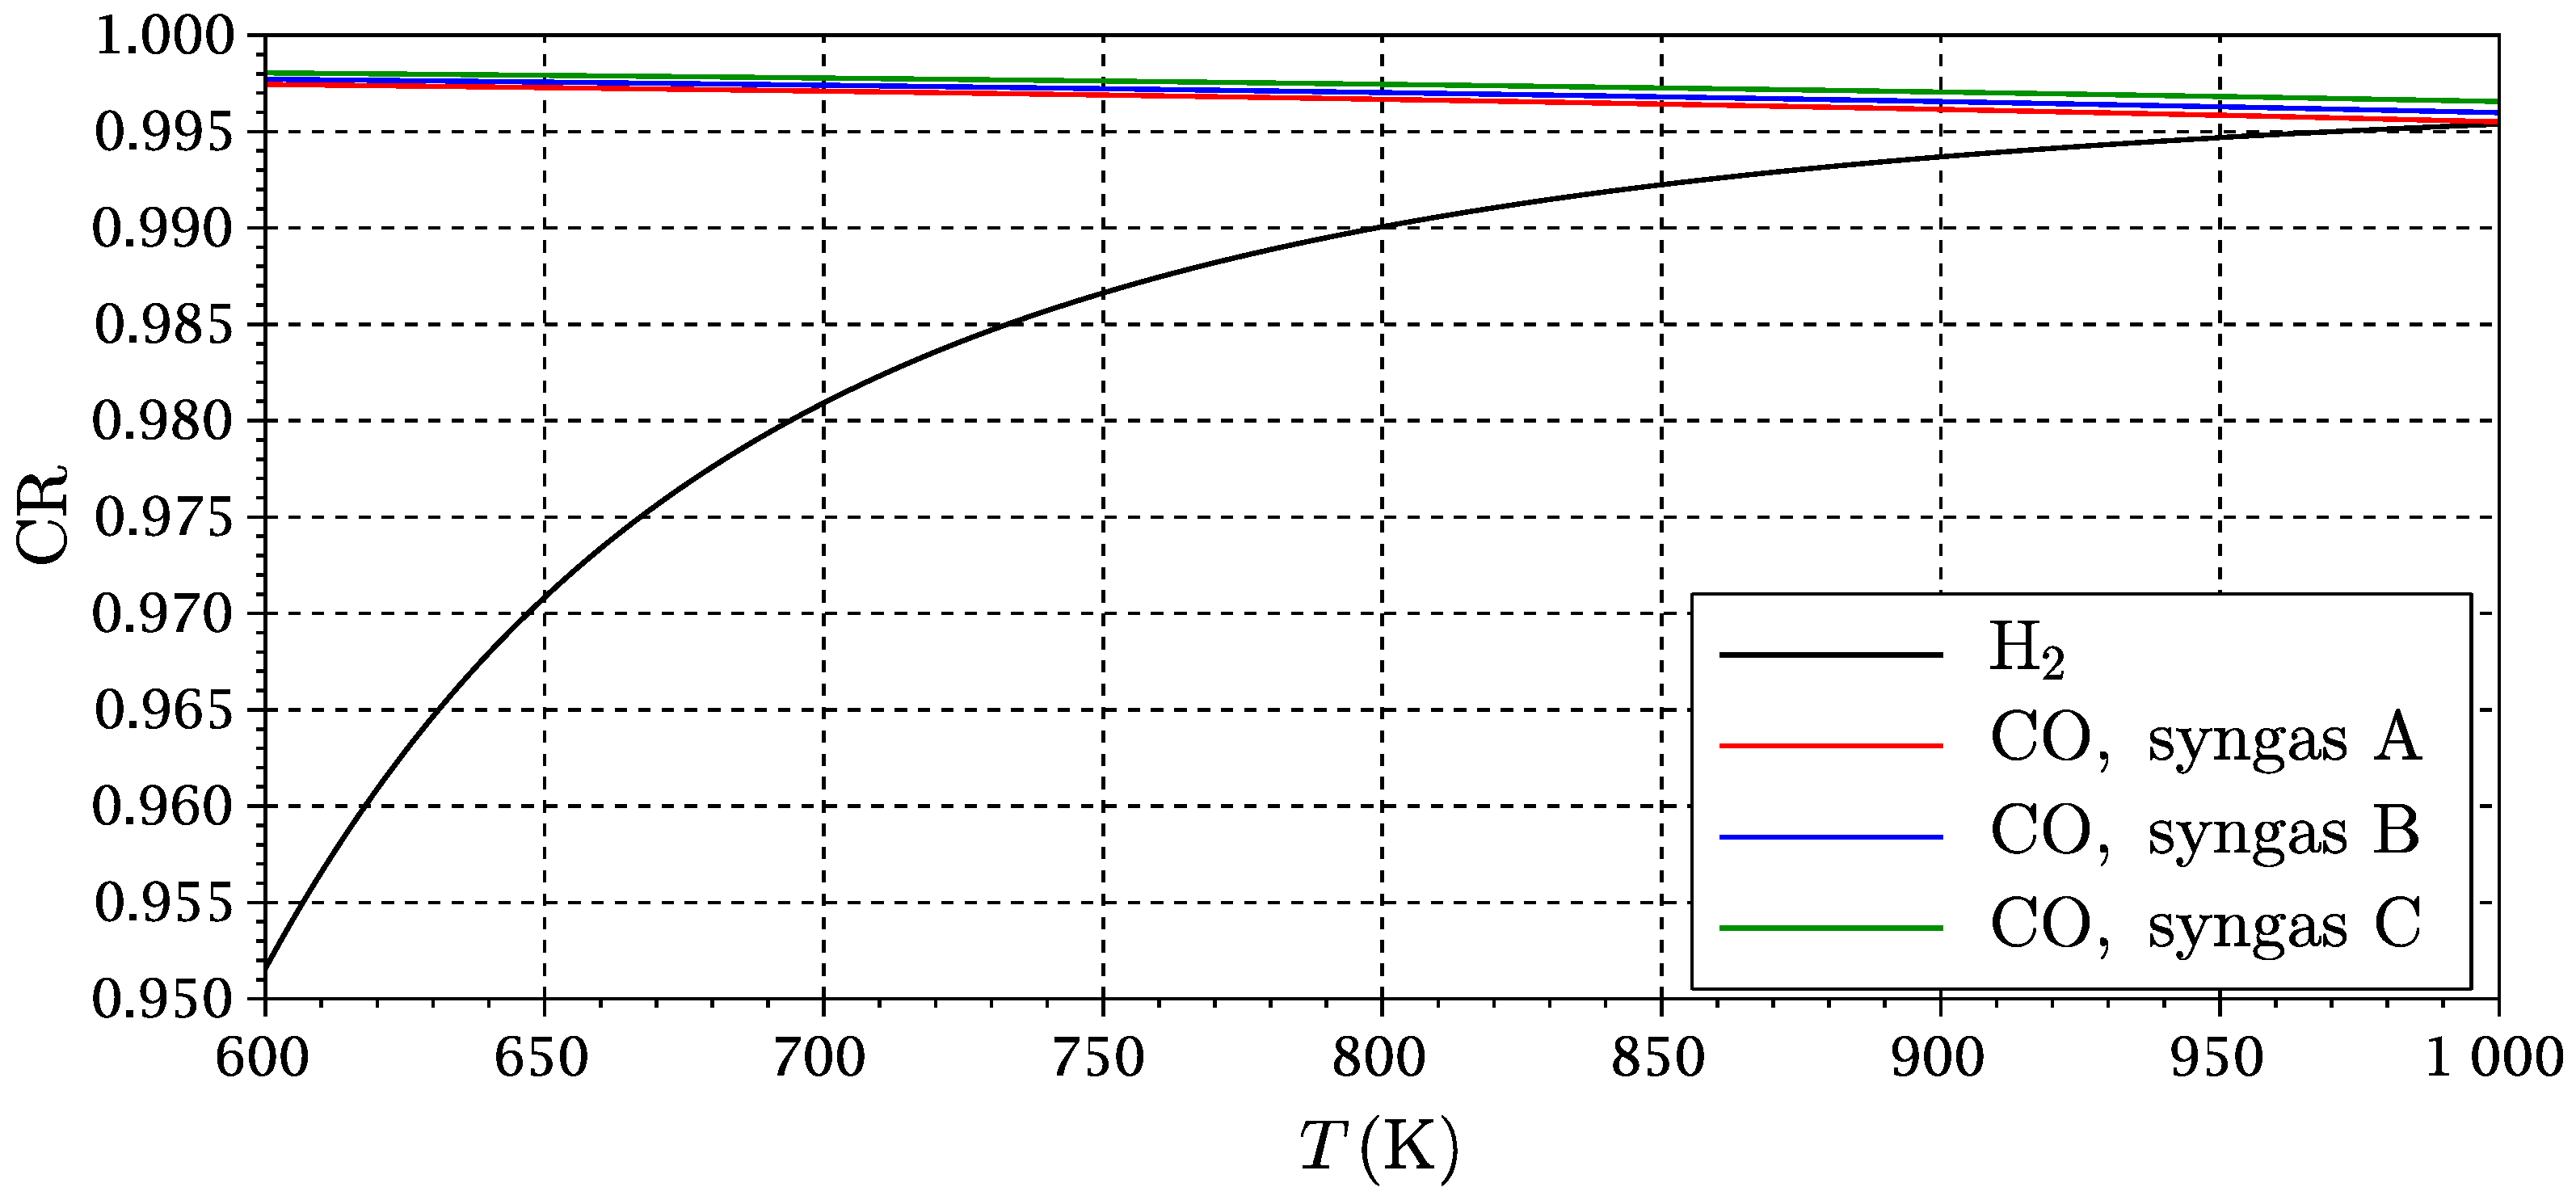
The conversion ratio of fuel as a function of temperature has been calculated. Results are shown in Figure 4, where the conversion ratio has been defined as:
CR j = 1 x j eq x j in ; j = H 2 , CO
where x j in and x j eq are j’s initial molar fraction in syngas and its molar fraction at the chemical equilibrium. The dependence of the conversion ratio on pressure is very slight due to the conservation of the number of gas moles in both reactions (4). In addition, as x H 2 O in 0 for all considered syngas compositions, the curves for CR H 2 result in being completely indistinguishable. Only one of them is printed in Figure 4.
The conversion ratio of hydrogen increases with temperature, according to Le Châtelier’s principle, since the first reaction of (4) is endothermic. In the case of carbon monoxide, a minor decrease with temperature (the second reaction of (4) is slightly exothermic) can be observed and is somewhat higher for the fuels with a lower content of carbon dioxide, as this has a certain influence on the equilibrium condition. Unlike with conventional combustion, the fuel cannot be completely converted due to the equilibrium restrictions, but Figure 4 shows that for a reaction temperature of around 800 K , H2’s conversion ratio reaches 99 % and CO’s one is located at about 99.7–99.8% for all fuels. Thus, at this temperature, only approximately 0.55% of the fuel’s chemical exergy would be lost as a result of incomplete combustion. However, this effect is more than offset by the lower exergy destruction in the combustion process, as will be discussed in Section 3.4.
Regarding the oxidation reactor, chemical equilibrium has been found to never occur, as equilibrium would be attained for a really small oxygen molar fraction, much below the available oxygen in the reactor. All FeO is oxidized before that point.

3.2. Cycle Optimization and Exergy Efficiency

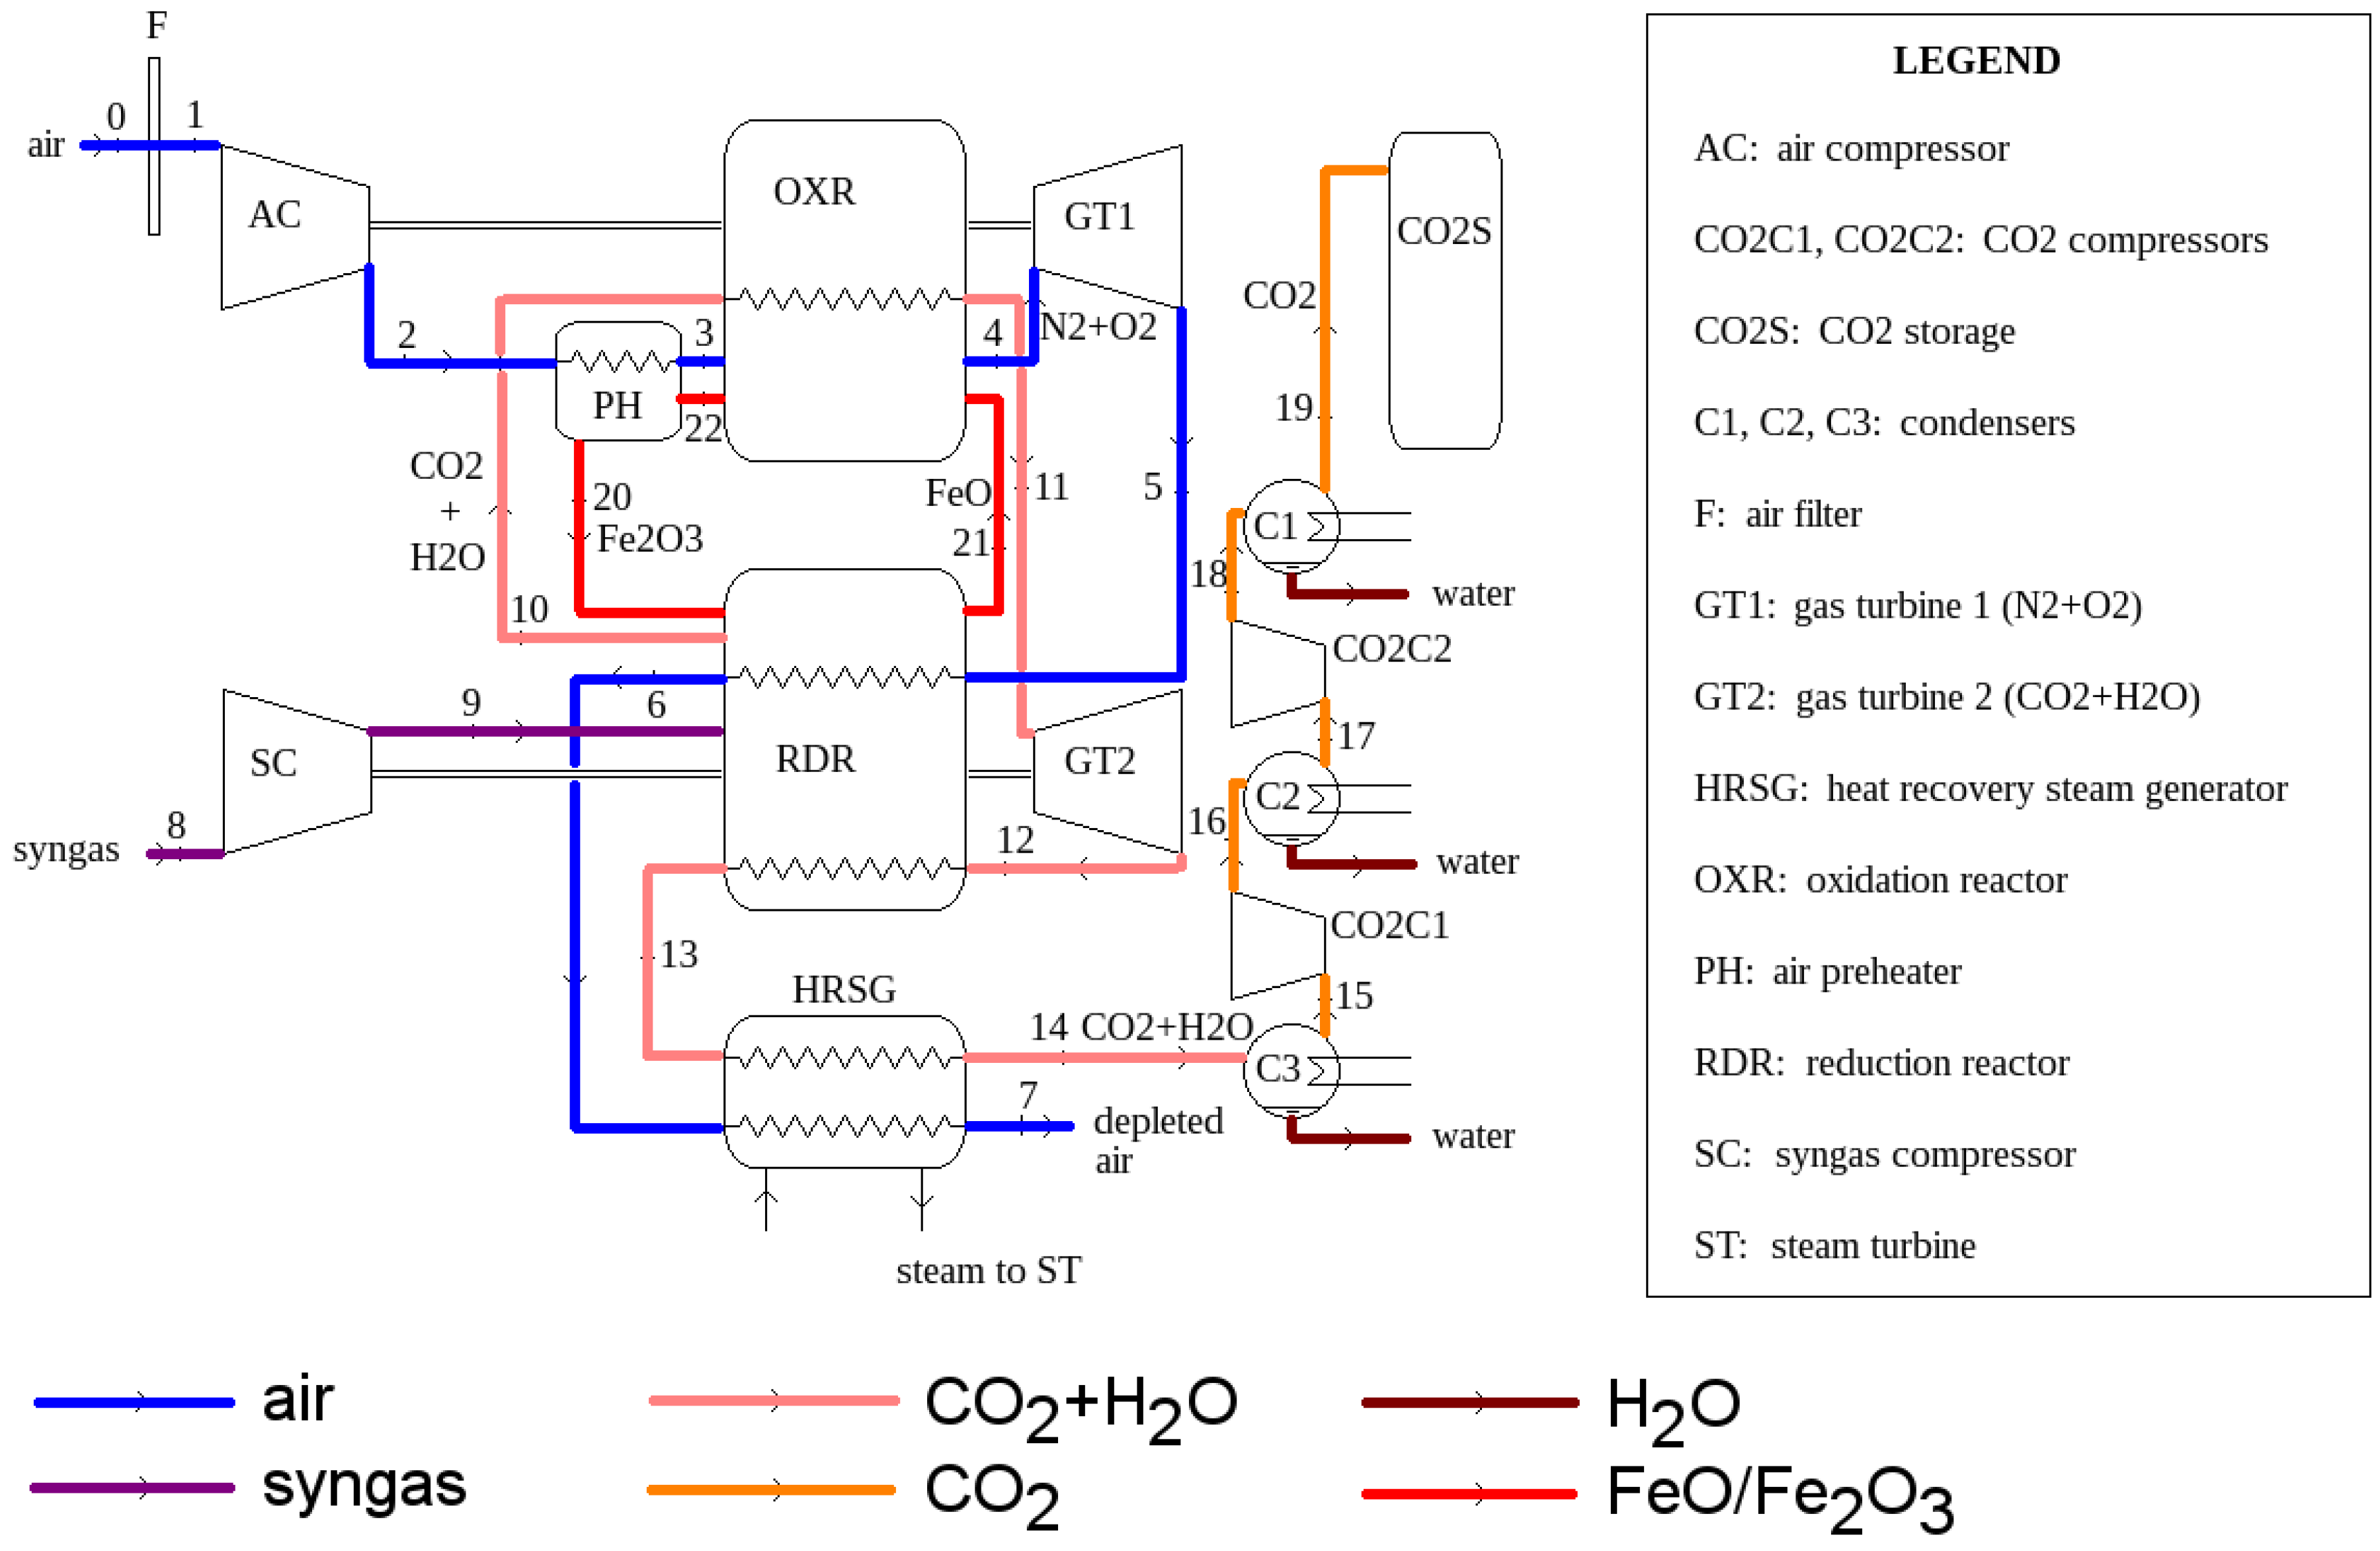
Few parameters define the thermodynamic conditions of the proposed power plant cycle (Figure 2). The governing ones are the gas turbine GT1’s TIT (which also is the temperature of the oxidation reactor) and the reactors pressure p r .
There is a degree of freedom about the reduction reactor temperature T red . This is the key parameter to be optimized in the cycle design. As discussed previously, the conversion ratio of hydrogen increases with the reactor’s temperature. However, this temperature is limited as the reduction reactor must take the required heat from the gas streams at the gas turbines’ outlets. An iterative algorithm has been implemented to calculate T red as the highest temperature possible that allows one to satisfy the energy balance in the reduction reactor.
There is a second degree of freedom of low importance in relation to the expansion pressure at the GT2 outlet (Stream 12). Calculations show that the pressure that gives the best ratio between the power developed by GT2 and the power consumed by the CO2 compressors is very close to 1.5 bar for all fuels, but the influence on the results is minor in a broad range.
The cycle performance is evaluated from an exergetic point of view. The exergy efficiency is given by:
η ex = W ˙ GT 1 + W ˙ GT 2 + W ˙ ST + W ˙ CO 2 E ˙ fuel
W ˙ GT 1 is the power generated by GT1, subtracting the air compressor power consumption, W ˙ GT 2 is the power generated by GT2 minus the fuel compressor consumption, W ˙ ST is the power produced by the steam turbine and W ˙ CO 2 is the power consumption of both CO2 compressors:
W ˙ GT 1 = η em ( h 1 h 2 + h 4 h 5 ) ; W ˙ GT 2 = η em ( h 8 h 9 + h 11 h 12 ) ; W ˙ CO 2 = ( h 15 h 16 + h 17 h 18 )
A electromechanical efficiency for gas turbine ensembles of η em = 0.98 has been considered. W ˙ ST is calculated in a similar way.
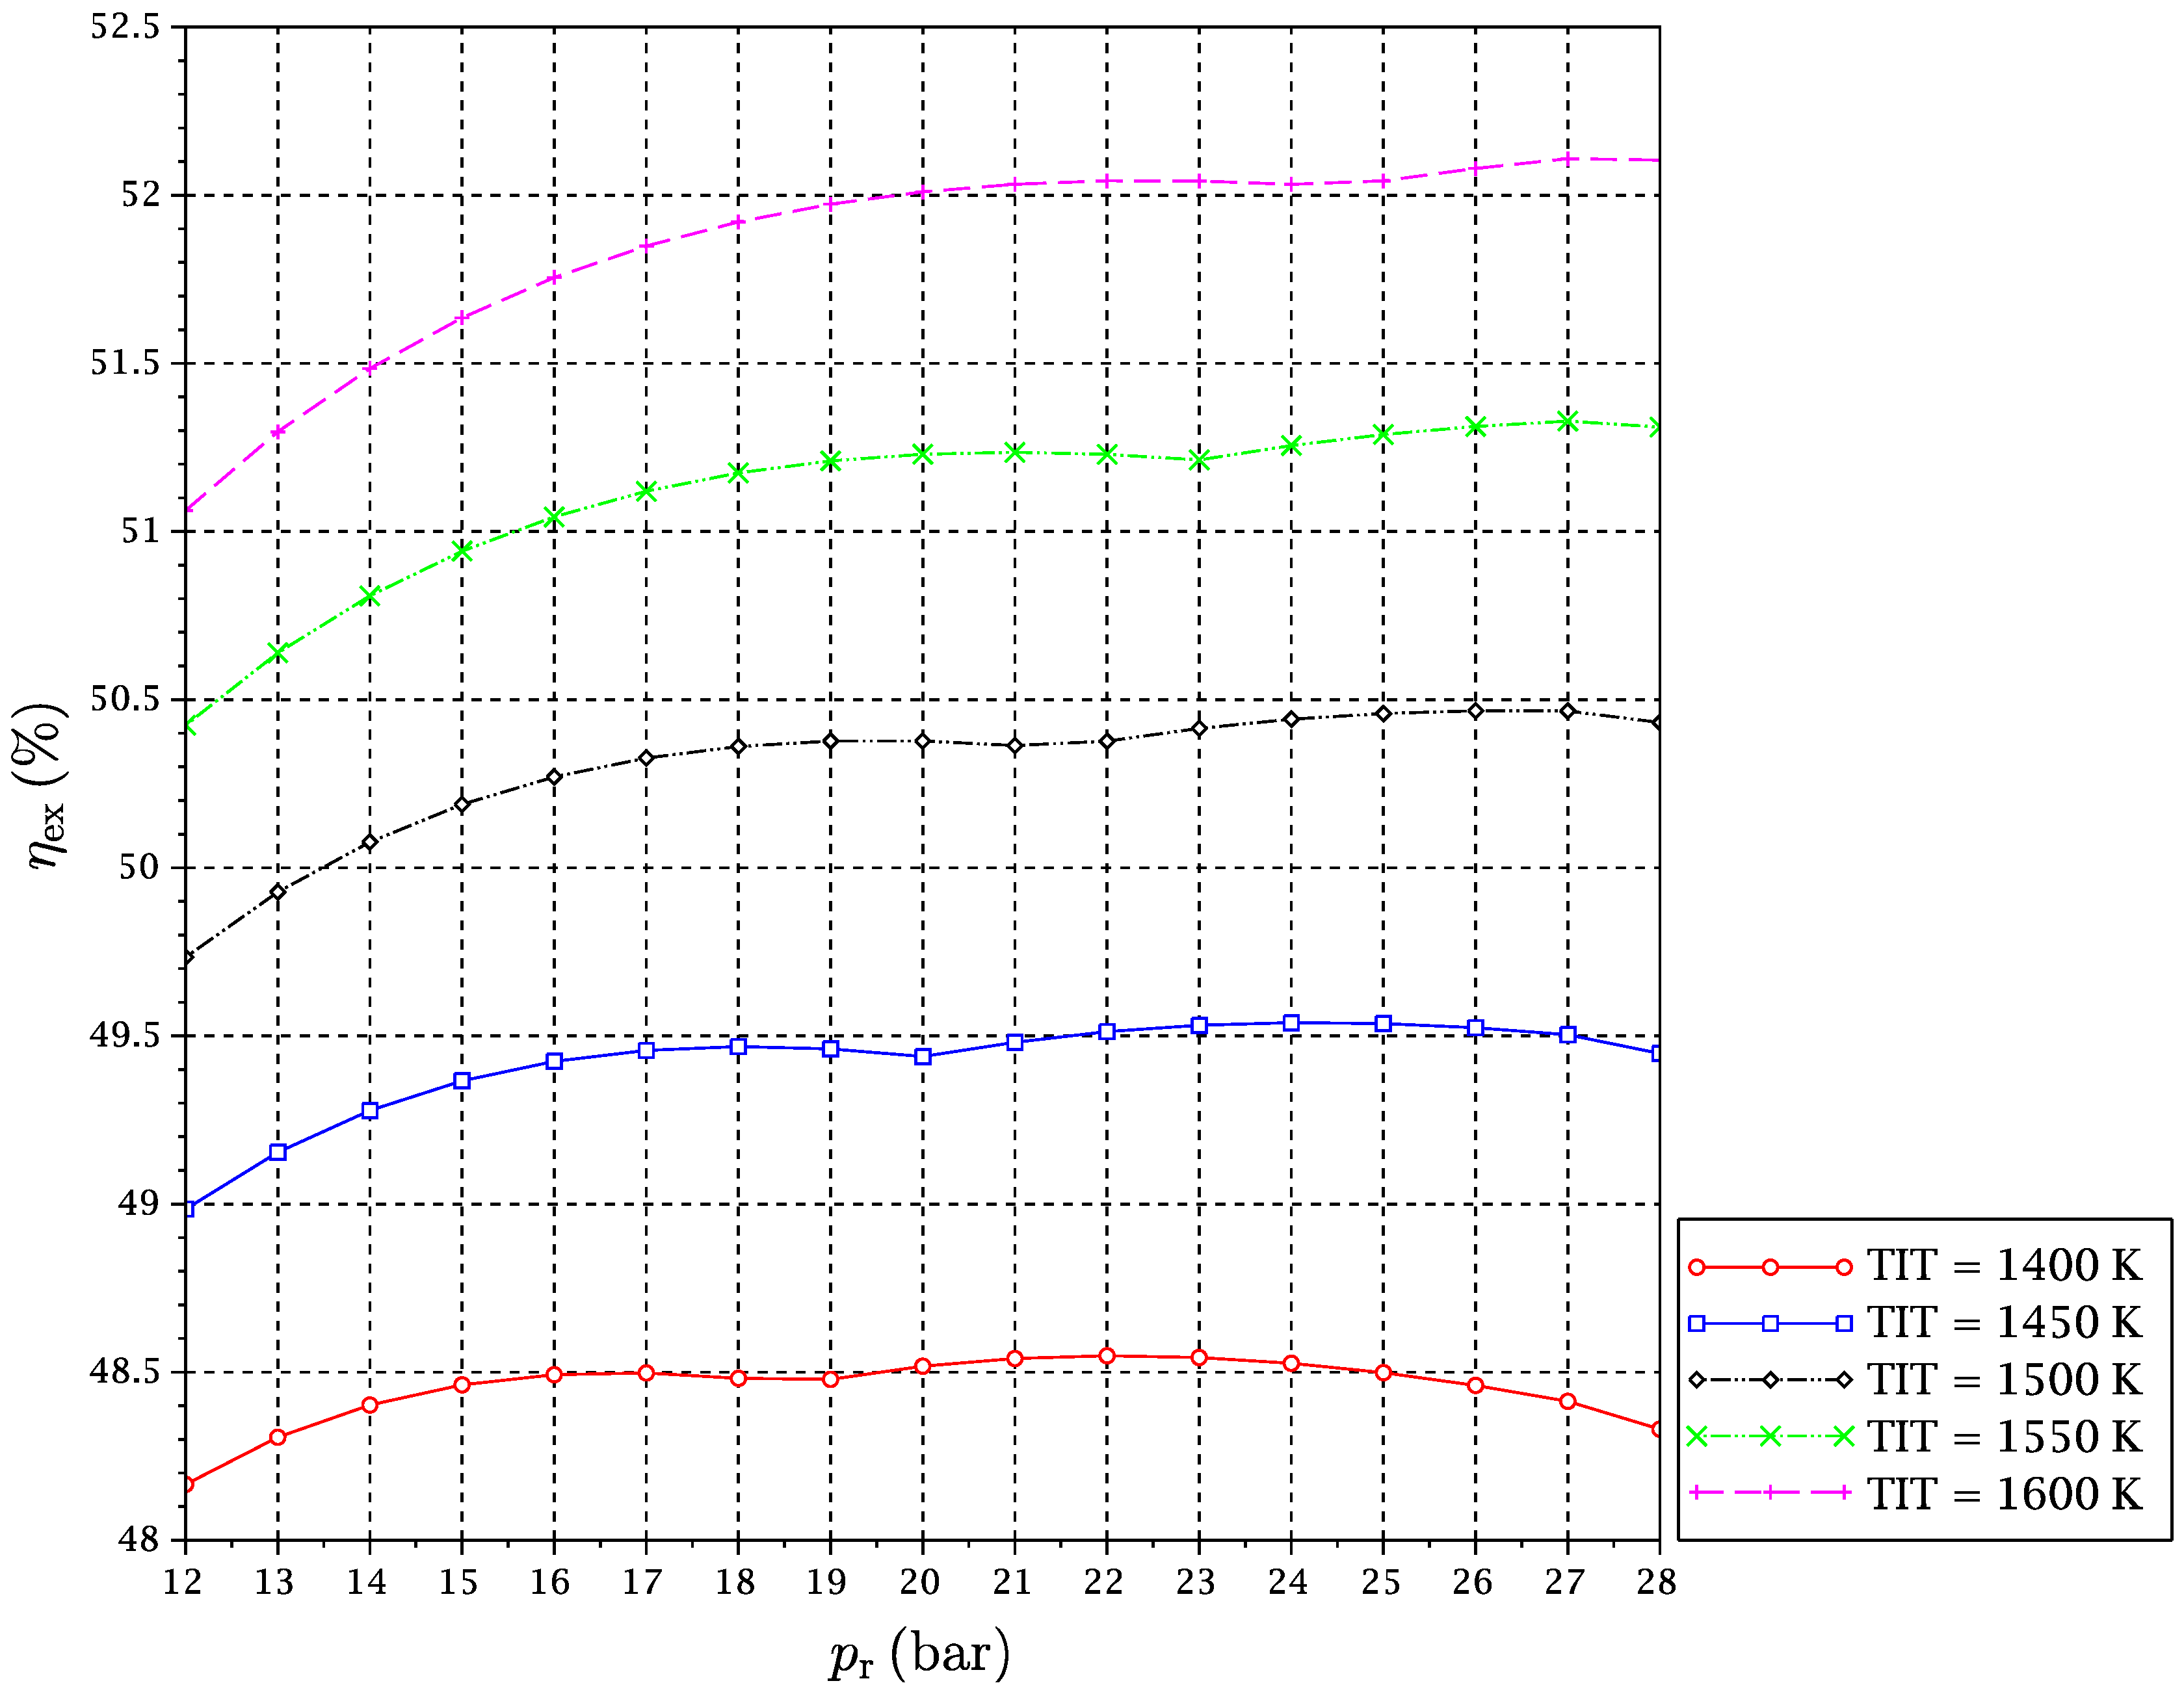
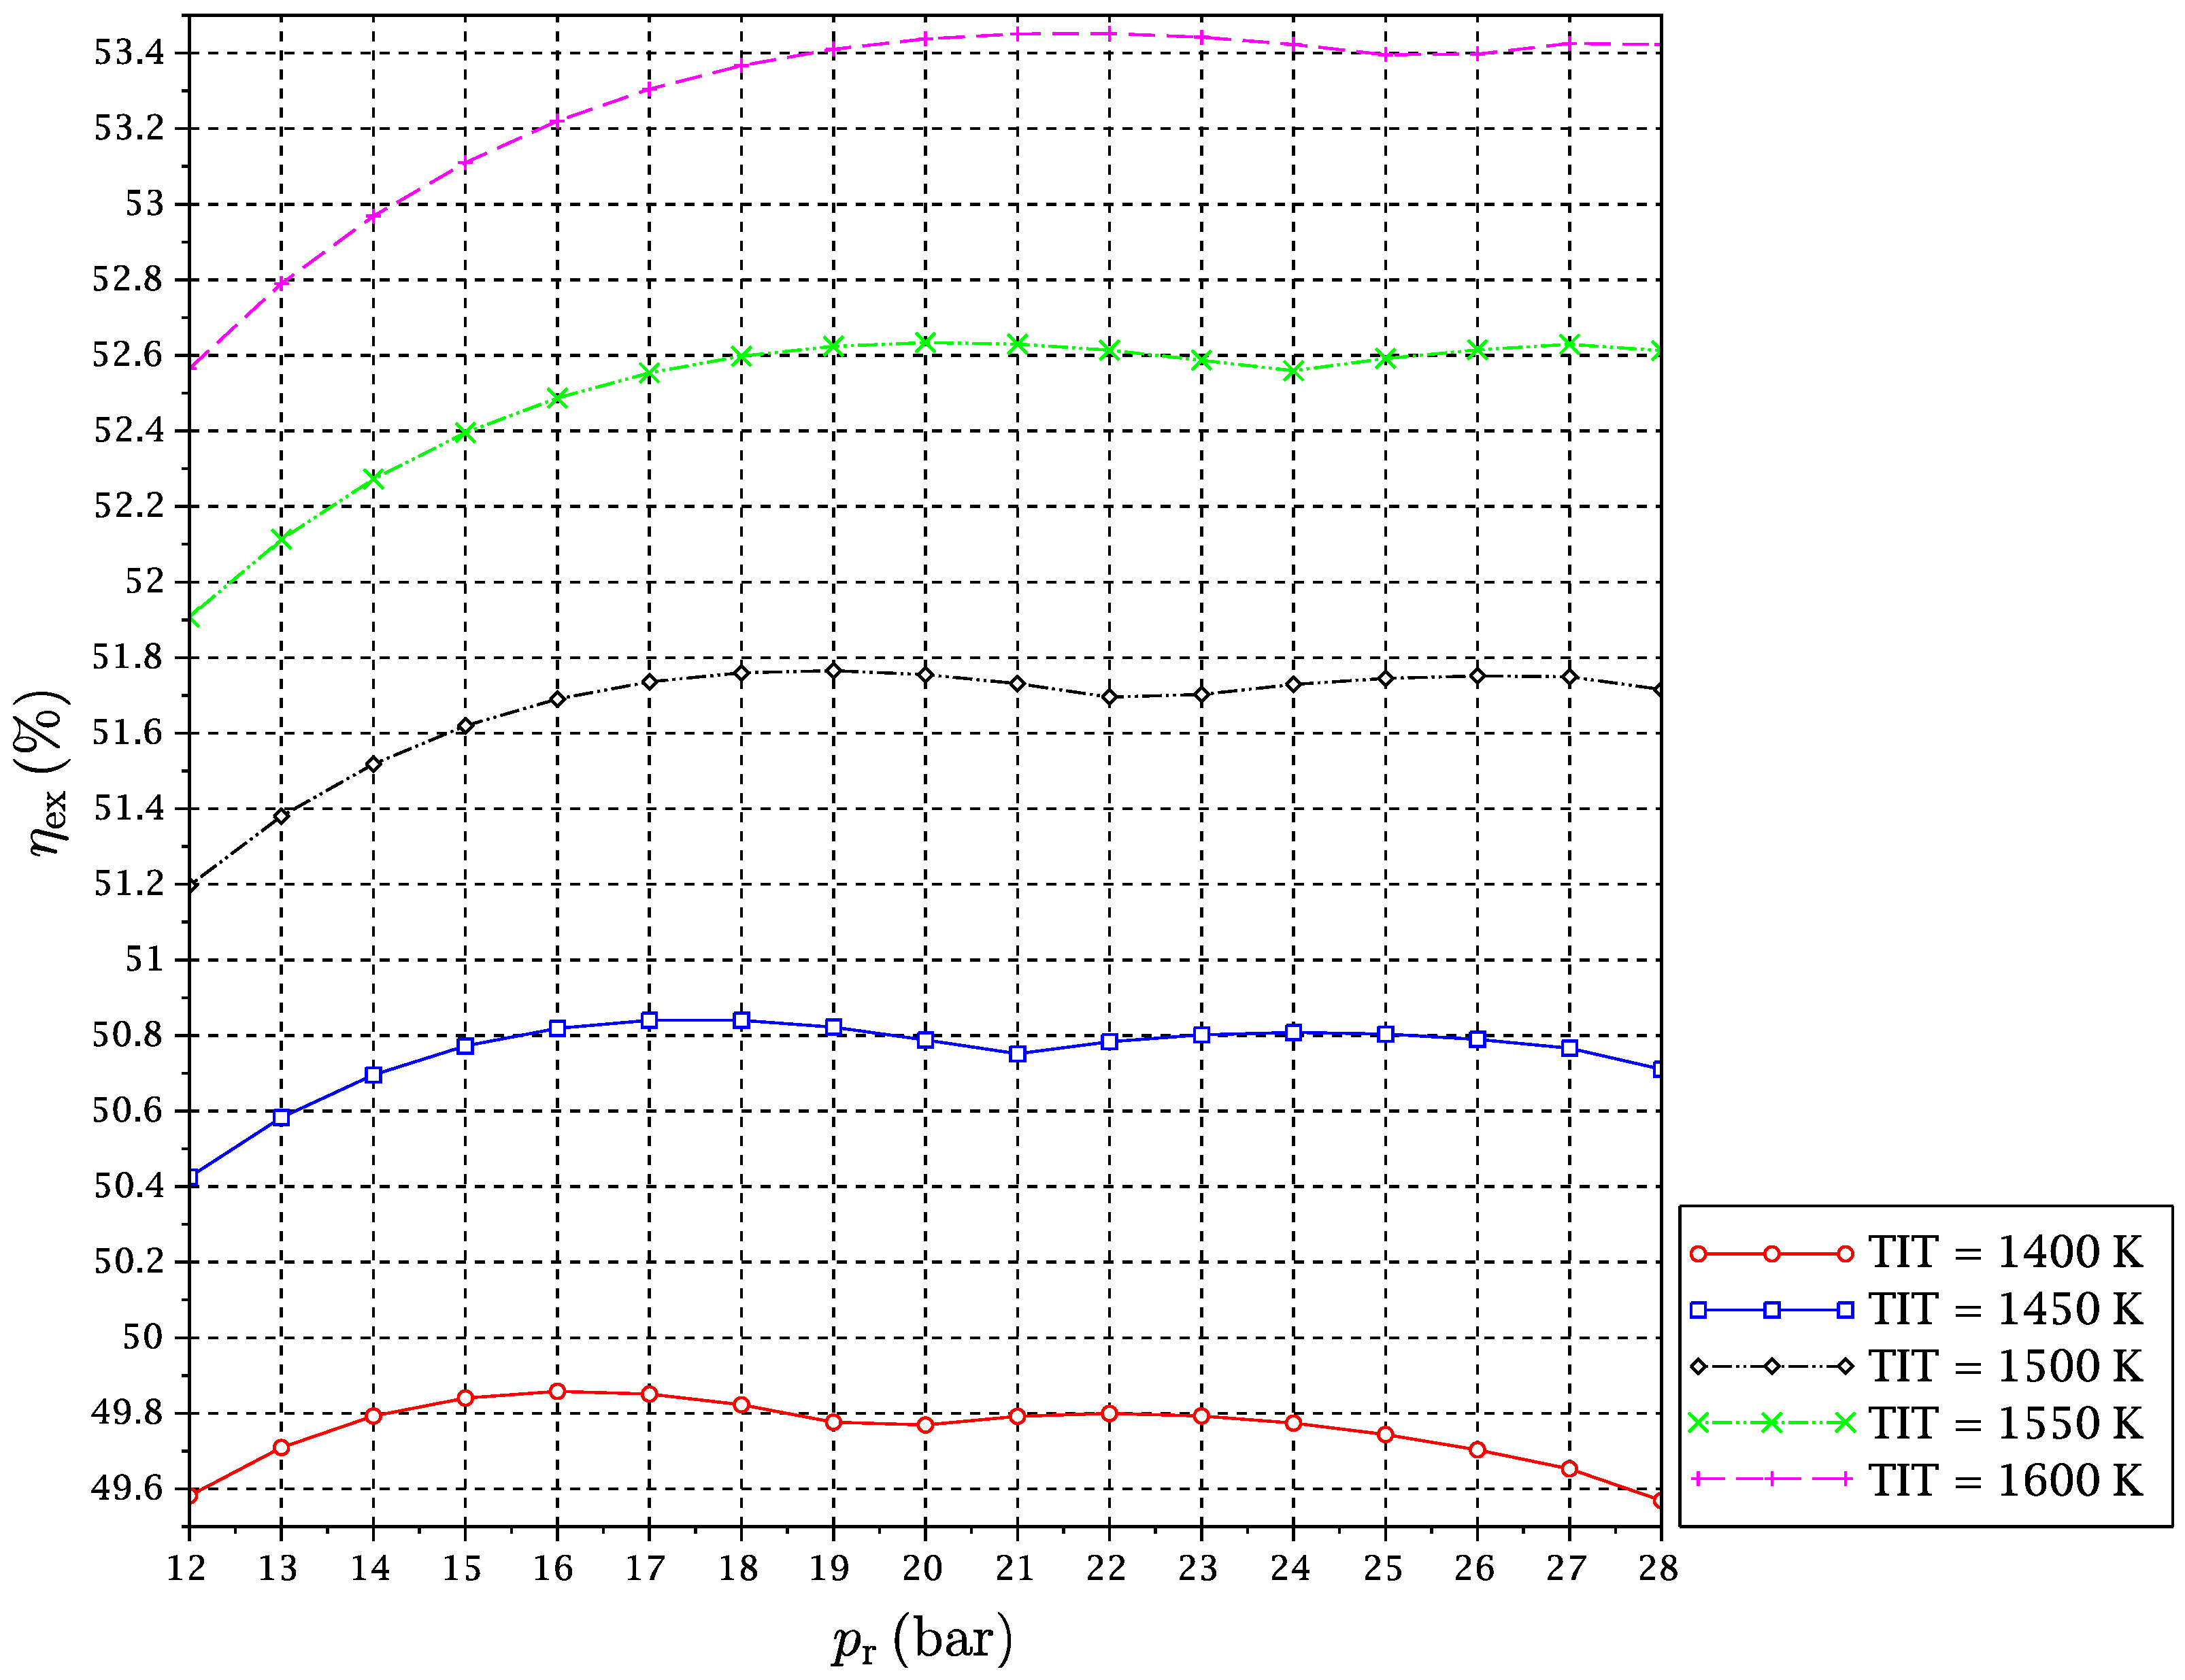
A set of simulations for TIT in a range from 1400–1600 K and p r from 12–28 bar has been carried out. For each considered fuel and for every pair of values of TIT and p r , the optimal reduction temperature and the exergy efficiency of the cycle have been obtained. Results are given in Figure 5, Figure 6, Figure 7, Figure 8, Figure 9 and Figure 10.
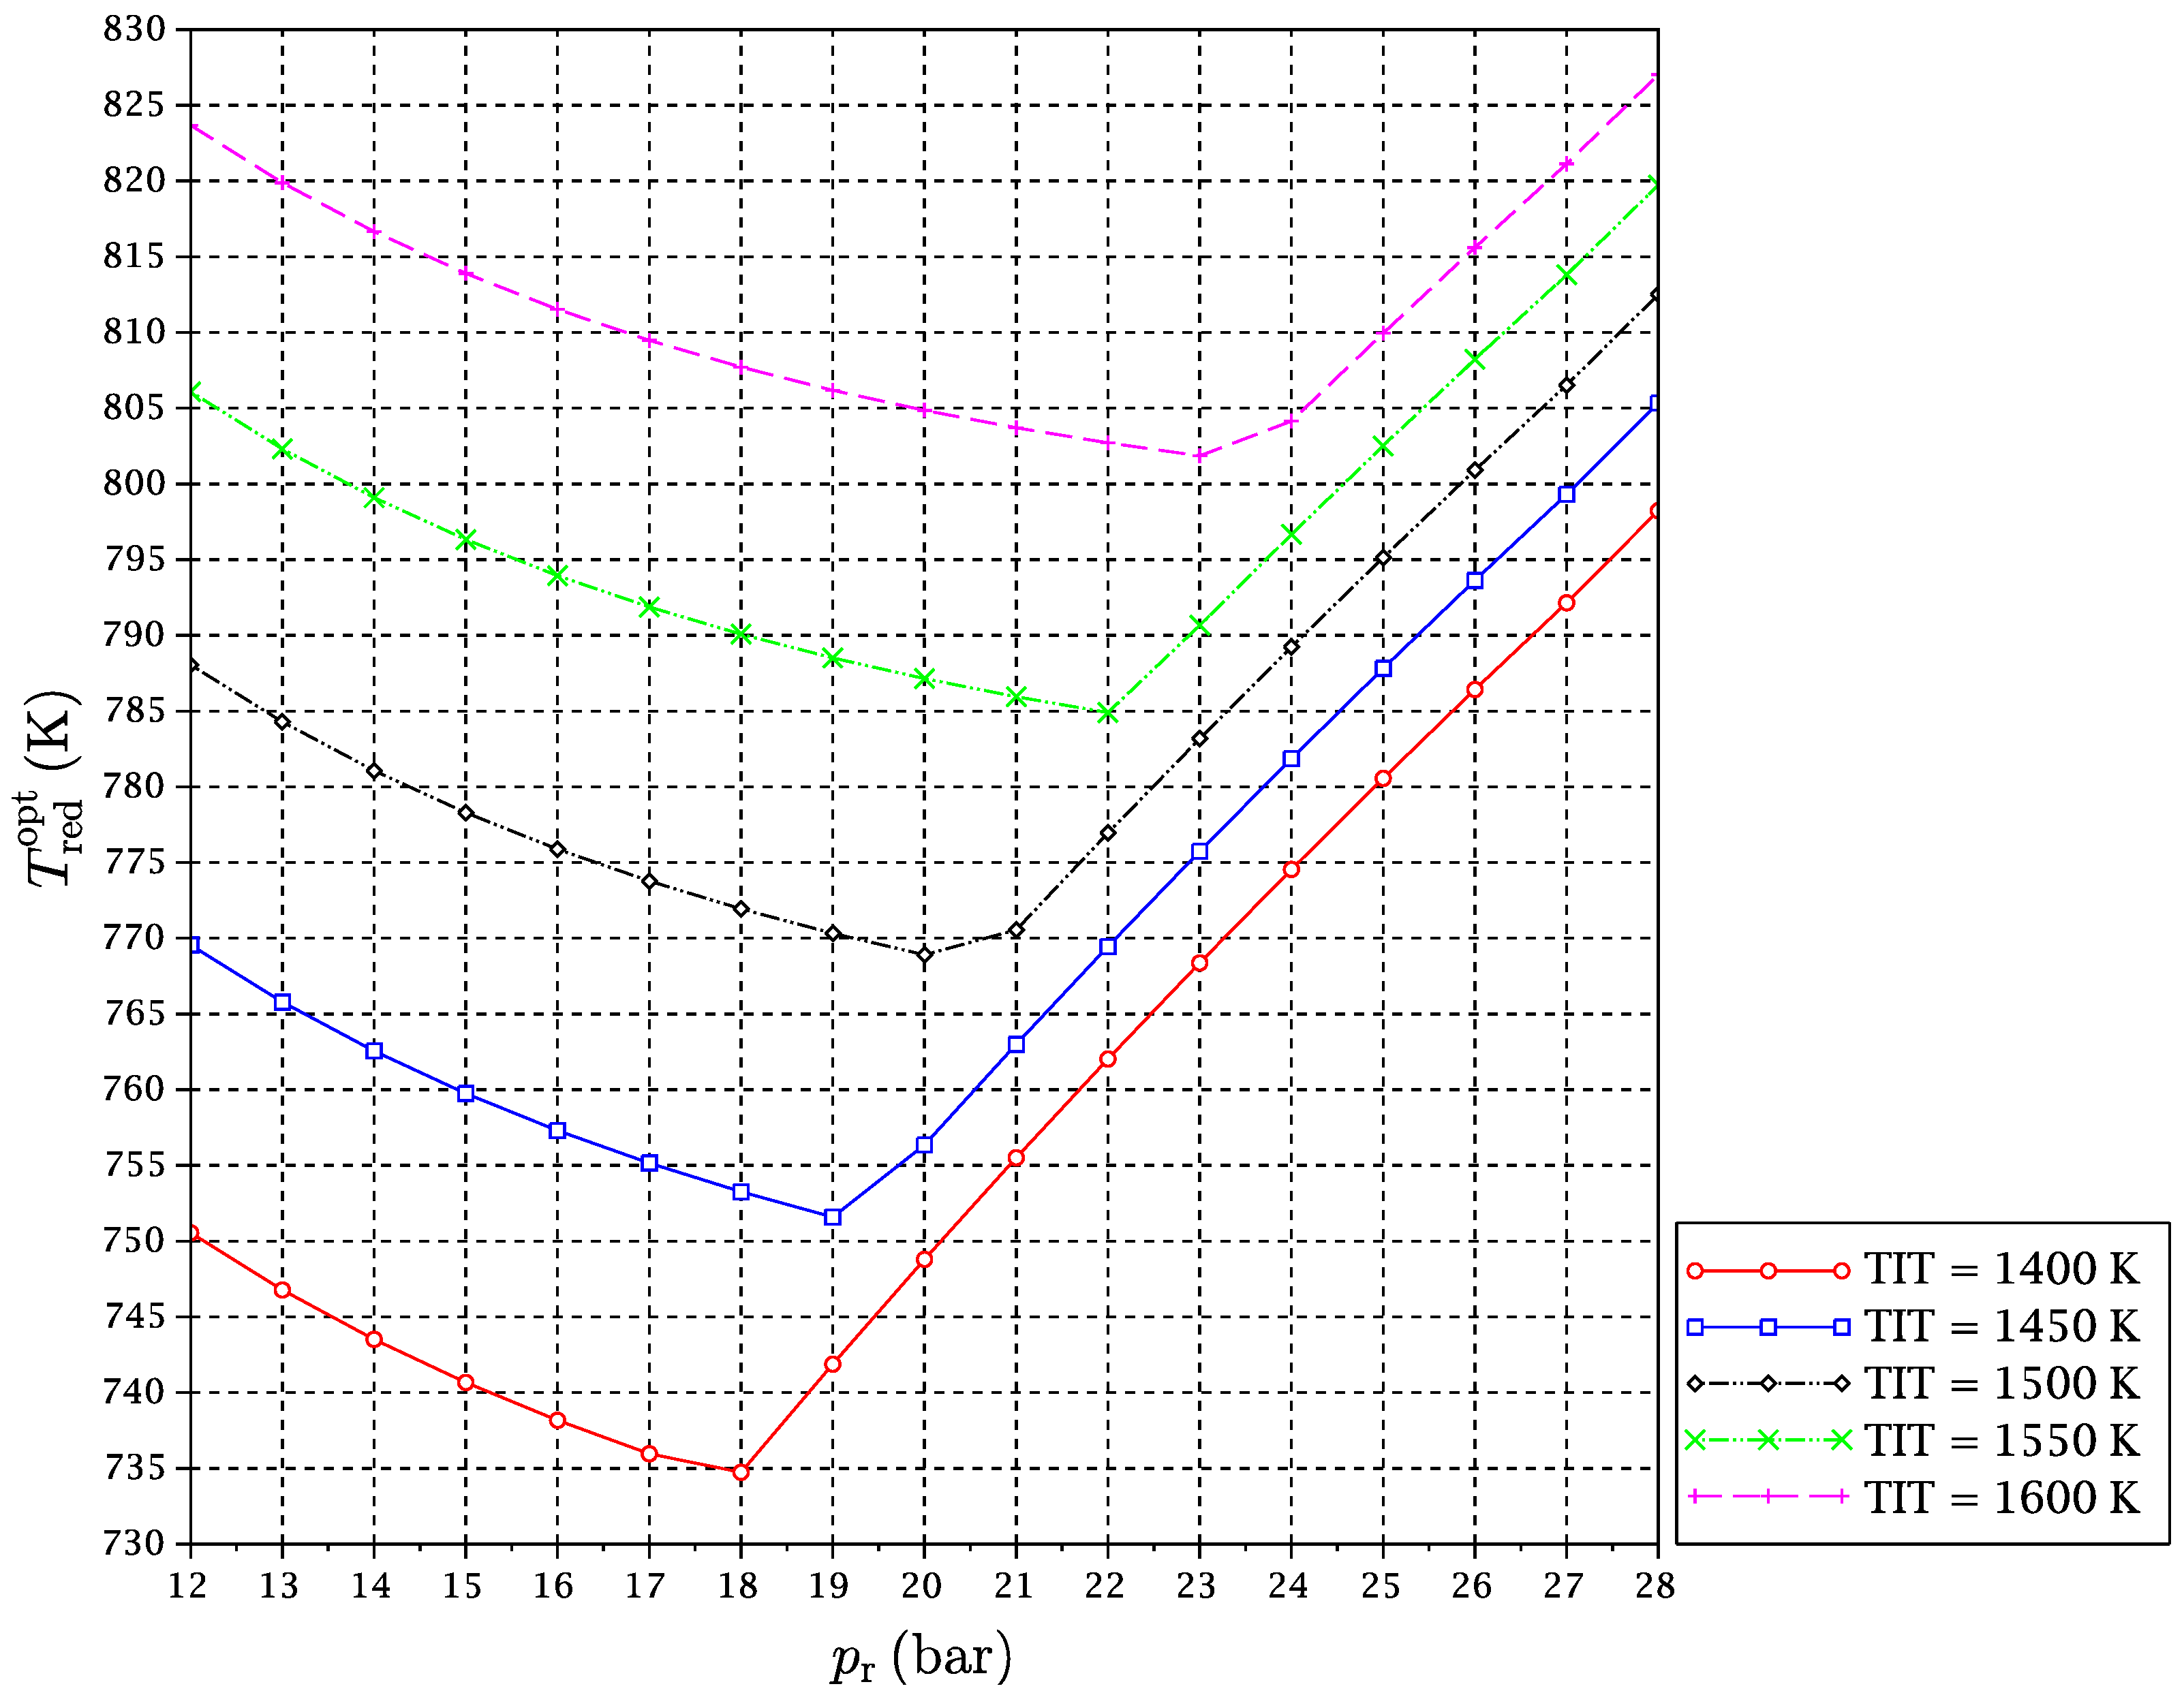
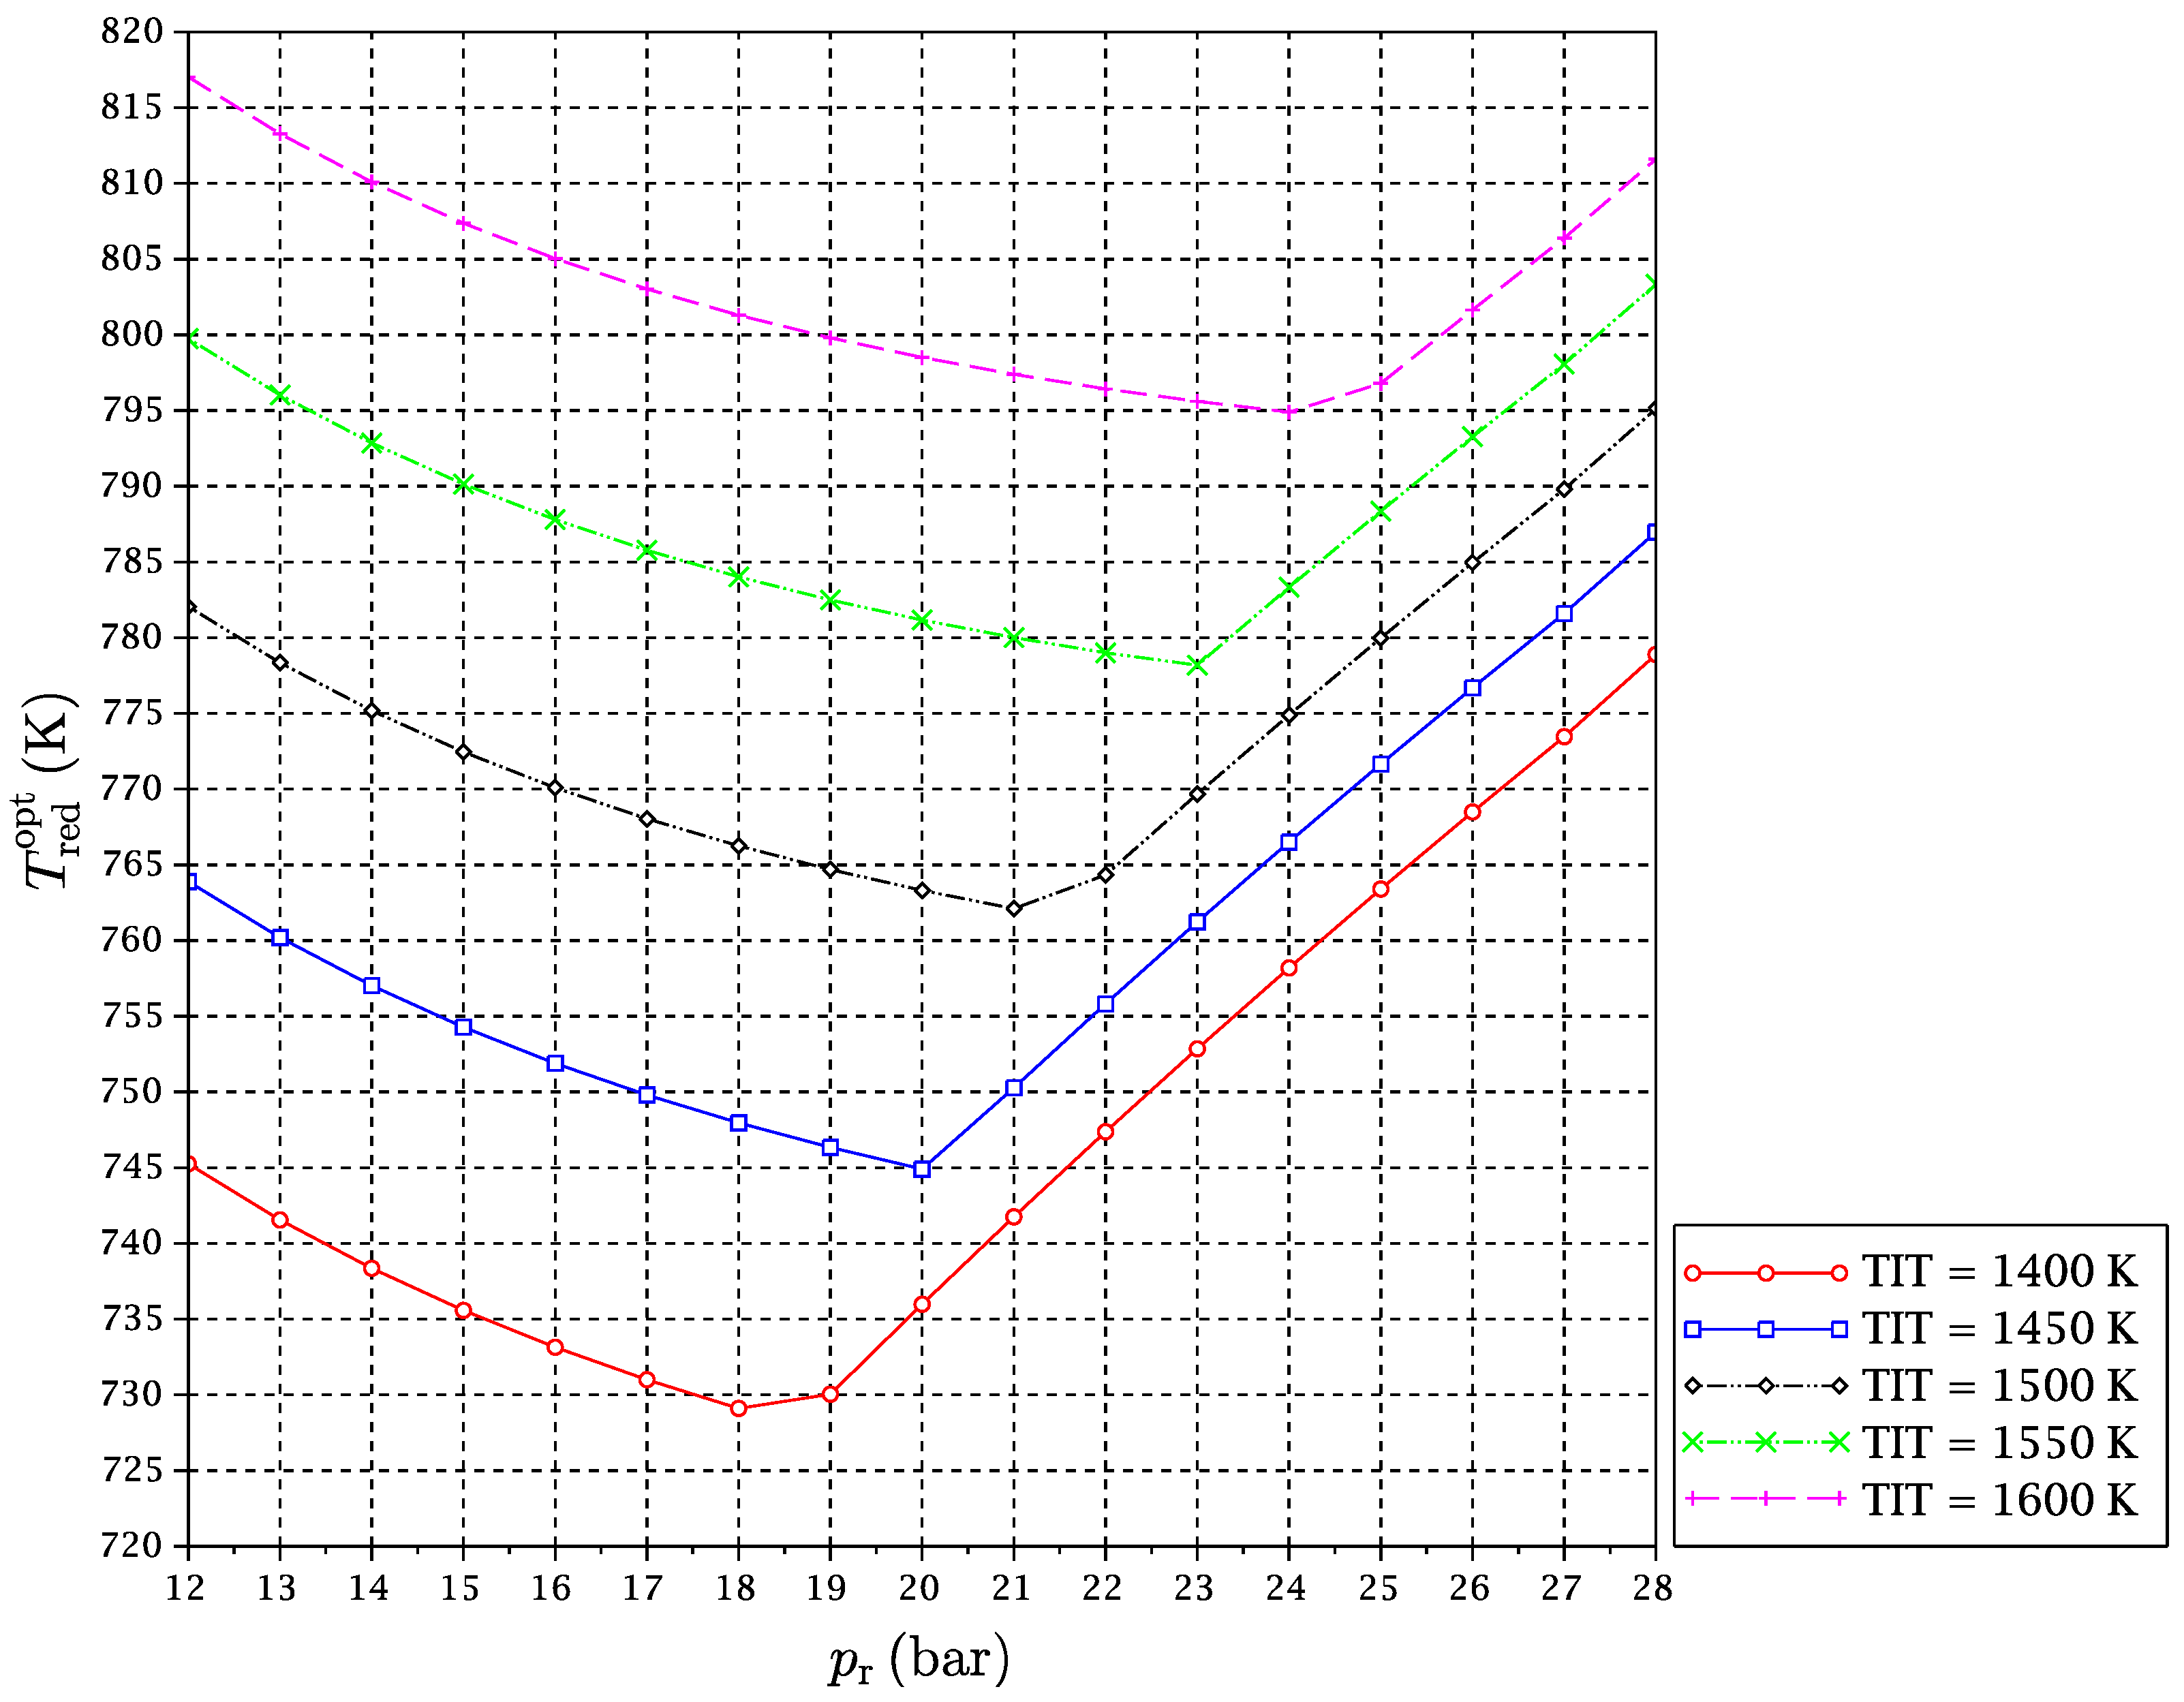
It might be interesting to expand on the freaky thermodynamic behavior revealed by these figures. A change in the tendency of the optimal temperature of the reduction reaction with p r for a given TIT is observed. In principle, increasing the pressure ratio makes the gas turbines outlet temperature after expansion go down. For this reason, at low pressure ratios, the T red opt is reduced with a pressure ratio increase, so that the reactor is able to take sufficient heat from the exhaust gas streams outgoing from the turbines to satisfy the energy balance. However, there is another opposing effect. The increment of pressure ratio compression leads to higher temperatures at the compressors outlets, which implies that the inputs to the reduction reactor are received there at higher temperatures. In summary, the following two effects occur at the same time when the reactors’ pressure is increased:
(a)
Lower temperature of gas streams at the outlet of the gas turbines.
(b)
A decrease of heat demand in the reduction reactor.
At some point, (b)-effect begins to dominate against (a)-effect. At a particular pressure, the heat needed by the reactor is decreased to a point that it can be provided by the CO2 + H2O stream only: the air stream results to uncouple from the reduction reactor heating. This can be seen somehow as a typical “power heat pump” effect (Do not confuse this effect with the so-called “chemical heat pump” effect discussed in 
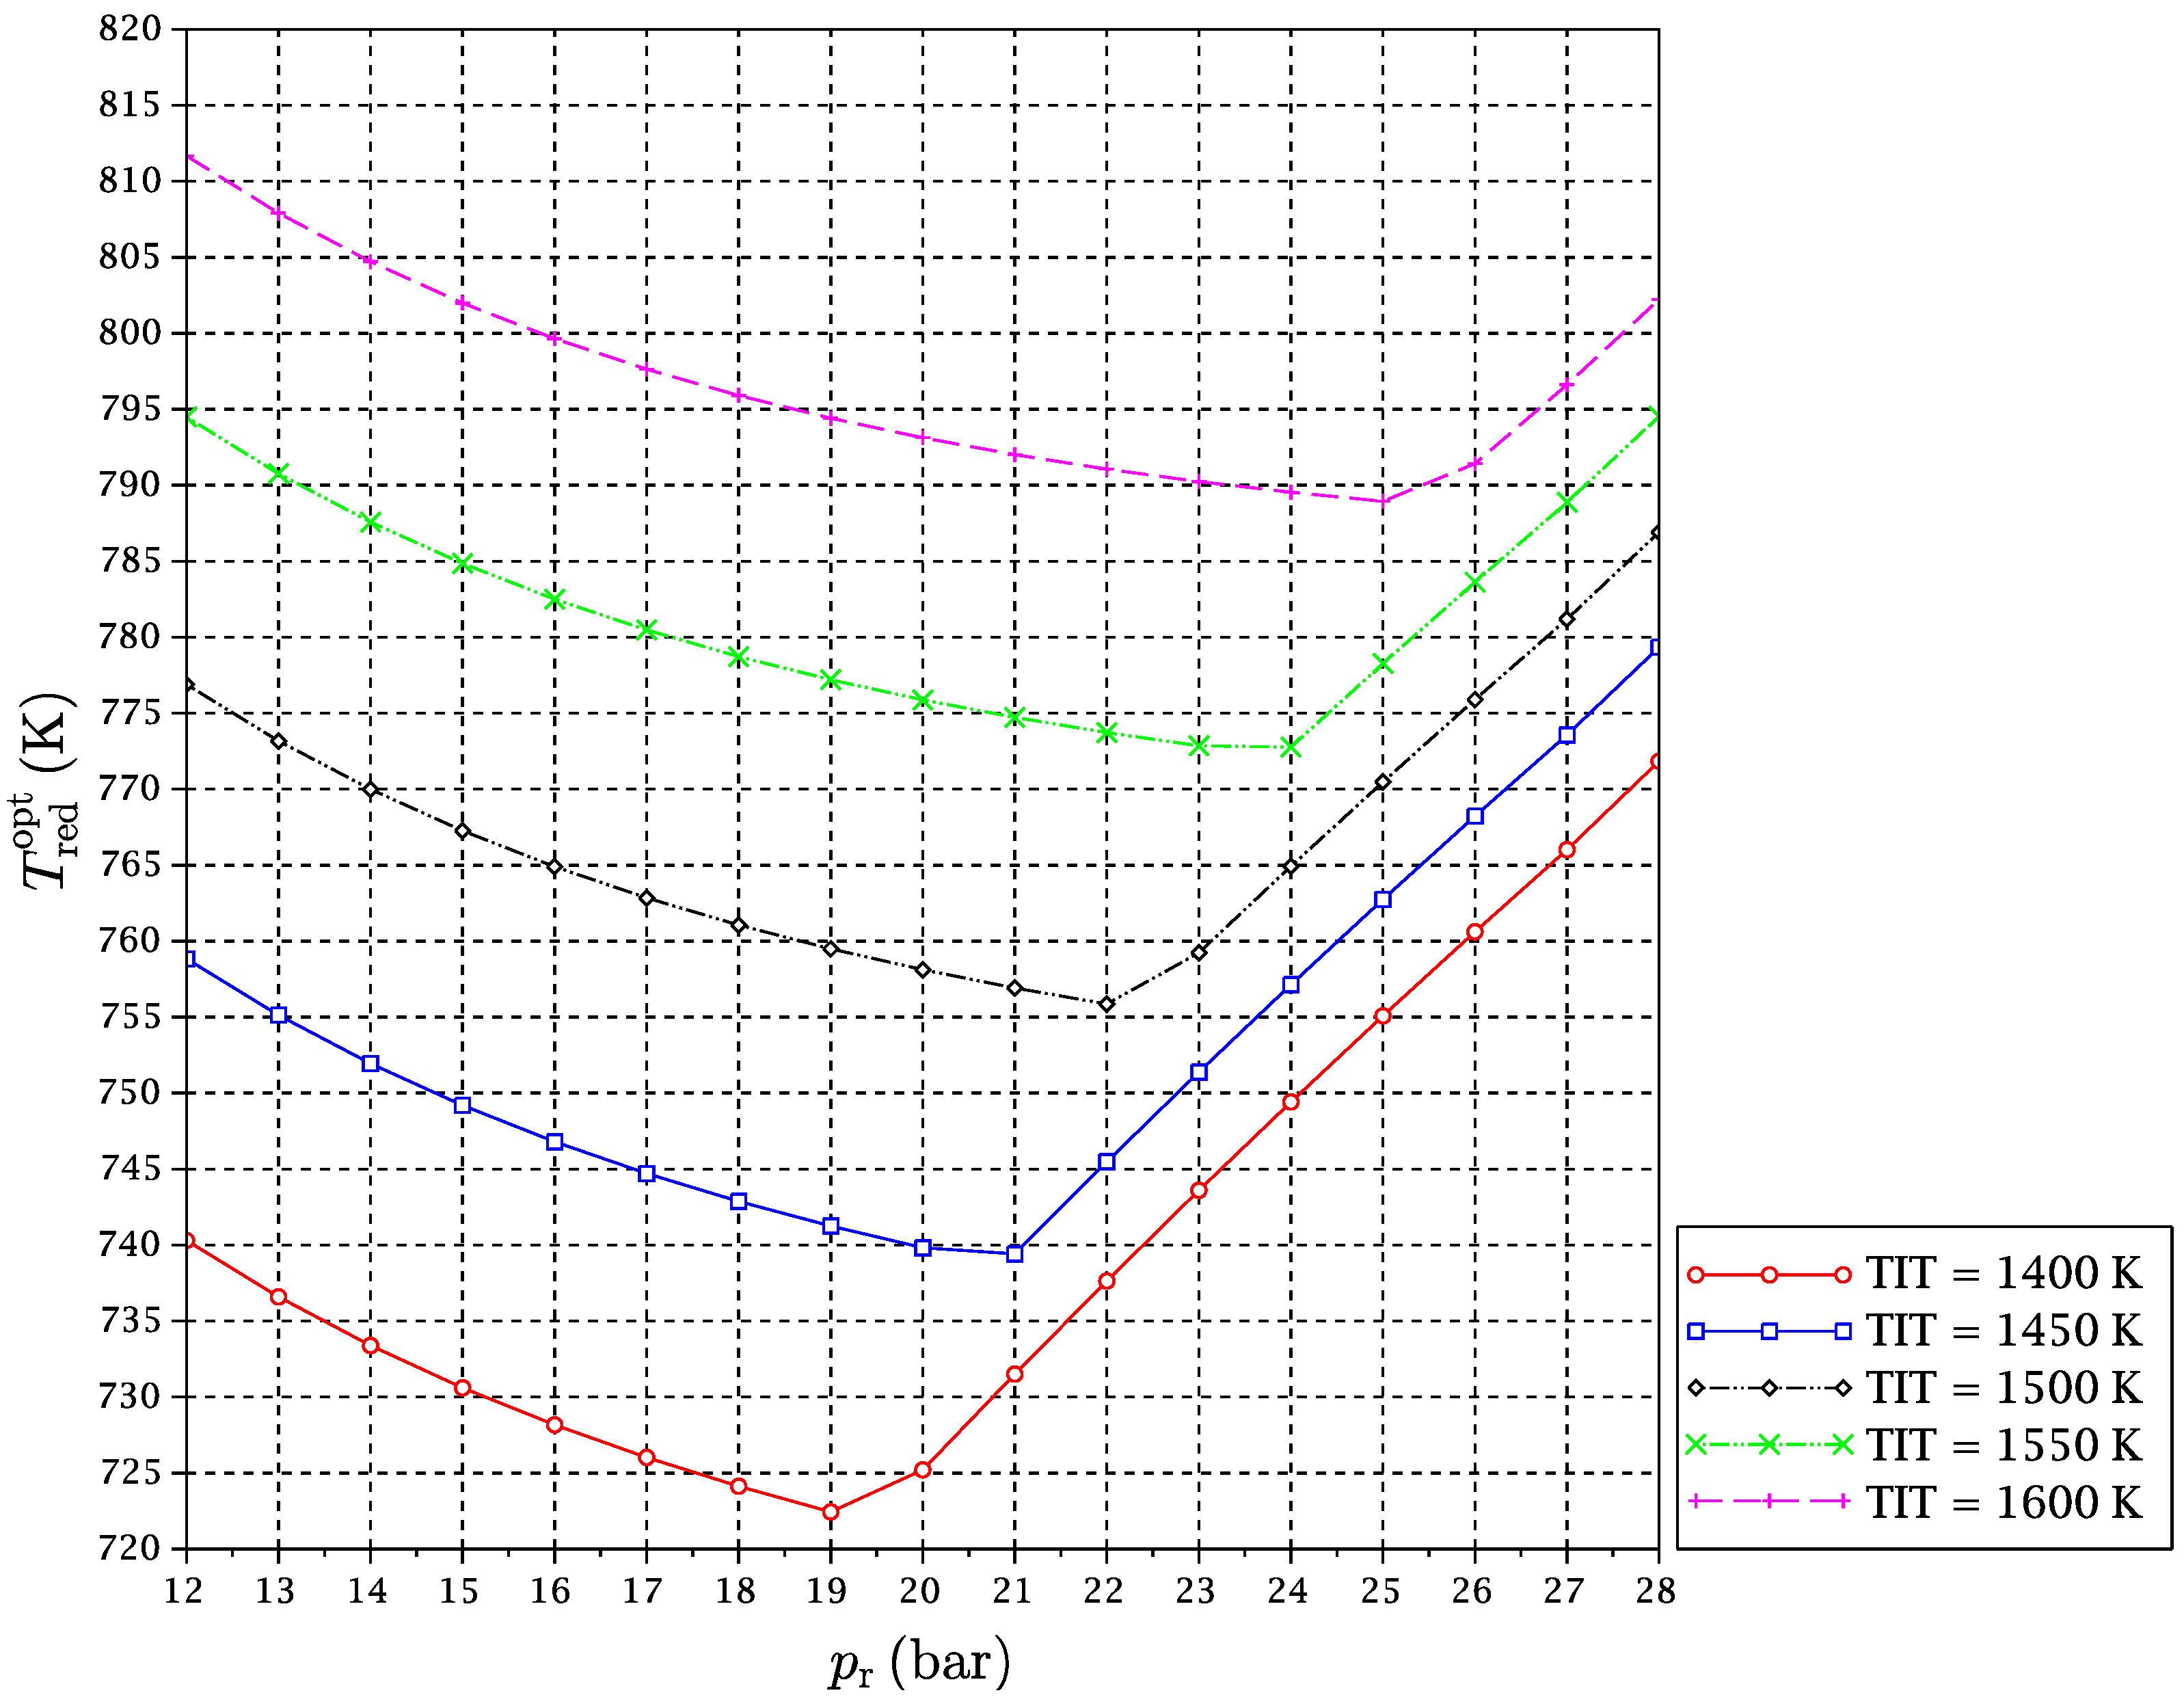
Section 1.1. The “power heat pump” effect refers just to the coming back of the energy that was introduced in the cycle as mechanical power in the air compressor as heat provided to the reduction reactor. The exergy content of this heat flow is then amplified by the “chemical heat pump” effect). Due to the complex heat coupling of streams and reactors in the CLC cycle, this allows T red to reverse its trend, and it begins to increase with pressure ratio (Figure 8, Figure 9 and 
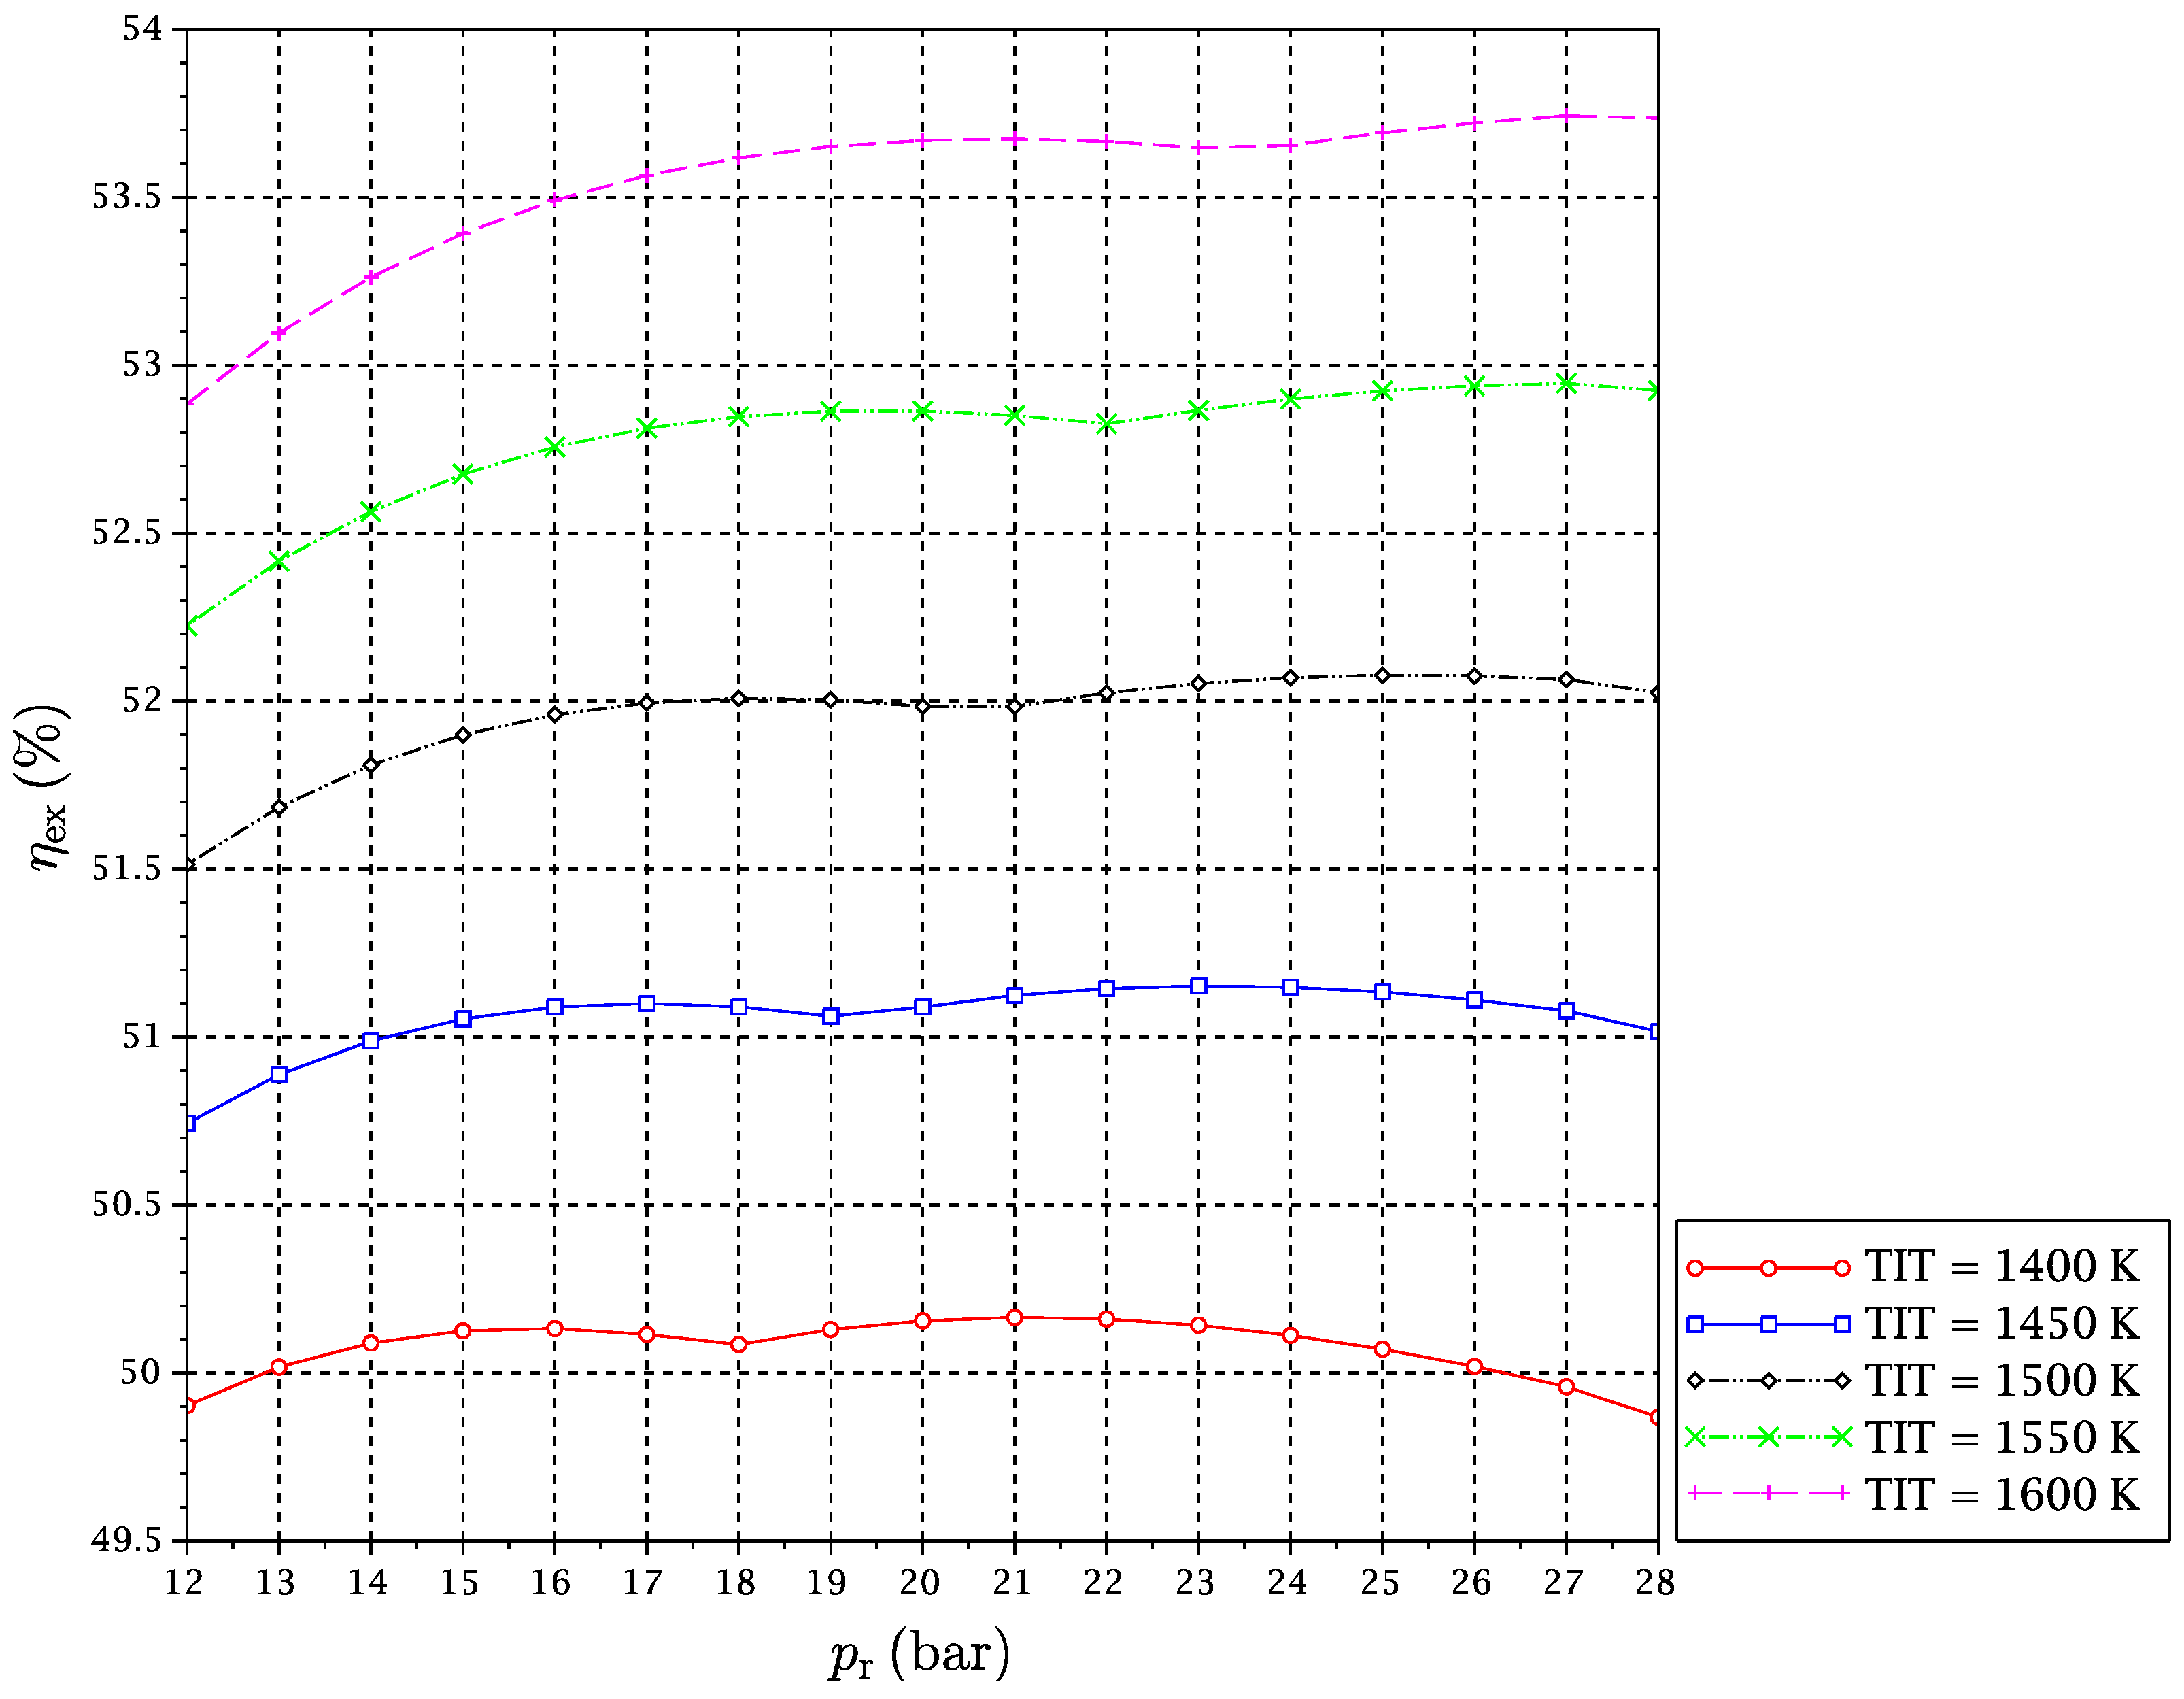
Figure 10). We will refer to this point of tendency change as the reduction reactor heating uncoupling point (RRHUP). This phenomenon is also revealed in the thermal efficiency plots. Instead of the usual curves with a maximum that are found for a conventional combined cycle, curves with two local maxima of quite similar values are obtained for this CLC system (Figure 5, Figure 6 and Figure 7). Consequently, a good thermal efficiency that is almost constant is achieved along a quite wide range of pressure ratios. Table 2 shows the position of the exergy efficiency maximum found for each TIT curve (the highest of both), together with the optimal reduction temperatures for these maxima.
It can be noticed that Syngas B presents a higher exergetic efficiency and lower reduction temperature than Syngas A. This is justified on the basis of the different hydrogen contents of both syngases. More hydrogen implies more need for heat at the reactors, and temperature must be lowered to satisfy the energy balance. In addition, the “chemical heat pump” effect leads to a higher exergy efficiency. Syngas C has an intermediate content of hydrogen, but also a significant extra amount of carbon monoxide. Since the oxidation of carbon monoxide is slightly exothermic, the reduction temperature can be increased a bit, and the exergy efficiency obtained is consequently the highest of the three fuels under study. Another interesting point is that for the case of Syngas B, the highest maximum is the left one, i.e., at lower p r , while for Syngases A and C, the highest maximum is the right one, i.e., at higher p r . In any case, the difference in the exergy efficiency between Syngases B and C is very slight.
The thermodynamic conditions of the whole optimized CLC cycle are fully given in Table 3 for the case of Syngas C and TIT equal to 1550 K, as an example. The temperature, pressure and composition of all cycle points represented in Figure 2 can be read from the table. Points 23–26 (not shown in Figure 2) correspond to a conventional one pressure level steam cycle.

3.3. Exergy Balances

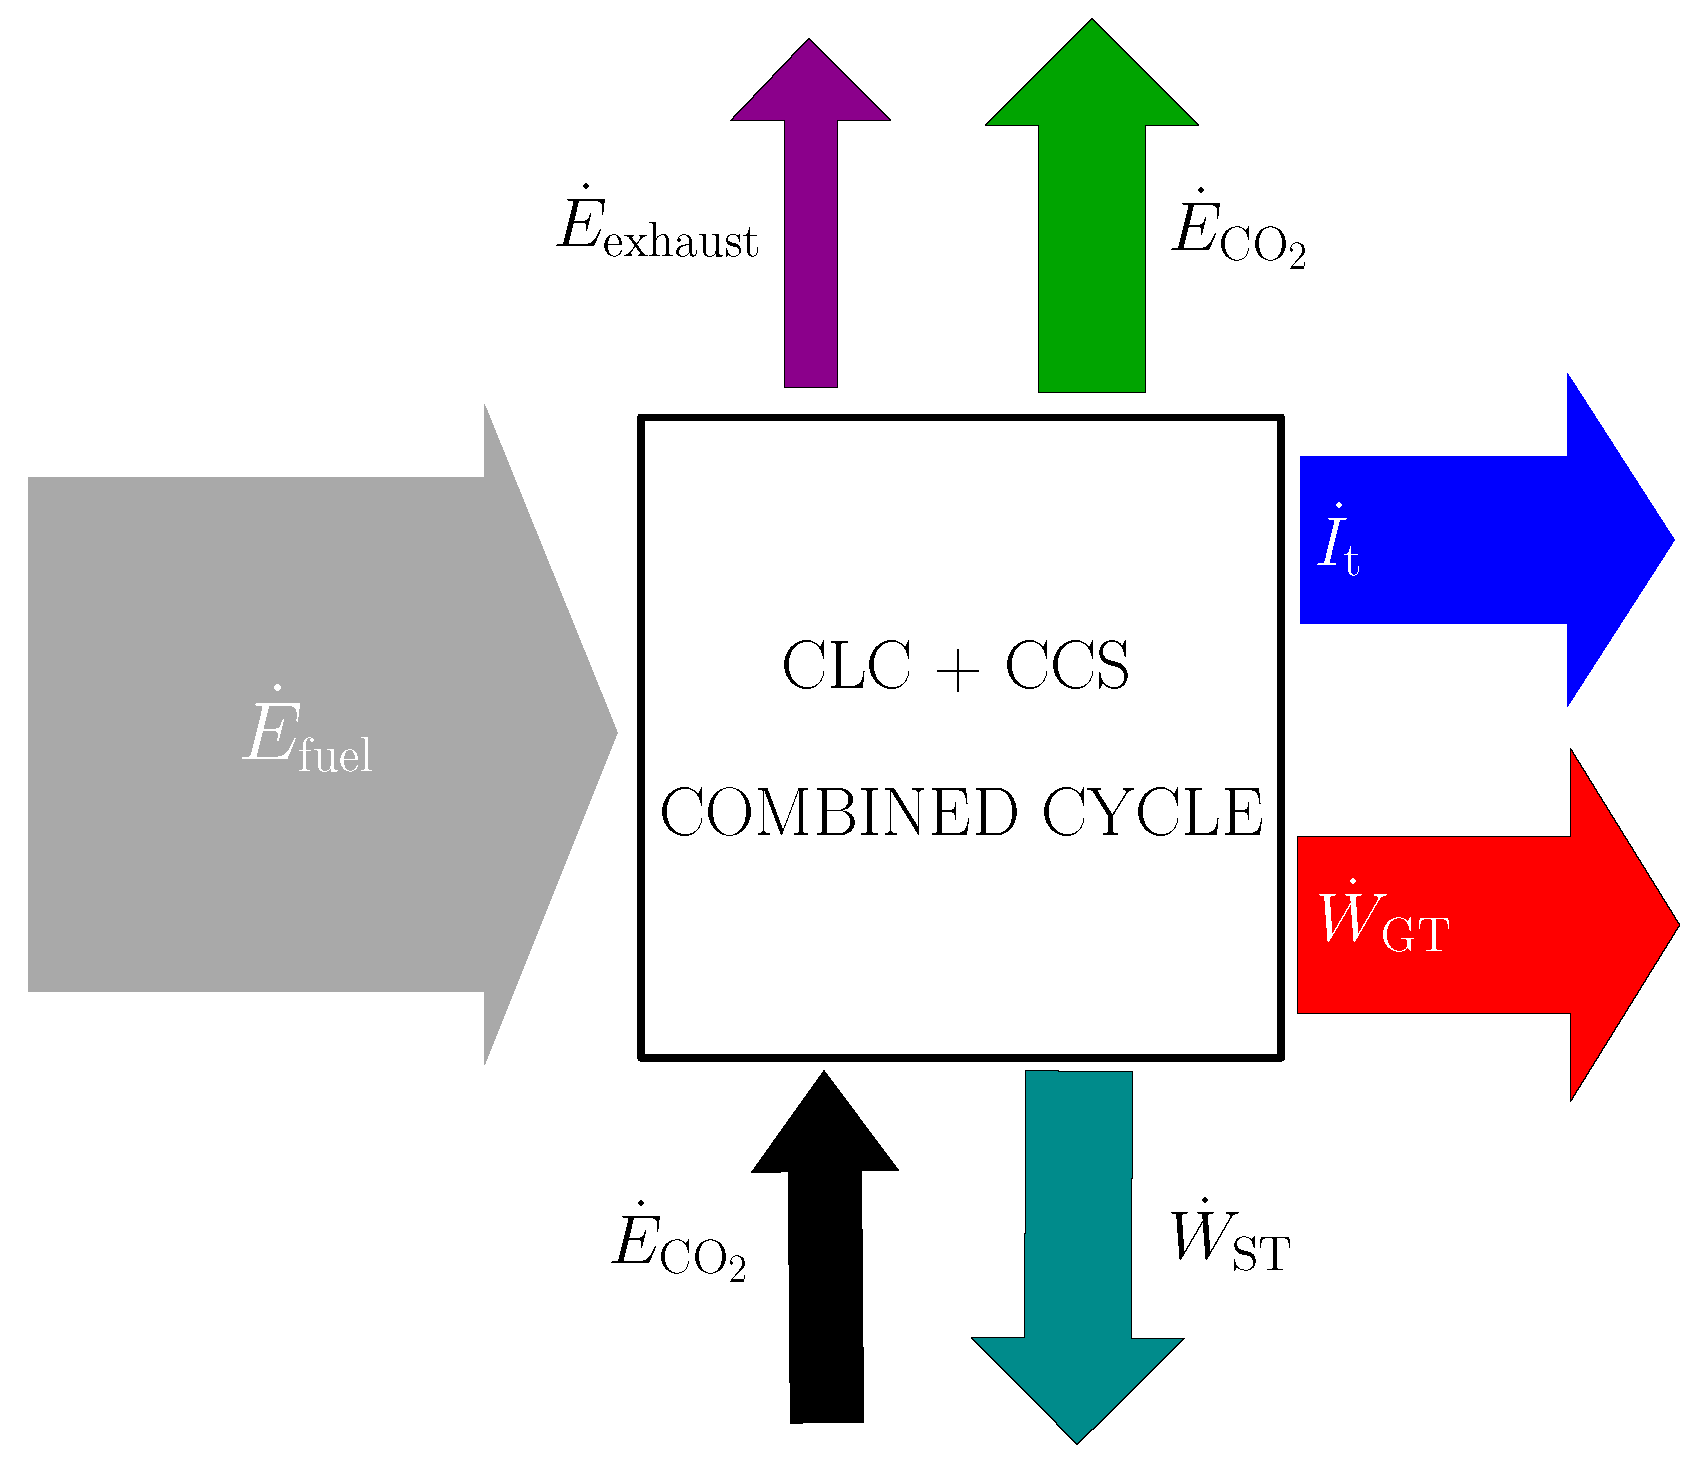
Figure 11 illustrates the exergy flows in the proposed CLC power plant. The exergy input to the power plant is fuel’s exergy, mainly the chemical exergy term, but also the physical exergy term. The exergy outputs are the compressed CO2 stream and the flue air stream. The exergy content of the latest of both is as a matter of fact a non-recoverable exergy term, so it could be considered as an exergy loss somehow. Another part of the fuel’s exergy content is transformed to power in the gas turbine cycle and in the steam cycle. Some of this power must be reinjected to the cycle as the power consumption of CO2 compressors. Finally, the rest of the fuel’s exergy content is lost, due to irreversibilities in the cycle and heat losses to the environment.
A quantification of the exergy distribution is shown in Table 4 for a particular case with TIT = 1550 K , under the optimal conditions for each syngas, given in Table 2. Values are given as a fraction of the exergy input to the cycle, i.e., normalized by E ˙ fuel .
It may be of interest to remark on the influence of the CO2 compression power consumption in the exergy efficiency of the cycle. The difference between Syngases A and C is about 1.4 percentage points, much more significant than the influence of power generation by gas turbines and steam turbines, and it would be higher if the storage pressure of CO2 were increased. This term can be seen as approximately proportional to the carbon plus inert gases content of syngas (massflow to be compressed per mol of fuel) and approximately inversely proportional to the fuels chemical exergy. This could be characterized by a fuel dependent carbon and inert/exergy parameter:
C & I / Ex = x CO + x CO 2 + x N 2 + x Ar e CH
that can be obtained from Table 1 for the fuels under study:
Syngas A Syngas B Syngas C C & I / Ex   ( mol / MJ ) : 3.685 2.946 2.771
and is more or less proportional to the W ˙ CO 2 values given in Table 4.
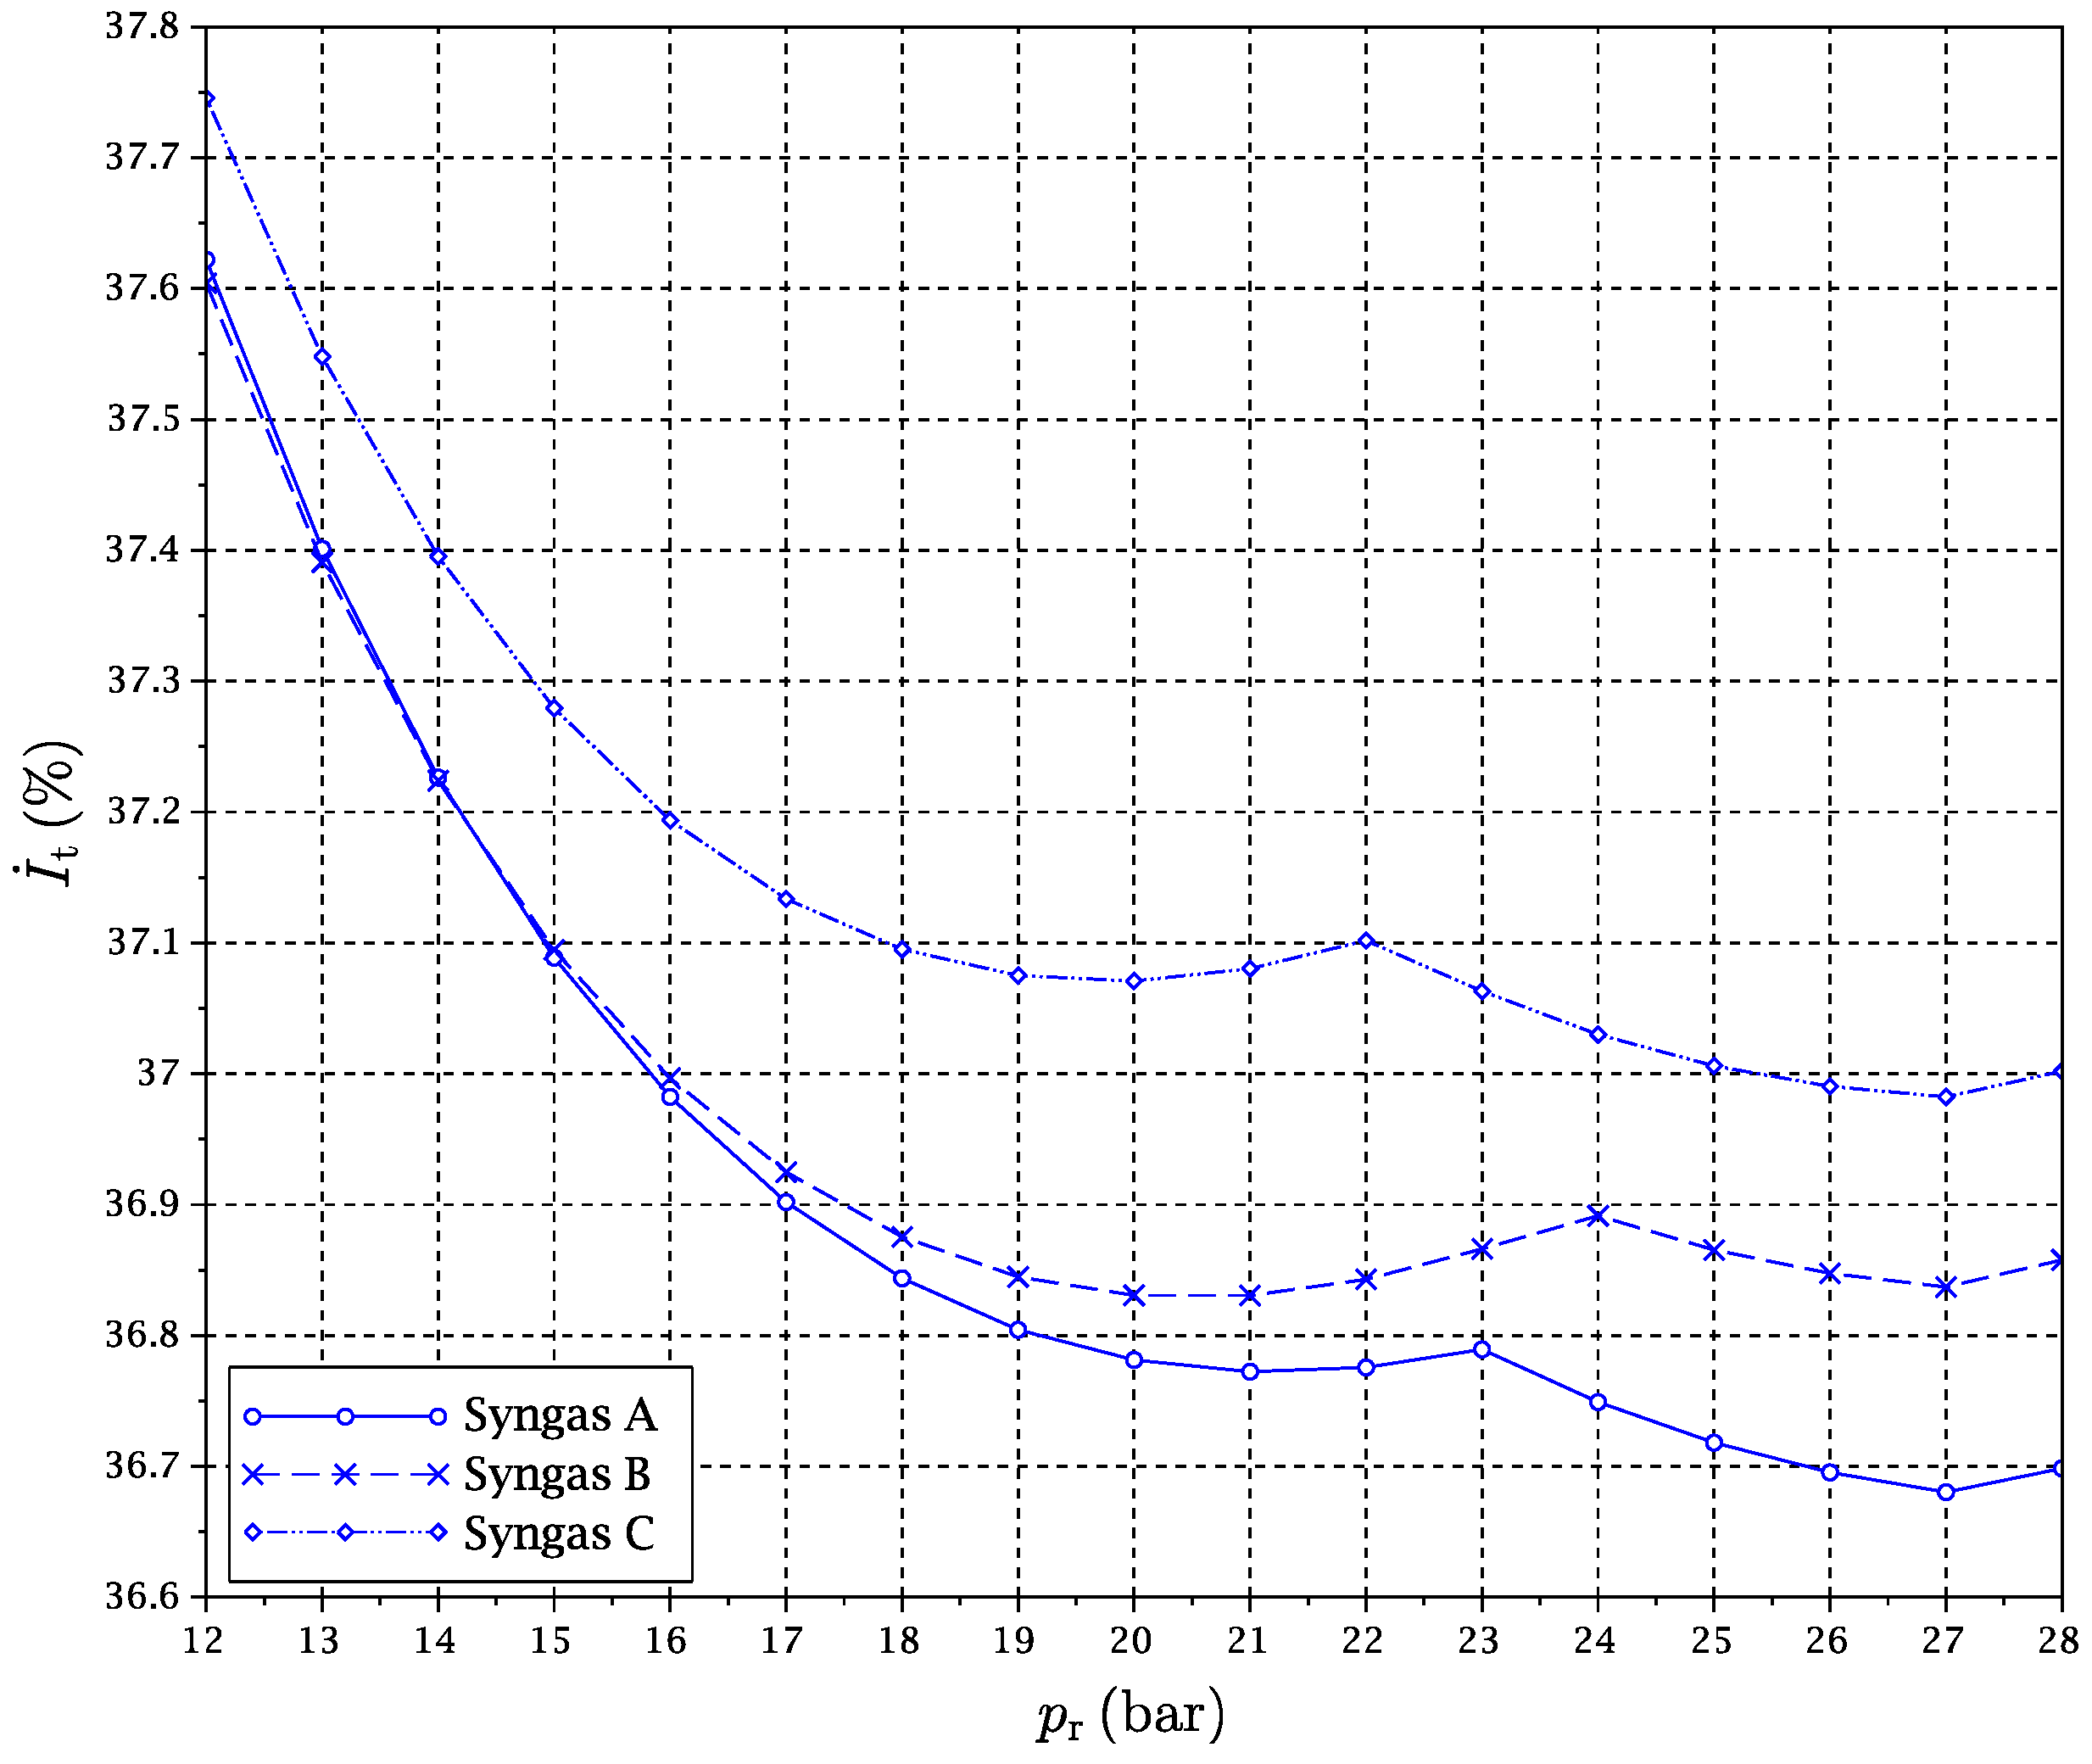
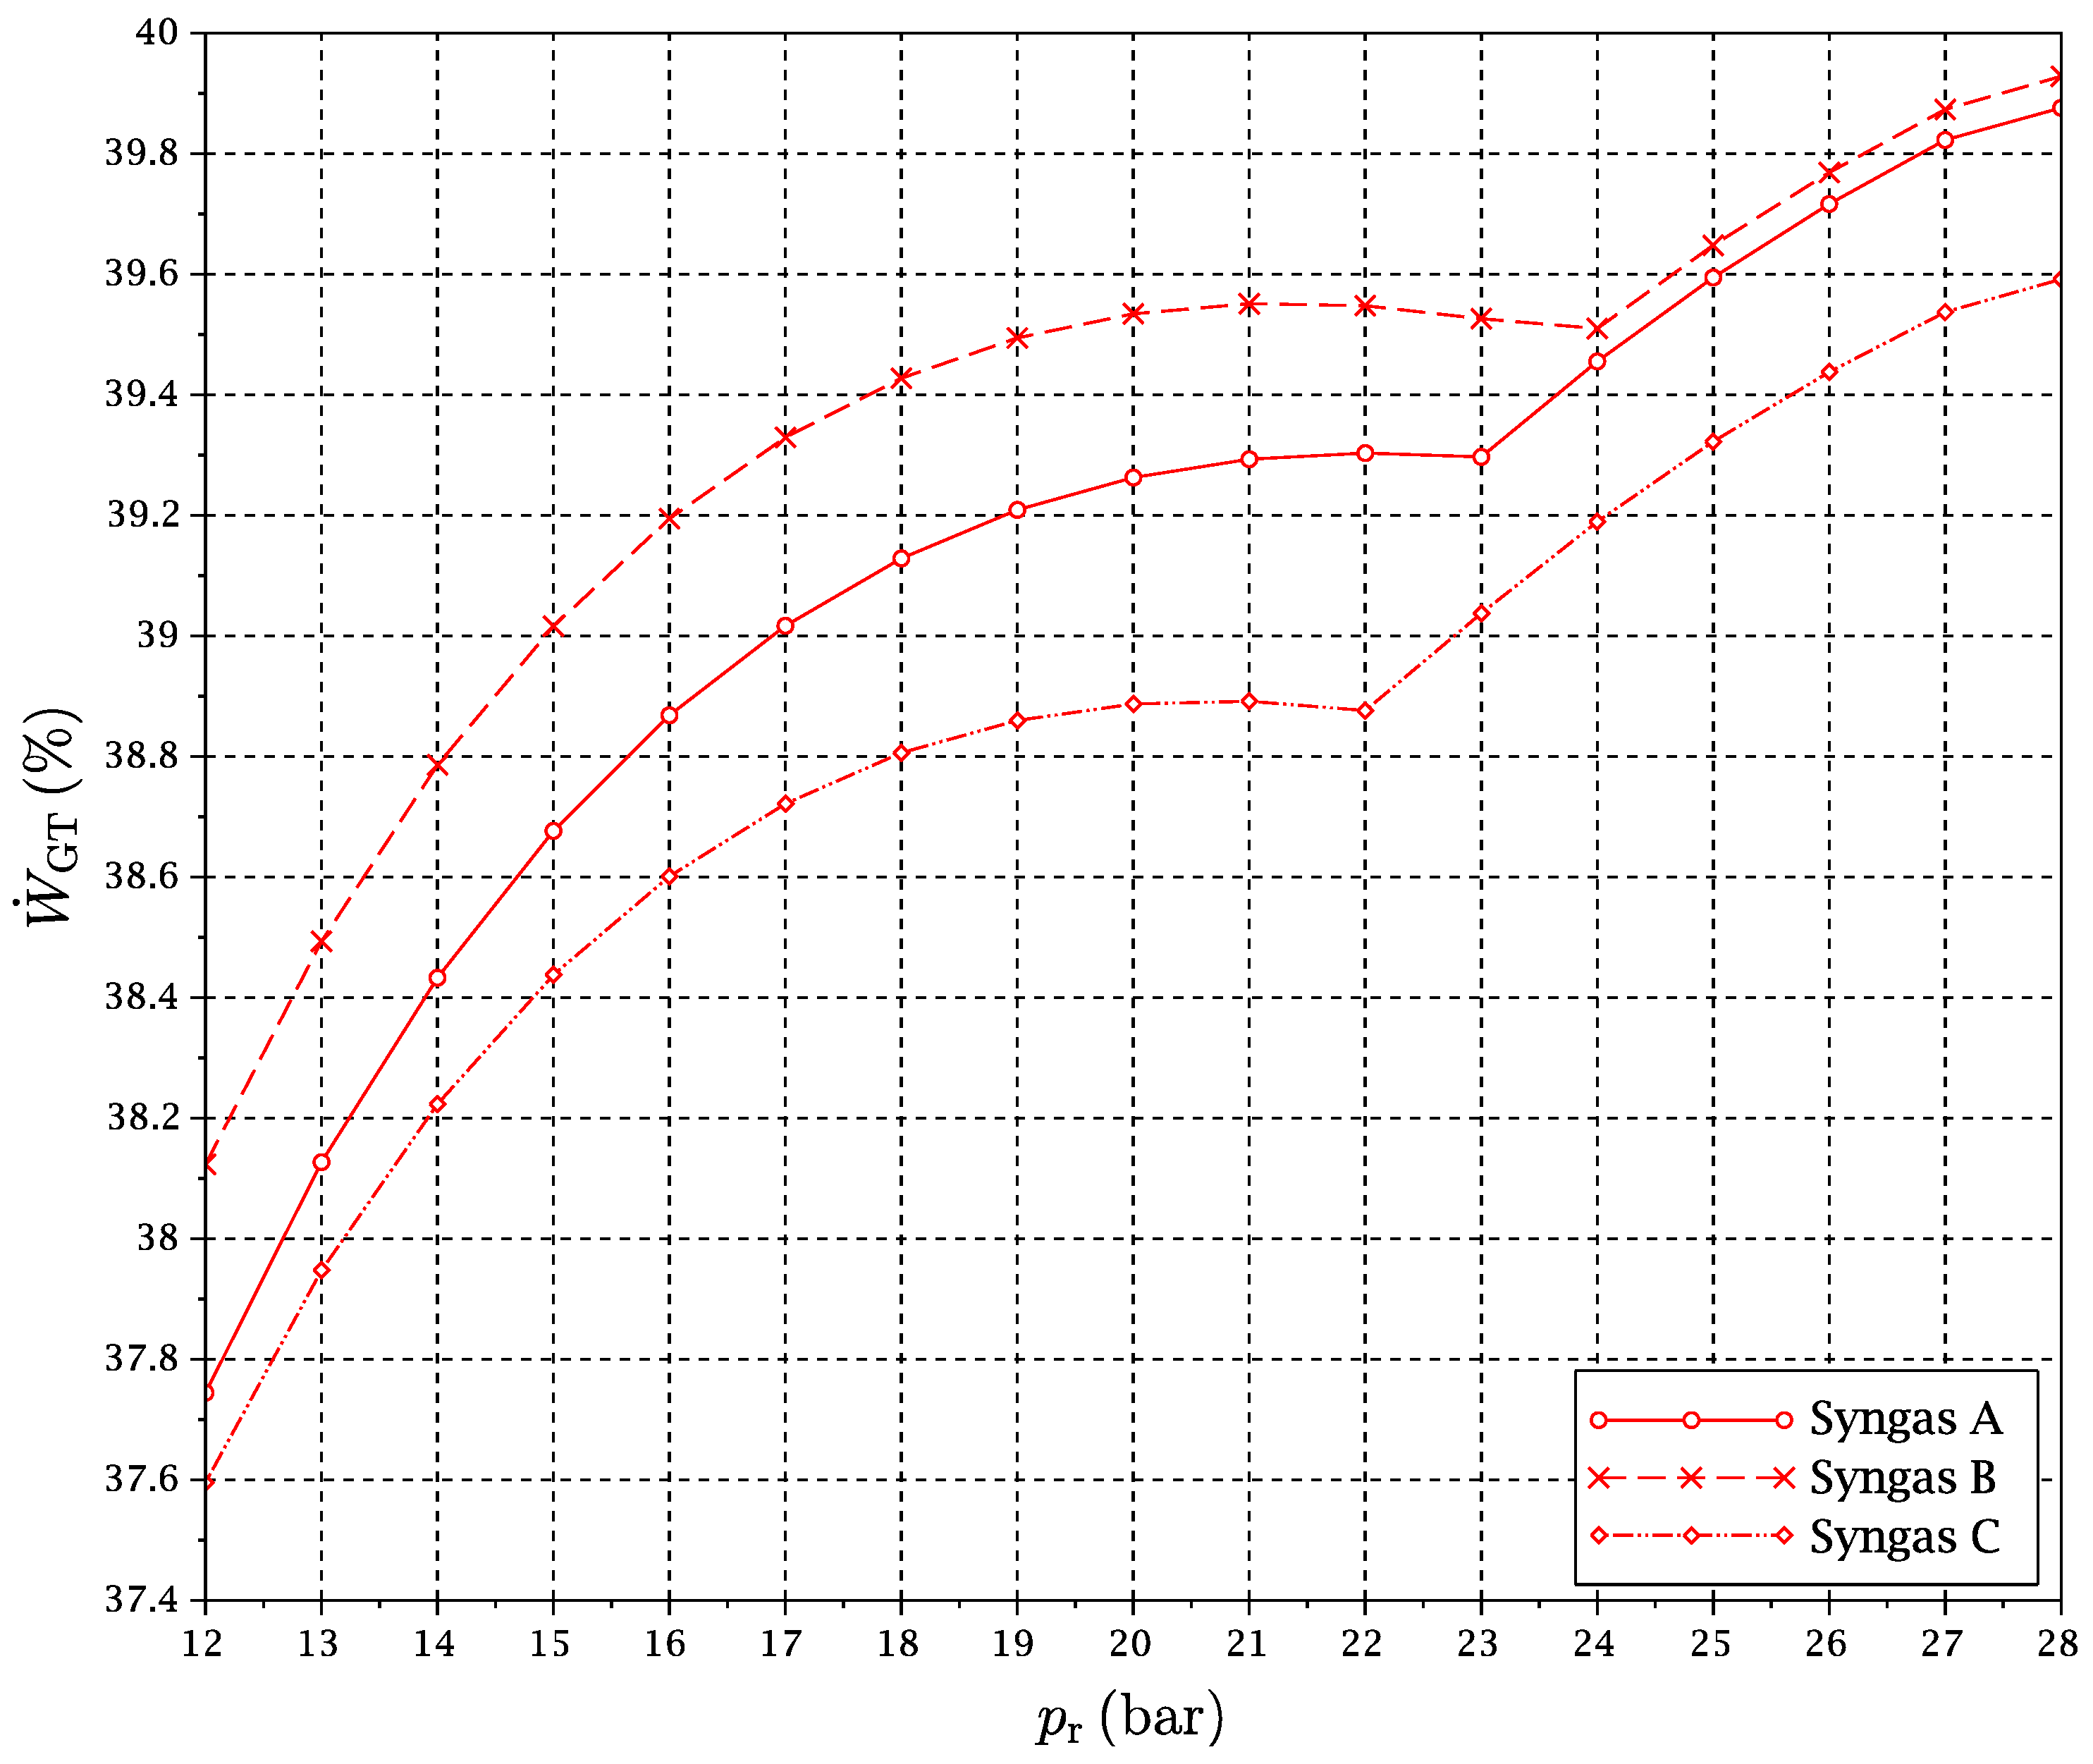
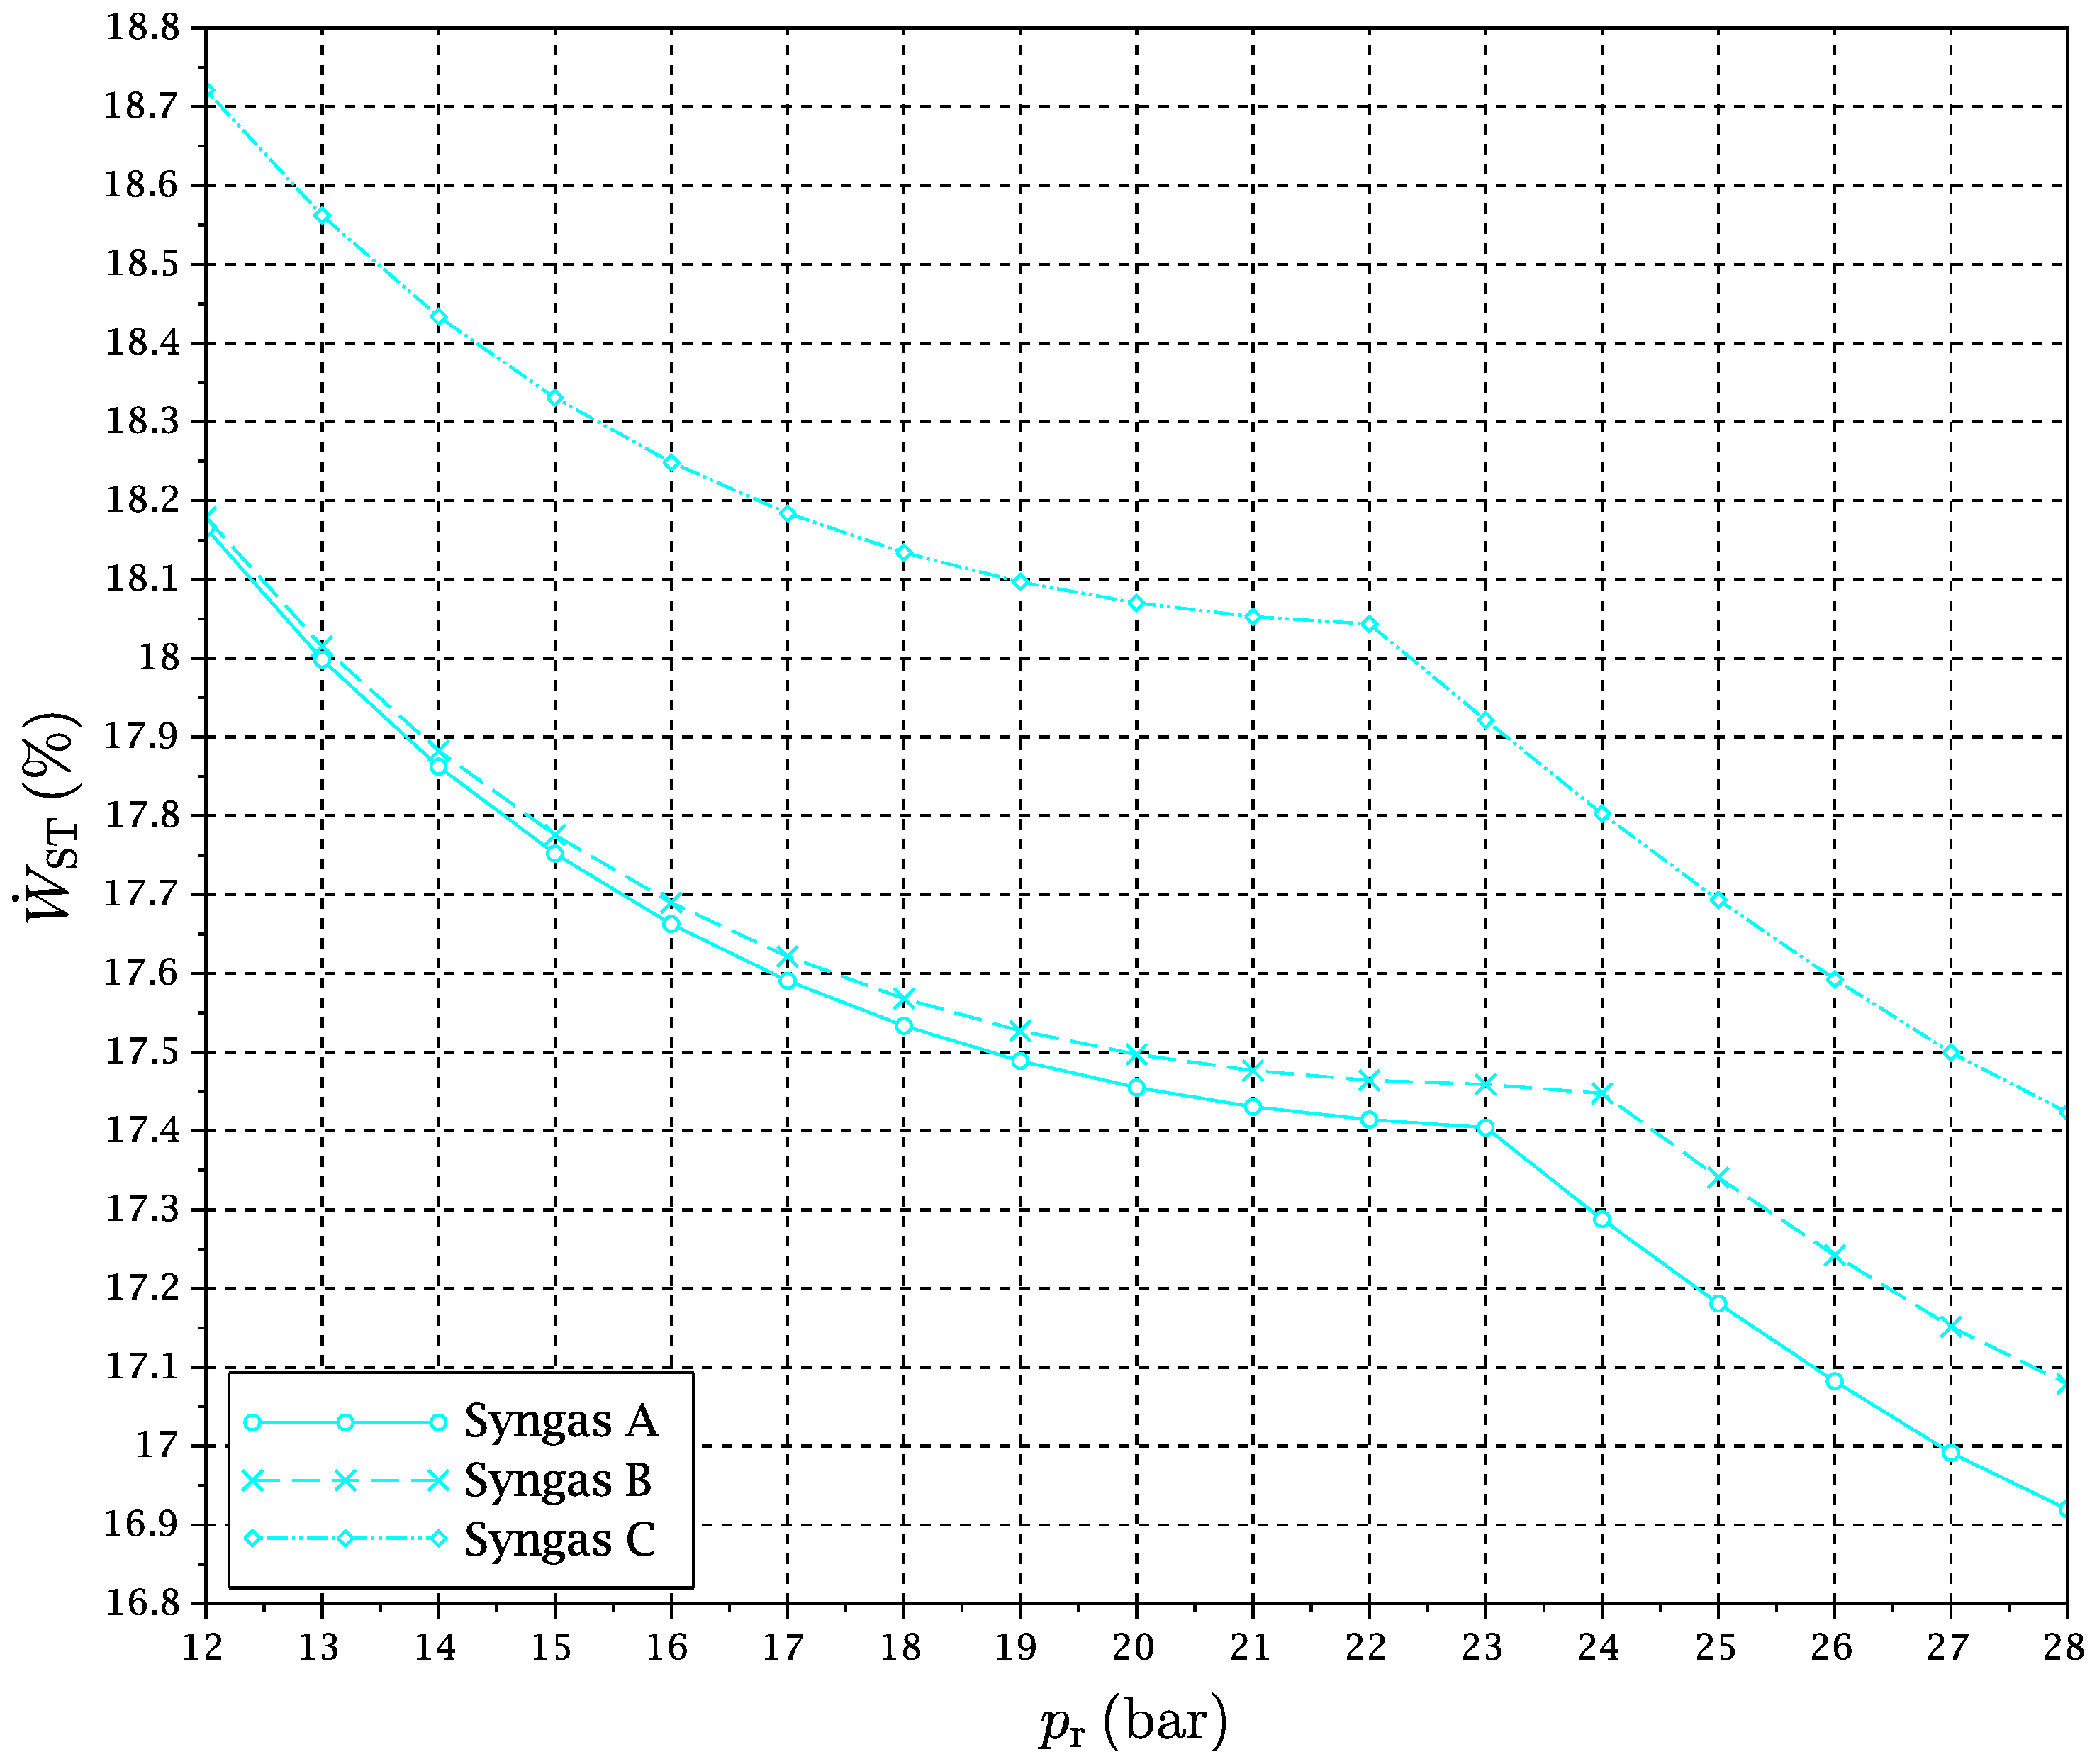
It is also interesting to analyze the dependence of the main exergy flows with the operating conditions. A negligible dependence is found for the exergy content of flue air, CO2 compression power and stored CO2 flow, since their conditions are more or less uncoupled from the rest of the cycle. The exergy flows of total exergy loss, gas turbines power production and steam turbine power production as a function of pressure ratio have been plotted in Figure 12, Figure 13 and Figure 14 for a particular value of TIT. Values are given as a fraction of E ˙ fuel .
All of Figure 12, Figure 13 and Figure 14 show clearly the abrupt change of tendency associated with the RRHUP. In particular, Figure 13 reproduces how an important extra amount of power is produced by GT1 when the reduction temperature begins to increase as the RRHUP is reached due to the combination of the “power heat pump” and “chemical heat pump” effects mentioned previously. This is partially compensated by the lower power produced by the steam cycle (Figure 14), since the temperature of the air stream entering the HRSG decreases quickly with the pressure ratio. However, the combination of both effects and a low total exergy loss (Figure 12), allows one to obtain a second maximum in the overall exergy efficiency in a zone of higher pressure ratios (see Figure 5, Figure 6 and Figure 7).
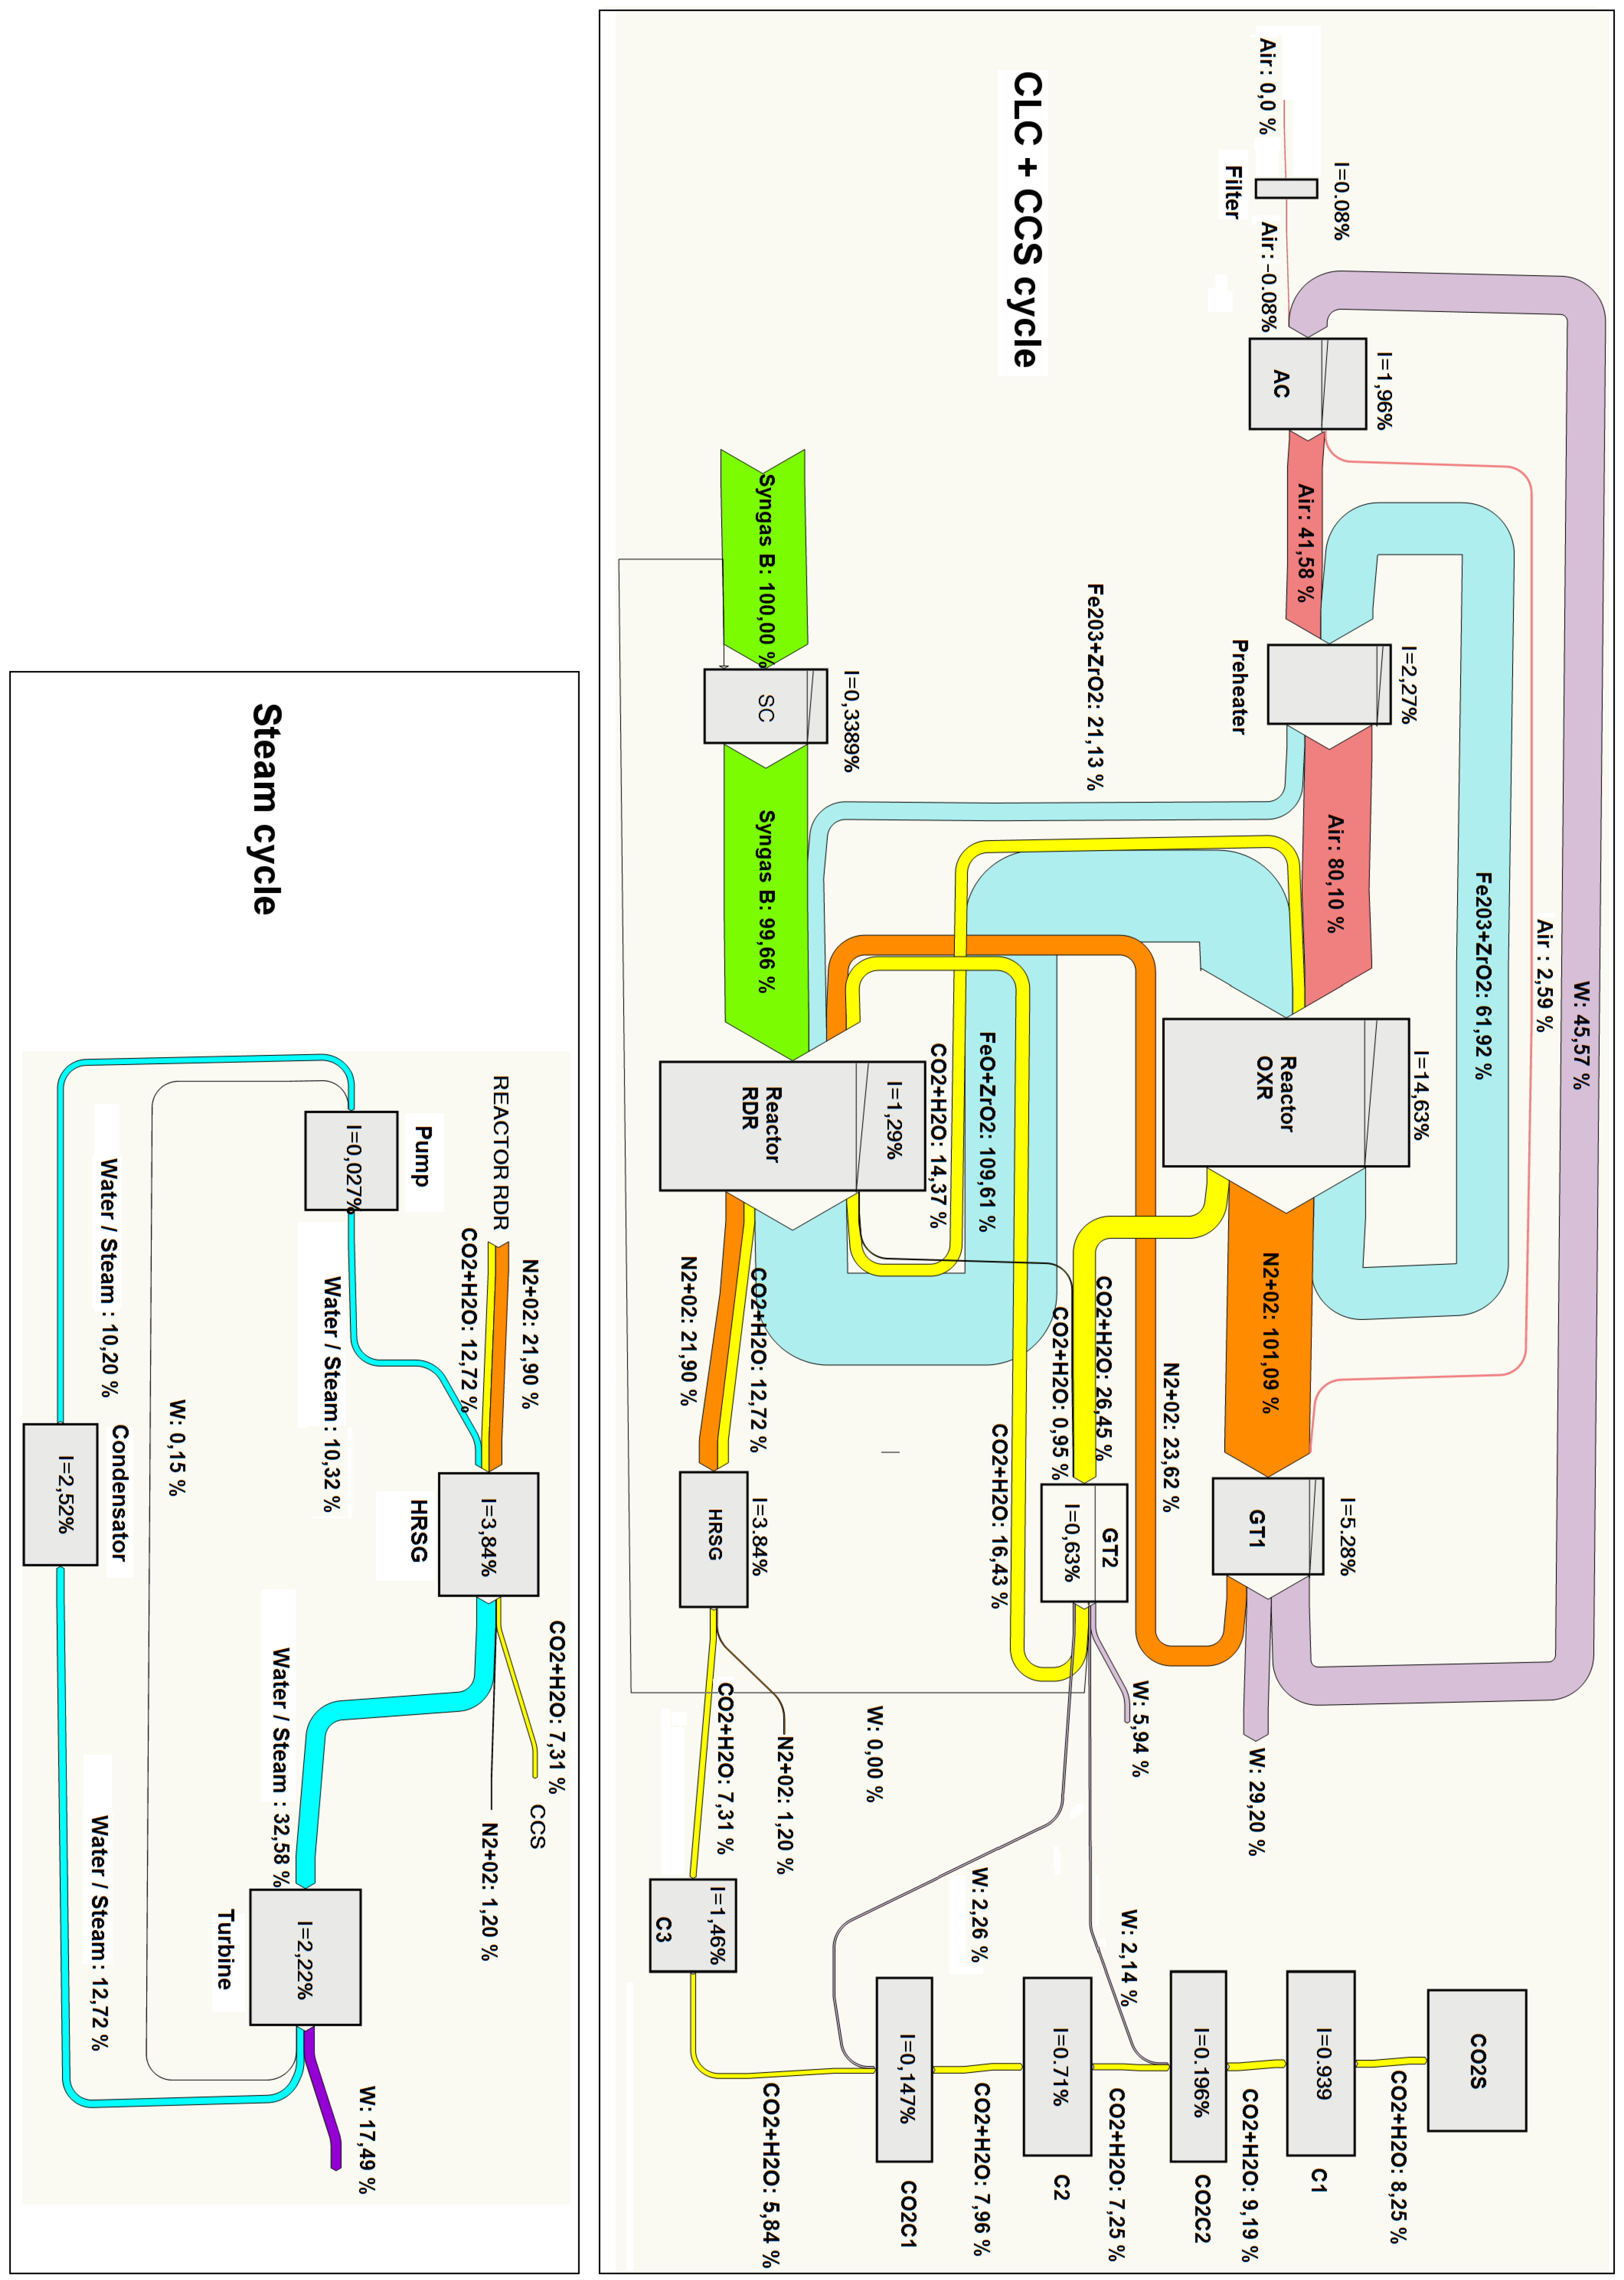
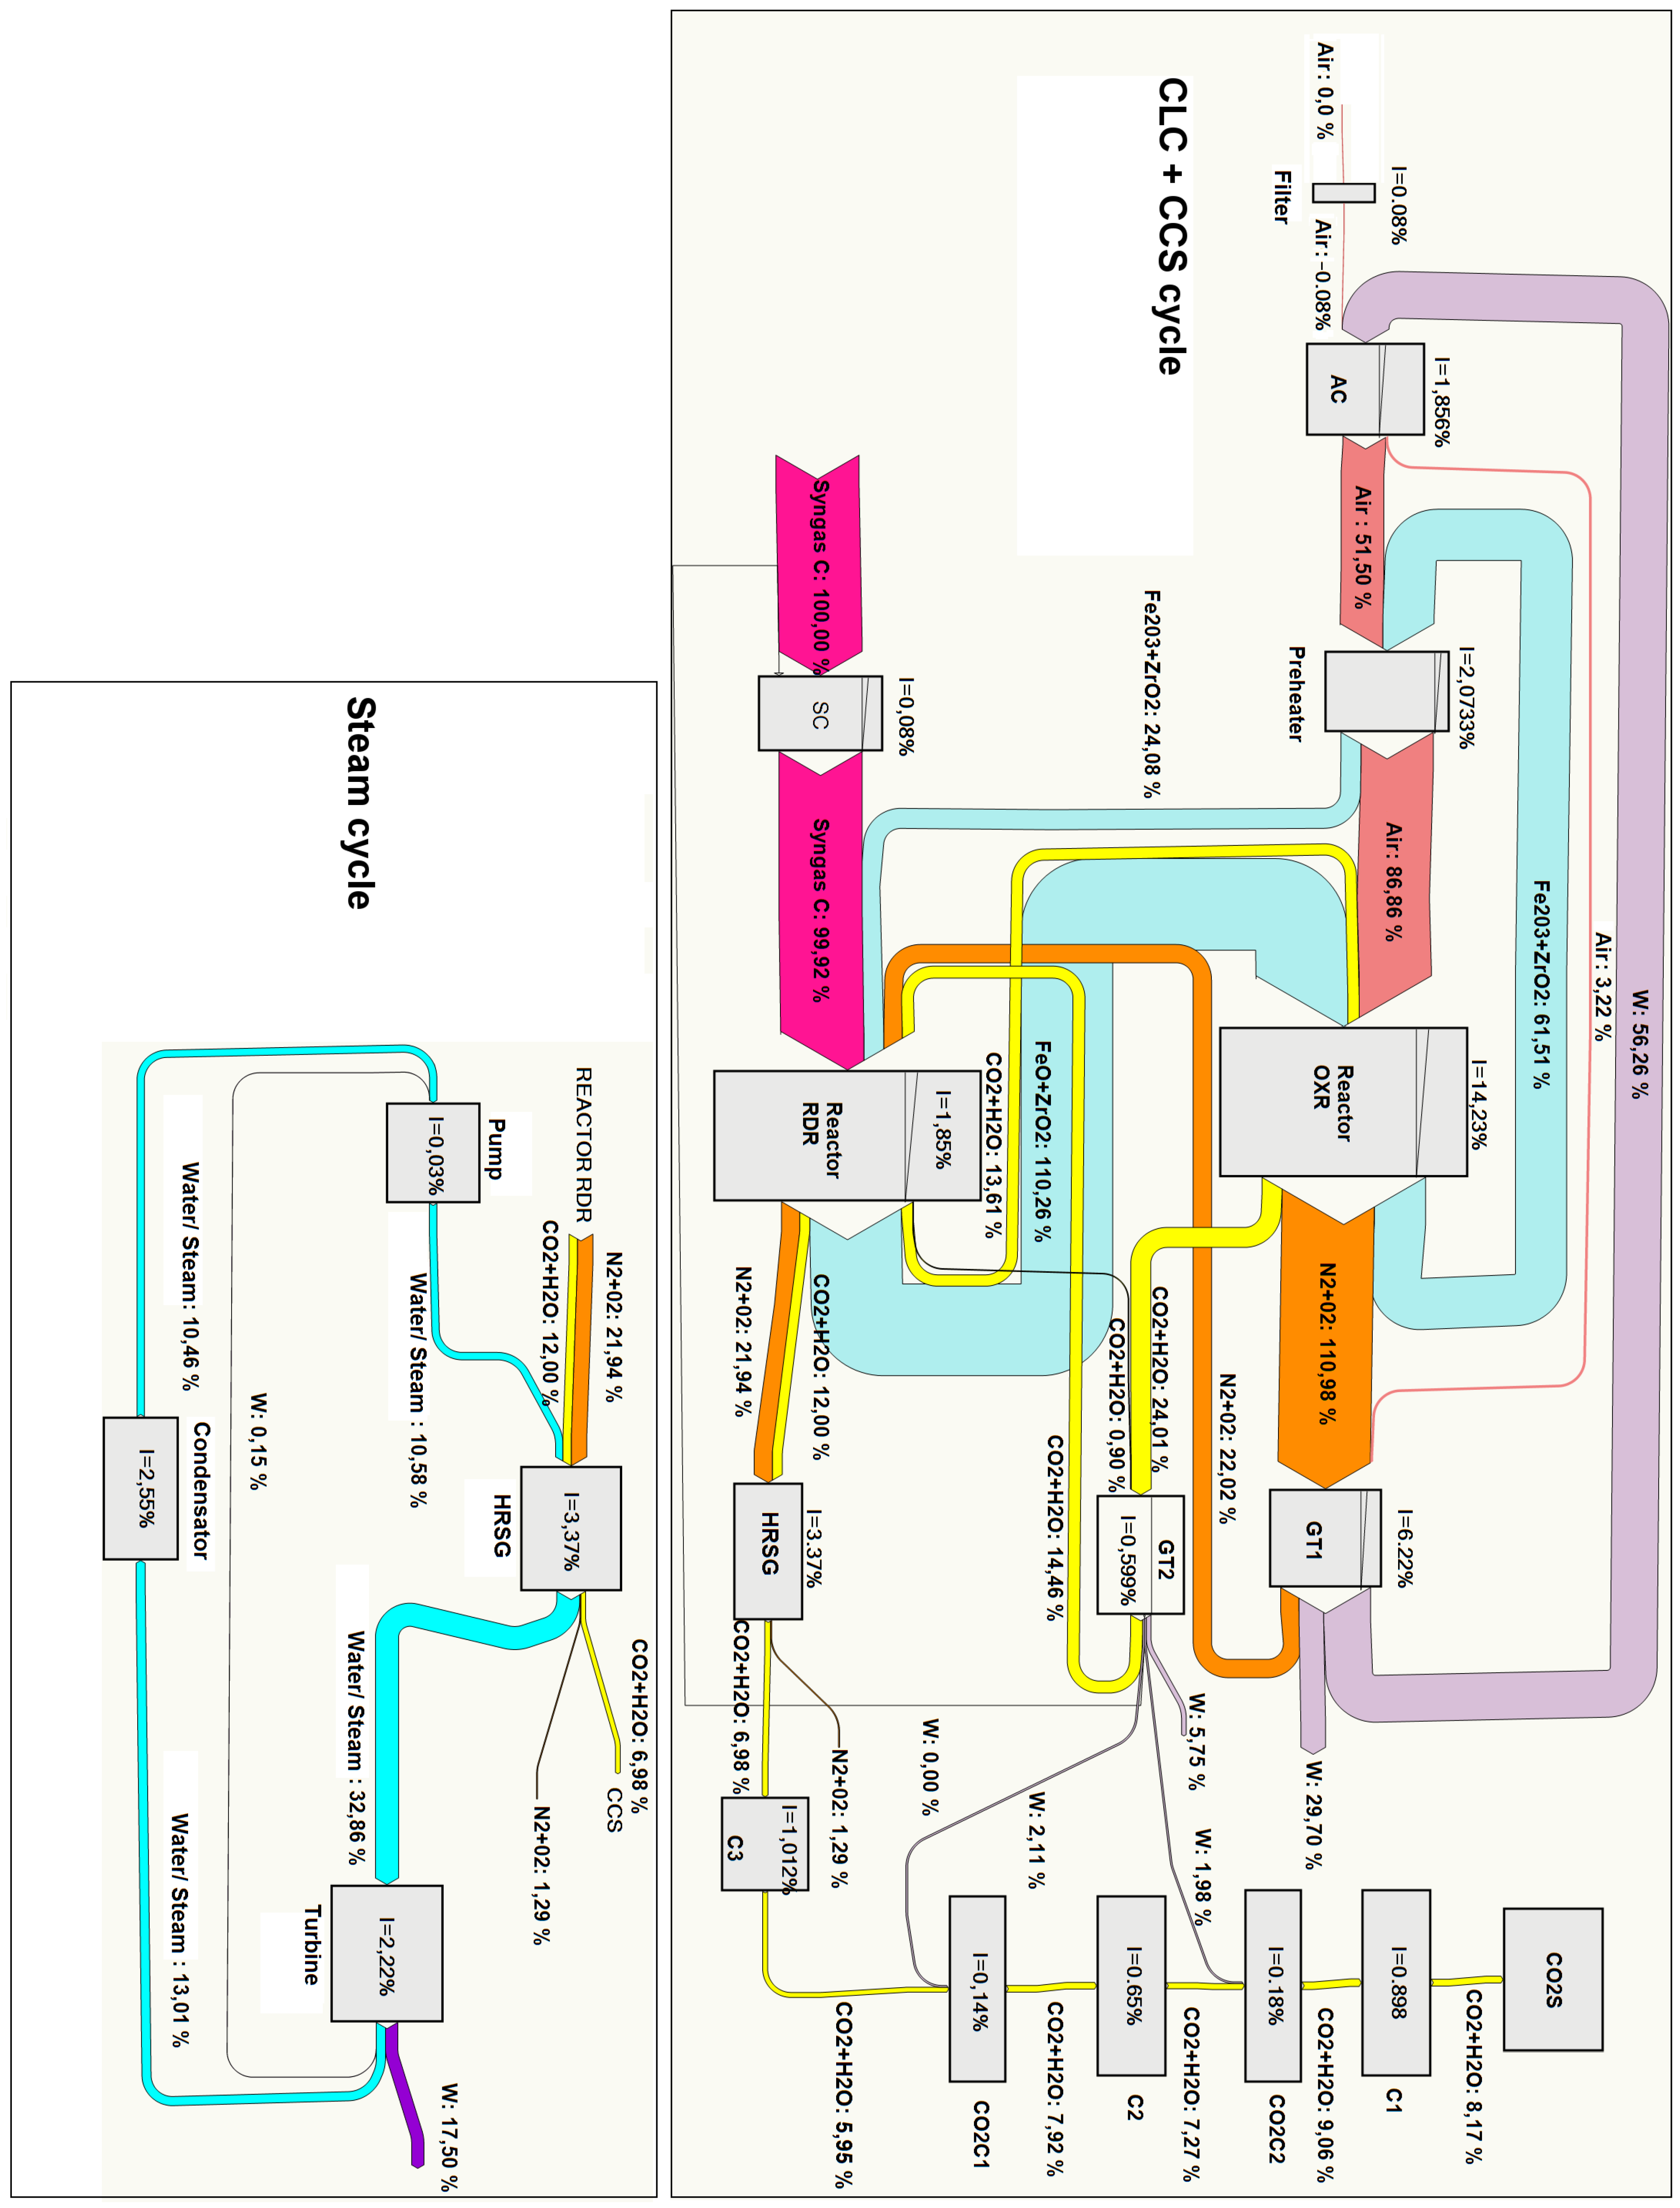
A more detailed exergy analysis is often presented in the form of a Grassmann diagram. This kind of chart reproduces the exergy flows associated with the different streams connecting the different components of the cycle. Furthermore, mechanical power input or output in every component is shown, and the exergy loss is indicated as a decrease in the exergy flow out of the component. In this way, the displayed graphical information allows one to identify easily the components with large exergy destruction. We present in Figure 15 and Figure 16 Grassmann diagrams for two cases: Syngas B and Syngas C under optimal conditions for TIT = 1550 K . With the aim of facilitating the interpretation of the figures, we remark that the exergy inputs are represented on the left side and the exergy outputs on the right side of each component.
The main differences between both cases can be summarized as follows:
  • The optimal pressure for Syngas B is 20 bar and for Syngas C is 27 bar . As mentioned previously, this is related to the fact that for Syngas B, the optimal point is reached at pressures lower than the RRHUP, and for Syngas C, the optimal point is found at higher pressures. This is reflected in higher compression power, higher flow exergy of air and oxygen carrier streams and higher power production in GT1 for the case of Syngas C.
  • The exergy destruction in the “syngas compressor” is very small for the case of Syngas C. Actually, since fuel admission pressure has been set at 27.24 bar , as a matter of fact, the “syngas compressor” is acting merely as an isenthalpic pressure loss instead of a compression in both cases represented here. However, the pressure loss is very small for the case of Syngas C (down to 27 bar ) and somewhat larger for Syngas B (down to 20 bar ).
For the steam cycle block and the CO2 sequestration module, the results are very close to each other.

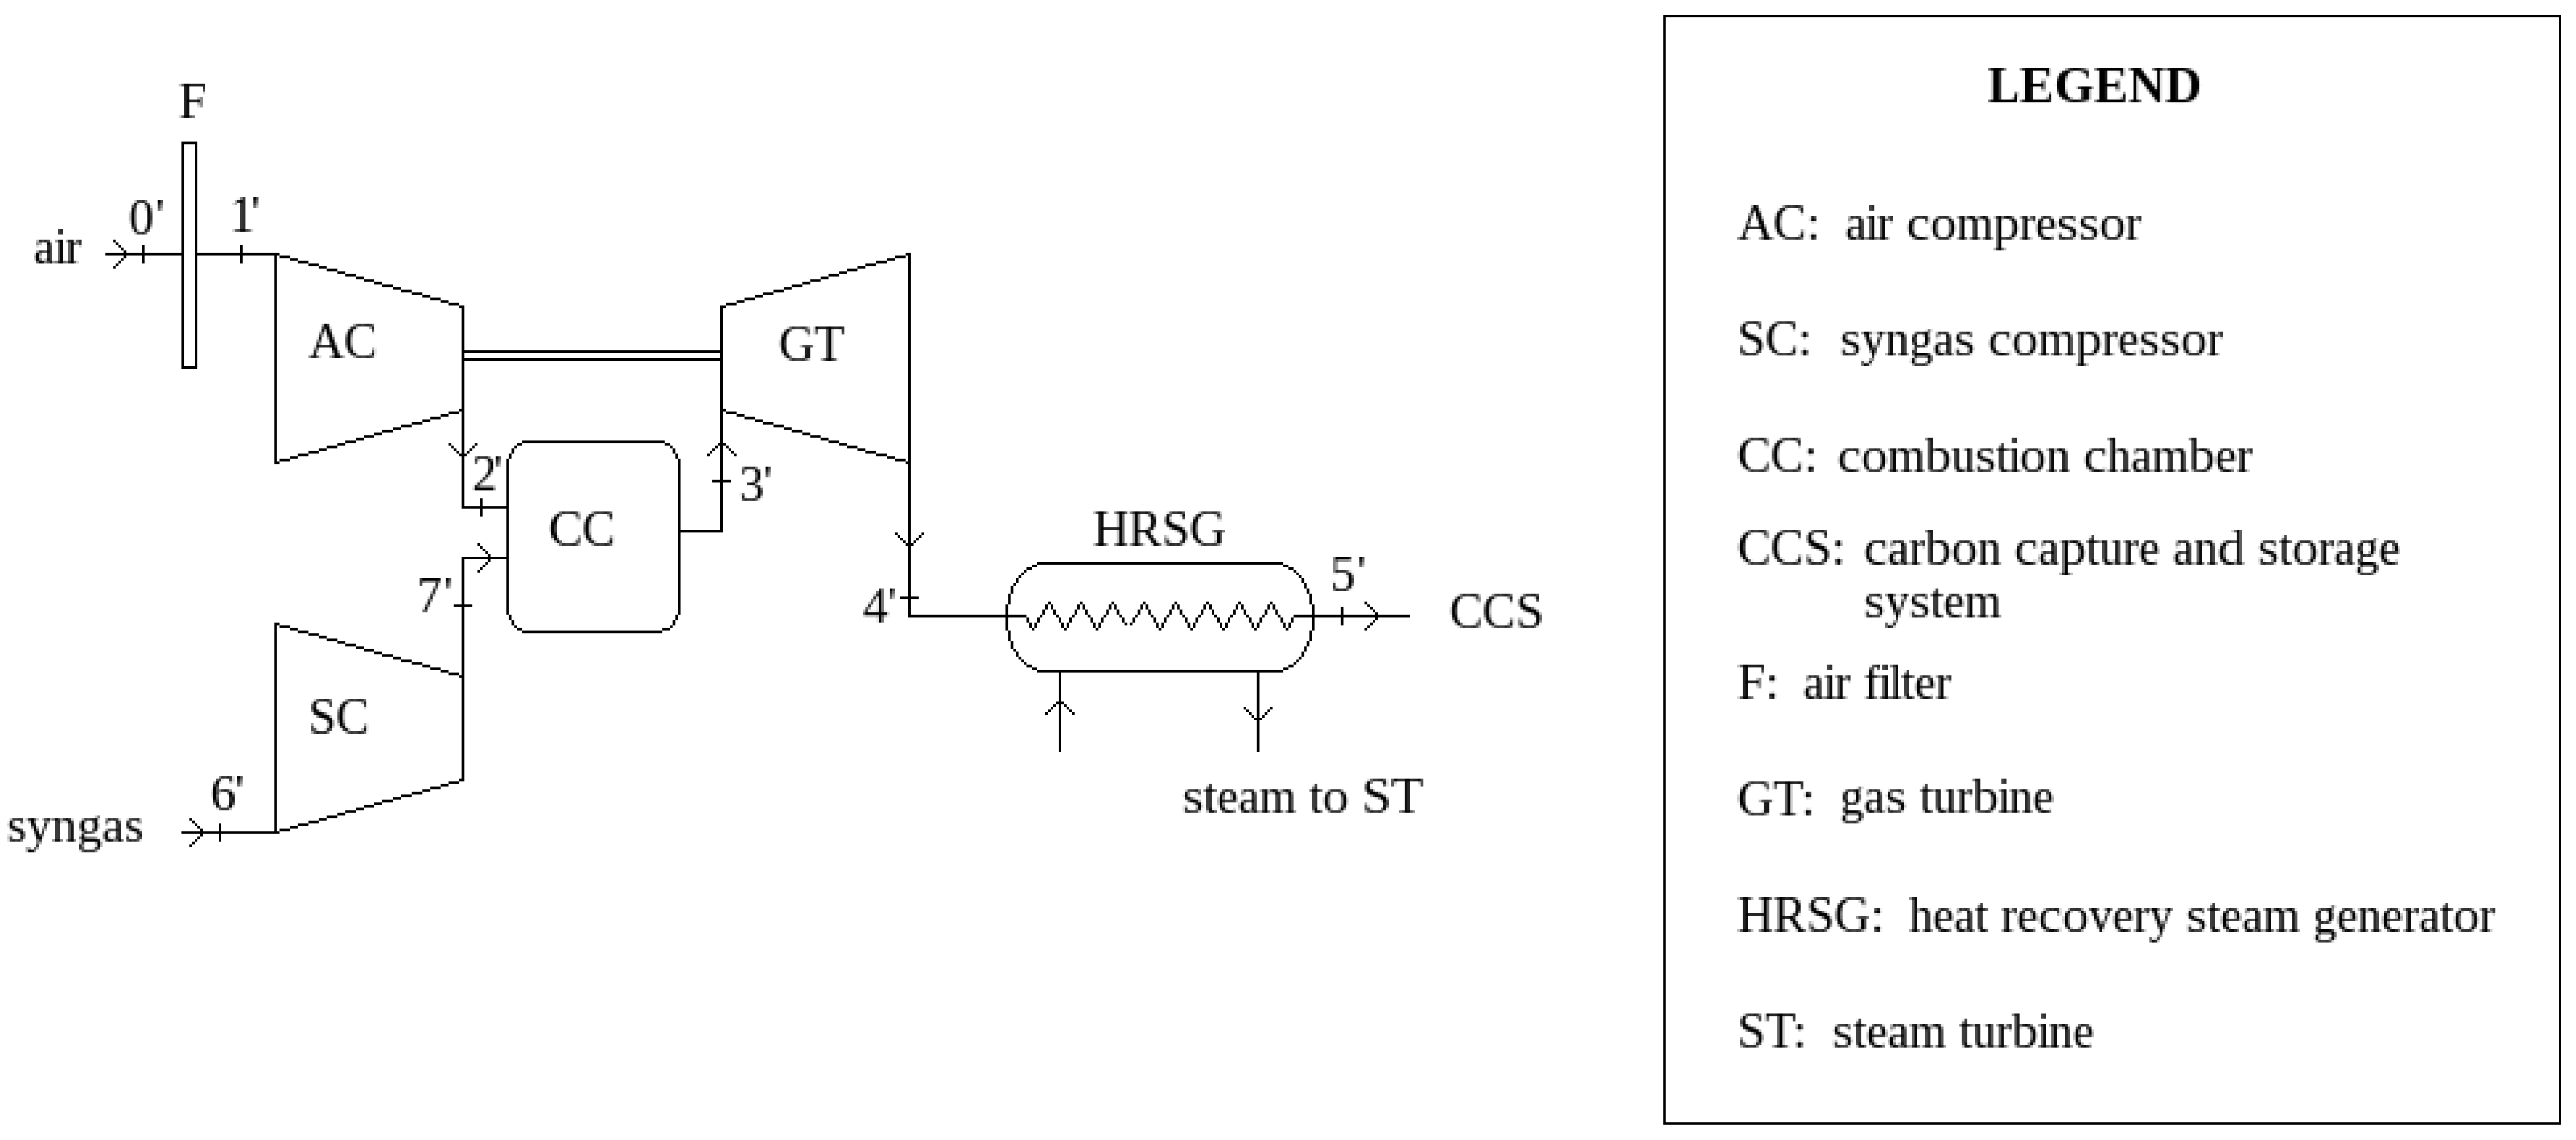
3.4. Comparison with a Conventional Gas Turbine Cycle

In order to illustrate the important differences regarding the exergetic behavior between a CLC gas turbine system and a conventional gas turbine system, we have carried out a comparison of the exergy flows of this part of the cycle. Table 5 compares the following exergy flows for a reference case of TIT = 1550 K and p r = 20 bar : the exergy flow of the exhaust gases stream before entering the HRSG, the power generated by the gas turbine block, the exergy loss in the combustion chamber and the exergy losses in the rest of the cycle, all of them given as a fraction of the fuels exergy. 
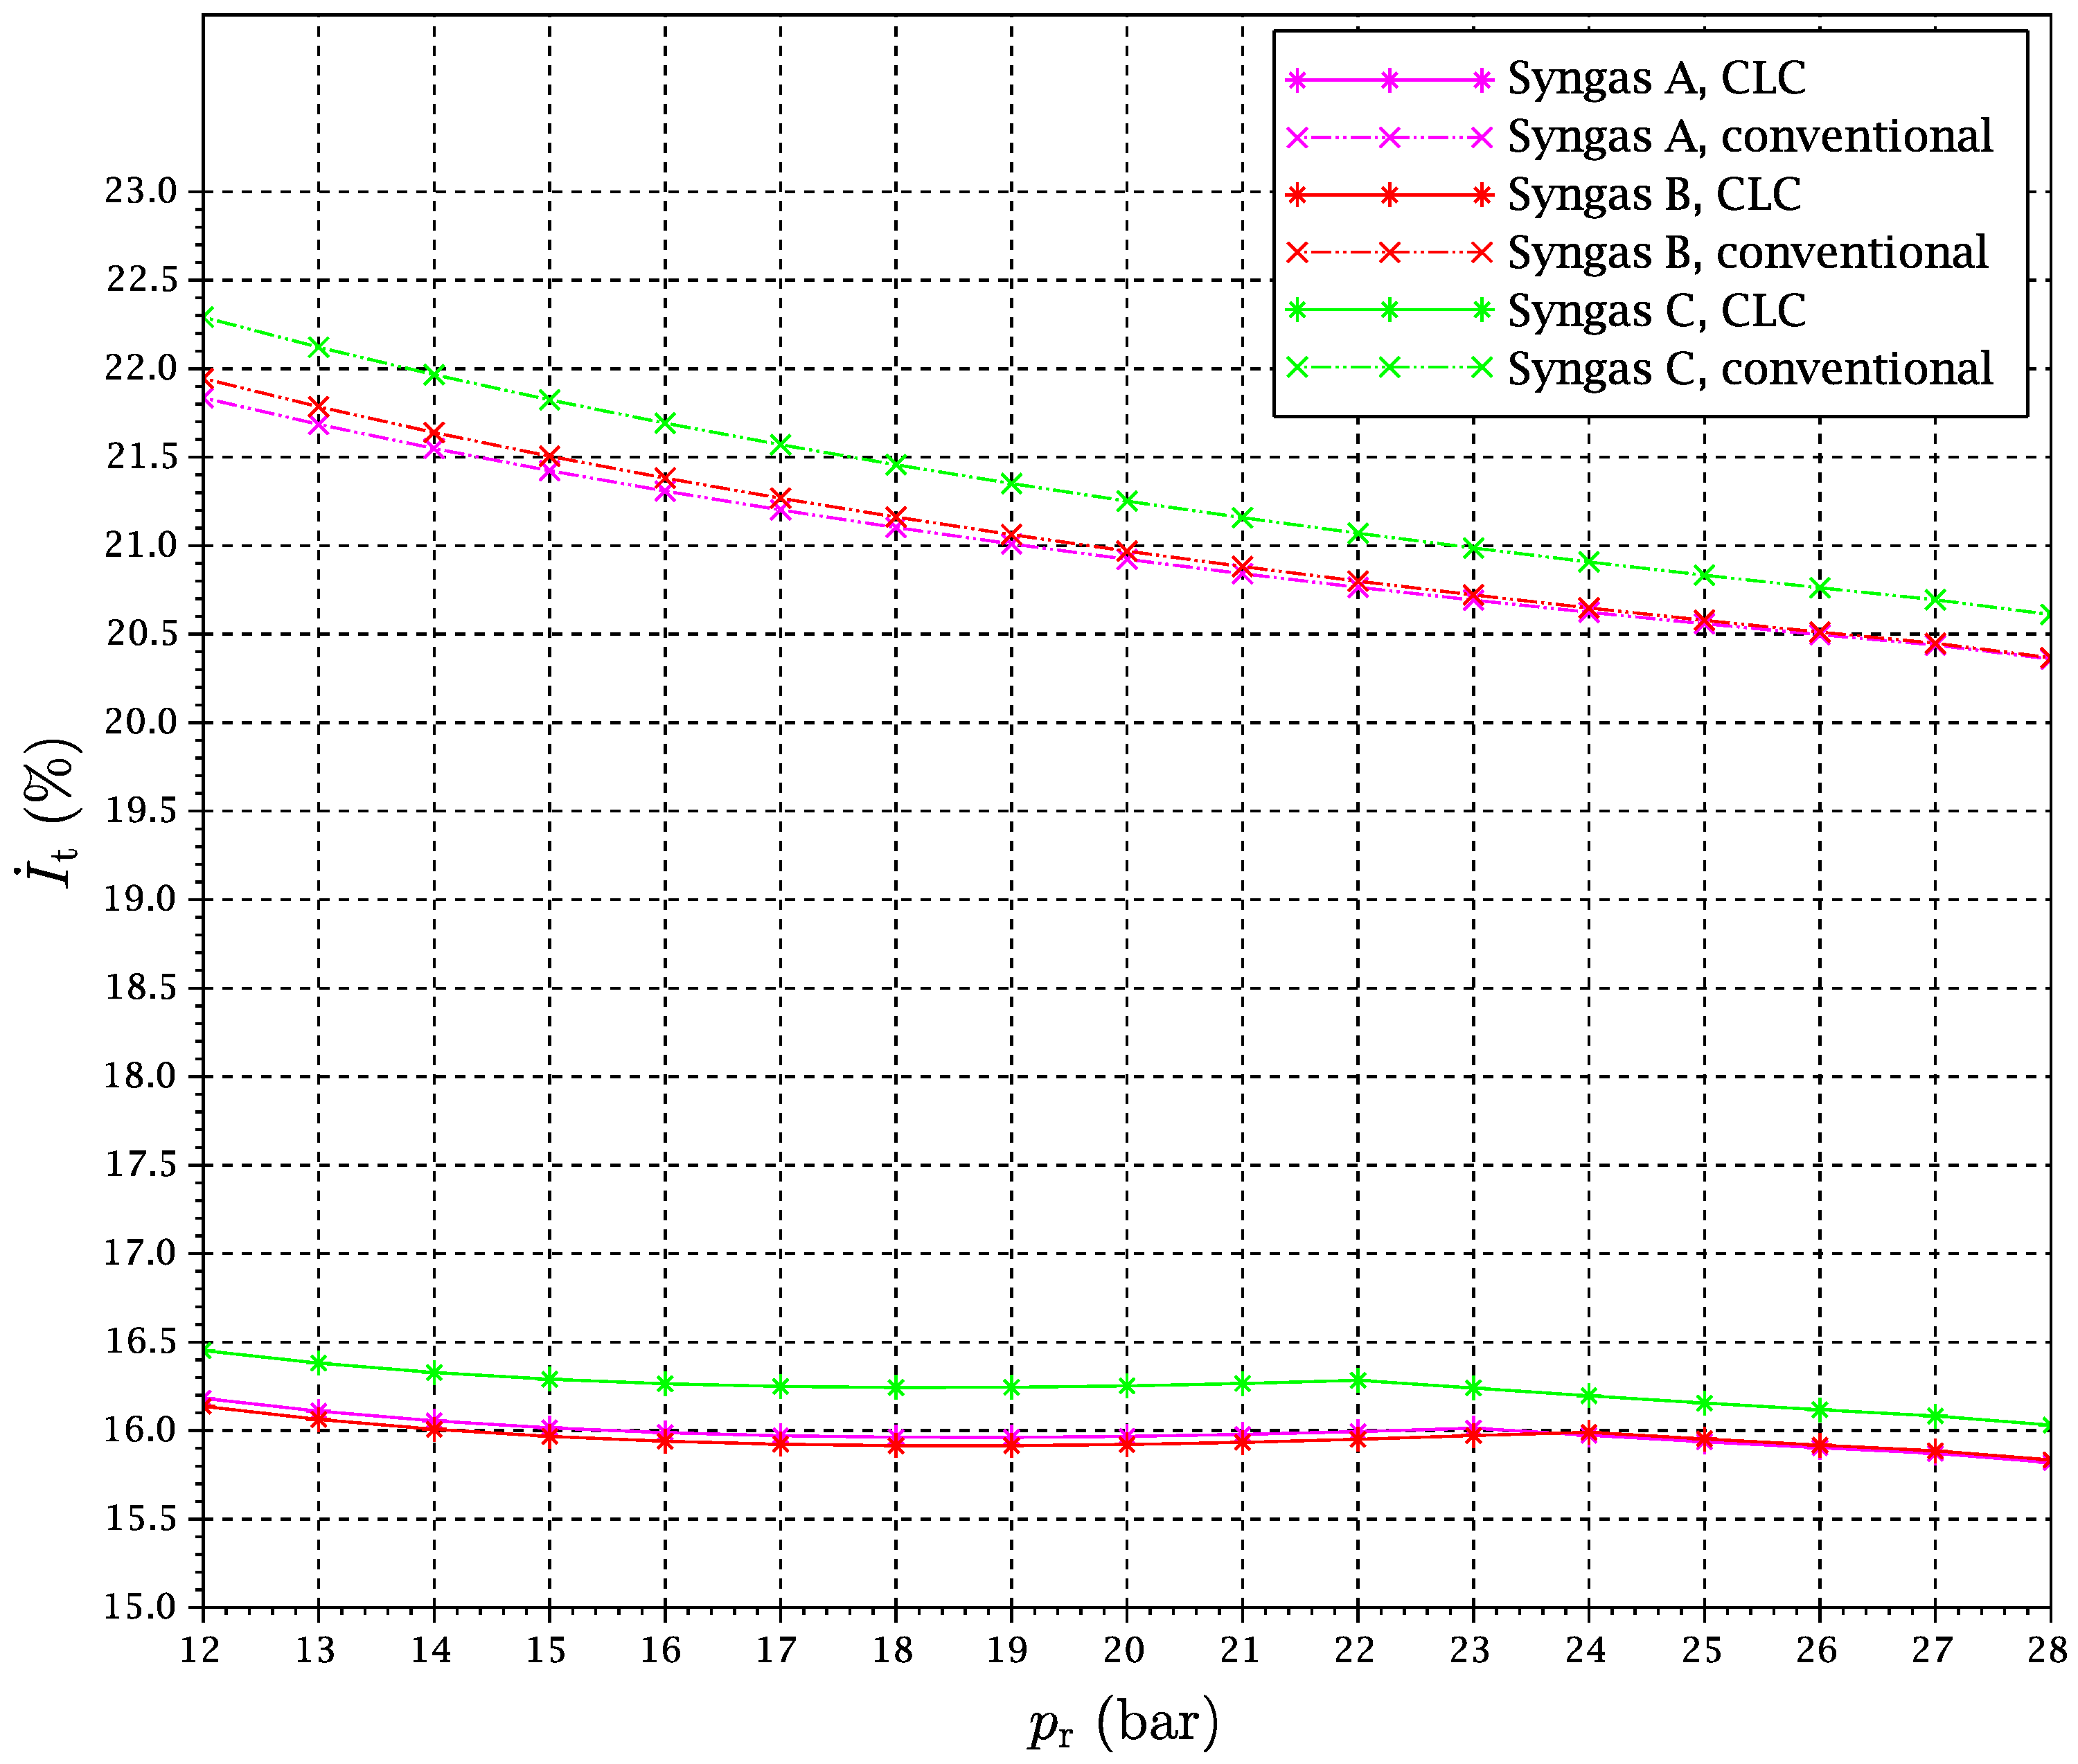
Figure 17 gives further details of the evolution of the total exergy destruction involved in combustion with the compression pressure ratio, both via CLC and conventional combustion, for TIT = 1550 K .
It can be noticed that the exergy destruction in the combustion chamber is of the order of five percentage points lower for the CLC cycle. This quantifies the “chemical heat pump” effect in terms of exergy savings. On the other hand, the additional heat and pressure losses and the exergy destruction in heat exchangers involved in the CLC case make the total exergy losses more similar when the whole gas turbine system is considered. Still, the overall exergy loss is lower and the power generated is slightly higher for the CLC cycle. In addition, more exergy is carried by the stream entering the HRSG, expecting a little more of the power to be obtained by the steam cycle. This point can be surprising at first sight, since some heat must be taken from the gas streams outgoing from the turbines in the case of the CLC system. Nevertheless, it must be kept in mind that the expansion in GT2 is carried out down to a pressure of 1.5 bar (for optimization purposes, when CO2 compression takes part; see Section 3.2) instead of to approximately the atmospheric pressure, as happens in a conventional gas turbine. Thus, the temperature of this stream is increased in relation to the conventional gas turbine. As a result, the power produced by the ensemble is a little bit larger for the CLC gas turbine system.

4. Conclusions

This work presents an exergy analysis of a combined cycle with carbon sequestration and storage on the basis of a CLC combustion system. Syngas is used as the fuel looking to investigate a possible integration with a previous gasification process. Three syngas compositions have been studied in order to determine the influence of hydrogen and carbon monoxide content on the results. The exergy input and output flows, power production and consumption and exergy losses have been quantified for the whole power plant, as well as for every component individually. A range of operating conditions have been simulated, and an optimization of the main thermodynamic parameters of the CLC cycle has been carried out. In addition, the exergy performances of gas turbine systems with conventional and CLC combustion systems have been compared with the object of giving some insight into the CLC concept from an exergetic point of view.
The following points summarize the main conclusions of the study:
  • The exergy destruction in the combustion chemical transformation with CLC is about three quarters that of the conventional combustion. Even considering the additional exergy losses that happen in the CLC case, the power produced by the gas turbine system is somewhat higher for the CLC system.
  • The exergy efficiency of a CLC gas turbine combined cycle including a carbon sequestration and storage module is very notable. Figures of about 50% are reached, including the important power consumption for CO2 compression up to the storage pressure.
  • The optimal pressure ratios from an exergetic point of view are moderate and easily attainable for modern gas turbine systems, although some differences between fuels have been found. Furthermore, a wide range of pressure ratios still gives a good performance due to the peculiar behavior of the efficiency curves.
  • Chemical equilibrium calculations confirm that the heat balance can be achieved at the reduction reactor with a high degree of the fuel oxidation ratio in a temperature range of 720–820 K.
  • The combination of some thermodynamic effects induces a peculiar tendency change of the optimal reduction temperature with the operating conditions when the so-called reduction reactor heating uncoupling point is reached. This phenomenon implies an extra power production in the CLC-based gas turbines in comparison with the expected tendency.
  • The fuel’s composition has an important role in relation to the exergy flows that take place in the CLC cycle. The influence of fuel composition is much more important in determining the optimal cycle conditions than in the case of conventional combustion, due to the complex dynamics regarding chemical equilibrium and heat flows and balances in CLC reactors.
Although at this moment, we can say that we are far from the technological maturity required for an industrial use, the results show that the CLC cycle offers great potential for efficient power generation with CO2 emissions almost nil. In a context of serious urgency to reduce greenhouse gas emissions to the atmosphere, this paper aims to contribute to the conceptual development of alternative power generation systems with high efficiency.

Acknowledgments

Álvaro Urdiales Montesino received a grant to collaborate with the research activities of the Department from the Ministry of Education, Culture and Sports, Government of Spain. The costs to publish in open source have been partially covered by the Higher Technical School of Industrial Engineering of Madrid.

Author Contributions

Álvaro Urdiales Montesino carried out a comprehensive set of numerical simulations, edited parts of the code, processed the output data from simulations and generated the plots and the Grassmann diagrams. Ángel Jiménez Álvaro conceived of and programed the code for the thermodynamic modeling of the CLC cycle and directed the simulations. Javier Rodríguez Martín and Rafael Nieto Carlier contributed to the interpretation of the results and the article redaction. All authors have read and approved the final manuscript.

Conflicts of Interest

The authors declare no conflict of interest.

Nomenclature

Δ H Standard enthalpy of formation n ˙ Molar flow rate
Δ G Standard Gibbs function of formation Q ˙ Heat flow rate
p 0 Ambient pressure J s ˙ Entropy transfer rate by heat flow
T 0 Ambient temperature W ˙ Mechanical power
p r Pressure at CLC reactors I ˙ Exergy destruction rate
T red Reduction reactor temperature I ˙ t Total exergy loss rate
hSpecific molar enthalpy E ˙ Exergy flow rate
sSpecific molar entropyxmolar fraction
gSpecific molar Gibbs function K a Chemical equilibrium constant
g M Specific mixing Gibbs functionCRConversion ratio
eFlow exergyνStoichiometric coefficient
e CH Chemical term of flow exergyμChemical potential
e PH Physical term of flow exergy η ex Exergetic efficiency

References

  1. Chiesa, P.; Consonni, S. Natural gas fired combined cycles with low CO2 emissions. J. Eng. Gas. Turbines Power 2000, 122, 429–436. [Google Scholar] [CrossRef]
  2. Urech, J.; Tock, L.; Harkin, T.; Hoadley, A.; Maréchal, F. An assessment of different solvent-based capture technologies within an IGCC–CCS power plant. Energy 2014, 64, 268–276. [Google Scholar] [CrossRef]
  3. Hagi, H.; Moullec, Y.L.; Nemer, M.; Bouallou, C. Performance assessment of first generation oxy-coal power plants through an exergy-based process integration methodology. Energy 2014, 69, 272–284. [Google Scholar] [CrossRef]
  4. Lewis, W.K.; Gilliland, E.R. Production of pure carbon dioxide. U.S. Patent 2,665,972A, 12 January 1954. [Google Scholar]
  5. Ishida, M.; Jin, H. A new advanced power-generation system using chemical-looping combustion. Energy 1994, 19, 415–422. [Google Scholar] [CrossRef]
  6. Zhang, X.; Han, W.; Hong, H.; Jin, H. A chemical intercooling gas turbine cycle with chemical-looping combustion. Energy 2009, 34, 2131–2136. [Google Scholar] [CrossRef]
  7. Anheden, M.; Svedberg, G. Exergy analysis of chemical-looping combustion systems. Energy Convers. Manag. 1998, 39, 1967–1980. [Google Scholar] [CrossRef]
  8. Anheden, M. Analysis of Gas Turbine Systems for Sustainable Energy Conversion. Ph.D. Thesis, Royal Institute of Technology, Stockholm, Sweden, 2000. [Google Scholar]
  9. Álvaro, Á.J.; Paniagua, I.L.; Fernández, C.G.; Carlier, R.N.; Martín, J.R. Energetic analysis of a syngas-fueled chemical-looping combustion combined cycle with integration of carbon dioxide sequestration. Energy 2014, 76, 694–703. [Google Scholar] [CrossRef]
  10. Richter, H.J.; Knocke, K.F. Reversibility of combustion processes. In Efficiency and Costing; American Chemical Society: Washington, DC, USA, 1983; pp. 71–86. [Google Scholar]
  11. Zheng, D.; Jing, X. Chemical amplifier and energy utilization principles of heat conversion cycle systems. Energy 2013, 63, 180–188. [Google Scholar] [CrossRef]
  12. Ishida, M.; Jin, H. A novel chemical-looping combustor without NOx formation. Ind. Eng. Chem. Res. 1996, 35, 2469–2472. [Google Scholar] [CrossRef]
  13. Consonni, S.; Lozza, G.; Pelliccia, G.; Rossini, S.; Saviano, F. Chemical-looping combustion for combined cycles with CO2 capture. J. Eng. Gas. Turbines Power 2006, 128, 525–534. [Google Scholar] [CrossRef]
  14. Nieto, R.; González, C.; López, I.; Jiménez, Á. Efficiency of a standard gas-turbine power generation cycle running on different fuels. Int. J. Exergy 2011, 9, 112–126. [Google Scholar] [CrossRef]
  15. Mínguez, M.; Jiménez, Á.; Rodríguez, J.; González, C.; López, I.; Nieto, R. Analysis of energetic and exergetic efficiency, and environmental benefits of biomass integrated gasification combined cycle technology. Waste Manag. Res. 2013, 31, 401–412. [Google Scholar] [CrossRef] [PubMed]
  16. Kotas, T.J. The Exergy Method of Thermal Plant Analysis; Butterworths: London, UK, 1985. [Google Scholar]
  17. Escudero, M.; Jiménez, Á.; González, C.; Nieto, R.; López, I. Analysis of the behavior of biofuel-fired gas turbine power plants. Therm. Sci. 2012, 16, 849–864. [Google Scholar] [CrossRef]
  18. Search for Species Data by Chemical Formula. Available online: http://webbook.nist.gov/chemistry/form-ser.html (accessed on 17 August 2016).
  19. Daubert, T.E.; Danner, R.P. Physical and Thermodynamic Properties of Pure Chemicals: Data Compilation; Hemisphere Publishing: New York, NY, USA, 1989. [Google Scholar]
Figure 1. Schematic diagram of the CLC concept.
Entropy 18 00314 g001
Figure 2. Representation of a combined cycle power plant with CLC and CO2 sequestration and storage.
Entropy 18 00314 g002
Figure 3. Conventional Brayton-steam combined cycle for power generation.
Entropy 18 00314 g003
Figure 4. Conversion ratios of H2 and CO at 15 bar as a function of temperature.
Entropy 18 00314 g004
Figure 5. Exergy efficiency of CLC cycle for Syngas A as fuel.
Entropy 18 00314 g005
Figure 6. Exergy efficiency of CLC cycle for Syngas B as fuel.
Entropy 18 00314 g006
Figure 7. Exergy efficiency of CLC cycle for Syngas C as fuel.
Entropy 18 00314 g007
Figure 8. Optimal reduction temperature for Syngas A as fuel.
Entropy 18 00314 g008
Figure 9. Optimal reduction temperature for Syngas B as fuel.
Entropy 18 00314 g009
Figure 10. Optimal reduction temperature for Syngas C as fuel.
Entropy 18 00314 g010
Figure 11. Exergy balances of the CLC cycle with CO2 sequestration.
Entropy 18 00314 g011
Figure 12. Total exergy loss in the CLC cycle for TIT = 1550 K .
Entropy 18 00314 g012
Figure 13. Power generated by gas turbines in the CLC cycle for TIT = 1550 K .
Entropy 18 00314 g013
Figure 14. Power generated by steam turbine in the CLC cycle for TIT = 1550 K .
Entropy 18 00314 g014
Figure 15. Grassmann diagram for Syngas B. TIT = 1550 K , p r = 20 bar , T red = 776 K .
Entropy 18 00314 g015
Figure 16. Grassmann diagram for Syngas C. TIT = 1550 K , p r = 27 bar , T red = 814 K .
Entropy 18 00314 g016
Figure 17. Comparison of the total exergy loss in the combustion reaction. TIT = 1550 K .
Entropy 18 00314 g017
Table 1. Composition (molar fraction), LHV and chemical exergy of the fuels under study.
FuelSubstrateCOH2CO2N2ArH2OLHV e CH
(%)(%)(%)(%)(%)(%)(kJ/mol)(kJ/mol)
Syngas AWood waste 46.90 26.02 18.45 8.09 0.52 0.02 195.64 200.70
Syngas BMiscanthus 45.84 35.46 11.28 7.12 0.28 0.02 215.47 219.00
Syngas CPittsburgh n8 63.77 29.65 4.25 1.78 0.53 0.02 252.16 253.81
Table 2. Optimal conditions and maximal exergy efficiencies.
TIT (K)Syngas ASyngas BSyngas C
p r opt T red opt η ex max p r opt T red opt η ex max p r opt T red opt η ex max
(bar)(K)(%)(bar)(K)(%)(bar)(K)(%)
140022747.948.5516728.249.8622762.050.16
145024766.549.5418742.950.8423775.751.15
150026784.950.4719759.551.7625795.152.08
155027798.151.3320775.952.6327813.852.95
160027806.452.1122791.053.4527821.153.74
Table 3. Thermodynamic conditions of the fully-optimized CLC cycle. Syngas C and TIT = 1550 K .
Stream n ˙ Tp x N 2 x O 2 x Ar x CO 2 x H 2 O x CO x H 2
(mol/s)(K)(bar)(%)(%)(%)(%)(%)(%)(%)
09.424288.21.01377.25720.7780.9260.0301.0100.0000.000
19.424288.11.00377.25720.7780.9260.0301.0100.0000.000
28.839800.027.27077.25720.7780.9260.0301.0100.0000.000
38.8391229.627.00077.25720.7780.9260.0301.0100.0000.000
48.3741550.025.92081.54616.3800.9770.0311.0660.0000.000
58.959763.61.05981.26616.6670.9740.0311.0620.0000.000
68.959763.61.04981.26616.6670.9740.0311.0620.0000.000
78.959363.21.01381.26616.6670.9740.0311.0620.0000.000
81.000426.627.2441.7800.0000.5304.2500.02063.77029.650
91.000426.827.0001.7800.0000.5304.2500.02063.77029.650
100.938813.825.9201.7800.0000.53067.85529.3990.1650.271
110.9381540.025.6611.7800.0000.53067.85529.3990.1650.271
121.0001010.91.5151.7800.0000.53067.85529.3990.1650.271
131.000823.81.5001.7800.0000.53067.85529.3990.1650.271
141.000363.21.4481.7800.0000.53067.85529.3990.1650.271
150.722298.21.4482.4660.0000.73494.0062.1900.2290.376
160.722484.511.0922.4660.0000.73494.0062.1900.2290.376
170.708298.211.0922.5140.0000.74995.8360.2860.2330.383
180.708491.785.0002.5140.0000.74995.8360.2860.2330.383
190.706298.285.0002.5200.0000.75096.0750.0370.2340.384
201.432 1 850.027.000-------
212.362 2 813.827.000-------
221.432 1 1550.027.000-------
232.254743.667.0000.0000.0000.0000.000100.0000.0000.000
242.254312.20.0700.0000.0000.0000.000100.0000.0000.000
252.254312.20.0700.0000.0000.0000.000100.0000.0000.000
262.254312.876.0000.0000.0000.0000.000100.0000.0000.000
1: 0.930 mol/s of Fe2O3 plus 0.502 of ZrO2; 2: 1.860 mol/s of FeO plus 0.502 of ZrO2.
Table 4. Exergy balances of the whole CLC cycle for TIT = 1550 K and optimal conditions.
Fuel E ˙ CO 2 E ˙ exhaust W ˙ GT W ˙ ST W ˙ CO 2 I ˙ t
(%)(%)(%)(%)(%)(%)
Syngas A10.071.2039.8216.99 5.49 37.41
Syngas B8.251.2039.5417.49 4.40 37.92
Syngas C8.171.2939.5417.50 4.09 37.59
Table 5. Comparison between exergy flows of CLC and conventional gas turbine systems. TIT = 1550 K , p r = 20 bar .
FuelCombustion Type E ˙ HRSG W ˙ GT I ˙ t comb I ˙ t rest I ˙ t all
(%)(%)(%)(%)(%)
Syngas ACLC35.1539.2615.979.6225.59
conventional33.6038.6020.926.8827.80
Syngas BCLC34.6239.5315.929.9325.85
conventional33.2438.7320.977.0628.03
Syngas CCLC34.8438.8916.2510.0226.27
conventional33.0938.8020.987.1328.11

