Article

Distribution Entropy Boosted VLAD for Image Retrieval

1
State Key Laboratory of Automotive Simulation and Control, Jilin University, Changchun 130022, China
2
College of Communication Engineering, Jilin University, Changchun 130012, China
3
College of Instrumentation and Electrical Engineering, Jilin University, Changchun 130061, China
4
College of Computer Science and Technology, Jilin University, Changchun 130012, China
5
Key Laboratory of Symbolic Computation and Knowledge Engineering of Ministry of Education, Jilin University, Changchun 130012, China
6
School of Mechanical Science and Engineering, Jilin University, Changchun 130025, China
*
Author to whom correspondence should be addressed.
Entropy 2016, 18(8), 311; https://doi.org/10.3390/e18080311
Submission received: 26 February 2016 / Revised: 12 July 2016 / Accepted: 16 August 2016 / Published: 24 August 2016

Abstract

:
Several recent works have shown that aggregating local descriptors to generate global image representation results in great efficiency for retrieval and classification tasks. The most popular method following this approach is VLAD (Vector of Locally Aggregated Descriptors). We present a novel image presentation called Distribution Entropy Boosted VLAD (EVLAD), which extends the original vector of locally aggregated descriptors. The original VLAD adopts only residuals to depict the distribution information of every visual word and neglects other statistical clues, so its discriminative power is limited. To address this issue, this paper proposes the use of the distribution entropy of each cluster as supplementary information to enhance the search accuracy. To fuse two feature sources organically, two fusion methods after a new normalization stage meeting power law are also investigated, which generate identically sized and double-sized vectors as the original VLAD. We validate our approach in image retrieval and image classification experiments. Experimental results demonstrate the effectiveness of our algorithm.

1. Introduction

In recent decades, with the development of the Internet and mobile computing platforms, huge amounts of digital images and videos have emerged every day, leading to many large visual databases. How to search for similar results to a query image in these large databases with high search accuracy, high efficiency and low memory usage is the main challenge in the image retrieval research field.
To search for images in a large database and obtain candidates of the same object or location, most of which include occlusions and clutter, the first issue is how to represent the images, which leads to the image feature problem. Image features depict the information contained in the image; an ideal image feature should have a high degree of robustness and distinctiveness. This means that the feature should be as stable as possible if the visual content is generated from the same object or scene. In contrast, different visual content should produce distinguishable features, regardless of how similar their appearances might be. Under this constraint, local invariant features, such as SIFT (Scale Invariant Feature Transform) [1], SURF (Speeded Up Robust Features) [2], ORB (ORiented Brief) [3], and FREAK (Fast Retina KeyPoint) [4], which are distinctive and robust in many visual transformations, are widely adopted in applications such as object recognition [5] and location recognition [6].
There are three constraints to be considered in large-scale image retrieval applications: search accuracy, efficiency and memory usage [7]. If local invariant features are the only image representation, because the number of local features inside a single image could be huge (greater than 1000), cross matching these local features between the query and the database could lead to long computation time. As a result, local features may not always provide effective representation in large-scale image retrieval. A reasonable solution is to build global representation based on local features. Bag of Words (BoW) is the most widely adopted global representation for this purpose [8]. BoW builds a high-dimensional sparse histogram as a global feature for an image. There are three reasons for the success of BoW [9] representations: they are based on local invariant features, they can be compared with standard distances, and they can rely on an inverted list to boost their retrieval efficiency. Nevertheless, BoW has some drawbacks [10]. One of the most critical is the tradeoff between quantization error and search accuracy. In a quantization-based method, high search accuracy relies on a huge vocabulary to reduce the quantization error and improve the distinctiveness of the global features. However, this might result in high-dimensional sparse vectors. Although the inverted index mechanism [8] and hierarchical clustering methods, such as vocabulary tree [5], can improve memory usage and index efficiency, the encoding consumption cannot be improved effectively. Recently, MDPV (Metric Distance Permutation Vocabulary) uses permutations of metric distances to create compact visual words to attain time and space efficiency of vocabulary construction [11]. Moreover, BoW adopts a simple counting method for each cluster to build the final representation. It fails to depict the elaborate details of each cluster, and it loses the distinctiveness of the original local features after the clustering step. Therefore, geometric verification is always leveraged as a post-processing step after BoW search to further improve the search accuracy [6].
There are other global vector generation schemes that share a similar working flow to BoW, such as Vector quantization [8], sparse coding [12], soft assignment [13], and locality-constrained linear coding [14]. Based on sets of local descriptors, e.g., a codebook or dictionary is trained from a training set. With this dictionary, the set of local features of each image is encoded to new vectors and finally aggregated into a global vector. Some studies have shown that aggregated vector-based encoding methods provide excellent performance in visual recognition [7,8,12,14,15]. These image representations are also produced from local features, yet by relying on a small codebook, they utilize an alternative aggregation stage to replace the BoW histogram. Their main merit is that they can be reduced to very compact vectors by dimension reduction while preserving high search accuracy. Moreover, small codebooks greatly reduce encoding time and provide another possibility to embed codebooks into mobile ends to generate global representation.
Among these aggregated vector encoding methods, VLAD (Vector of Locally Aggregated Descriptors) [7] is a type of efficient encoding method. First, a training set is employed to generate a codebook by the K-means algorithm. Each local feature is assigned to its closest visual word. Unlike BoW, which simply counts the features assigned to each word, VLAD accumulates the residual vectors of all local features assigned to the same visual word. The final VLAD vector is generated by concatenating all residual vectors of the whole codebook. VLAD can be efficiently computed, and its effectiveness has been demonstrated in several tasks, such as instance retrieval [16], scene recognition [17], and action recognition [3].
However, there are two crucial issues to be tackled:
(1)
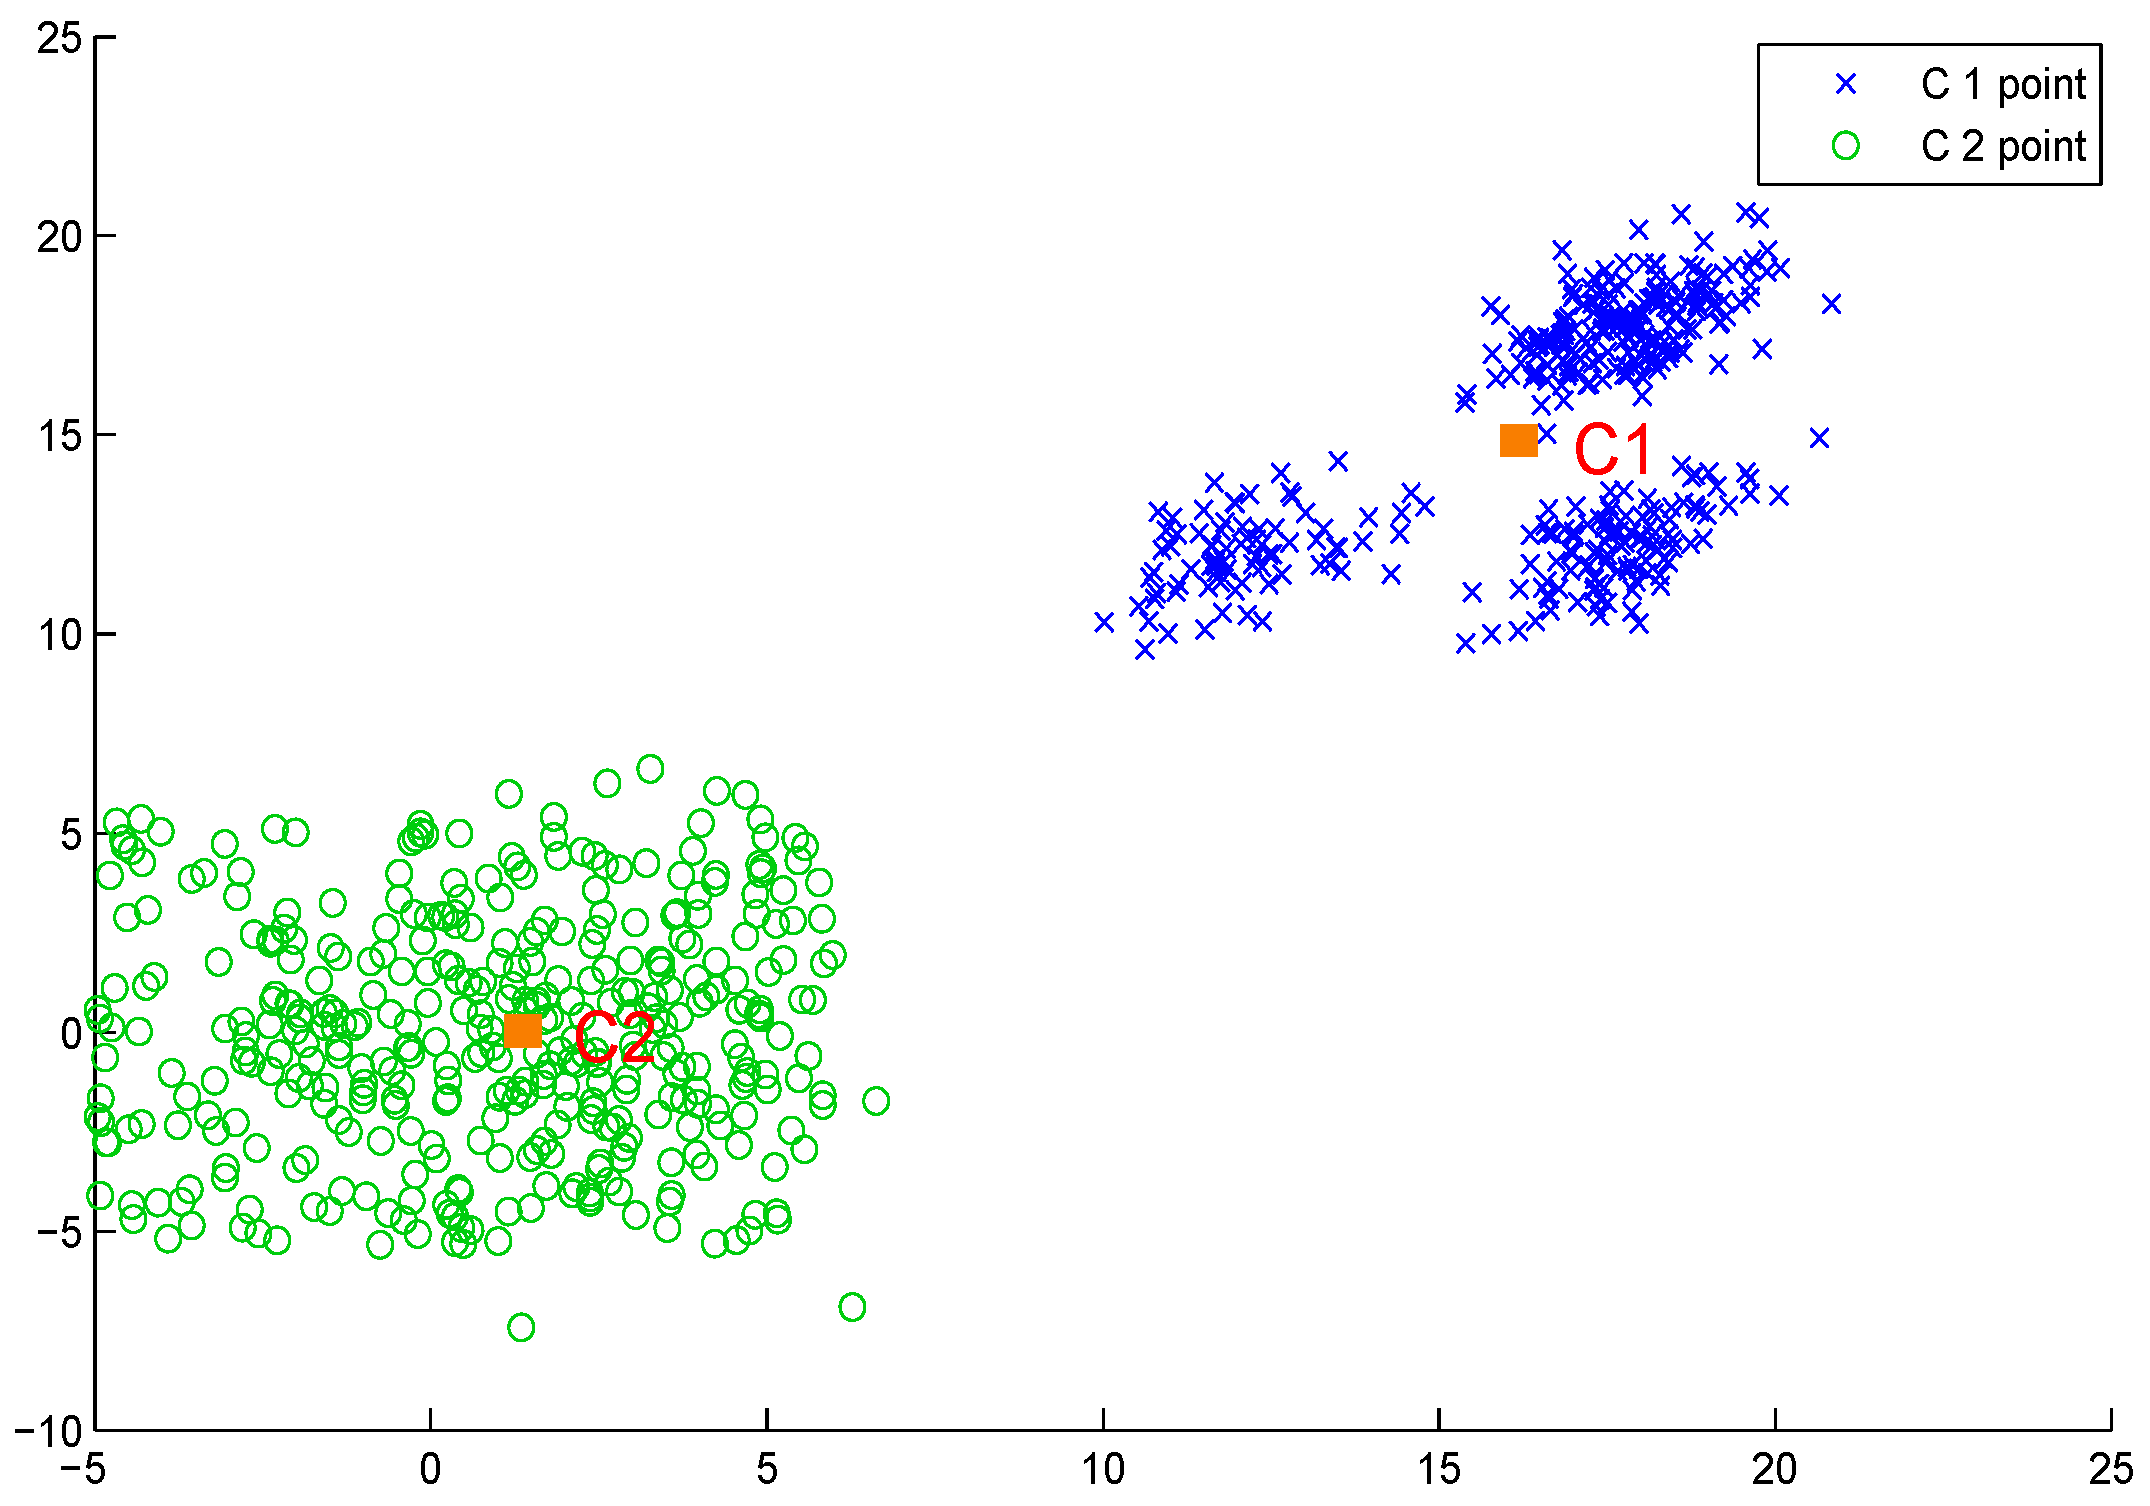
VLAD converts the feature description from a local image patch to a cluster. However, residuals can provide only partial cluster distribution information. As shown in Figure 1, the two clusters share identical residual vectors, whereas it can be clearly found that clusters’ dispersion degrees differ significantly. More statistical information must be introduced to provide a more discriminatory representation.
(2)
When facing the large-scale image database retrieval task, search time and memory consumption must be considered. An obvious advantage of aggregation-based image representations, such as VLAD or Fisher Vector, is that they use only a small vocabulary but achieve a great performance improvement. Furthermore, for web-scale search applications, a small vocabulary has a good advantage in terms of search time and memory usage. However, this could introduce a large quantization error during the encoding step and reduce the distinctiveness of the final VLAD.
In this paper, we aim to boost the aggregated vector with more detailed distribution information for every cluster. To this end, we utilize distribution entropy as the main method. As we know, in the information processing field, entropy can describe the dispersion degree. As shown in Figure 1, we adopt distribution entropy as a complementary clue to the original residual vector to build a more thorough descriptor of each cluster. In this manner, even for those clusters sharing similar residual vectors, as in C1 and C2 in Figure 1, the entropy part can still differentiate them.
We initially focus on employing distribution entropy inside each single cluster to boost the original VLAD. The distribution entropy vector is then generated in each cluster. We investigate the effective fusion mechanism to combine the entropy vector and residual vector. We propose compact fusion and extended fusion, which fuse these two vectors in each cluster or in the full representation accordingly. We evaluate these two fused patterns in experiments, and the results indicate that extended fusion generating the double length representations could always attain a better mAP, whereas compact fusion that builds the same size vector as the original VLAD provides lower memory cost and a moderate performance improvement.
Subsequently, we aim to further improve the performance of the distribution entropy boosted vector. Although there are many add-ons to improve the original VLAD, to the best of our knowledge, there is no method that adopts distribution entropy as a complementary clue. However, entropy boosted VLAD can be easily used in those improved VLAD algorithms. We apply these improvements to the entropy-boosted VLAD vector and evaluate their performance. Finally, we choose appropriate add-ons to improve the performance of the entropy boosted VLAD.
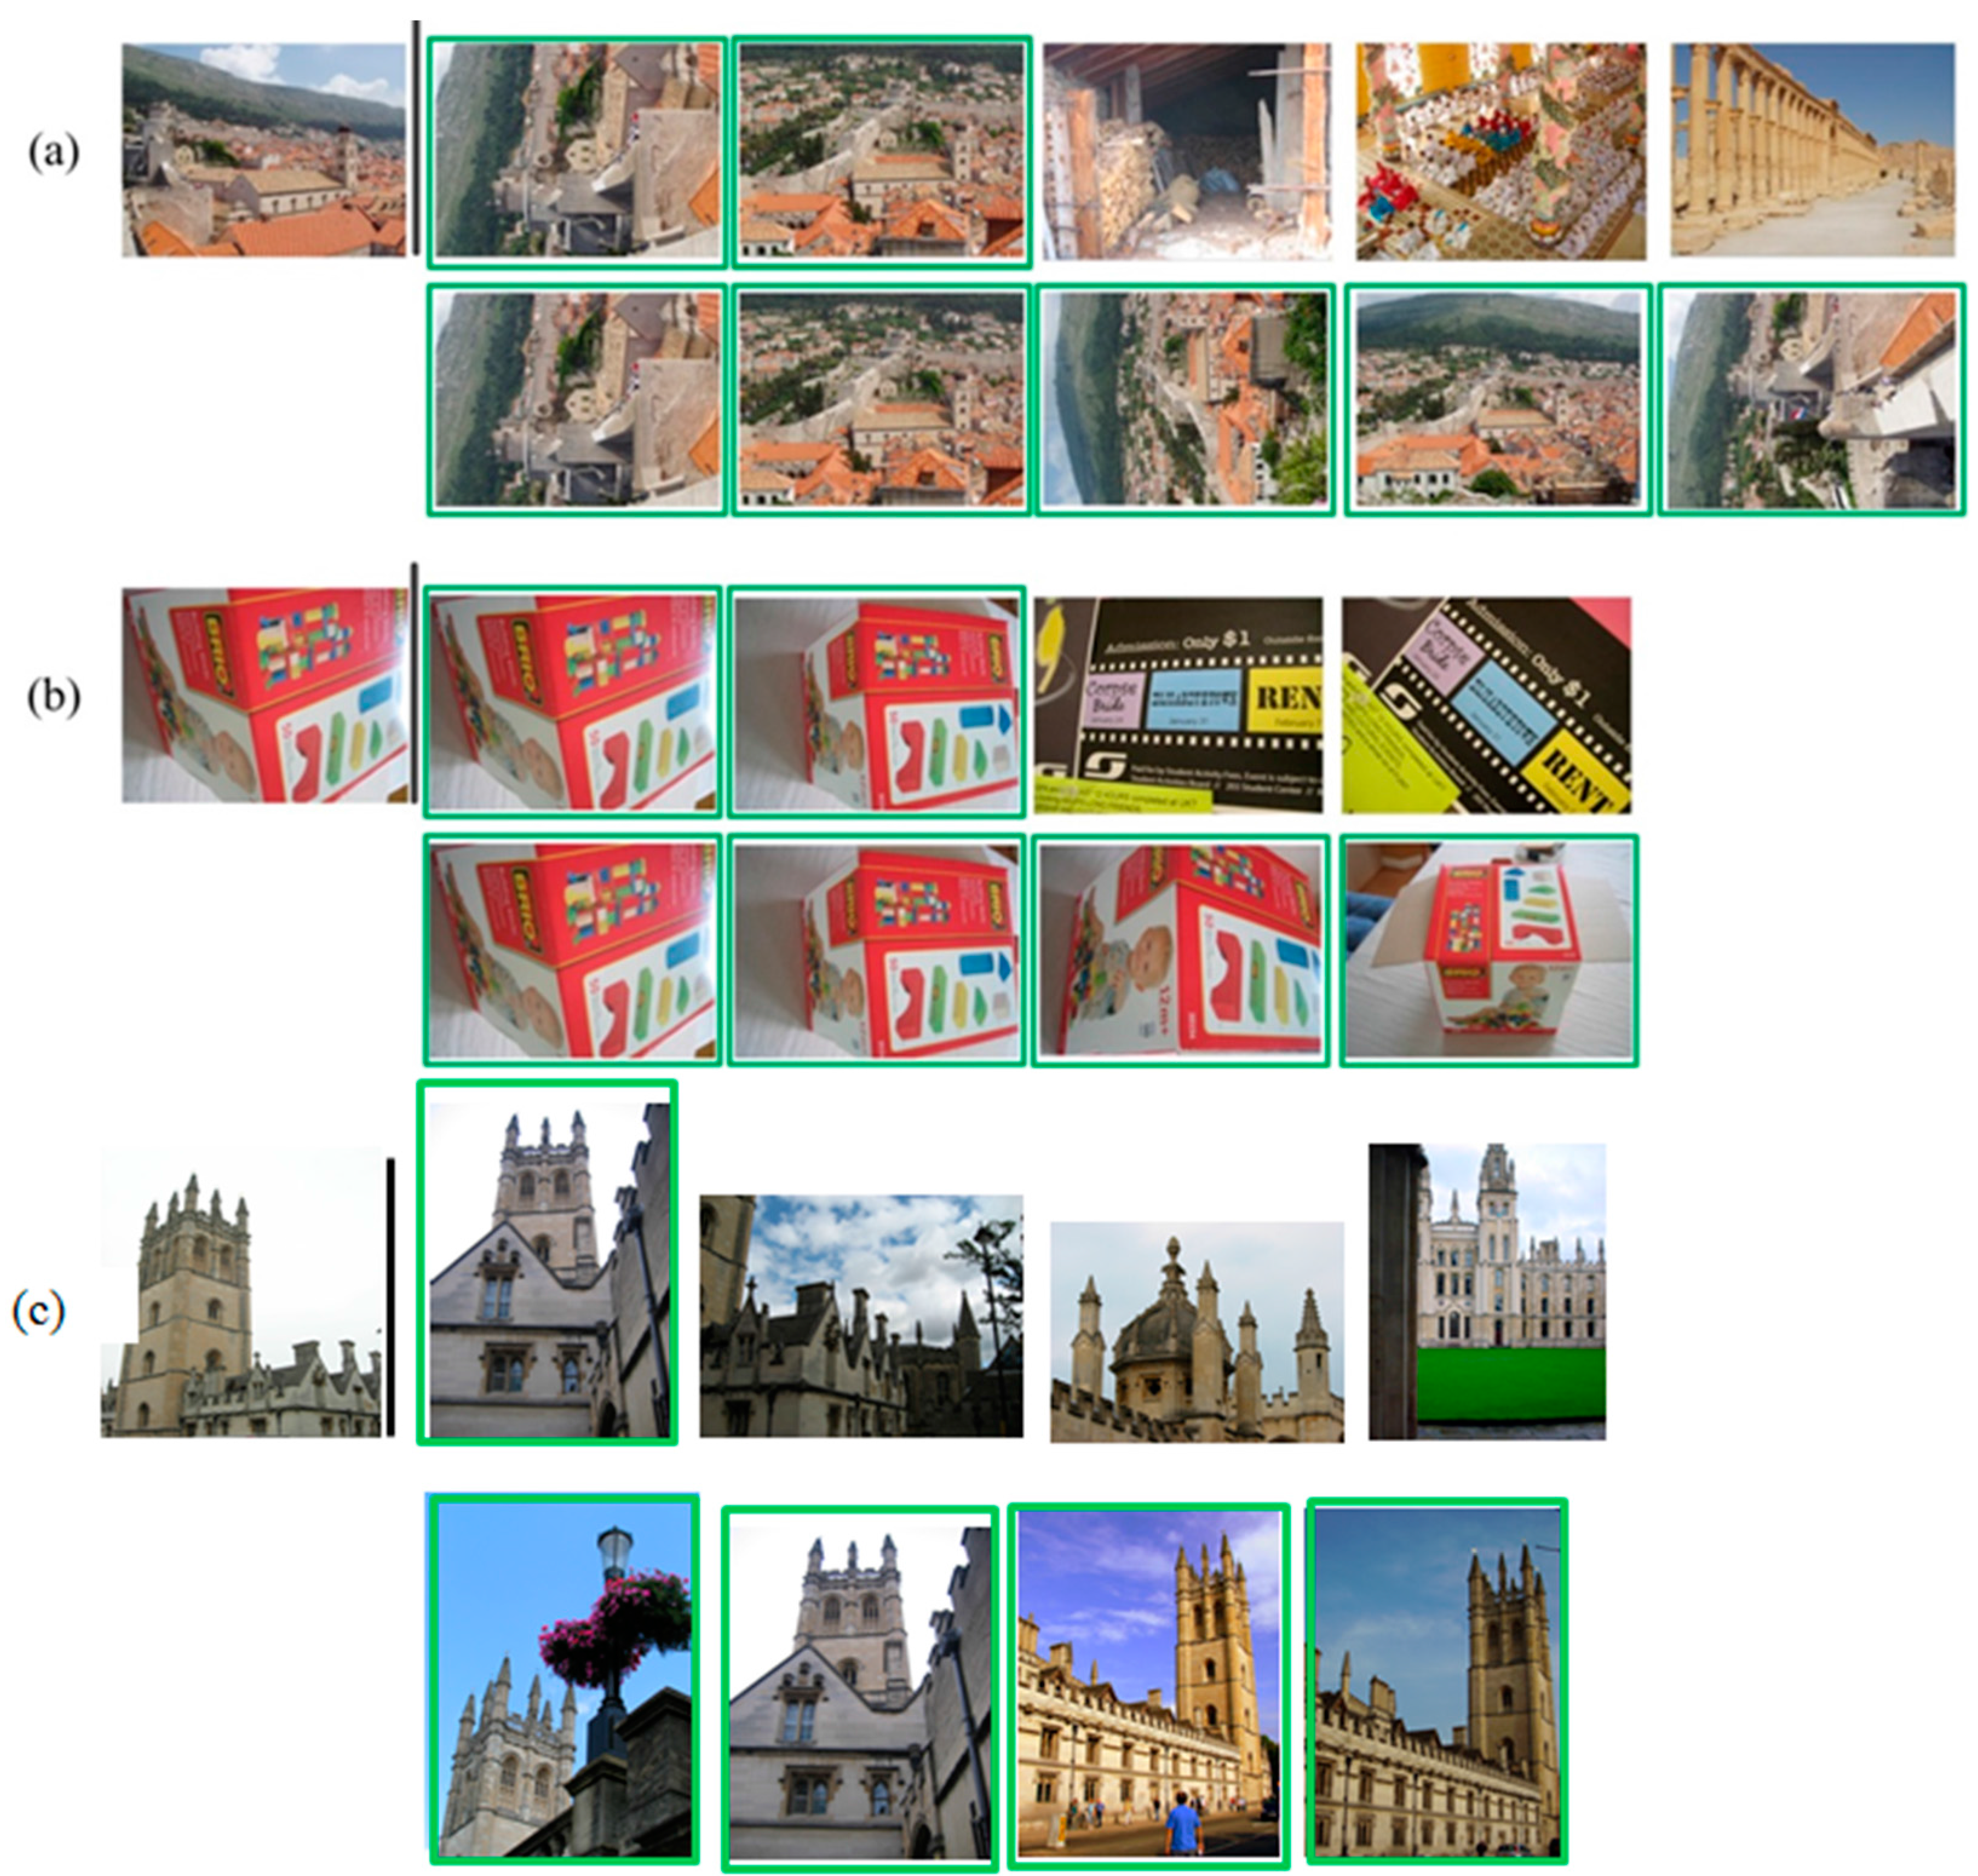
An example of image retrieval using the distribution entropy boosted mechanism is shown in Figure 2.
Our main contributions are as follows:
(1)
Analyze how the descriptor distribution entropy can affect the original VLAD descriptor. For further improvement of the search accuracy, we have proposed the application of a novel normalization stage meeting power law to enhance the distinctiveness of the distribution entropy representation, which is called difference normalization.
(2)
To fuse the distribution entropy and the original VLAD vector, we investigate two fusion mechanisms. One is concatenation, which will produce a double-length vector as the original VLAD. The other is a weighted combination, which will generate a vector of the same length as the original VLAD.
(3)
We survey the state-of-the-art improved VLAD algorithms and evaluate numerous existing studies and new extensions. We compare our proposed method to these algorithms and draw a conclusion that the distribution entropy boosted VLAD obtains performance competitive with the state-of-the-art among several challenging datasets.
The rest of this paper is organized as follows. We first review related work on global representation in large-scale image retrieval in Section 2. We then introduce how to build the distribution entropy boosted VLAD representation and discuss the motivations in Section 3. To validate the effectiveness of our proposed method, detailed experiments and main results are provided in Section 4. Finally, we summarize the paper with conclusive remarks in Section 5.

2. Related Works

In this section, we will introduce the typical VLAD framework and some other popular improvements to the original VLAD. There are three main steps involved in the process of transforming an image into a fixed-length (always a short length, such as 128-D) VLAD representation: (1) local feature extraction; (2) global vector generation; and (3) dimensionality reduction. In some specific applications, such as large-scale image retrieval, the short length vectors are further quantized into compact codes by LSH (Locality-Sensitive Hashing) [18] and SH (Spectral Hashing) [19], but this stage will not be discussed in our work.

2.1. VLAD Review

The vector of locally aggregated descriptors (VLAD) is an encoding technique that produces a fixed-length vector representation V from a set X = { x 1 , , x n } of n local D-dimensional descriptors, e.g., SIFTs [1], extracted from a given image [7]. Similar to BoW [8], a visual dictionary C = { μ 1 , , μ k } is learned offline. It is formally used as a quantization function assigning any input local descriptors to its nearest centroid (visual word) as
q : R D C R D
x q ( x ) = arg   min μ C x μ
where the norm operator ‖·‖ refers to the L2 normalization [7].
VLAD departs from BoW in terms of how this visual dictionary is used. For each quantization index i [ 1 , , K ] , a D-dimensional sub-vector v i is obtained by accumulating the residual vectors; i.e., the difference between the descriptor x and the centroid μ i is
v i = x : q ( x ) = μ i ( x μ i )
The concatenation V = [ v 1 , , v k ] is a K × D -dimensional vector.

2.2. Local Features

Local invariant features [1,2,3,4], which are often distinctive and robust in many visual transformations, are widely adopted in applications such as object recognition [5] and location recognition [6]. Systems based on local features are more robust to geometric transformations and typically exhibit better performance compared with systems based on global features such as GIST [20]. SIFT has shown excellent performance and is the common choice of local feature algorithms for many systems. Although the original VLAD adopts SIFT descriptors as local features, in many improved VLAD systems, PCA-SIFT and RootSIFT [21] are employed as local feature descriptors to obtain better performance [7,16,22,23,24]. In [25], improved SURF and SURF descriptors with color clues are also investigated to ameliorate the quality of the search results.

2.3. Vectorization

After local features are generated, each image can be represented by a set of D-dimensional feature vectors, where D denotes the dimension of the local feature descriptor (e.g., for SIFT, D is 128). To make a large-scale search tractable, an aggregation method is usually employed to generate a single, fixed-length vector representation for each image. BoW [8] has been the most popular method to generate a fixed-length global vector representation based on a set of local features. In recent years, some new representations that encode higher-order distribution statistics of each visual word have been used to build the image vector representation [7,8,12,14,15]. The relationship between Fisher vectors [15] and VLAD [7] is discussed in [15]. Jegou et al. [7] have indicated that VLAD can be considered as a simplified version of a Fisher vector. Although a full-size Fisher vector obtains better performance than VLAD, the short vector representation generated by PCA of VLAD performs equally well as or even better than the Fisher vector [7]. Considering its efficient computation, VLAD is a common choice in many large-scale image retrieval systems.

2.4. Dimension Reduction

Three constraints must be considered in a large-scale image retrieval system: search accuracy, efficiency, and memory usage [7]. When working with the last two issues, compact representation is intuitively studied. Compression and binary coding techniques are usually employed to generate compact binary code. In this paper, we do not consider the binary coding stage. Following the usual frame, after the fixed-length global image representation is generated, it will be further compressed into a low-dimensional vector by a dimensionality reduction method, such as PCA.

2.5. Normalization

Burstiness means that some artificially large components in the image descriptor vector can significantly reduce the contribution of other important dimensions [26]. To work with the problem of visual burstiness, some types of normalization are often applied in the operation of VLAD.

2.5.1. Residual Normalization

To address the fact that individual local descriptors contribute unequally to the VLAD representation, residual normalization [22] is proposed to normalize the residual before it is summed to the cluster residual:
v i = x : q ( x ) = μ i x μ i x μ i

2.5.2. Intra Normalization

In the following study, intra normalization [16] is further proposed to address the visual burstiness. Intra normalization fully suppresses bursts, whereas power normalization [7] attempts to discount the effect of visual burstiness. In this method, the sum of residuals is L2 normalized within each VLAD block (cluster), as shown below:
v i = v i \ v i

2.5.3. Power Normalization

After the vector quantization stage, the original VLAD vector must be power normalized [7] and then L2 normalized [7].
Power normalization [7] discounts the influence of large components that usually result from visual burstiness. To alleviate the burstiness problem of visual descriptors, BoW discounts large values by element-wise square-rooting the BoW vectors and renormalizing them [26]. VLAD adopts a similar method called power normalization processing to every element of the K × D descriptor followed by L2-normalization [7].
Specifically, a component-wise nonlinearity operation is applied as:
v j = | v j | α × s i g n ( v j )
where the quantity is a parameter such that α 1 ; and v j refers to every component of the concatenated residual vector.

2.5.4. L2 Normalization

L2 normalization makes the representation invariant to the number of features extracted from each image [7].
V = V \ V

2.6. Vocabulary Adaptation

Aiming at handling the problem of vocabulary sensitivity, which means that the performance varies with different vocabulary training datasets, a vocabulary adaptation mechanism is investigated in [16]. Specifically, the mean of all local descriptors in the whole dataset assigned to one visual word is defined as the adapted cluster center. Because descriptors assigned to the same visual word for one vocabulary have a higher probability of being assigned to the same visual word for another vocabulary, adopting the mean of all descriptors assigned to one visual word as the adapted center can greatly offset the impact of changing the training datasets.

2.7. Local Coordinate System (LCS)

In [7], it was shown that SIFT descriptors after PCA operation, together with power normalization (where the normalization factor is set as 0.2) [7], can improve the performance of Fisher and VLAD. The reason might be that the first eigenvector captures the main bursty patterns. The impact of power normalization [7] is magnified by a proper choice of the basis on which it is performed. In [22], by not relying on the global operation in the whole descriptor space, but by adapting the coordinate system for each visual word, the performance of VLAD is further boosted. This method must keep a pre-trained PCA rotation matrix for each visual word, so the residuals inside each Voronoi cell would be:
v i = x : q ( x ) = μ i R L C S x μ i x μ i

2.8. Hierarchical VLAD

The crucial issue for a clustering-based global descriptor is the size of the codebook; a large size might achieve high search accuracy but lead to high quantization time and high memory cost for a large-scale search database. Aggregated vectors improve this issue by adopting a small codebook. To maintain the search accuracy, these methods attempt to embed high-order statistical information of every clustered descriptor. For example, VLAD uses multidimensional residuals as cluster descriptors and then concentrates all residuals to build the final global image representation. To reduce the quantization error produced by the small codebooks, Liu et al. [23] and Liu et al. [24] propose leveraging multiple clustering methods and dividing local features into finer clusters. Liu et al. [23] proposed HVLAD to construct a hidden layer vocabulary of each original visual word by re-clustering the SIFT descriptors that lie in the same original visual word. Liu et al. [24] proposed FVLAD to form the hidden layer vocabulary using the residuals generated in the original visual word computation. Wang et al. [27] proposed to build up a tree-structured hierarchical quantization to accelerate the VLAD computation with a large vocabulary.
Nevertheless, residuals can depict only the distance between the data point and cluster center; other distribution information, such as the distribution shape and skewness, are ignored. To this end, Peng et al. proposed a boosting mechanism to add more high-order statistical information to the original VLAD, which is named H-VLAD* [10]. However, to obtain high search accuracy, HVLAD* must build a vector two or three times the length of the original VLAD. This might introduce a longer search time when facing a large-scale image database.

3. Proposed Method

In this section, we will discuss our scheme and our motivations. After the entropy boosted VLAD representation is generated, we further discuss the normalization effect and fusion of the residual vector and entropy vector.

3.1. Distribution Entropy Boosted VLAD

From a conventional point of view, entropy is a basic thermodynamic concept that measures the number of specific realizations. Shannon redefined the entropy concept as a measure of unpredictability of information content [28], which can be described as:
E s = i = 1 k p i ln ( p i )
where P = { p i } is the probability of the system in each possible state i. If entropy is used to describe a data distribution, the more disperse the distribution is, the greater the entropy, and vice versa.
VLAD accumulates residuals to describe each cluster’s distribution. Residuals that provide the summarized distance to the cluster center would yield only a one-dimensional distribution description. It is not rare that two clusters with different degrees of dispersion will share the same residual, as shown in Figure 1. The reason might be that VLAD summarizes all residuals to the cluster center, and if some of the descriptors are distributed symmetrically, the residuals offset mutually, which makes distinctiveness of the residual vector limited. Therefore, in this paper, we investigate to add distribution entropy as a kind of complementary clue to residuals to build improved VLAD descriptors.
After the quantization stage in the original VLAD algorithm, every SIFT descriptor is assigned to a cluster center (visual word) μ i . Here, we introduce the distribution entropy in each cluster as follows.
First, a set of SIFT descriptors X i = { x i 1 , , x i n } is assigned to μ i , and the distribution entropy is built on these descriptors.
Then, a distribution histogram is first built on the j -th dimension of X i as
h i j = [ h i , j 1 , , h i , j B ]
where B denotes the bin amount, and the histogram is in equal-interval. In the experiments, we set B equal to 150.
The probability density can be further computed as:
p i , j b = h i , j b /   h i j
where 1 b B .
Finally, we obtain the distribution entropy on the j -th dimension of cluster μ i as
e i j = b = 1 B p i , j b ln ( p i , j b )
The above distribution entropy gives the dispersive degree of the SIFT descriptor located inside each cluster. Large entropy means that the distribution of the descriptor is dispersed; otherwise, the distribution is concentrated. Because entropy is a statistical feature of data distribution, there might be some clusters with similar entropy degrees. Therefore, adopting entropy as a separate distribution feature of every cluster might lose some distinctiveness. This is why we leverage distribution entropy as a type of complementary feature to residuals to give a comprehensive distribution description of every cluster.
By concatenating the distribution entropy of all clusters, entropy features can be represented as E = [ e 1 , , e k ] .

3.2. Normalization

When we extend VLAD with distribution entropy, the first issue need to address is how to fuse the two types of vectors. As discussed above, the accumulated residual vector should reduce burstiness by an appropriate normalization operation, such as residual normalization [22], intra normalization [16] and power normalization [7]. For distribution entropy, most of the value is in the scope [0, 6]. Zero denotes that all SIFT descriptors are located in the same bin within a cluster, so the aggregation degree is high. It is also necessary to note that as a statistical feature, many entropies are very close. If we perform L2 normalization [7] directly on the original entropy vector, their differences will be nearly lost after normalization. Therefore, we must propose an appropriate manner to enhance the distinctiveness of entropy. Inspired by power normalization [7] in alleviating burstiness, we utilize a reverse method to improve the discrimination of distribution entropy, named difference normalization. Difference normalization first magnifies the difference among entropies by a simple exponential function, and then, power normalization [7] and L2 normalization [7] will be handled sequentially. In the experiment, we set ε equal to 0.1.
e i = | exp   ( e i ) | ε

3.3. Fusion

We use the distribution entropy as a type of complementary clue to the original VLAD.
From the distribution entropy computation, the same dimensionality entropy vector is generated together with the computation of the residual vector. To fuse these two types of vectors, we investigated two fusion mechanisms: compact fusion and extended fusion.
The simplest way to combine two vectors is to concatenate them. In this paper, we call this extended fusion, in which the residual vector and entropy vector will be combined after these two vectors are fully generated. However, concatenation could build a double-length vector (2 × K × D) as the original VLAD vector. We name this vector the extended entropy boosted VLAD (EEVLAD).
We introduce another fusion method, named compact fusion. Specifically, compact fusion occurs in the processing of each visual word. Accumulated residual vi and distribution entropy ei can be computed for each visual word μ i . We employ a type of arithmetic combination given by
v e i = v i + γ e i v i + γ e i
In the experiment, we set γ equal to 0.1.
In compact fusion, v e i has the same dimensionality as the accumulated residual v i or distribution entropy ei. After concatenating the v e i of all clusters, a K × D dimensionality vector is generated. We name this vector compact entropy-boosted VLAD (CEVLAD).
We provide the whole algorithm below (Algorithm 1):
Algorithm 1. Computing distribution entropy boosted VLAD descriptors EEVLAD and CEVLAD from a set of descriptors X = { x 1 , , x n } . The set C = { μ 1 , , μ k } of centroids is learned on a training set using K -means
% Accumulate descriptor residual
For t = 1,…,n
  • i = a r g   min j x t μ j
  • vi = vi + xtμi
% Apply power normalization and intra-normalization for v i
For i = 1,…,K
  • v i = sign ( v i ) | v i | α
  • v i = v i / v i
V = [ v 1 , , v K ]
% Build the distribution entropy for every cluster
For i = 1 , , K
  • X i = { x t | i = a r g   min j x t μ j }
  • % Compute the distribution entropy for the j-dimension of μ i
  • For j = 1 , , D
    • h i , j = hist ( X i j , B )
    • p i , j b = h i , j b /   h i j
    • e i j = b = 1 B p i , j b ln ( p i , j b )
    • % Apply difference normalization for e
    • e i j = | exp ( e i j ) | ε
% Apply compact fusion to generate CEVLAD
For i = 1 , , K
  • c v e i = ( v i + γ · e i ) / v i + γ · e i
C E V = [ c v e 1 , , c v e K ]
% Apply L2 normalization for C E V
C E V = C E V / C E V
% Apply extended fusion to generate EEVLAD
E = [ e 1 , , e K ]
% Apply L2 normalization for E
E = E / E
% Apply L2 normalization for V
V = V / V
E E V = [ V ; E ]
% Apply L2 normalization for EEV
E E V = E E V / E E V

4. Experiment

4.1. Datasets

Experiments are conducted on the following widely used benchmark collections for image retrieval.
INRIA Holidays (http://lear.inrialpes.fr/~jegou/data.php) [29] is a dataset comprising 1491 high-resolution personal holiday photos of different locations and objects, 500 of which are used as queries. The collection includes a large variety of scene types (natural, manmade, water and fire effects). The search quality is measured by mAP, with the query removed from the ranked list.
UKBench (http://www.vis.uky.edu/~stewe/ukbench/) [5] with ground truth contains 10,200 images in groups of four that belong together. All images are 640 × 480 pixels. The database is queried with every image in the test set, and the quality measures are based on the performance of the other three images in the block, named the N-S score.
Oxford 5k Buildings (http://www.robots.ox.ac.uk/~vgg/data/oxbuildings/) [6] contains 5062 images downloaded from Flickr and is often referred to as Oxford 5k. There are 55 queries specified by an image and a rectangular region of interest. The accuracy is measured by mAP.

4.1.1. Training Sets

For Holiday and UKBench, we use Flickr 60k [29] as a vocabulary training set, and for Oxford 5k, we use Paris [30] datasets as vocabulary training sets.
Because we adopt PCA-SIFT as a type of comparative local feature, we adopt Flickr 60k as PCA training sets. For other PCA dimensional reduction, we utilize subsets of Flickr 1M [29] as PCA training sets.

4.1.2. Large-Scale Image Retrieval

We use Holiday to evaluate the performance of large-scale image retrieval. We add 1 million images collected from Flickr, referred to as Flickr 1M [29], to the original Holiday dataset.
In the experiments, we employ the original VLAD (http://people.rennes.inria.fr/Herve.Jegou/projects/aggregating.html) [7] implementation as baseline.

4.2. Evaluation

4.2.1. Full-Size Representation Comparison

We evaluate the original VLAD and some improved versions of VLAD representations for performance comparison. We compare their performance in terms of mAP score on Holidays and Oxford 5k and N-S score on UKBench. Among all improvements, power normalization [7] and intra normalization [16] are the most popular choices. Therefore, in our experiment, we adopt these two add-ons to the original VLAD, denoted as VLAD*. Specifically, in each block (visual word) computation, we apply power normalization [7] first ( α is set to 0.1), followed by intra normalization [16]. Finally, after every cluster’s residual vector is concatenated, L2 normalization [7] is applied again. Moreover, to validate that distribution entropy can boost the performance of VLAD in any variant; we combine the entropy vector with the original VLAD with an extended fusion pattern, denoted as EVLAD. We also test the effectiveness of compact fusion and extended fusion on VLAD*, denoted as CEVLAD and EEVLAD, respectively.
To thoroughly validate and fully enhance the performance of our method, we apply other improvements to the original VLAD and distribution entropy boosted VLAD, such as residual normalization (RN) [22], vocabulary adaptation [16] and local coordinate system (LCS) [22]. We make 5 types of new variants combining these improvements, named Methods 1–5, as shown in Table 1.
Because VLAD is a type of quantization-based image presentation, the final representation originates from the local feature descriptor. SIFT is the most widely applied local feature. We evaluate our method on the original SIFT with two variant SIFT algorithms, RootSIFT [21] and PCA-SIFT.
We report the performance of these five methods on Holiday, Oxford and UKBench in Table 2, Table 3, Table 4, Table 5, Table 6, Table 7, Table 8, Table 9 and Table 10 respectively. The effects of different local descriptors are listed in Table 2, Table 3, Table 4, Table 5, Table 6, Table 7, Table 8, Table 9 and Table 10. All results are generated under K = 64. We also record the performance improvement of every improved VLAD to the original VLAD in the brackets.
For the Holiday dataset, Table 2, Table 3 and Table 4 indicate that adding distribution entropy to the residual vector can obviously enhance the performance, either for original VLAD or for the improved VLAD*. For instance, in Table 2, the results of original VLAD in Methods 1–5 are 0.528, 0.529, 0.529, 0.529, and 0.539, respectively, while the results of distribution entropy boosted VLAD (EVLAD) in Methods 1–5 are 0.544, 0.543, 0.549, 0.543, and 0.562, respectively. The results of VLAD* in Methods 1–5 are 0.551, 0.562, 0.571, 0.611, and 0.652, respectively, whereas the results of EEVLAD in Methods 1–5 are 0.572, 0.58, 0.594, 0.619, 0.655, respectively; and the results of CEVLAD in Methods 1–5 are 0.558, 0.572, 0.583, 0.616, 0.654, respectively. Because VLAD* introduces power normalization [7] and intra normalization [16], the performance of the residual vector has been promoted. Therefore, after distribution entropy is applied to VLAD*, the mAP is significantly improved. Because extended fusion generates a double-length vector EEVLAD compared with VLAD*, the performance of EEVLAD is the best in every row. Compact fusion combines the residual vector and entropy vector inside each block (visual word), thus producing a vector with the same dimensionality as VLAD or VLAD*. Although the performance of CEVLAD is not as good as that of EEVLAD, it attains the best mAP in K × D-dimensional vectors (such as VLAD, VLAD*, and CEVLAD).
For the Oxford and UKBench datasets, the results also indicate that the distribution entropy can improve the mAP for VLAD and VLAD* in every method. The slight difference in the Oxford database is that when there is no LCS [22], the performance of CEVLAD is slightly better than that of EEVLAD. We interpret this as compact fusion normalizes the fused vector inside each component (visual word); thus, when the visual burstiness in some component is more severe, compact fusion might offset some of the impact of this visual burstiness. This could also be proven. as in the first three rows of Table 5, VLAD* performs even worse than the original VLAD. When distribution entropy is added into VLAD*, the performance is improved. However, when RN is jointly applied with LCS, EEVLAD is still better than CEVLAD in the Oxford dataset, which happen in the last two rows in Table 6.
From the five methods under comparison, it can be learned that RN [22], Adaptation [16] and LCS [22] can have only a limited effect on the original VLAD or EVLAD. However, for VLAD*, after power normalization [7] and intra normalization [16] are applied, visual burstiness is greatly reduced. Introducing RN with LCS can further improve the results.
It can also be learned from the sub-tables that local features have an impact on the performance of the final representation. The experiment results indicate that RootSIFT attains the best mAP.
These experimental results indicate that RN with LCS can significantly enhance the performance of VLAD*. Moreover, in most cases, adaptation [16] can yield a further improvement. Therefore, we take Method 5 as our default algorithm for both EEVLAD and CEVLAD.

4.2.2. Compact Size Representation Comparison

In this section, we demonstrate the performance comparison of our entropy boosted VLAD representations and other improved VLAD representations after the dimensionality reduction operation.
One of the merits of aggregated vectors is that they can be reduced to very compact vectors by PCA while preserving search accuracy. In addition to the conventional PCA, some studies have also investigated other methods to further increase the search accuracy, such as applying PCA and whitening jointly [31], using L2 normalization before PCA projection [24], and appropriately leveraging the three steps of PCA [22]. We also attempt to make use of the whitening operation jointly with PCA dimensionality reduction, whose results do not compete with those without a whitening stage. Thus, we adopt only the PCA projection operation.
We compare the 128-D results of our extended EVLAD (EEVLAD) and compact EVLAD (CEVLAD) with several latest variants of VLAD. For EEVLAD and CEVLAD, the performance is derived from K = 256. We also conducted a type of improvement during the dimensionality reduction process proposed in [31], which is named multivoc. Multivoc refers to the joint reduction process of multiple vocabularies. Therefore, in multivoc improved dimensionality reduction, multiple vocabularies are necessary. In our experiment, we utilize 4 vocabularies with K = 256 to generate the results. We report the results in Table 11. Some results of improved VLAD are also presented in the second row. The results of our method based on SIFT descriptors are shown in the third row, and the results of our method based on RootSIFT [21] are shown in the fourth row. We also list the performance without dimensionality reduction on the top of the third and fourth rows for evaluation.
In Table 11, it can be observed that our entropy boosted VLAD representation obtains the best retrieval accuracy compared with other methods.
Table 11 indicates that distribution entropy boosted VLAD can yield an obvious performance gain. In the Holiday dataset, the best mAP in the improved VLAD is 0.64 of HVLAD, which introduces multi-assignment during the residual computation process. In distribution entropy boosted VLAD computation, although we do not employ multi-assignment, the best mAP of the SIFT descriptor can attain 0.635, which is close to 0.64. If we further add the multivoc [31] technique, the best mAP is enhanced to 0.668. If RootSIFT [21] is substituted for SIFT, the best mAP can be significantly improved to 0.681. Another phenomenon to be noted is that the results of CEVLAD after PCA can be better than those of EEVLAD. For example, in the third row, CEVLAD after PCA achieves 0.635 mAP, whereas EEVLAD attains 0.625. Although the original EEVLAD attains better mAP (0.693) than CEVLAD (0.681), being a type of double-length vector compared with CEVLAD, EEVLAD might lose more information during the PCA process than CEVLAD.
Similar findings could be obtained from the results of Oxford and UKBench.
Dimensionality reduction can introduce some performance loss compared with the full-size EEVLAD or CEVLAD vector. However, joint dimensionality reduction based on multiple vocabularies can significantly improve the mAP. This indicates that PCA removes the correlation while preserving the additional information from the different quantizations.

4.2.3. Large-Scale Retrieval

To demonstrate the scalability of distribution entropy boosted VLAD in large-scale image retrieval, we construct a similar image retrieval task in certain large datasets. We use Flickr 1M as a distractor to the Holiday dataset (see Table 12). EEVLAD and CEVLAD are projected to 128-D compact vectors to obtain the best search accuracy, and an exhaustive nearest-neighbor search is performed to find the most relevant images. In the experiment, we use RootSIFT [21] as a local descriptor. Compared to the best performance of other methods dealing with short vector image representation in large scale image retrieval application that achieves 0.430 [23], our best method (0.472 mAP) obtains significant relative improvement of 9.76%. In fact, even CEVLAD with multivoc (0.469 mAP) can attain an improvement of 9.07%.

4.3. Image Classification

To further validate our method, we conducted image classification experiments on the well-known PASCAL VOC2007 dataset [32]. This challenging dataset is known as one of the most difficult image classification tasks due to significant variations of appearance and poses even with occlusions. It is composed of nearly 10,000 images with 20 different object categories. All images are divided into training data, validation data and test data. The performance is evaluated by the standard PASCAL protocol, which computes average precision (AP) based on the precision–recall curve. We report the mean of AP (mAP) over 20 categories.
We use the public available image classification framework provided by the VLFeat toolbox to conduct the image classification experiment. We densely extract local SIFT descriptors with a spatial stride of 4 pixels at 5 scales, and the width of the SIFT spatial bin is fixed at 8 pixels; these are default settings in the VLFeat toolbox (http://www.vlfeat.org/) (Version 0.9.20) [33]. We learn the vocabulary with size K = 256 from a subset of 5K SIFT descriptors. The dimensionality of SIFT descriptors is reduced to 64. All descriptors are whitened after PCA processing. The VLAD vector is power normalized [7] and L2 normalized [7] in each block (cluster); after all blocks are concatenated, the full vector is L2 renormalized [7]. The distributed entropy vector is normalized in a similar way. All normalization factors are the same as in the previous experimental sections.
We report the classification results computed by EEVLAD and CEVLAD with SIFT and RootSIFT [21], respectively. Because SIFT descriptors have been dimensionally reduced by the PCA method in the beginning, we do not list PCA-SIFT separately. We also provide results of VLAD for comparison. Table 13 indicates that both extended EVLAD and compact EVLAD can obviously enhance the classification performance. As in the SIFT descriptor, compact EVLAD can improve the performance from 0.5542 to 0.5626, whereas double-length EEVLAD can improve the original VLAD to 0.5669. In the RootSIFT descriptor [21], the results are similar. Compact EVLAD can improve the performance from 0.5601 to 0.5665, whereas extended EVLAD can obtain a much better performance of 0.5714. The results show that the distribution entropy can boost the performance of the original VLAD vector, so it is beneficial for image classification applications.

4.4. Complexity Analysis

The computation process of distribution entropy boosted VLAD representation is composed of two main parts, the first one is the original VLAD part, and the second one is the distribution entropy generation part. For both full-size EEVLAD and CEVLAD representations, the added computation time is caused by the entropy generation part. It can be clearly seen from Algorithm 1 that the computation complexity of entropy generation part is O (K × D × B).
In large-scale image retrieval and classification, both EEVLAD and CEVLAD are dimensionality reduced to 128-D representation. Furthermore, the PCA projection matrix is trained on separated datasets. Therefore, the searching time of EEVLAD and CEVLAD are the same. The only difference between EEVLAD and CEVLAD is the generation time of full-size representations. However, for online searching, it only impacts the query image, and will not have much impact in the whole searching process.

5. Conclusions

In this paper, we have proposed the distribution entropy boosted VLAD approach, which is a novel extension of VLAD. Because the original VLAD adopts only residuals to depict the distribution information of every cluster and neglects other statistical clues, the final representation is not sufficiently distinctive. Thus, our proposed approach utilizes distribution entropy as a type of complementary clue to residuals for describing the dispersion degree of every cluster. For further improvement of the search accuracy, we have proposed the application of a novel normalization stage to enhance the distinctiveness of the distribution entropy representation, which is called difference normalization. We also provide two size representations of distribution entropy boosted VLAD, compact EVLAD (CEVLAD) and extended EVLAD (EEVLAD), considering the efficiency issue in terms of computation and memory cost. Through extensive performance experiments on existing publicly available datasets, we have shown that the proposed approach improves search accuracy compared to other existing methods.
Adopting deep network feature into VLAD methods are proven to be very promising in both image retrieval and image classification application by many works [34,35]. In the future, we will explore leveraging convolutional neural networks feature as image features with EVLAD algorithm.

Acknowledgments

This work was supported by the Nature Science Foundation of China under Grant 61101155; the Jilin Province Science and Technology Development Program under Grant 20150520063JH; and the General Financial Grant from China Postdoctoral Science Foundation under Grants 2015M571363 and 2015M570272.

Author Contributions

Qiuzhan Zhou conceived the research subject of this paper, revised the paper and directed this study. Pingping Liu carried out the calculation of distribution entropy boosted VLAD, drafted the paper and approved the final version to be published. Cheng Wang, Qingliang Li, Yeran Wang and Shuozhang Chen validated the results. All authors have read and approved the final manuscript.

Conflicts of Interest

The authors declare no conflict of interest.

References

  1. Lowe, D. Distinctive Image Features from Scale-Invariant Keypoints. Int. J. Comput. Vis. 2004, 60, 91–110. [Google Scholar] [CrossRef]
  2. Bay, H.; Ess, A.; Tuytelaars, T.; Van Gool, L. Speeded-Up Robust Features (SURF). Comput. Vis. Image Underst. 2008, 110, 346–359. [Google Scholar] [CrossRef]
  3. Rublee, E.; Rabaud, V.; Konolige, K.; Bradski, G. ORB: An efficient alternative to SIFT or SURF. In Proceedings of the 2011 International Conference on Computer Vision, Barcelona, Spain, 6–13 November 2011; pp. 2564–2571.
  4. Alahi, A.; Ortiz, R.; Vandergheynst, P. FREAK: Fast Retina Keypoint. In Proceedings of the 2012 IEEE Conference on Computer Vision and Pattern Recognition (CVPR), Providence, RI, USA, 16–21 June 2012; pp. 510–517.
  5. Nister, D.; Stewenius, H. Scalable Recognition with a Vocabulary Tree. In Proceedings of the 2006 IEEE Conference on Computer Vision and Pattern Recognition (CVPR), New York, NY, USA, 17–22 June 2006; pp. 2161–2168.
  6. Philbin, J.; Chum, O.; Isard, M.; Sivic, J.; Zisserman, A. Object retrieval with large vocabularies and fast spatial matching. In Proceedings of the 2007 IEEE Conference on Computer Vision and Pattern Recognition (CVPR), Minneapolis, MN, USA, 17–22 June 2007; pp. 1–8.
  7. Jegou, H.; Perronnin, F.; Douze, M.; Sanchez, J.; Perez, P.; Schmid, C. Aggregating Local Image Descriptors into Compact Codes. IEEE Trans. Pattern Anal. Mach. Intell. 2012, 34, 1704–1716. [Google Scholar] [CrossRef] [PubMed] [Green Version]
  8. Sivic, J.; Zisserman, A. Video Google: A text retrieval approach to object matching in videos. In Proceedings of the Ninth IEEE International Conference on Computer Vision, Nice, France, 13–16 October 2003; Volume 2, pp. 1470–1477.
  9. Kim, T.-E.; Kim, M.H. Improving the search accuracy of the VLAD through weighted aggregation of local descriptors. J. Vis. Commun. Image Represent. 2015, 31, 237–252. [Google Scholar] [CrossRef]
  10. Peng, X.; Wang, L.; Qiao, Y.; Peng, Q. Boosting VLAD with Supervised Dictionary Learning and High-Order Statistics. In Proceedings of the 13th European Conference on Computer Vision—ECCV 2014, Zurich, Switzerland, 6–12 September 2014; pp. 660–674.
  11. Dohnal, V.; Homola, T.; Zezula, P. MDPV: Metric distance permutation vocabulary. Inf. Retr. J. 2015, 18, 51–72. [Google Scholar] [CrossRef]
  12. Yang, J.; Yu, K.; Gong, Y.; Huang, T. Linear spatial pyramid matching using sparse coding for image classification. In Proceedings of the 2009 IEEE Conference on Computer Vision and Pattern Recognition (CVPR), Miami, FL, USA, 20–25 June 2009; pp. 1794–1801.
  13. Liu, L.; Wang, L.; Liu, X. In defense of soft-assignment coding. In Proceedings of the International Conference on Computer Vision, Barcelona, Spain, 6–13 November 2011; pp. 2486–2493.
  14. Wang, J.; Yang, J.; Yu, K.; Lv, F.; Huang, T.; Gong, Y. Locality-constrained Linear Coding for image classification. In Proceedings of the 2010 IEEE Conference on Computer Vision and Pattern Recognition (CVPR), San Francisco, CA, USA, 13–18 June 2010; pp. 3360–3367.
  15. Perronnin, F.; Yan, L.; Sanchez, J.; Poirier, H. Large-scale image retrieval with compressed Fisher vectors. In Proceedings of the 2010 IEEE Conference on Computer Vision and Pattern Recognition (CVPR), San Francisco, CA, USA, 13–18 June 2010; pp. 3384–3391.
  16. Arandjelovic, R.; Zisserman, A. All About VLAD. In Proceedings of the 2013 IEEE Conference on Computer Vision and Pattern Recognition (CVPR), Portland, OR, USA, 23–28 June 2013; pp. 1578–1585.
  17. Gong, Y.; Wang, L.; Guo, R.; Lazebnik, S. Multi-scale Orderless Pooling of Deep Convolutional Activation Features. In Proceedings of the 13th European Conference on Computer Vision—ECCV 2014, Zurich, Switzerland, 6–12 September 2014; pp. 392–407.
  18. Andoni, A.; Indyk, P. Near-Optimal Hashing Algorithms for Approximate Nearest Neighbor in High Dimensions. In Proceedings of the 47th Annual IEEE Symposium on Foundations of Computer Science (FOCS’06), Berkeley, CA, USA, 21–24 October 2006; pp. 459–468.
  19. Weiss, Y.; Torralba, A.; Fergus, R. Spectral Hashing. In Proceedings of the 23rd Annual Conference on Neural Information Processing Systems, Vancouver, BC, Canada, 7–10 December 2009.
  20. Oliva, A.; Torralba, A. Modeling the Shape of the Scene: A Holistic Representation of the Spatial Envelope. Int. J. Comput. Vis. 2001, 42, 145–175. [Google Scholar] [CrossRef]
  21. Arandjelovic, R.; Zisserman, A. Three things everyone should know to improve object retrieval. In Proceedings of the 2012 IEEE Conference on Computer Vision and Pattern Recognition (CVPR), Providence, RI, USA, 16–21 June 2012; pp. 2911–2918.
  22. Delhumeau, J.; Gosselin, P.-H.; Jegou, H.; Perez, P. Revisiting the VLAD image representation. In Proceedings of the 21st ACM international conference on Multimedia, Barcelona, Spain, 21–25 October 2013; pp. 653–656.
  23. Liu, Z.; Li, H.; Zhou, W.; Rui, T.; Tian, Q. Making Residual Vector Distribution Uniform for Distinctive Image Representation. IEEE Trans. Circuits Syst. Video Technol. 2016, 26, 375–384. [Google Scholar] [CrossRef]
  24. Liu, Z.; Wang, S.; Tian, Q. Fine-residual VLAD for image retrieval. Neurocomputing 2016, 173, 1183–1191. [Google Scholar] [CrossRef]
  25. Spyromitros-Xioufis, E.; Papadopoulos, S.; Kompatsiaris, I.Y.; Tsoumakas, G.; Vlahavas, I. A Comprehensive Study Over VLAD and Product Quantization in Large-Scale Image Retrieval. IEEE Trans. Multimed. 2014, 16, 1713–1728. [Google Scholar] [CrossRef]
  26. Jegou, H.; Douze, M.; Schmid, C. On the burstiness of visual elements. In Proceedings of the 2009 IEEE Conference on Computer Vision and Pattern Recognition (CVPR), Miami, FL, USA, 20–25 June 2009; pp. 1169–1176.
  27. Wang, Y.; Duan, L.Y.; Lin, J.; Wang, Z.; Huang, T. Hierarchical multi-VLAD for image retrieval. In Proceedings of the 2015 IEEE International Conference on Image Processing (ICIP), Quebec City, QC, Canada, 27–30 September 2015; pp. 4629–4633.
  28. Cover, T.M.; Thomas, J.A. Elements of Information Theory; John Wiley & Sons: Hoboken, NJ, USA, 2012. [Google Scholar]
  29. Jegou, H.; Douze, M.; Schmid, C. Hamming Embedding and Weak Geometric Consistency for Large Scale Image Search. In Proceedings of the 10th European Conference on Computer Vision, Marseille, France, 12–18 October 2008; pp. 304–317.
  30. Philbin, J.; Chum, O.; Isard, M.; Sivic, J.; Zisserman, A. Lost in quantization: Improving particular object retrieval in large scale image databases. In Proceedings of the 2008 IEEE Conference on Computer Vision and Pattern Recognition (CVPR), Anchorage, AK, USA, 23–28 June 2008; pp. 1–8.
  31. Jégou, H.; Chum, O. Negative Evidences and Co-occurences in Image Retrieval: The Benefit of PCA and Whitening. In Proceedings of the 12th European Conference on Computer Vision—ECCV 2012, Florence, Italy, 7–13 October 2012; Part II. pp. 774–787.
  32. Everingham, M.; Van Gool, L.; Williams, C.K.I.; Winn, J.; Zisserman, A. The PASCAL Visual Object Classes Challenge 2007 (VOC 2007) Results. Available online: http://host.robots.ox.ac.uk/pascal/VOC/voc2007/ (accessed on 18 August 2016).
  33. Vedaldi, A.; Fulkerson, B. VLFeat: An open and portable library of computer vision algorithms. In Proceedings of the 18th ACM International Conference on Multimedia, Firenze, Italy, 25–29 October 2010; pp. 1469–1472.
  34. Ng, J.Y.-H.; Yang, F.; Davis, L.S. Exploiting local features from deep networks for image retrieval. In Proceedings of the 2015 IEEE Conference on Computer Vision and Pattern Recognition Workshops (CVPRW), Boston, MA, USA, 7–12 June 2015; pp. 53–61.
  35. Arandjelovic, R.; Gronat, P.; Torii, A.; Pajdla, T.; Sivic, J. NetVLAD: CNN architecture for weakly supervised place recognition. In Proceedings of the 2016 IEEE Conference on Computer Vision and Pattern Recognition (CVPR), Las Vegas, NV, USA, 26 June–1 July 2016.
Figure 1. The demonstration of VLAD shortcoming. The point sets are quantized into two clusters. C1 and C2 are the centers of the clusters. C1 and C2 have identical residuals but possess different distribution entropies; it can be observed that the points of C2 are distributed differently to those of C1.
Entropy 18 00311 g001
Figure 2. Examples of images retrieved from (a) Holiday, (b) UKB and (c) Oxford datasets. For each query (left), results obtained by the original VLAD (the first row) and distribution entropy boosted VLAD (the second row) are demonstrated. The green border indicates that the retrieval result meets the ground truth.
Entropy 18 00311 g002
Table 1. Comparative Methods of standard VLAD and with modifications as Residual Normalization (RN), Local coordinate system (LCS), and Vocabulary adaptation (Adaptation).
MethodRNAdaptationLCS
1NoNoNo
2YesNoNo
3YesYesNo
4YesNoYes
5YesYesYes
Table 2. SIFT descriptor results of image retrieval task on Holiday, and performance improvements are recorded in the brackets for improved VLAD representations. (Bold numbers mean best performance)
MethodVLADEVLADVLAD*EEVLADCEVLAD
10.5280.544 (30.3%)0.551 (43.6%)0.572 (8.33%)0.558 (5.69%)
20.5290.543 (26.5%)0.562 (6.24%)0.58 (9.64%)0.572 (8.13%)
30.5290.549 (37.8%)0.571 (7.94%)0.594 (12.3%)0.583 (10.2%)
40.5290.543 (26.5%)0.611 (15.5%)0.619 (17%)0.616 (16.4%)
50.5390.562 (42.7%)0.652 (21%)0.655 (22%)0.654 (21.3%)
Table 3. RootSIFT descriptor results of image retrieval task on Holiday, and performance improvements are recorded in the brackets for improved VLAD representations. (Bold numbers mean best performance)
MethodVLADEVLADVLAD*EEVLADCEVLAD
10.5620.564 (0.36%)0.567 (0.89%)0.59 (4.98%)0.575 (2.31%)
20.5660.566 (2.13%)0.576 (1.77%)0.592 (4.59%)0.587 (3.71%)
30.5630.575 (2.13%)0.594 (5.51%)0.607 (7.82%)0.605 (7.46%)
40.5610.567 (1.07)0.64 (14.08%)0.648 (15.51%)0.648 (15.51%)
50.5630.575 (2.13%)0.663 (17.76%)0.678 (20.4%)0.676 (20.07%)
Table 4. PCA-SIFT descriptor results of image retrieval task on Holiday, and performance improvements are recorded in the brackets for improved VLAD representations. (Bold numbers mean best performance)
MethodVLADEVLADVLAD*EEVLADCEVLAD
10.5280.534 (1.14%)0.549 (3.98%)0.557 (5.49%)0.553 (4.73%)
20.5220.527 (0.96%)0.56 (7.28%)0.57 (9.20%)0.566 (8.43%)
30.5260.537 (2.09%)0.576 (9.51%)0.578 (9.89%)0.577 (9.70%)
40.5220.527 (0.96%)0.559 (7.09%)0.567 (8.62%)0.562 (7.66%)
50.5260.537 (2.09%)0.589 (11.98%)0.591 (12.36%)0.590 (12.36%)
Table 5. SIFT descriptor results of image retrieval task on Oxford, and performance improvements are recorded in the brackets for improved VLAD representations. (Bold numbers mean best performance)
MethodVLADEVLADVLAD*EEVLADCEVLAD
10.3890.395 (1.54%)0.379 (−2.57%)0.393 (1.03%)0.396 (1.80%)
20.3980.404 (1.51%)0.380 (−4.52%)0.398 (0.00%)0.401 (0.75%)
30.3980.405 (1.76%)0.383 (−3.77%)0.398 (0.00%)0.400 (0.50%)
40.4020.404 (0.50%)0.471 (17.16%)0.486 (20.90%)0.478 (18.91%)
50.4020.405 (0.75%)0.472 (17.41%)0.491 (22.14%)0.481 (19.65%)
Table 6. RootSIFT descriptor results of image retrieval task on Oxford, and performance improvements are recorded in the brackets for improved VLAD representations. (Bold numbers mean best performance)
MethodVLADEVLADVLAD*EEVLADCEVLAD
10.3850.389 (1.04%)0.392 (1.82%)0.396 (2.86%)0.398 (3.38%)
20.3960.398 (0.51%)0.399 (0.76%)0.402 (1.52%)0.403 (1.77%)
30.4000.403 (0.75%)0.401 (0.25%)0.406 (1.50%)0.407 (1.75%)
40.3960.398 (0.51%)0.473 (19.44%)0.486 (22.73%)0.482 (21.72%)
50.4000.403 (0.75%)0.482 (20.5%)0.496 (24%)0.489 (22.25%)
Table 7. PCA-SIFT descriptor results of image retrieval task on Oxford, and performance improvements are recorded in the brackets for improved VLAD representations. (Bold numbers mean best performance)
MethodVLADEVLADVLAD*EEVLADCEVLAD
10.3980.398 (0.00%)0.412 (3.52%)0.413 (3.77%)0.416 (4.52%)
20.4040.404 (0.00%)0.416 (2.97%)0.419 (3.71%)0.423 (4.70%)
30.4050.406 (0.25%)0.42 (3.70%)0.424 (4.69%)0.427 (5.43%)
40.4040.404 (0.00%)0.43 (6.44%)0.436 (7.92%)0.436 (7.92%)
50.4050.406 (0.25%)0.436 (7.65%)0.443 (9.38%)0.438 (8.15%)
Table 8. SIFT descriptor results of image retrieval task on UKBench, and performance improvements are recorded in the brackets for improved VLAD representations. (Bold numbers mean best performance)
MethodVLADEVLADVLAD*EEVLADCEVLAD
13.0383.201 (5.37%)3.224 (6.12%)3.393 (11.69%)3.276 (7.83%)
22.9583.14 (6.15%)3.265 (10.38%)3.398 (14.87%)3.282 (10.95%)
32.9573.142 (6.26%)3.225 (9.06%)3.397 (14.88%)3.284 (11.06%)
42.9583.14 (6.15%)3.391 (14.64%)3.486 (17.85%)3.436 (16.16%)
52.9573.142 (6.26%)3.394 (14.78%)3.484 (17.82%)3.434 (16.13%)
Table 9. RootSIFT descriptor results of image retrieval task on UKBench, and performance improvements are recorded in the brackets for improved VLAD representations. (Bold numbers mean best performance)
MethodVLADEVLADVLAD*EEVLADCEVLAD
12.9413.127 (6.32%)3.296 (12.07%)3.408 (15.88%)3.308 (12.48%)
22.9073.105 (6.81%)3.312 (13.93%)3.415 (17.48%)3.315 (14.04%)
32.9053.103 (6.82%)3.293 (13.36%)3.415 (17.56%)3.315 (14.11%)
42.9073.105 (6.81%)3.375 (16.10%)3.453 (18.78%)3.408 (17.23%)
52.9053.103 (6.82%)3.376 (16.21%)3.451 (18.80%)3.409 (17.35%)
Table 10. PCA-SIFT descriptor results of image retrieval task on UKBench, and performance improvements are recorded in the brackets for improved VLAD representations. (Bold numbers mean best performance)
MethodVLADEVLADVLAD*EEVLADCEVLAD
12.8693.047 (6.20%)3.233 (12.69%)3.371 (17.50%)3.252 (13.35%)
22.833.011 (6.40%)3.25314.95%3.39 (19.79%)3.291 (16.29%)
32.8283.012 (6.51%)3.253 (15.03%)3.388 (19.80%)3.291 (16.37%)
42.833.011 (6.40%)3.299 (16.57%)3.407 (20.39%)3.328 (17.60%)
52.8283.012 (6.51%)3.3 (16.69%)3.406 (20.44%)3.328 (17.68%)
Table 11. Comparison of 128-D results with the state of the art. (Bold numbers mean best performance)
Methods\DatasetsKDHolidays (mAP)Oxford (mAP)UKBench (N-S)
VLAD [7]641280.510-3.15
VLAD + SSR [7]641280.5570.2873.35
Multivoc − VLAD [22]4 × 2561280.614-3.36
VLAD + Intra + Adapt [16]-1280.6250.448-
HVLAD [23]2561280.64-3.4
FVLAD [24]2561280.622-3.43
SIFT
EEVLAD25665,5360.6930.5323.458
EEVLAD2561280.6250.5012.855
EEVLAD + Multivoc4 × 2561280.6680.5363.073
CEVLAD25632,7680.6810.5273.436
CEVLAD2561280.6350.4992.82
CEVLAD + Multivoc4 × 2561280.6640.5322.977
RootSIFT
EEVLAD25665,5360.7150.5453.511
EEVLAD2561280.620.5283.017
EEVLAD + Multivoc4 × 2561280.6740.5523.224
CEVLAD25632,7680.6980.5383.475
CEVLAD2561280.6550.5222.915
CEVLAD + Multivoc4 × 2561280.6810.5383.093
Table 12. Comparison of 128-D results in large-scale image retrieval on Holiday with Flickr 1M.
MethodsmAP
VLAD with Intra Norm + Adaptation [ 16]0.378
VLAD with Multivoc + SSR [ 31]0.370
VLAD with LCS + RN [ 22]0.392
HVLAD [ 23]0.430
FVLAD [ 24]0.376
EEVLAD0.424
EEVLAD + Multivoc0.472
CEVLAD0.402
CEVLAD + Multivoc0.469
Table 13. Results of image classification task.
SIFT (mAP) (%)RootSIFT (mAP) (%)
VLAD55.4256.01
EEVLAD56.6957.14
CEVLAD56.2656.65

