1. Introduction
In internal combustion engines it is desirable to convert fuel energy into engine performance at the highest rate, but conversion of all the fuel energy into work thus a one hundred percent energy conversion is not possible [
1,
2]. Some of the losses that occur during energy conversion are caused by irreversibilities. The remaining energy, in other words the amount of the energy available is defined as exergy [
3]. From the viewpoint of thermodynamics, exergy is defined as the maximum amount of work that can be obtained from the system at the specified state as the system is brought to equilibrium with the environment [
1].
Exergy analysis is used to determine in detail the amounts of losses in a system and locations where they occur, and the processes that cause them [
4,
5], so the application of exergy analysis for internal combustion engines allows determining the sources of irreversibilities and obtaining more accurate information about engine efficiency.
In other respects, high energy costs combined with growing energy demand make saving energy increasingly important for the world. Fossil fuels, which have the largest share of the energy demand growth, are not sufficient to meet the energy needs. Additionally serious environmental problems such as air pollution, greenhouse gases, and the climate change caused by them are also globalized energy issues that have turned peoples’ attention to eco-friendly renewable and alternative energy sources. In particular, considering air pollution the share of emissions caused by motor vehicles cannot be underestimated. Since the invention of the internal combustion engine many different fuel have been used such as gasoline and diesel, which are known under the name of conventional fuels, natural gas, liquefied petroleum gas (LPG), alcohols and even various alternative fuels such as biodiesel, biogas, hydrogen, and their blends in order to achieve lower fuel consumption and emissions and better engine performance [
2,
6]. While there are many options that can be fuels for internal combustion engines, the real issue is to determine how well a fuel serves the desired purpose [
7]. Biodiesel is the first alternative fuel that comes to mind in terms of replacing diesel fuel and it has been subject to many studies due to the its attractive properties such as being non-toxic, sulphur-free, oxygenated, biodegradable, etc. [
8]. Another one is bioethanol and when used with biodiesel, it overcomes the negative effects of the latter, such as high CO emissions, high viscosity, and high cold filter plugging point. Biodiesel conversely also improves the low lubricity and cetane number issues of bioethanol [
9]. The reason why it is preferable to use these fuels together is to eliminate the negative effects of each fuel.
There are numerous studies in the literature on the effect of different diesel engine experimental conditions on exergy analysis. The history of the studies on this topic dates back to the mid-1900s [
10]. Rakopoulos and Giakoumis [
11] carried out a detailed energy and exergy performance computer analysis, verified experimentally, on a diesel engine under transient load conditions. In another study, Rakopoulos and Giakoumis [
12] once again used a computer model to compare energy and exergy analysis terms of a transient diesel engine operation. Zheng and Caton [
10] reported a study evaluating the energy and exergy distribution for eight operating conditions consisted of four different exhaust gas recirculation (EGR) levels and two different injection timings in a low temperature combustion diesel engine. Caton [
13] presented an analytical study analyzing exergy destruction during the combustion process, based on the second law of thermodynamics. Tat [
2] investigated the effect of cetane number and ignition delay on the energy and exergy analyses for a diesel engine run on two different biodiesels made from soybean oil methyl ester (SME) and the yellow grease methyl ester (YGME) and blends consisting of 0.75% and 1.5% of cetane improver by weight with SME. Giakoumis [
14] studied the effect of cylinder wall insulation using silicon nitride and plasma spray zirconia as insulators for a turbocharged diesel engine operating under transient load conditions from both a first and second law perspective. Azoumah et al. [
15] presented a study to examine the combined effect of exergy analysis and gas emissions analysis to optimize the performance of a diesel engine running on cotton and palm oils and their blends with diesel fuel under different engine loads. Caliskan et al. [
16] conducted a study to investigate the effect of varying dead state temperatures on exergy efficiencies in a diesel engine fueled with high-oleic methyl ester (HOME). Özkan [
17] applied energy and exergy analyses to a direct injection diesel engine running under different multiple injection modes. It was observed that energetic and exergetic efficiencies are inversely proportional to injection pressure.
Many other studies have investigated the effect of various fuels in diesel engines with similar characteristics based on a second law analysis and compared them with diesel fuel. Sahoo et al. [
18] examined operation of a diesel engine which was dual fueled with syngas-diesel under varying load conditions from a second law viewpoint. Canakci and Hosoz [
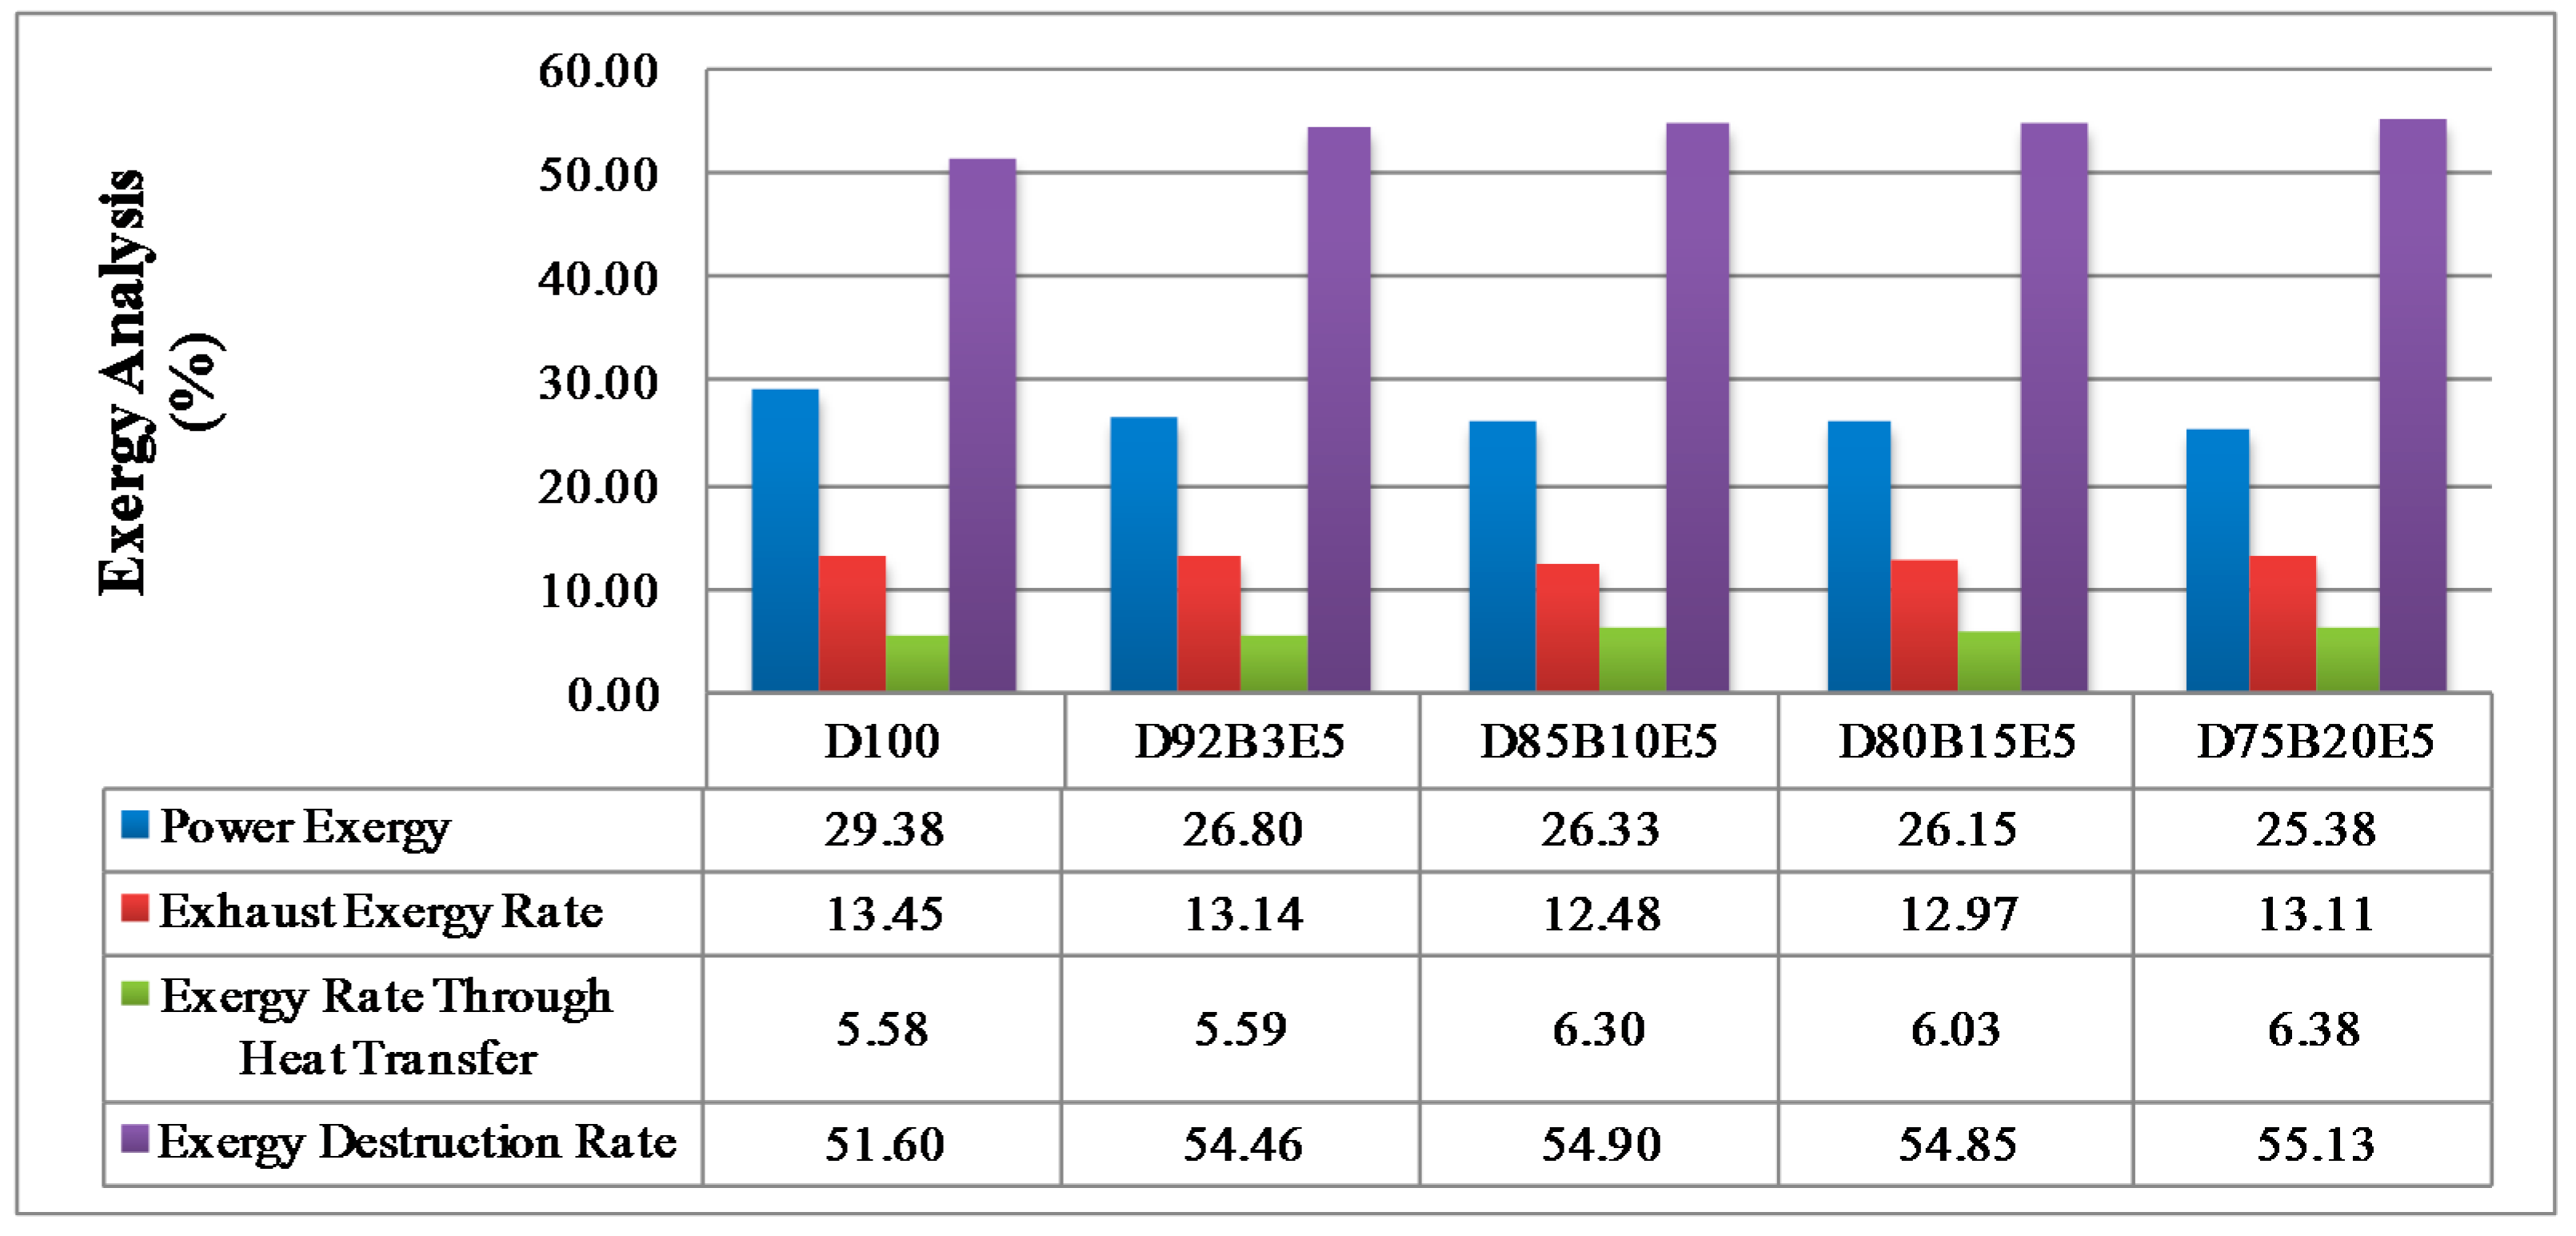
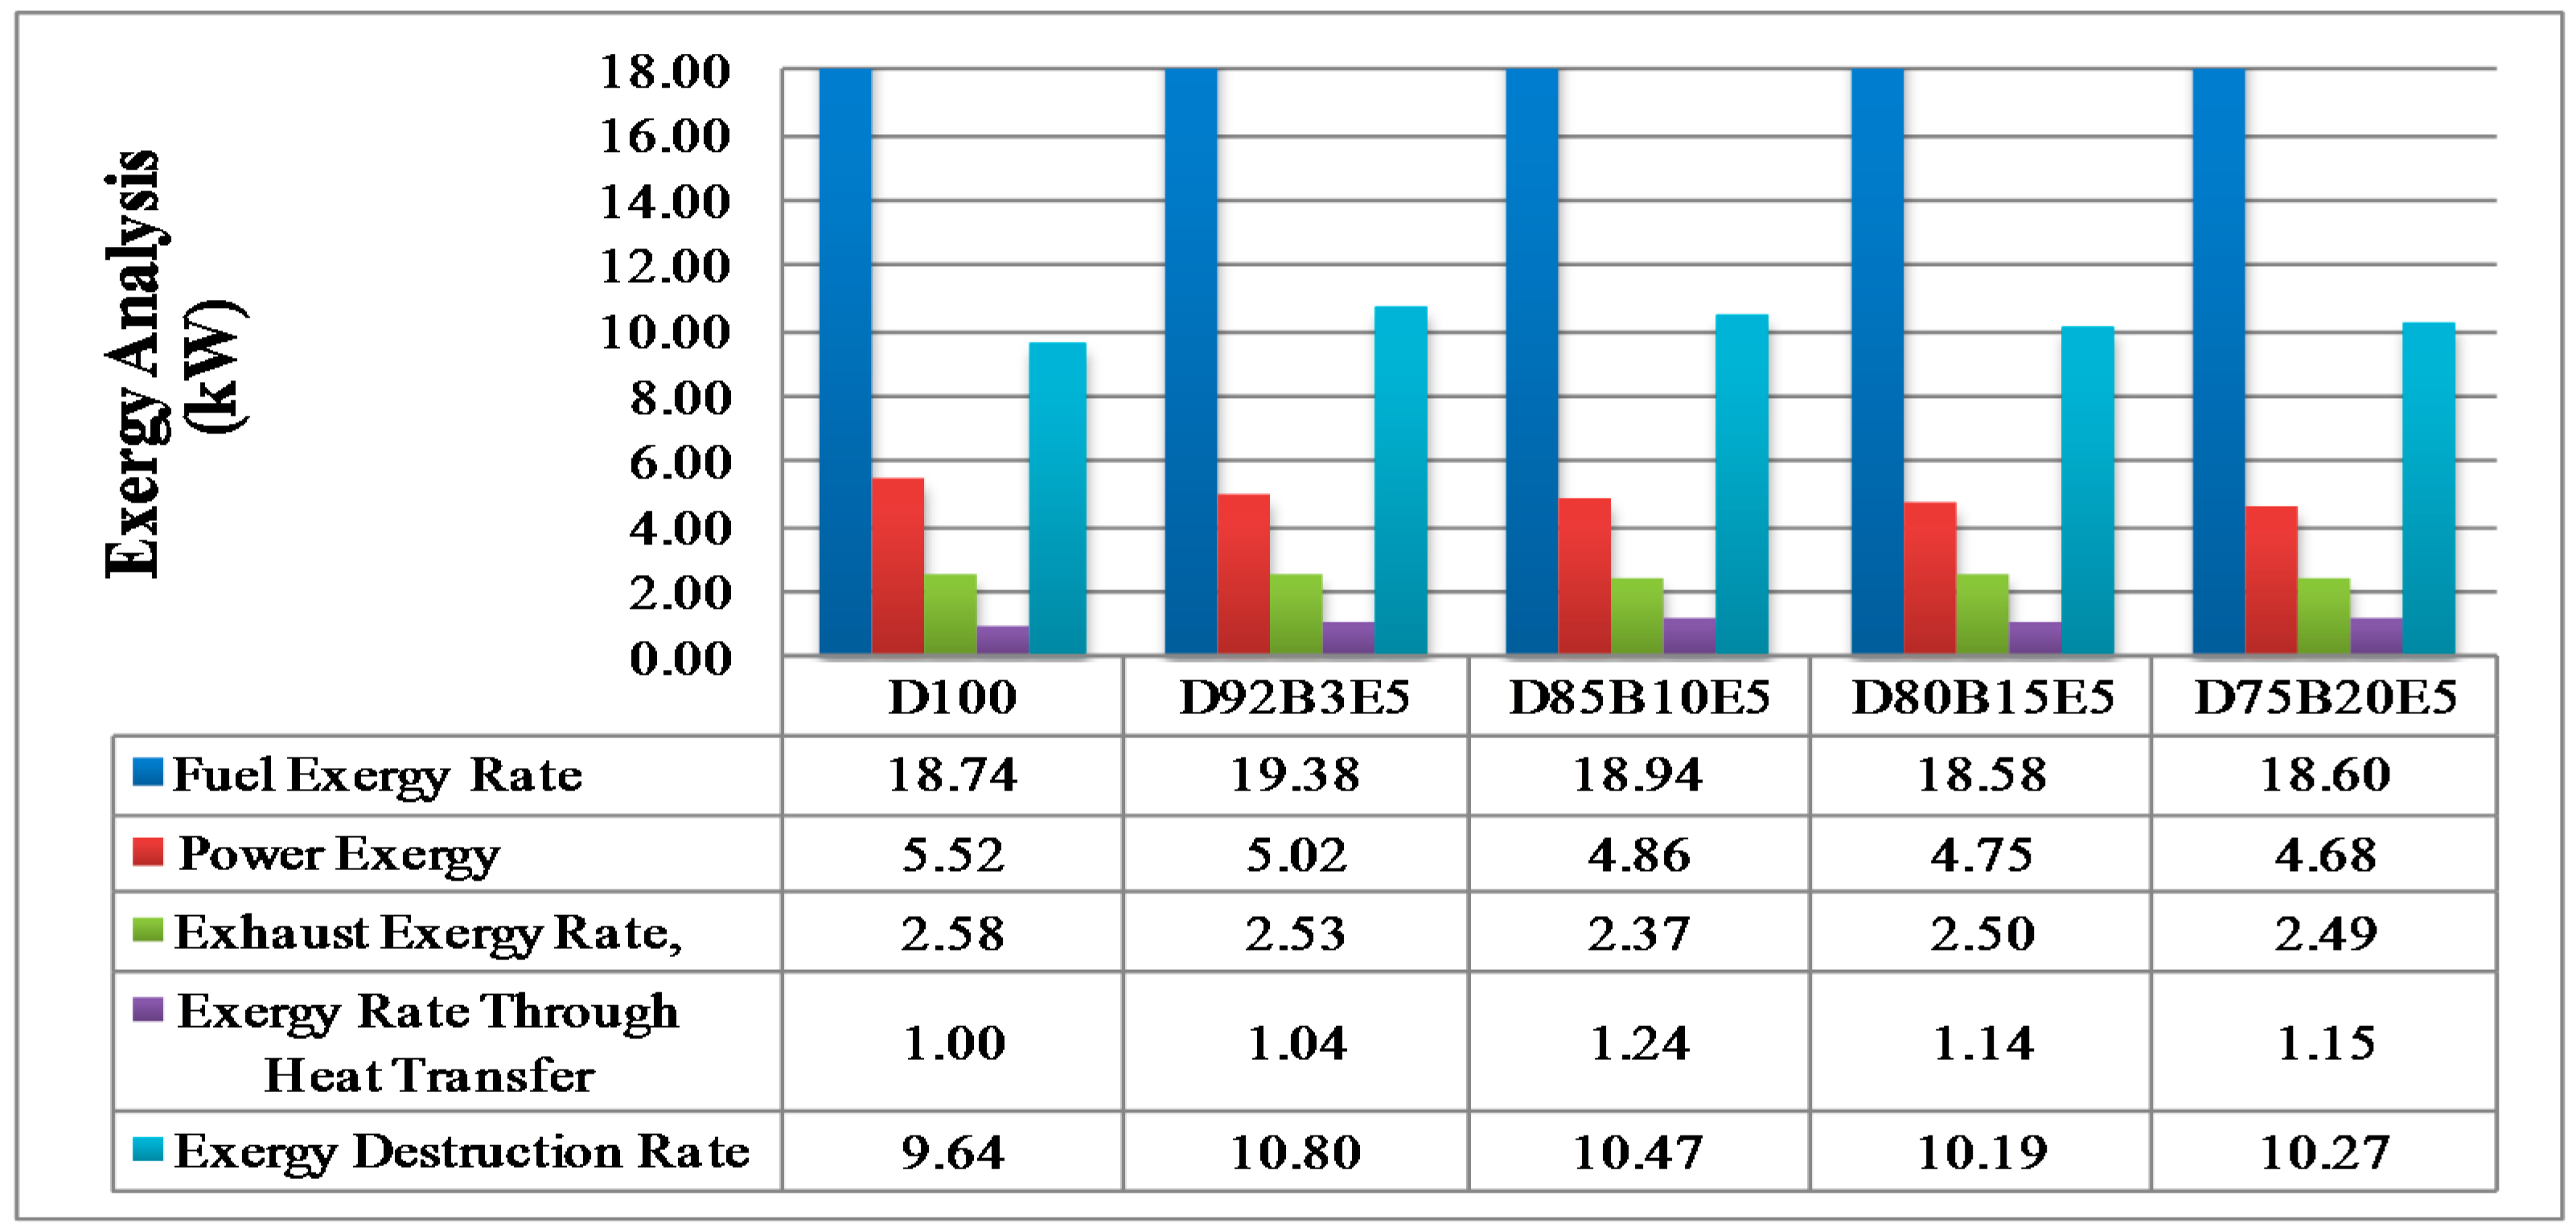
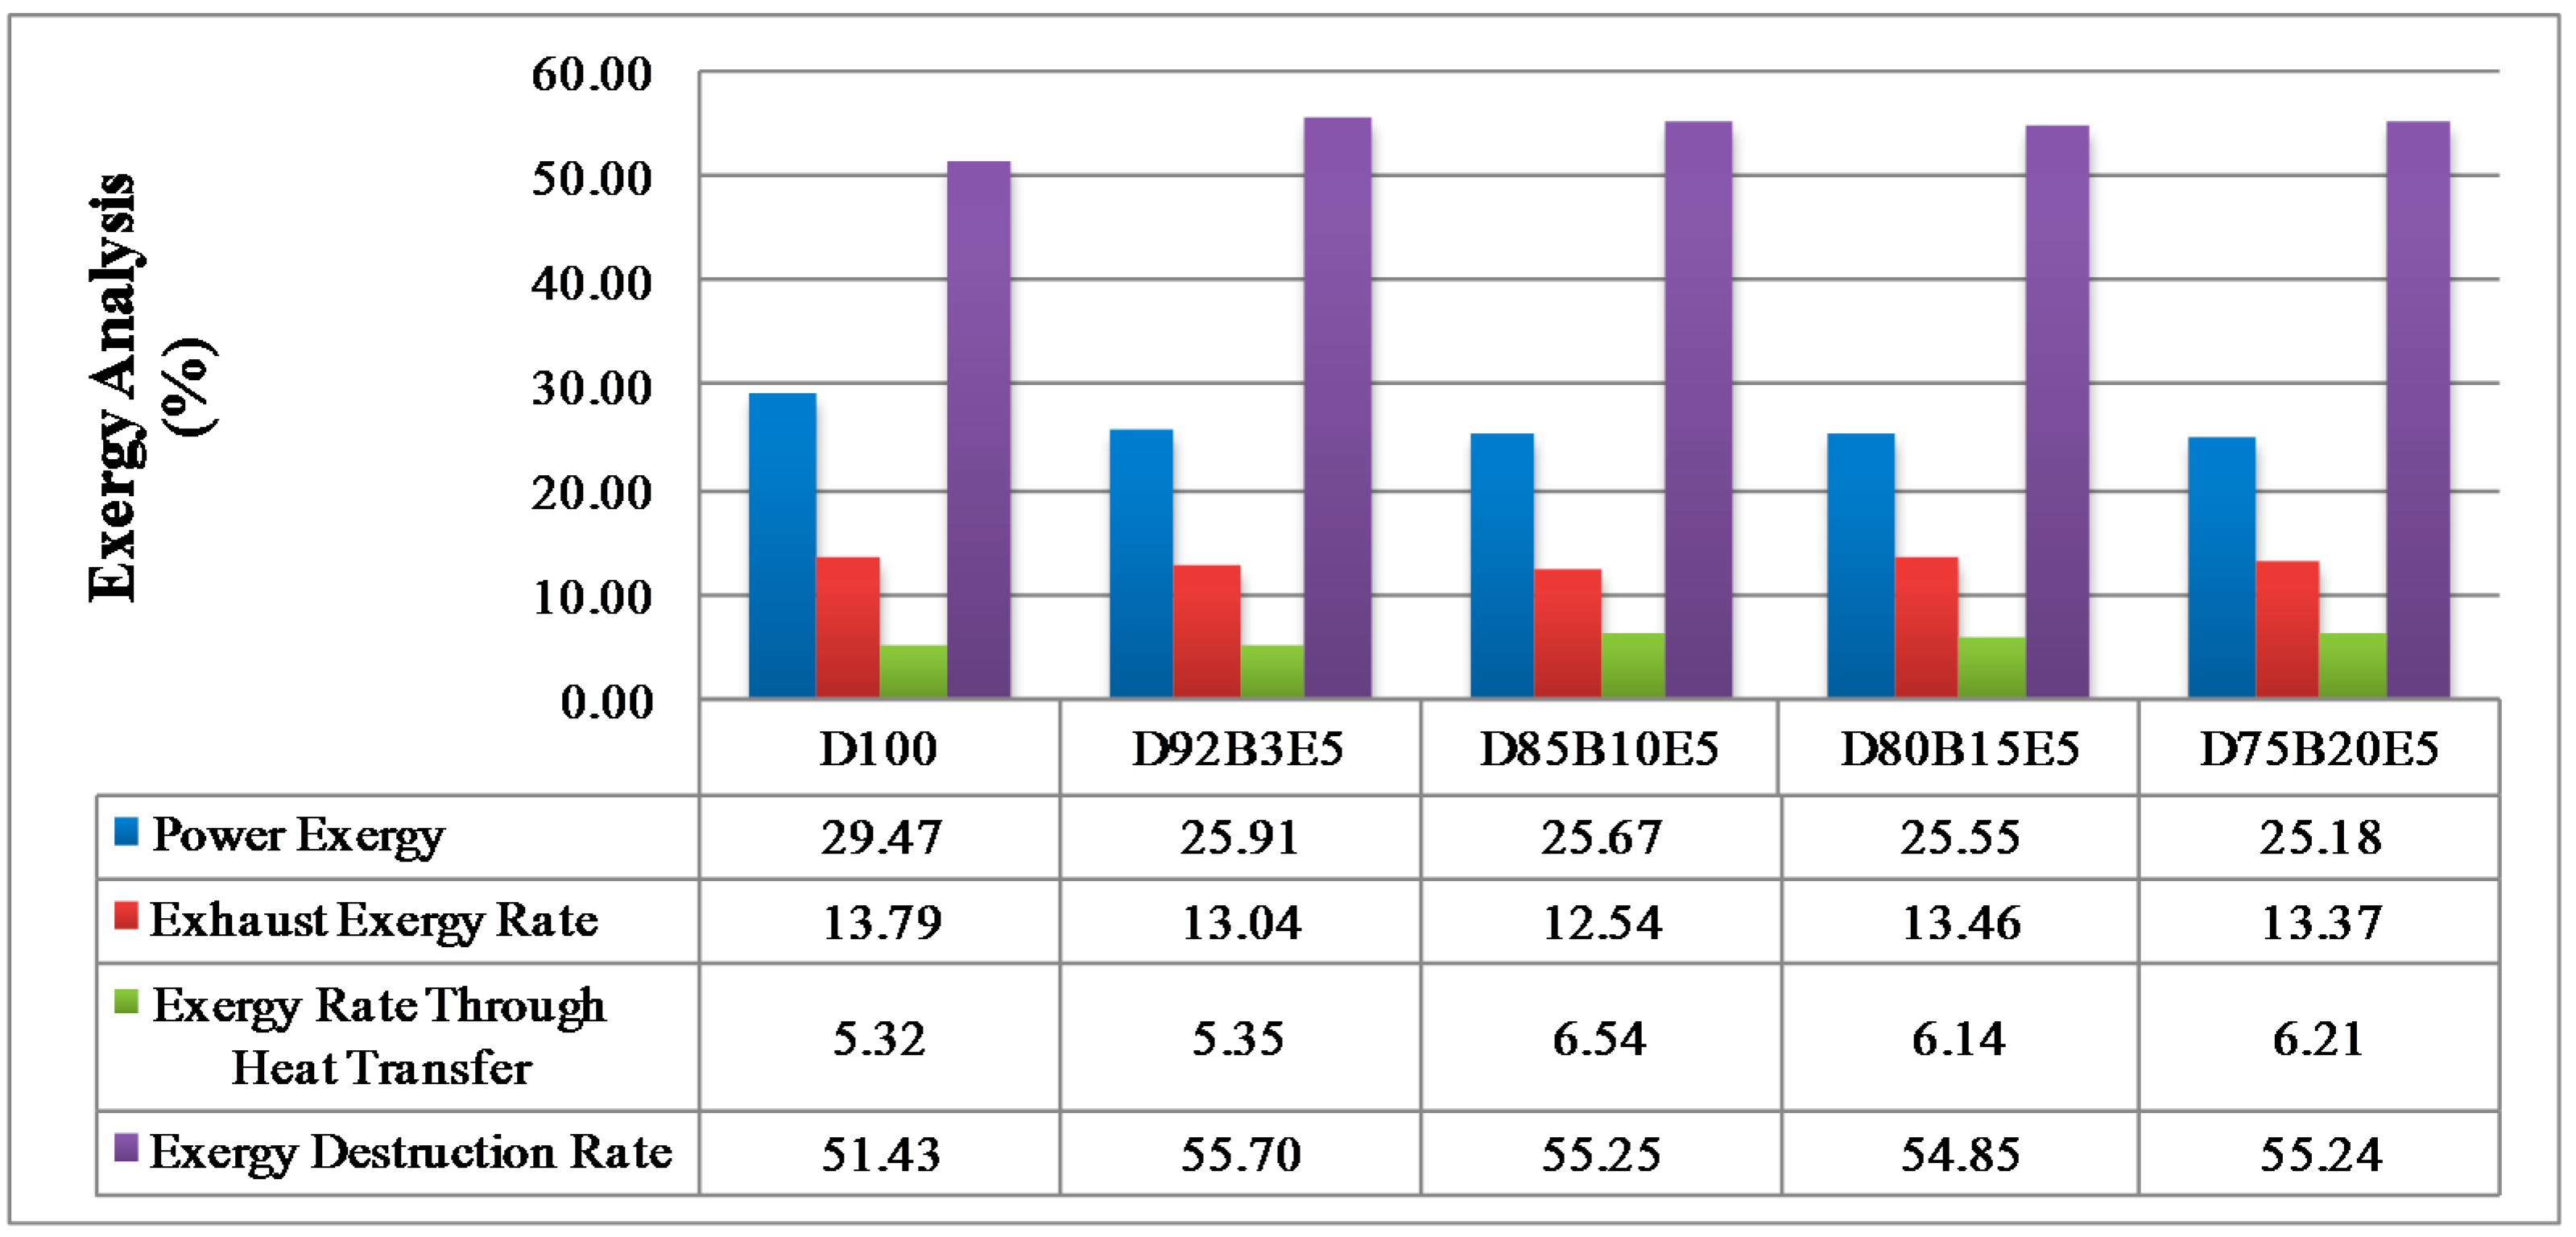
19] applied energy and exergy analyses to a diesel engine operated with two biodiesels made from soybean oil methyl ester (SME) and yellow grease methyl ester (YGME), petroleum diesel fuel and 20% blend of each biodiesel with petroleum diesel fuel. It was observed that the specific fuel consumption increased when using biodiesel. The most important term of exergy analysis is the destruction of exergy by irreversible processes; others following it are exergy losses due to the exhaust gas and heat transfer. Rakopoulos et al. [
20] researched computationally the effect on the terms of the availability balance of mixing hydrogen, which has the potential for increased second-law efficiency, into natural gas for a direct injection engine. Sekmen and Yilbaşi [
21] applied energy and exergy analysis to a direct injection diesel engine using petroleum diesel fuel and soybean oil methyl ester (SME). Rakopoulos and Kyritsis [
22] presented a theoretical study to calculate the combustion irreversibilities for a four-stroke, naturally-aspirated diesel engine operated with methane, methanol, and dodecane as fuels. In their study it was observed that lighter fuels result in less entropy than heavy fuels. A review study applied energy and exergy analyses to a direct injection diesel engine dual fuelled with petroleum diesel oil and biogas was carried out by Sorathia and Yadav [
3]. López et al. [
5] studied exergy analysis applied to a direct injection diesel engine operated with olive pomace oil biodiesel/diesel fuel blends. Ramos da Costa et al. [
4] investigated theoretically and experimentally the performance characteristics of a dual diesel engine using natural gas and diesel in terms of both energy and exergy analyses.
Considering all of these studies, it is anticipated that this study will contribute to the literature by applying exergy analysis to a diesel engine using biodiesel made from safflower oil, diesel and bioethanol blends. We aimed to comparatively investigate the effects of different fuel blends on the energy and exergy analysis using a single cylinder, four-stroke diesel engine. It was also our aim to determine in which way the exergy terms are affected by the engine speed. The blends prepared by mixing biodiesel and diesel in different proportions with 5% bioethanol were identified as D92B3E5 (92% diesel, 3% biodiesel and 5% bioethanol), D85B10E5 (85% diesel, 10% biodiesel and 5% bioethanol), D80B15E5 (80% diesel, 15% biodiesel and 5% bioethanol), D75B20E5 (75% diesel, 20% biodiesel and 5% bioethanol), respectively. Tests were carried out for each fuel blend for twelve different engine speeds between 1000–3000 rev/min. Energy analysis terms such as fuel energy, thermal efficiency, energy losses, brake power and exergy analysis terms such as fuel exergy, exergetic efficiencies, exergy losses, exergetic brake power, irreversibilities and exergy destructions of the combustion process for the diesel engine have been computed by determining the balances of energy and exergy rate.
There are many studies about the exhaust emissions, combustion and performance of internal combustion engines which use various fuels, including diesel, biodiesel and bioethanol, in terms of the first law of thermodynamics, but our assessments of these fuels, especially as a mixture in terms of the second law of thermodynamics, separate this study from the others.
2. Materials and Methods
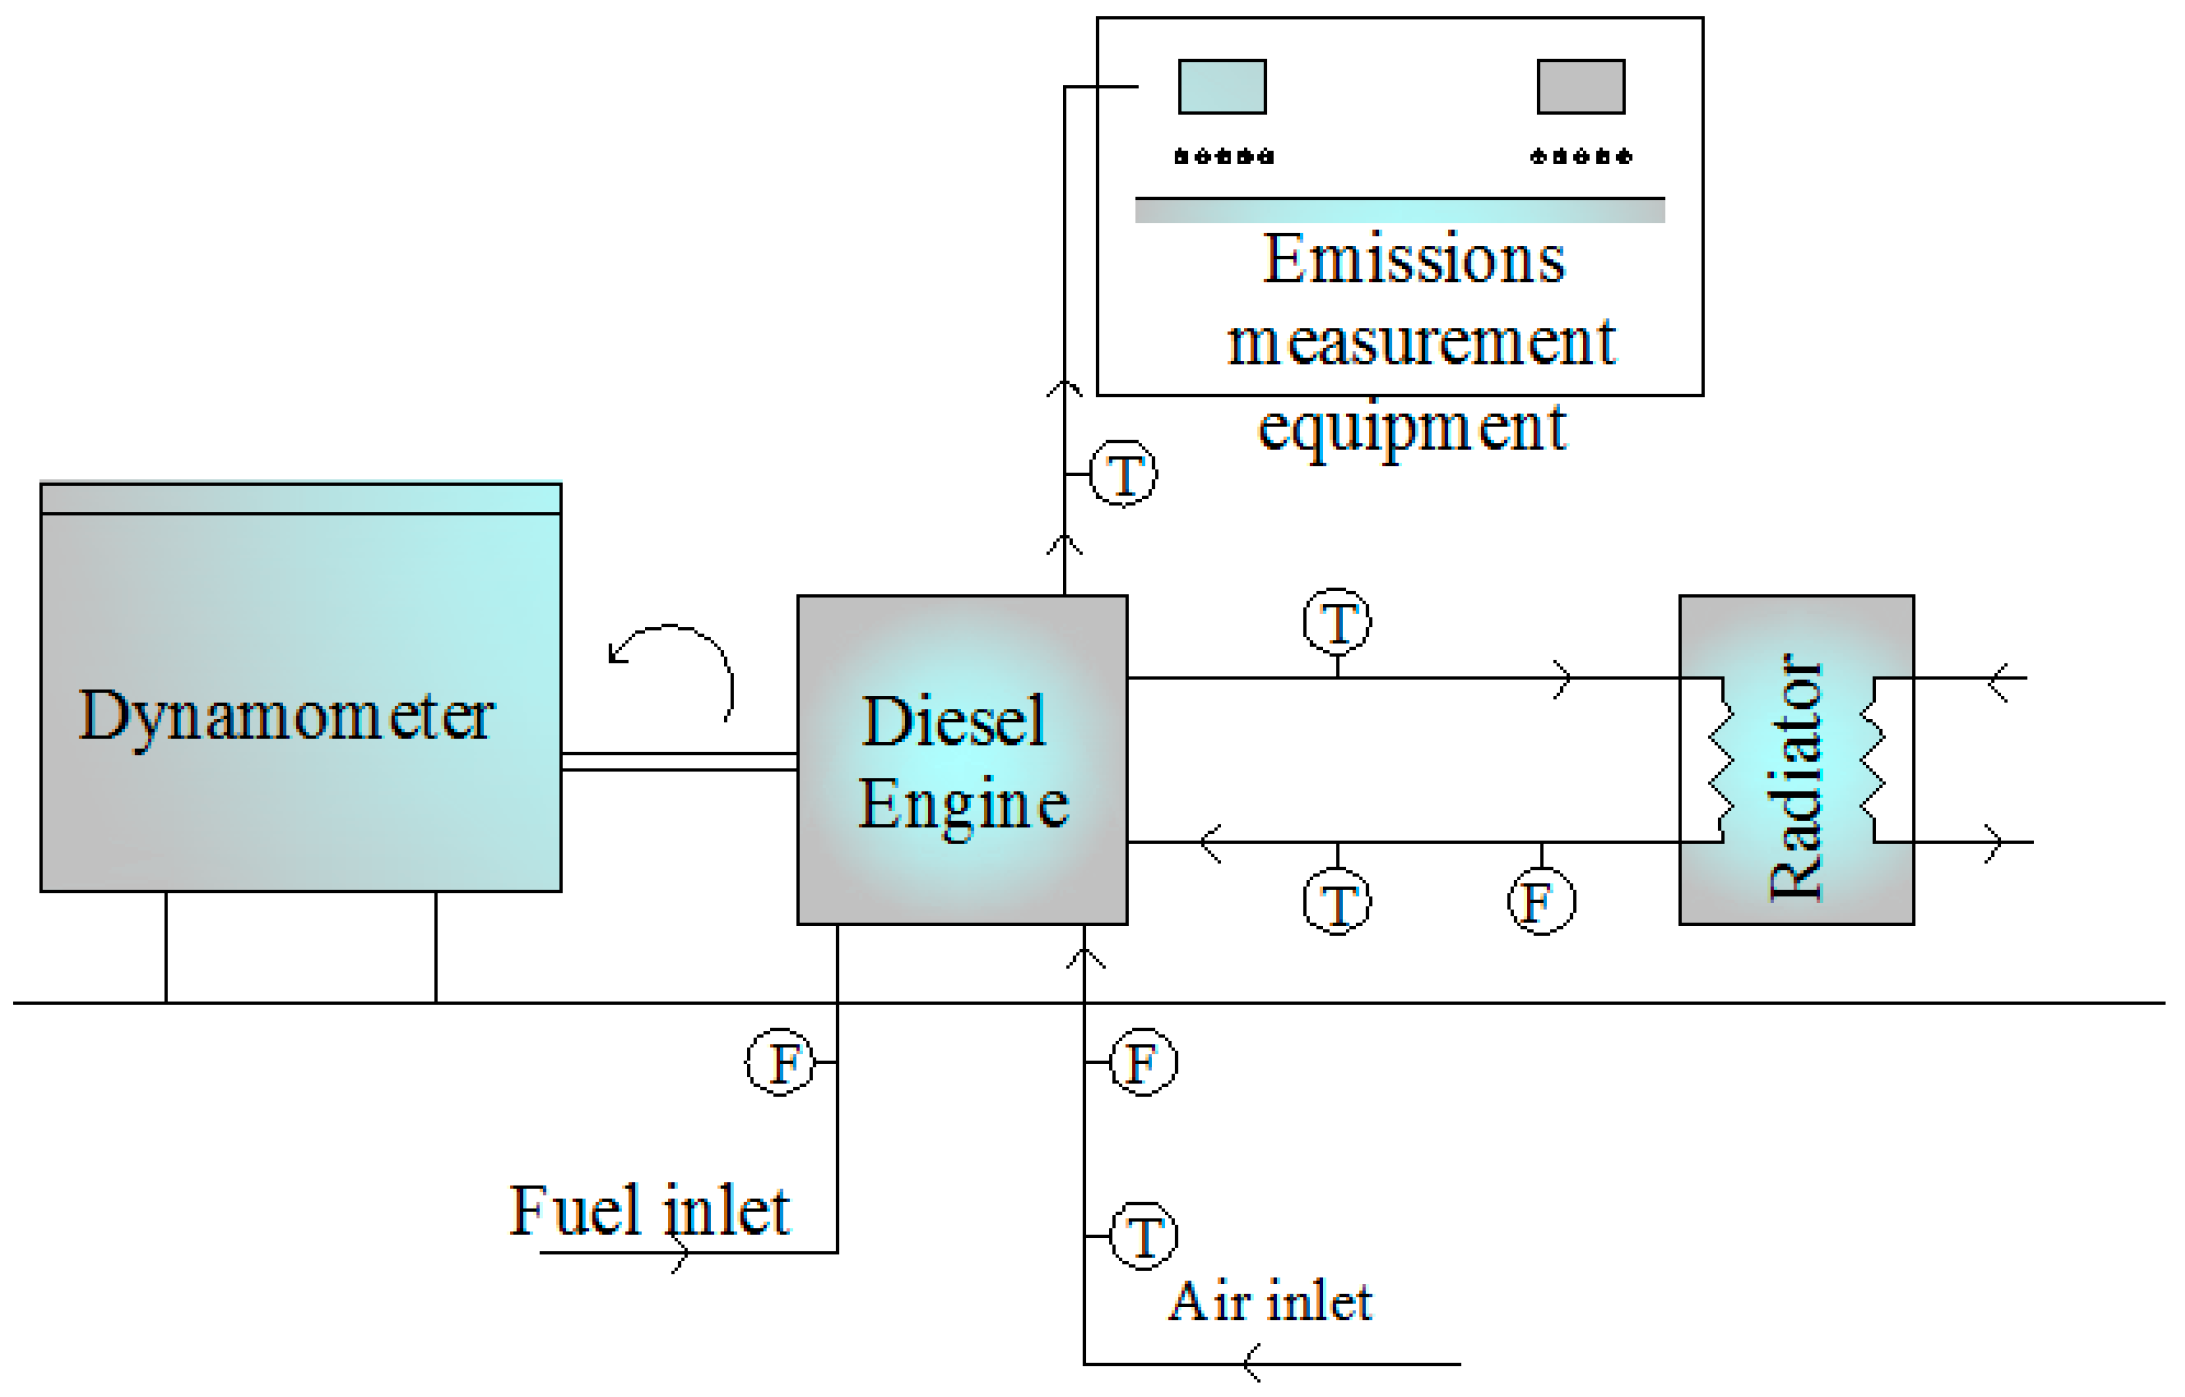
A schema of the experimental setup which consists of a diesel engine connected with a hydraulic dynamometer, emissions measurement equipment, radiator, temperature measurement devices, flow meters and control panel is shown in
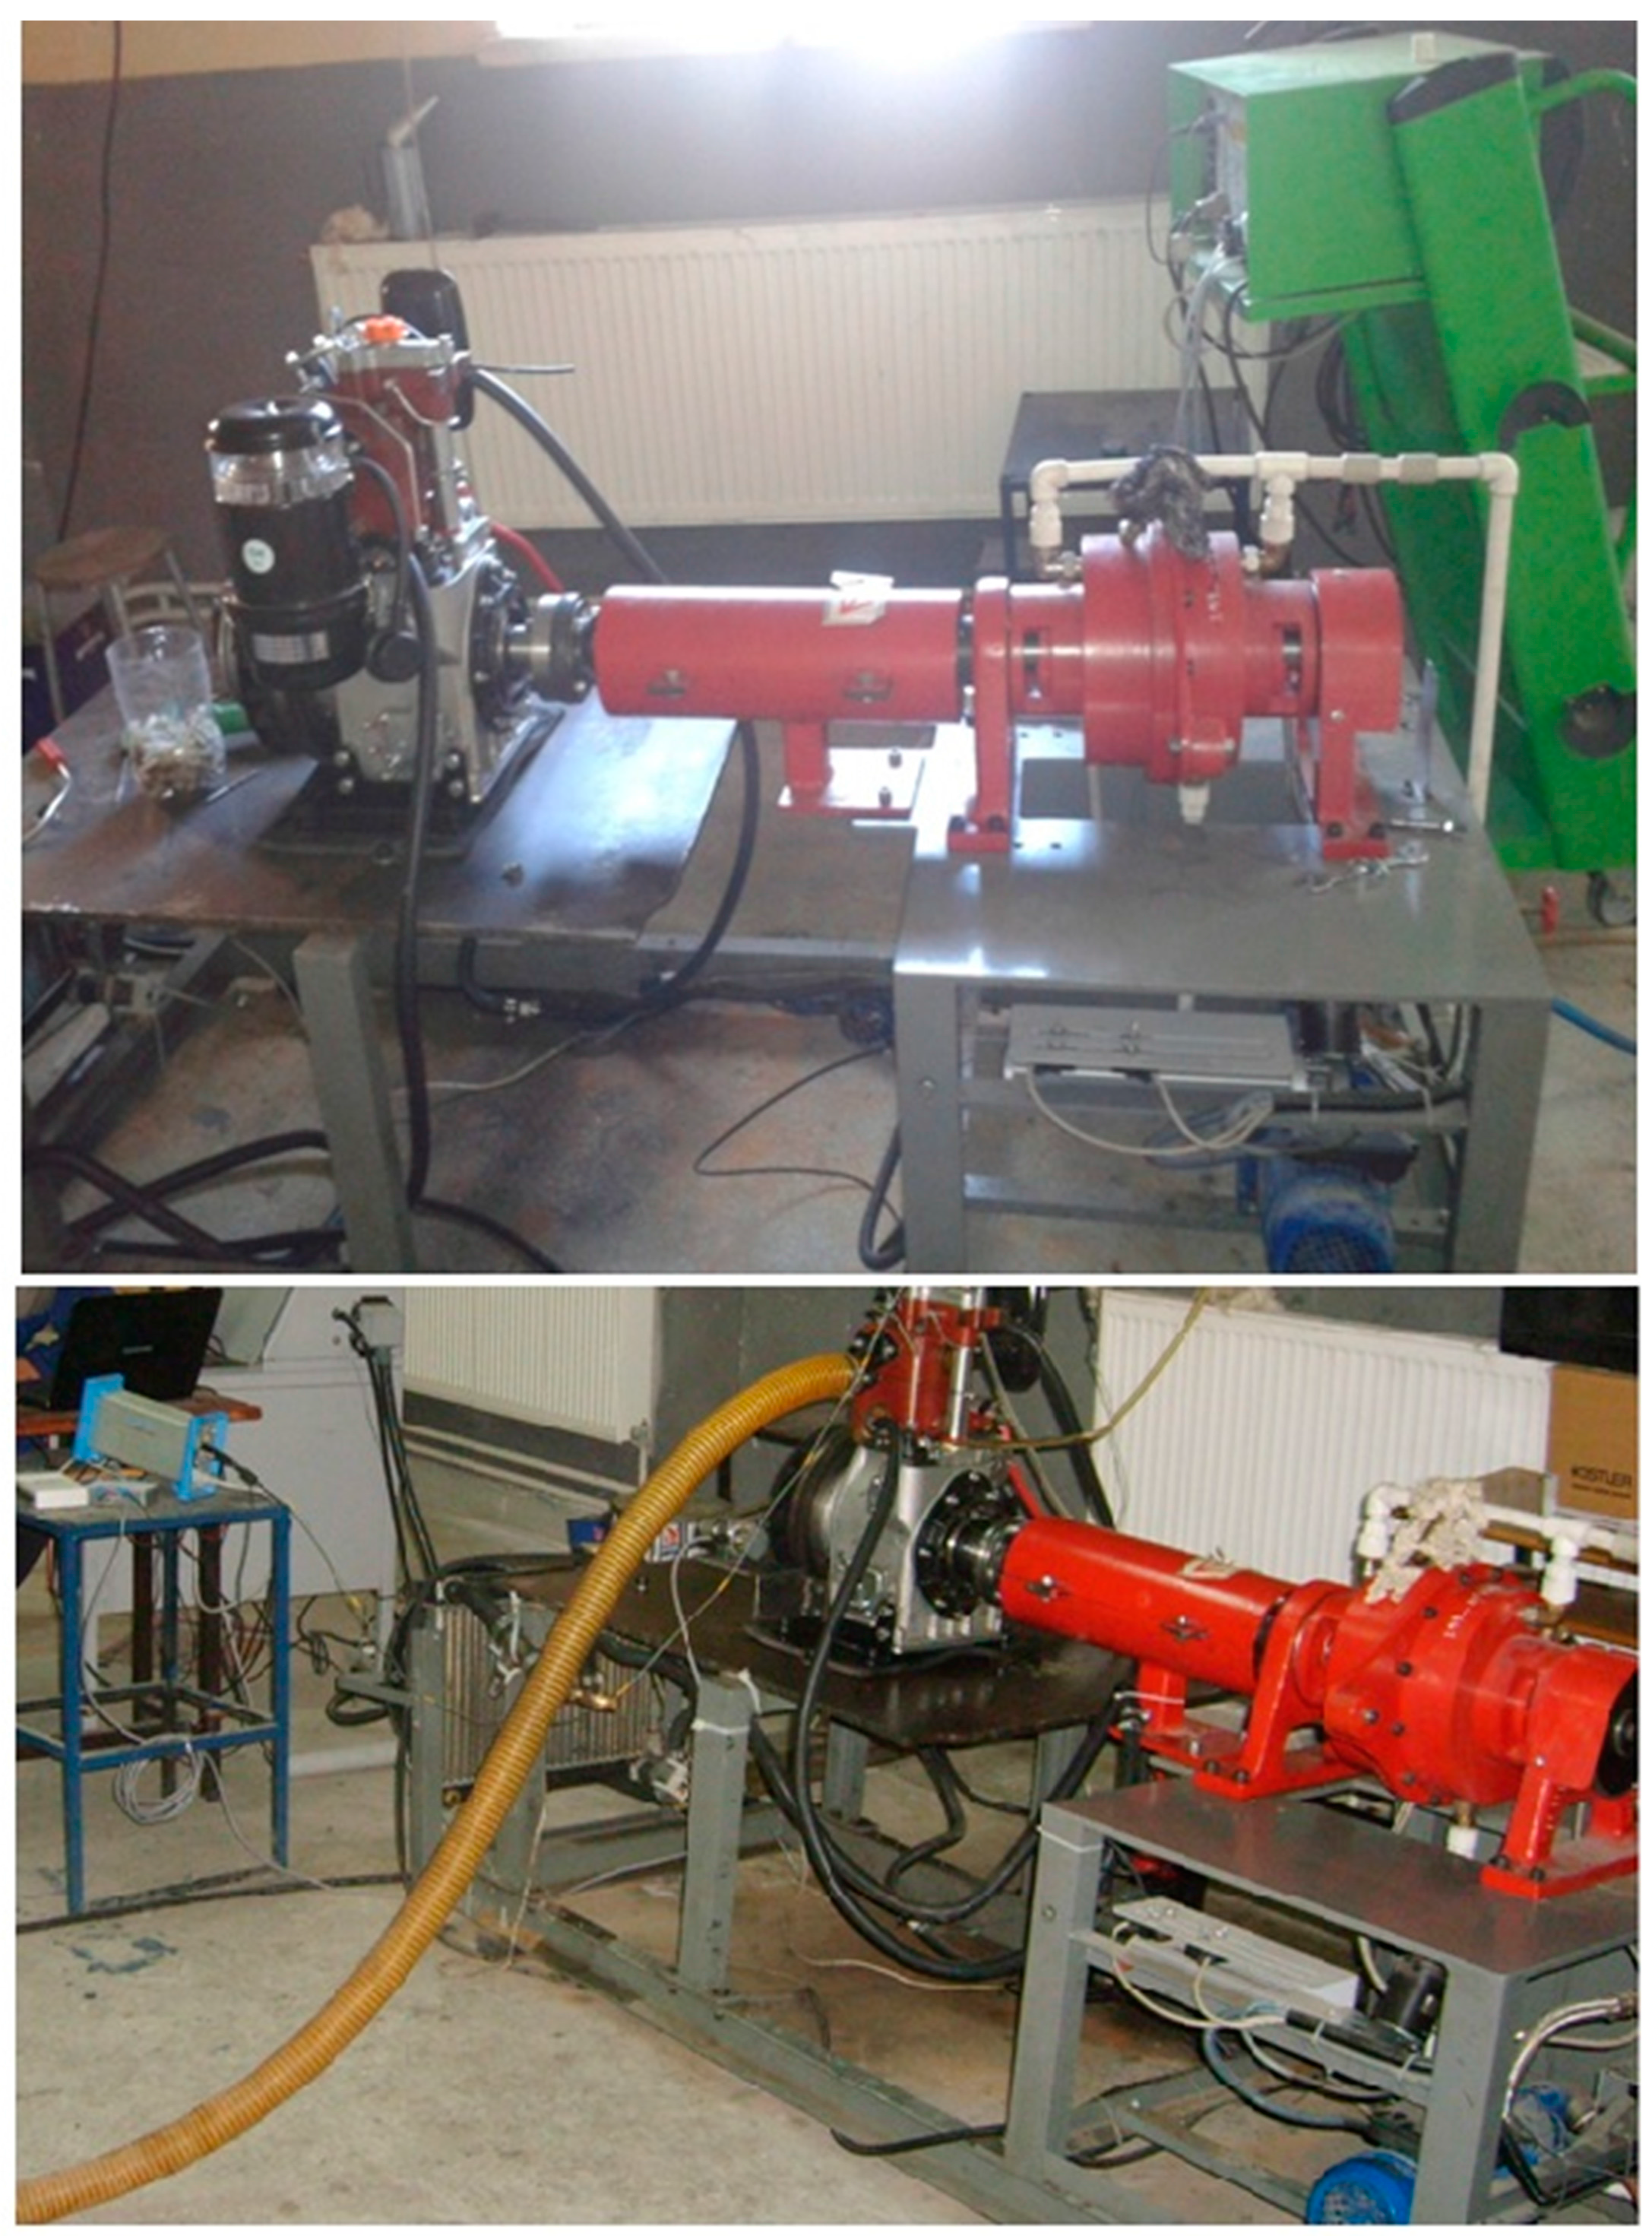
Figure 1. A picture of the experimental setup is also given in
Figure 2. A single cylinder, four-stroke, water cooled, direct-injection Antor 3LD510 diesel engine (Anadolu Motor Company, Kocaeli, Turkey) with maximum engine brake power of 9 kW at 3300 rev/min was used during the experiments.
The bore of test engine was 85 mm, the stroke was 90 mm, and the compression ratio was 17.5:1. The speed range of the hydraulic dynamometer is 0–6500 rev/min and its torque range is 0–450 Nm. A flanged, sharp corner-type orifice plate was placed on the intake manifold line to measure air consumption. The engine speed was measured with a speed sensor and the flow rate of cooling water was measured with a flow meter. A fuel measurement unit consisting of a 2.5 liter tank and a load cell capable of measuring 0–3 kg were used for the determination of the fuel consumption. Air temperature, inlet and outlet temperatures of the cooling water and exhaust temperature were measured with K-type thermocouples and the values were read from the control panel. Carbon monoxide (CO), carbon dioxide (CO2) were determined volumetrically (accuracy ±0.01), and nitrogen oxides (NO) and unburned hydrocarbon (HC) in units of ppm (accuracy ±1), were measured using an exhaust gas analyzer. Tests were initiated after the engine reached its operating temperature and tests were conducted at 1400 rev/min and 100% load using D100 (the pure diesel fuel), D92B3E5, D85B10E5, D80B15E5 and D75B20E5. The blends rates were selected by reference to previous studies in the literature.
The biodiesel for the present study was produced at the Biodiesel Laboratory of the Department of Agricultural Machinery, Selcuk University. It was produced by transesterification using as raw material safflower, an oilseed crop that contains 20%–45% oil, [
23]. Sodium hydroxide was used as catalyst for the transesterification process. Bioethanol as monohydric alcohol was provided by the Sugar Refinery in Konya. Their chemical properties are presented in
Table 1. These are obtained by fuels analysis tests carried out by the TUBITAK Marmara Research Center Energy Institute in Gebze.
2.1. Energy Analysis
Energy analysis provides a calculation of the internal energy variation as a function of energy transfers across the boundaries as heat or work and the enthalpy which is related to the mass flow passing these boundaries [
7]. Before applying it to the test engine, the following assumptions must be made to simplify the calculations:
The engine is in steady-state condition.
It is assumed that the system is an open system and reference state is defined as T0 = 293 K and P0 = 1 atm.
The combustion air and exhaust gases are ideal gas mixtures.
The potential and kinetic energy effects of the incoming fluid streams and outgoing fluid streams are ignored [
2].
Mass balance for the control volume in steady state condition can be written as:
where
represents the inlet flow rate of the mass that consists of air and fuel and
represents the of the outlet mass consisting of exhaust gases considering that fuel enters the engine, with mass flow rate
and is mixed with air
to form
.
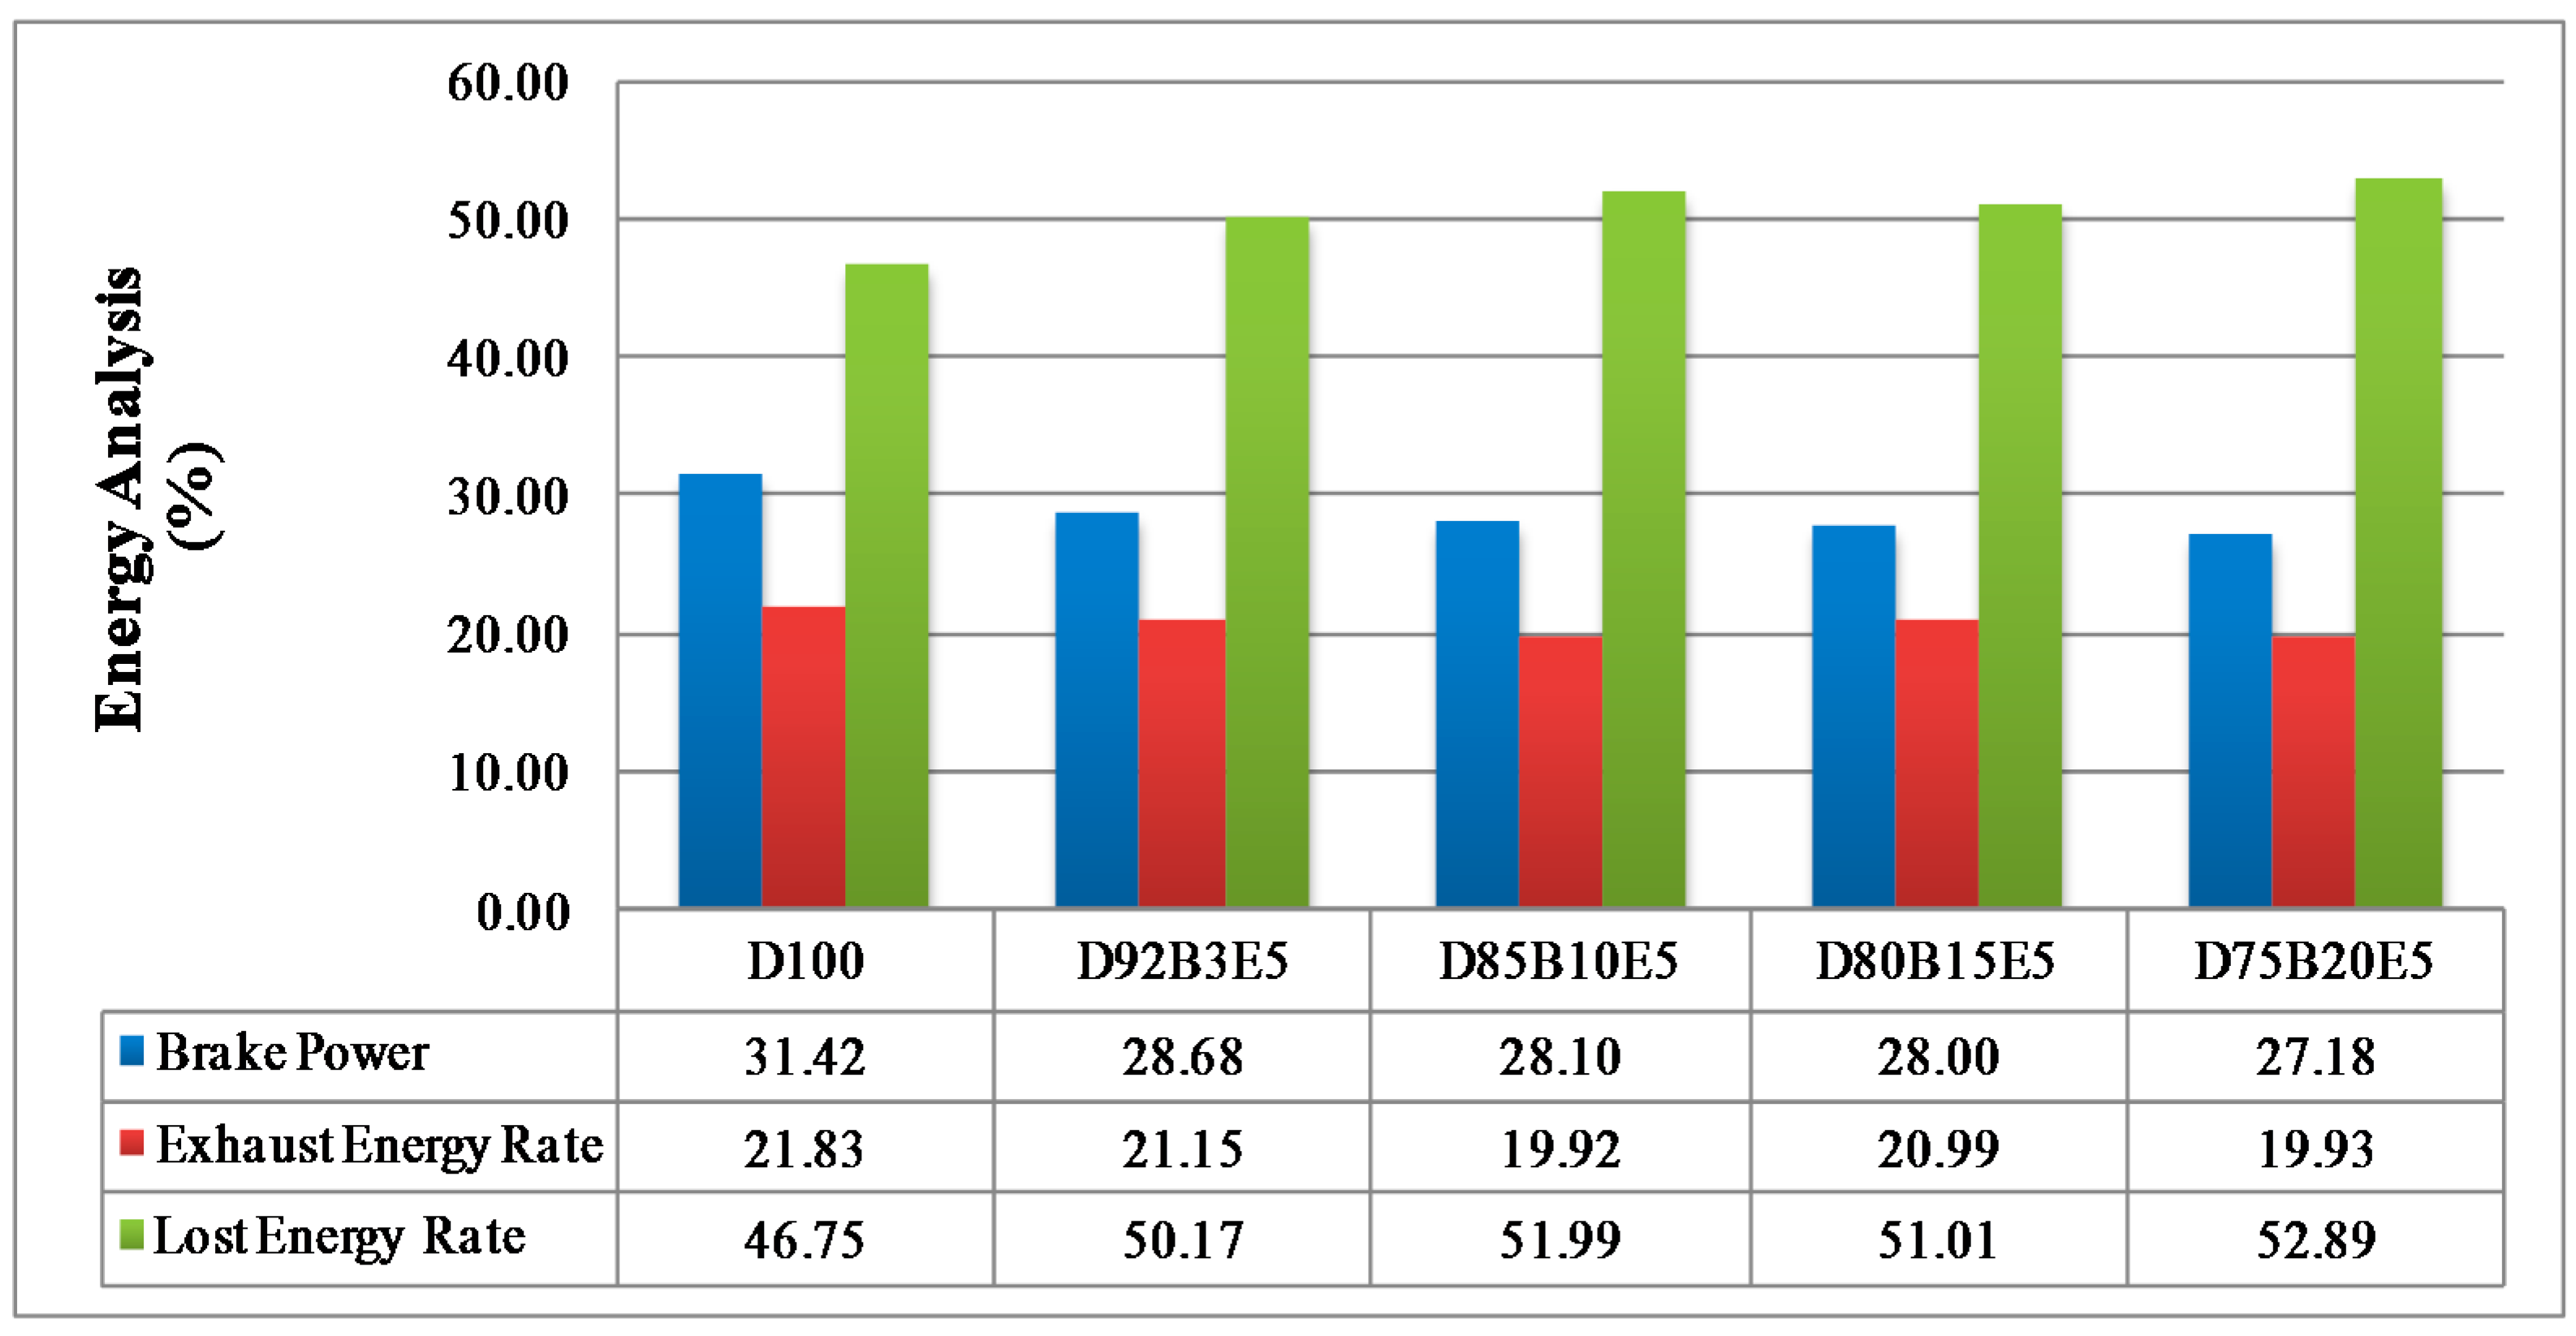
Energy balance for the control volume in steady state conditions—kinetic and potential energy being neglected—is given by Equation (2) in the general sense:
where the subscripts
in and
out point out the incoming-outgoing fluid streams respectively,
is the mass flow rate;
h is the specific enthalpy. In addition,
indicates the net heat transfer rate and
indicates the brake power. When the energy balance is revised for the test engine by considering that the engine generates brake power and some heat produced by combustion is transferred to the environment, Equation (3) can be written, where
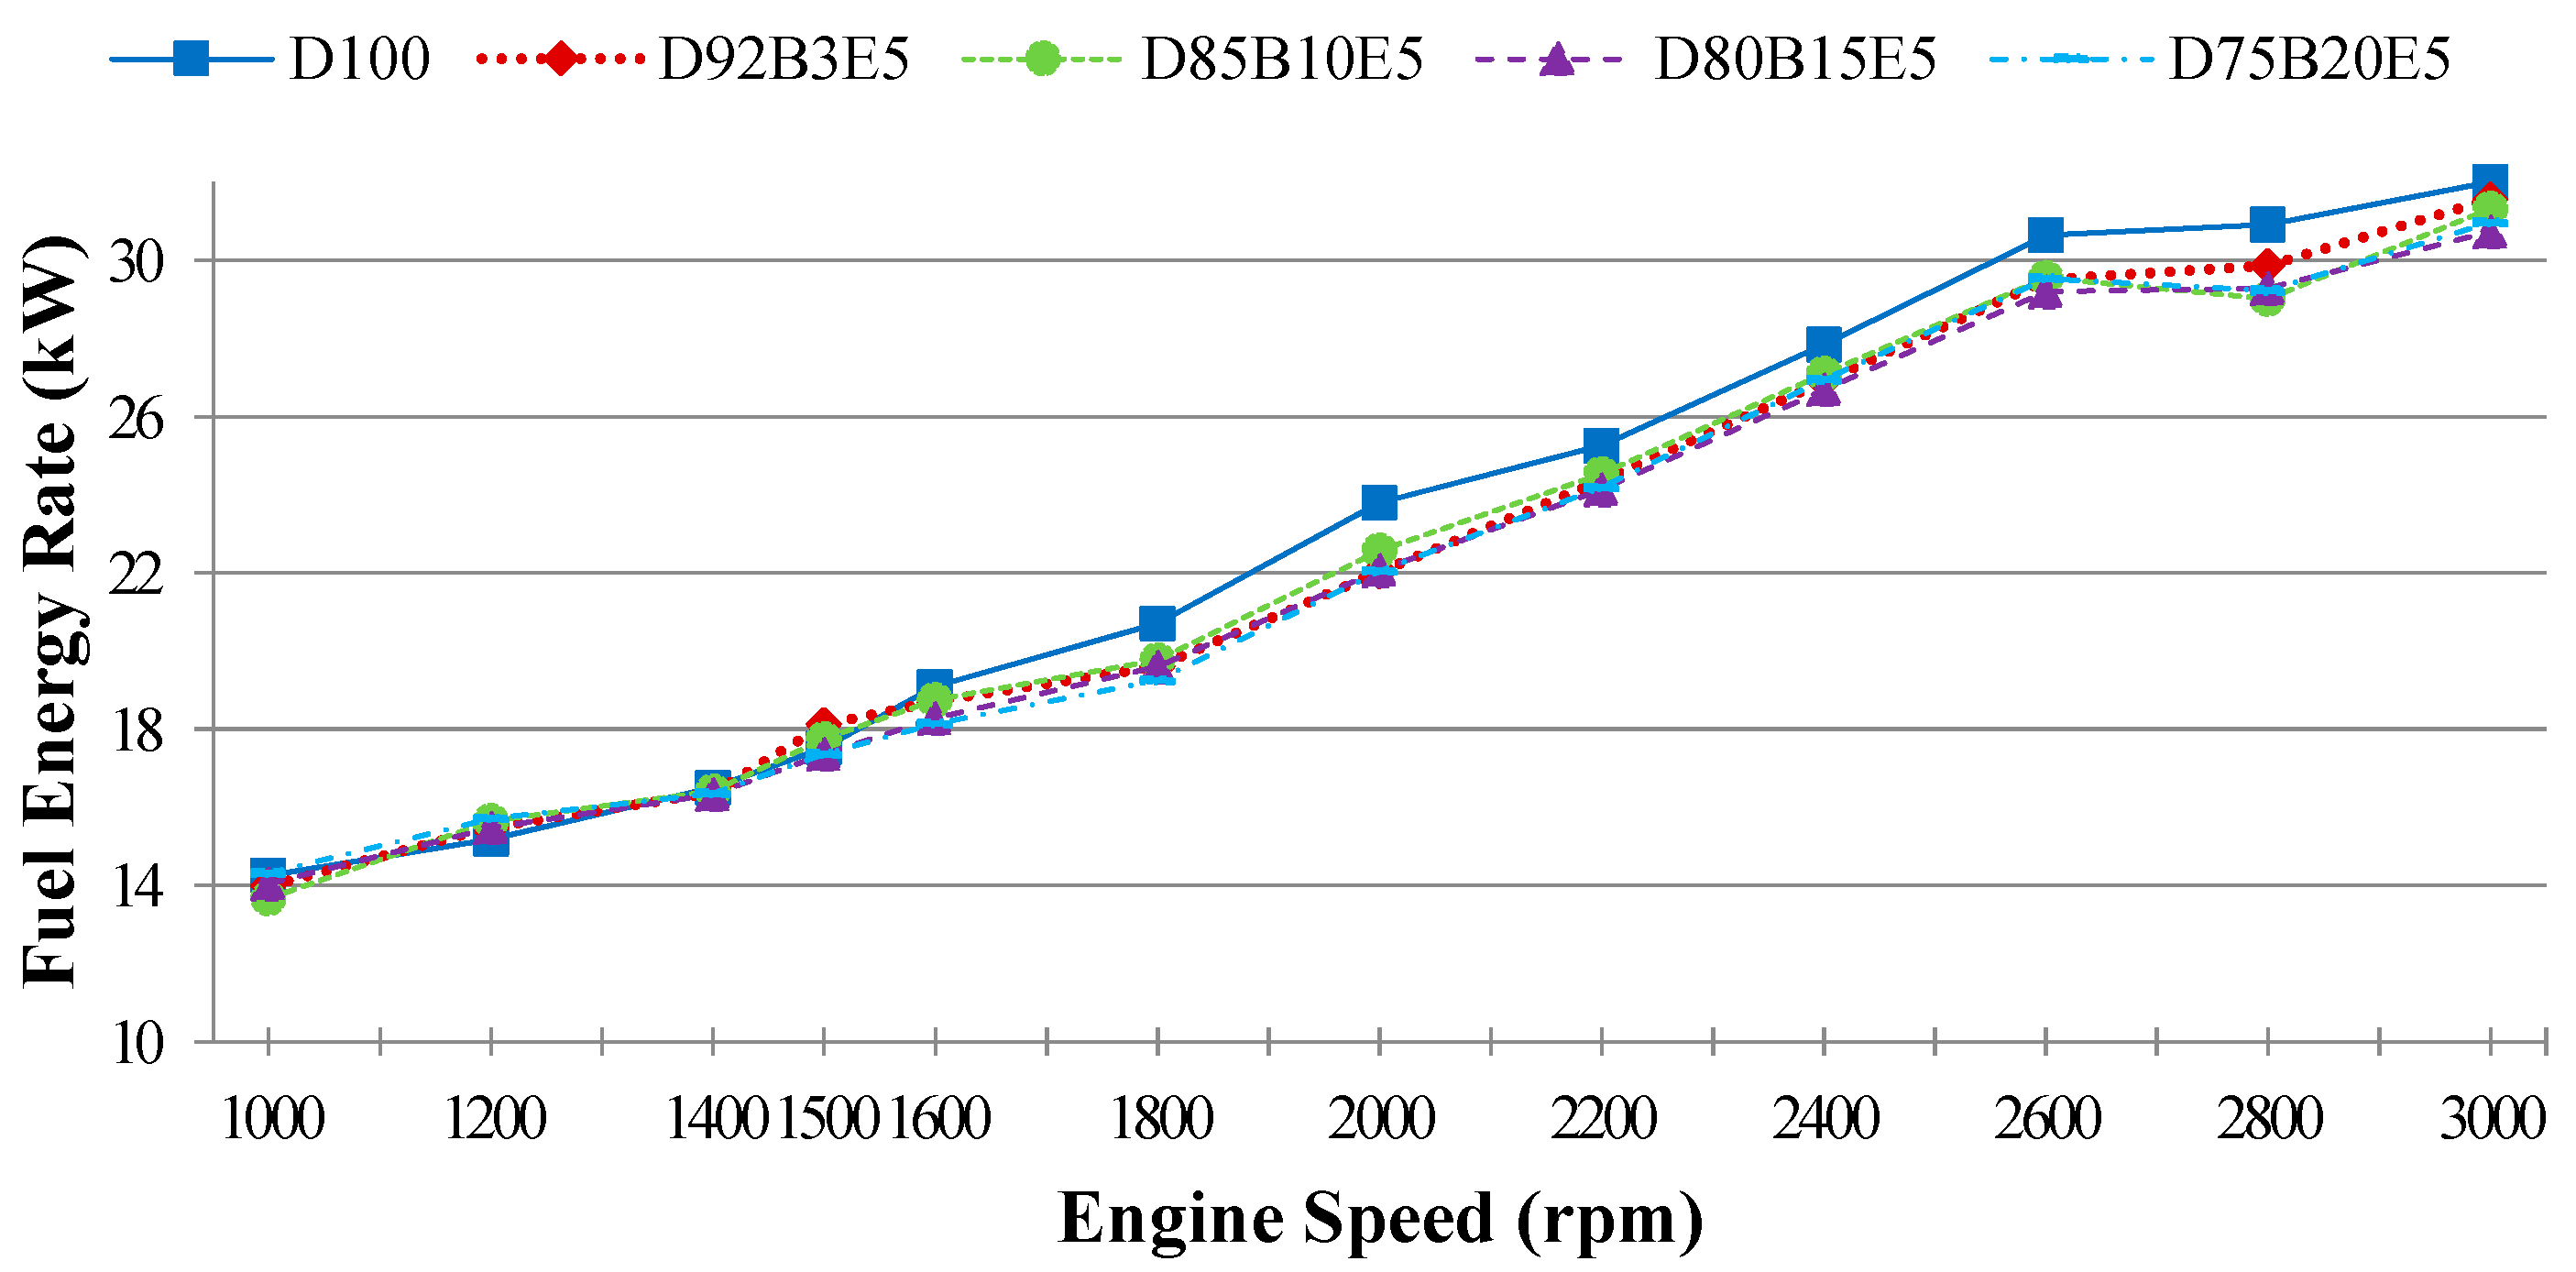
is the fuel energy rate,
is the exhaust energy rate,
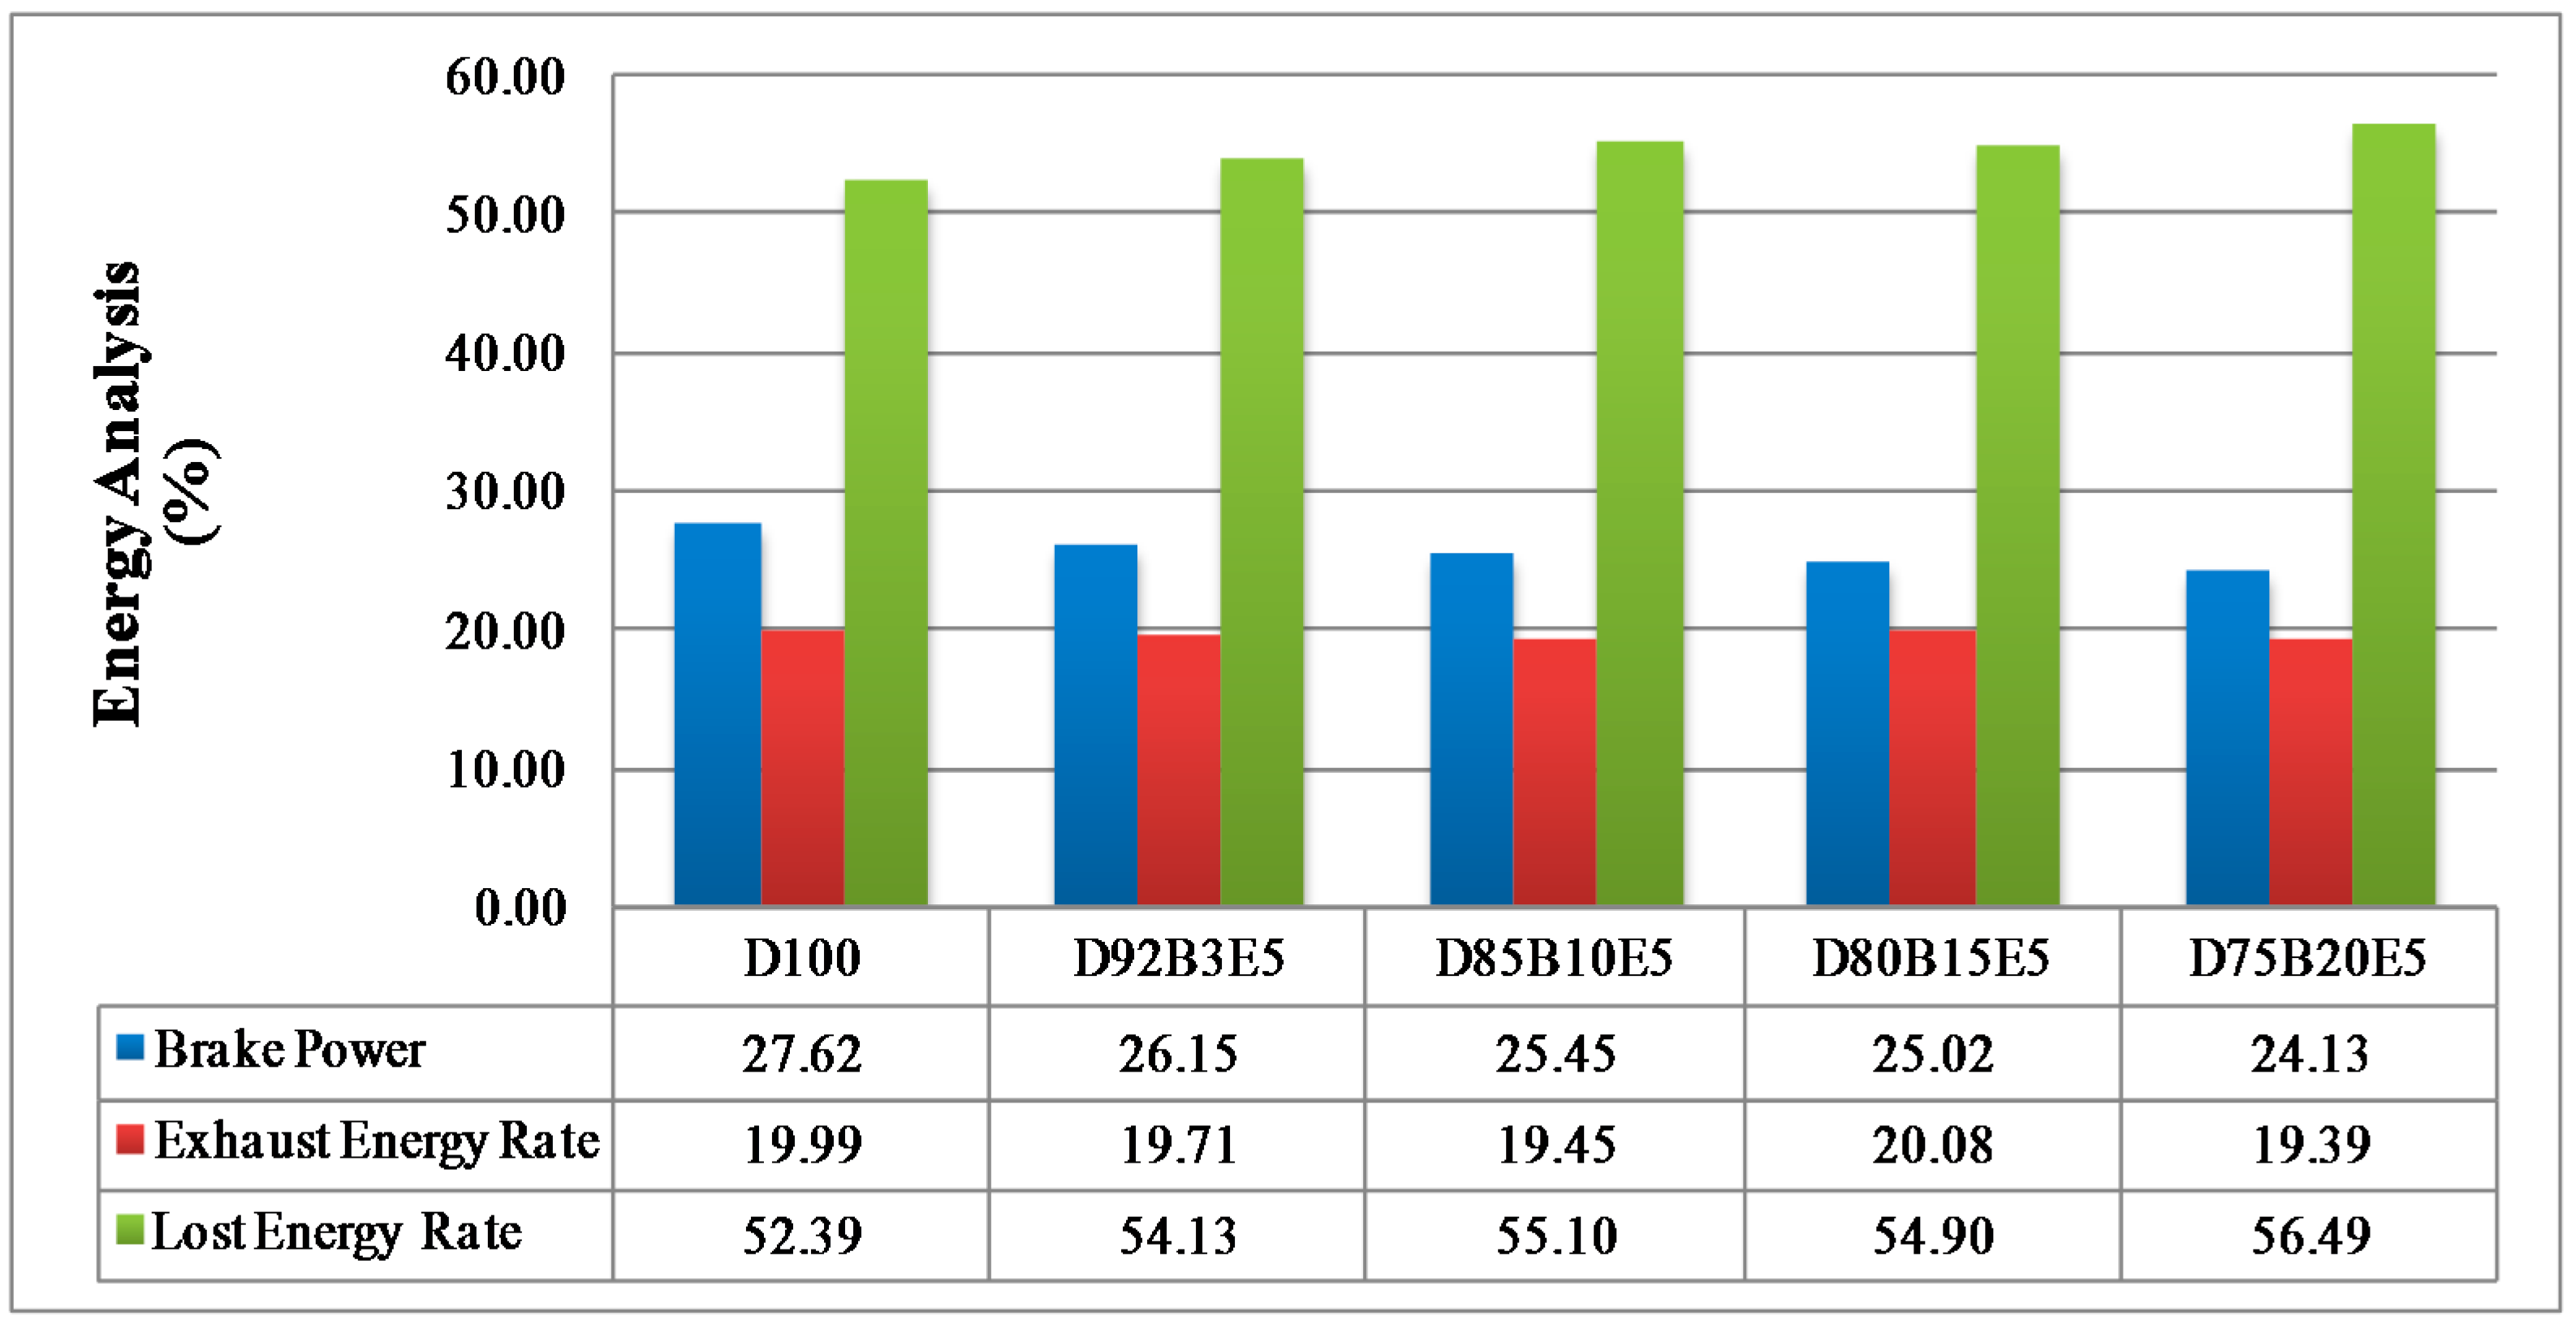
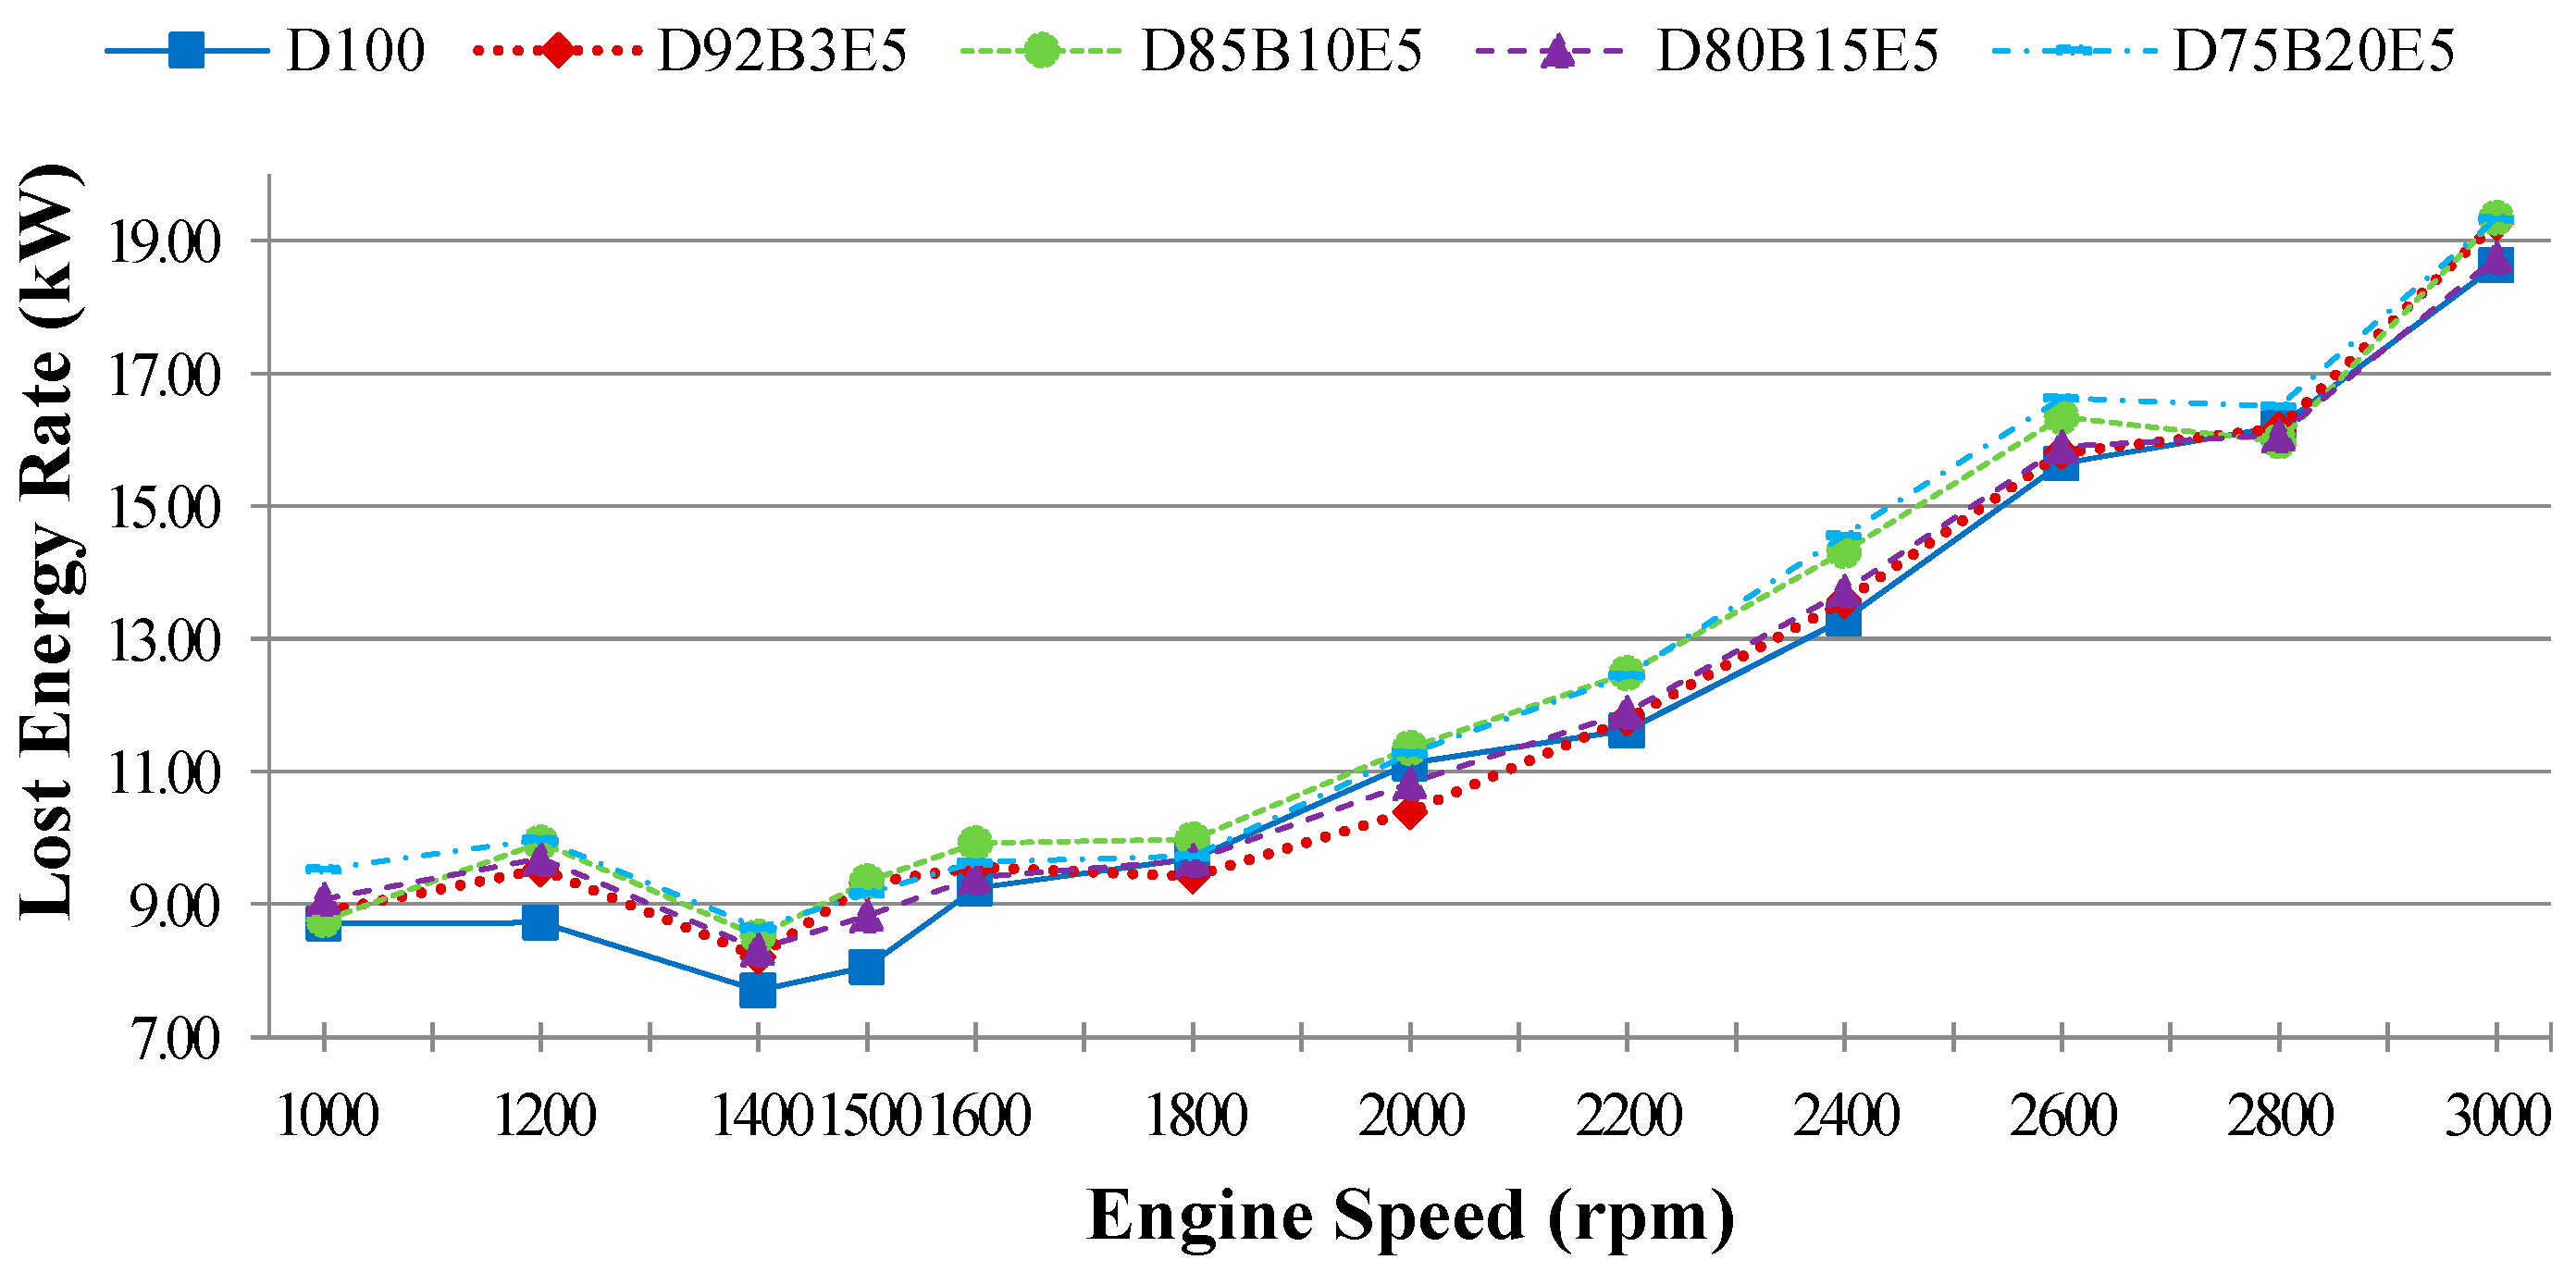
is the lost energy rate which is transferred to the environment by other ways such as cooling, lubricating, heat transfer except for the exhaust:
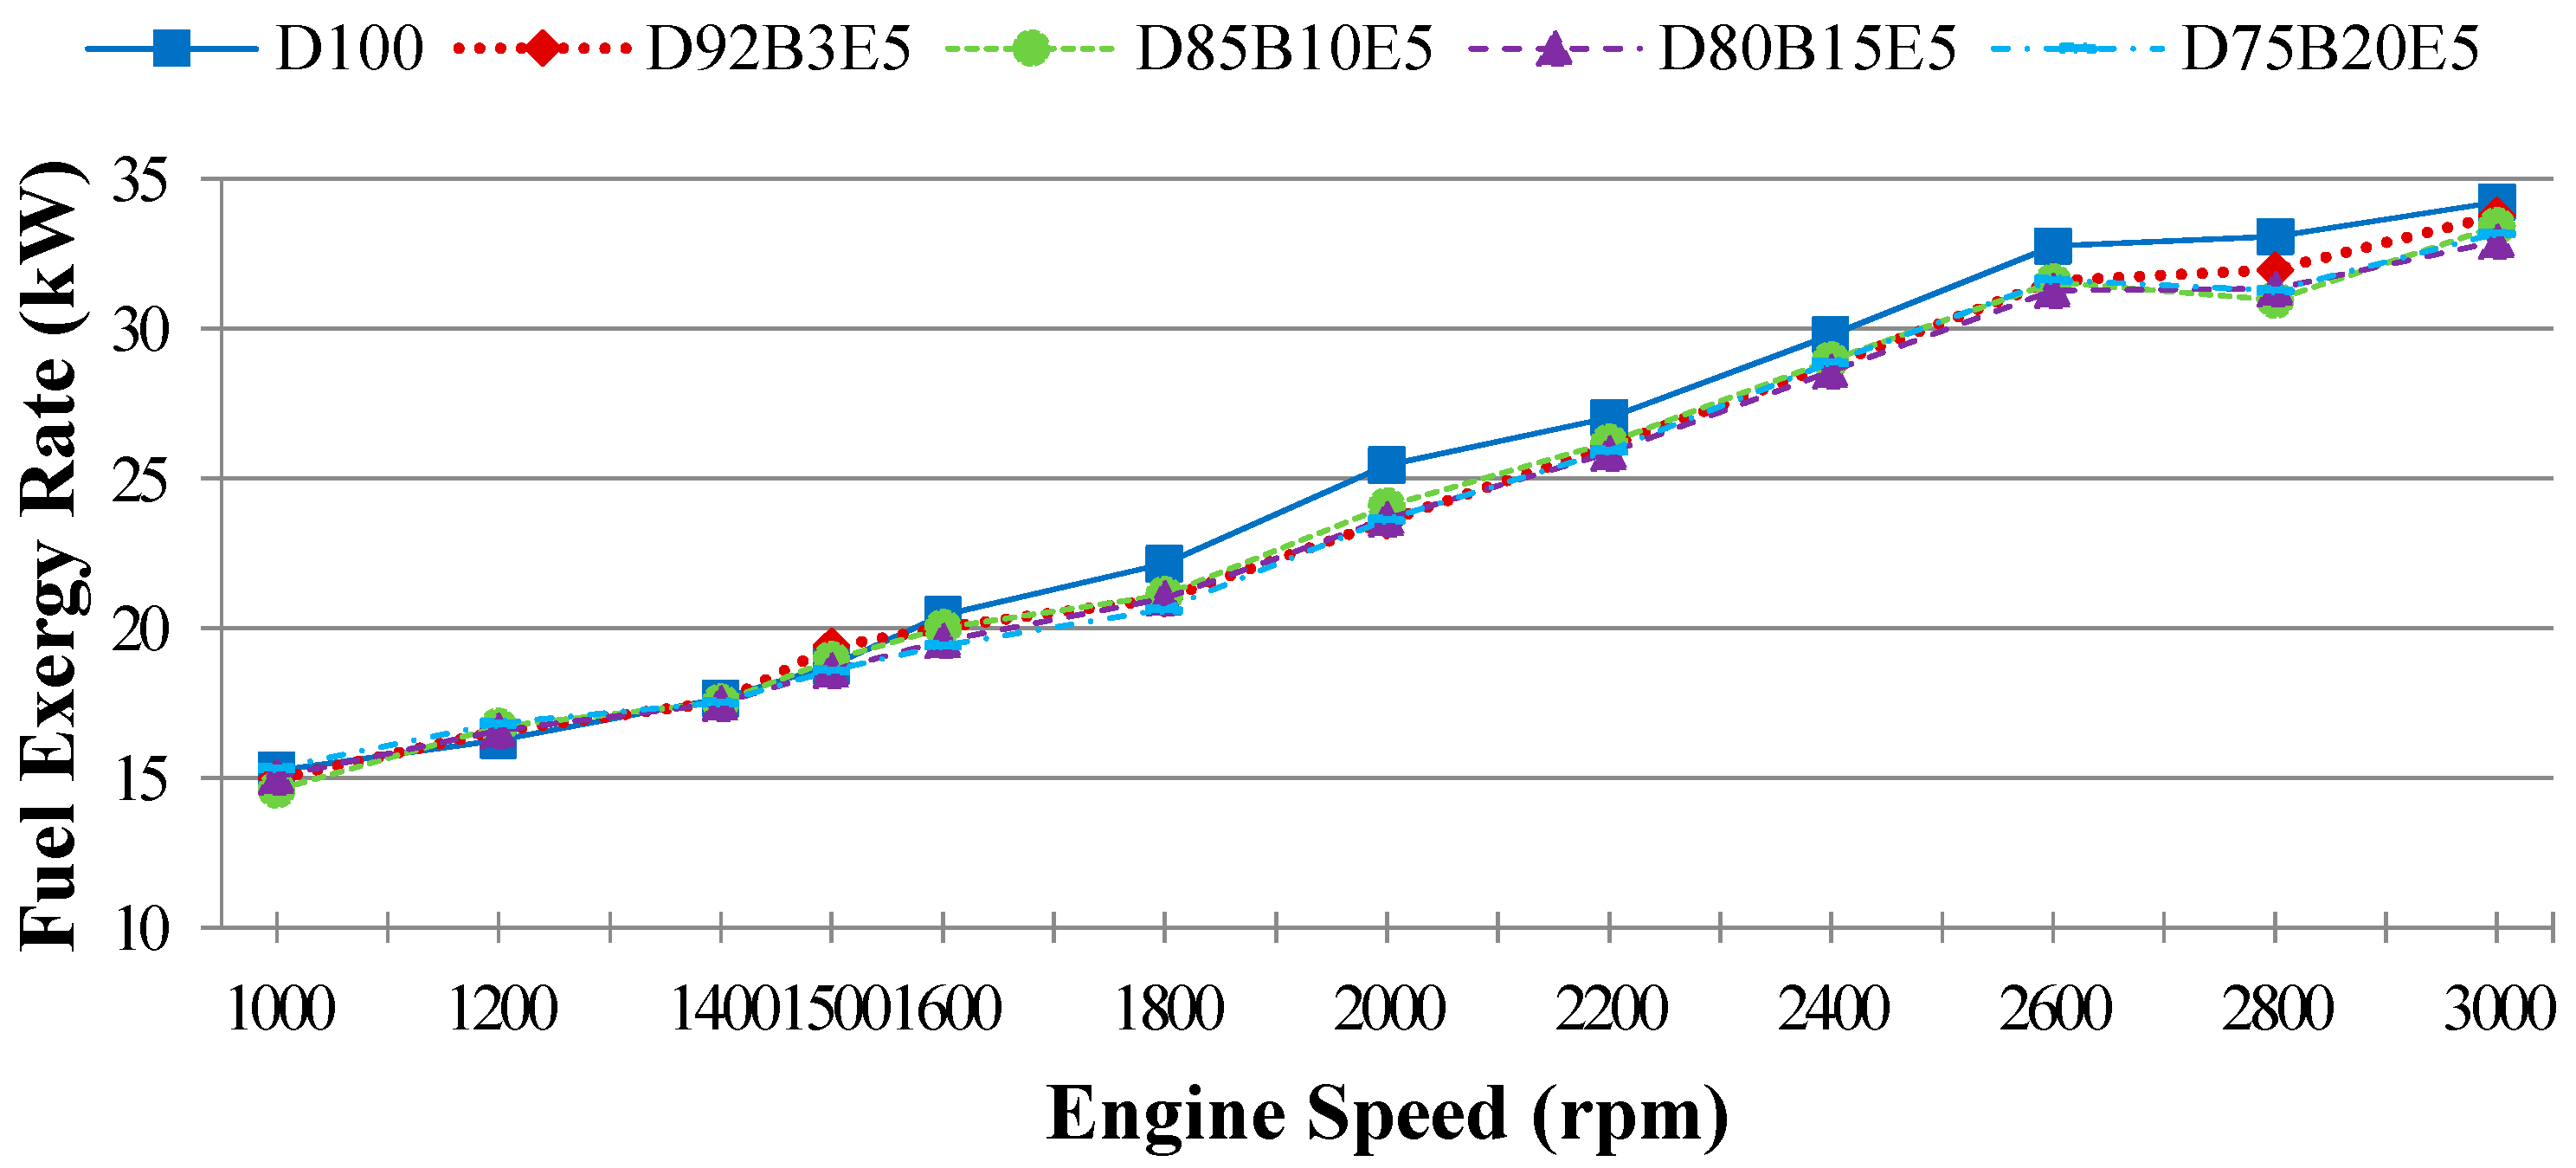
To determine the fuel energy rate, 43144.9 kJ/kg, 42271.0 kJ/kg, 41952.2 kJ/kg, 41724.4 kJ/kg, 41496.7 kJ/kg are used as the lower heating values for D100, D92B3E5, D85B10E5, D80B15E5 and D75B20E5, respectively.
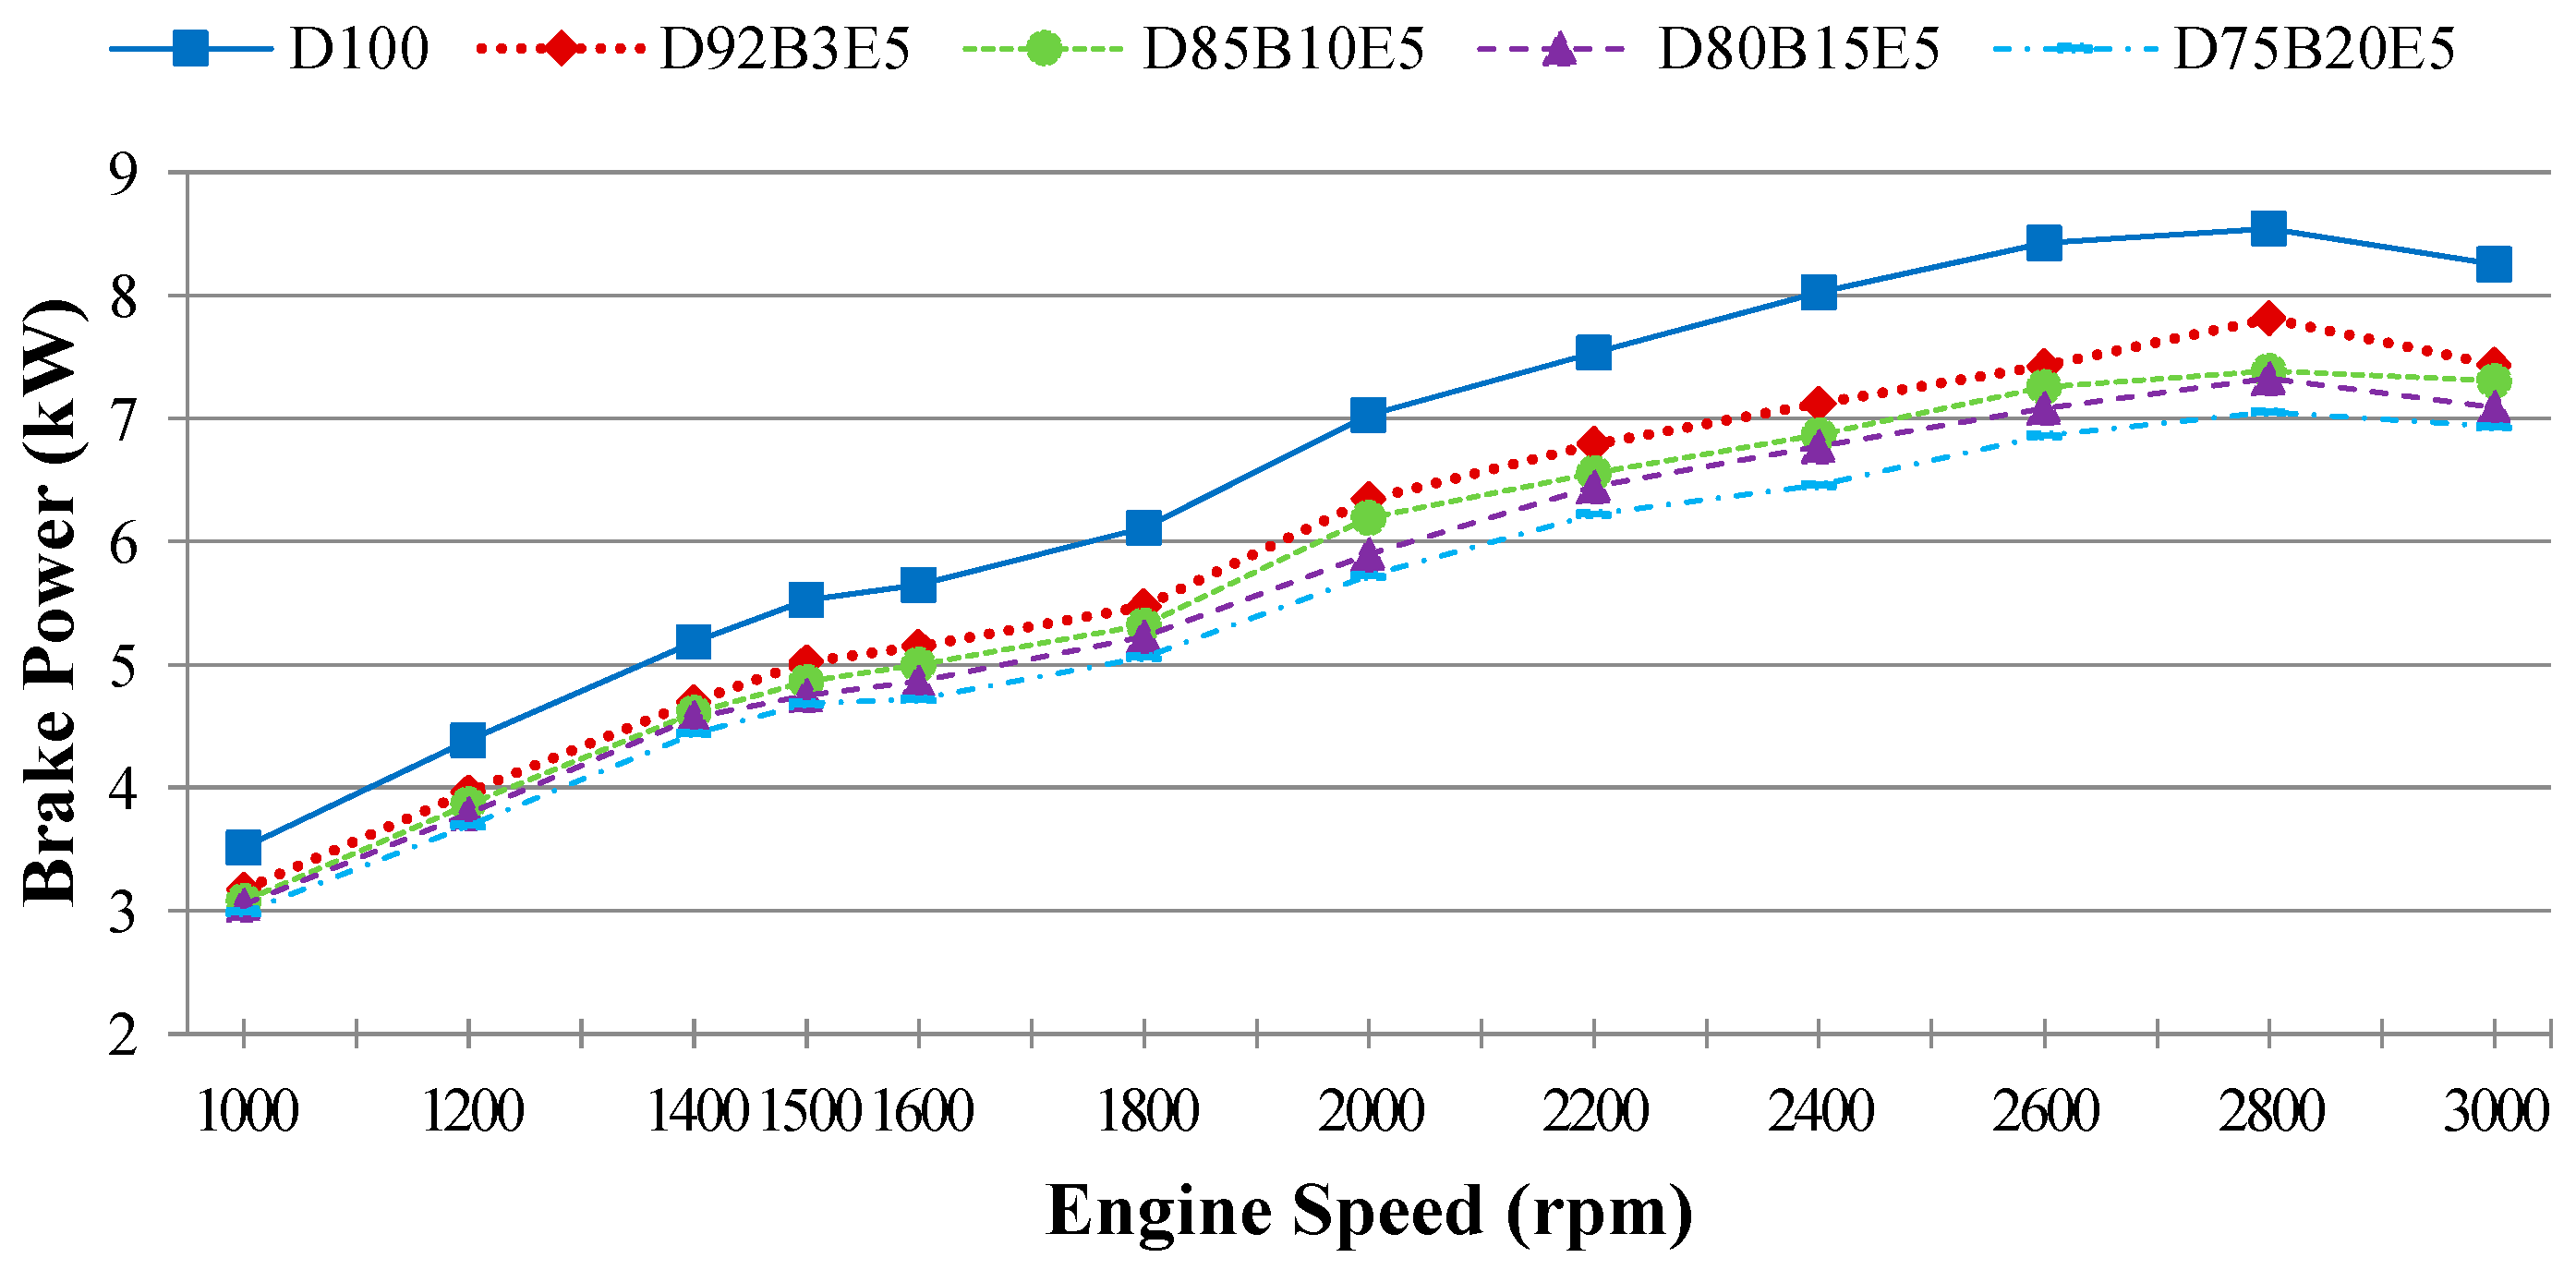
The brake power is denoted as:
where
ω is the angular velocity; and
τ is the engine torque.
Since the combustion air is in the same state as the standard reference state defined as T
0 = 293 K and P
0 = 1 atm, the energy of the combustion air can be neglected so the heat input rate to the control volume by mass is represented by only chemical energy of fuel.
can be calculated using the mass flow rate of the fuel
and lower heating value of the fuel
Hu as expressed by Equation (5):
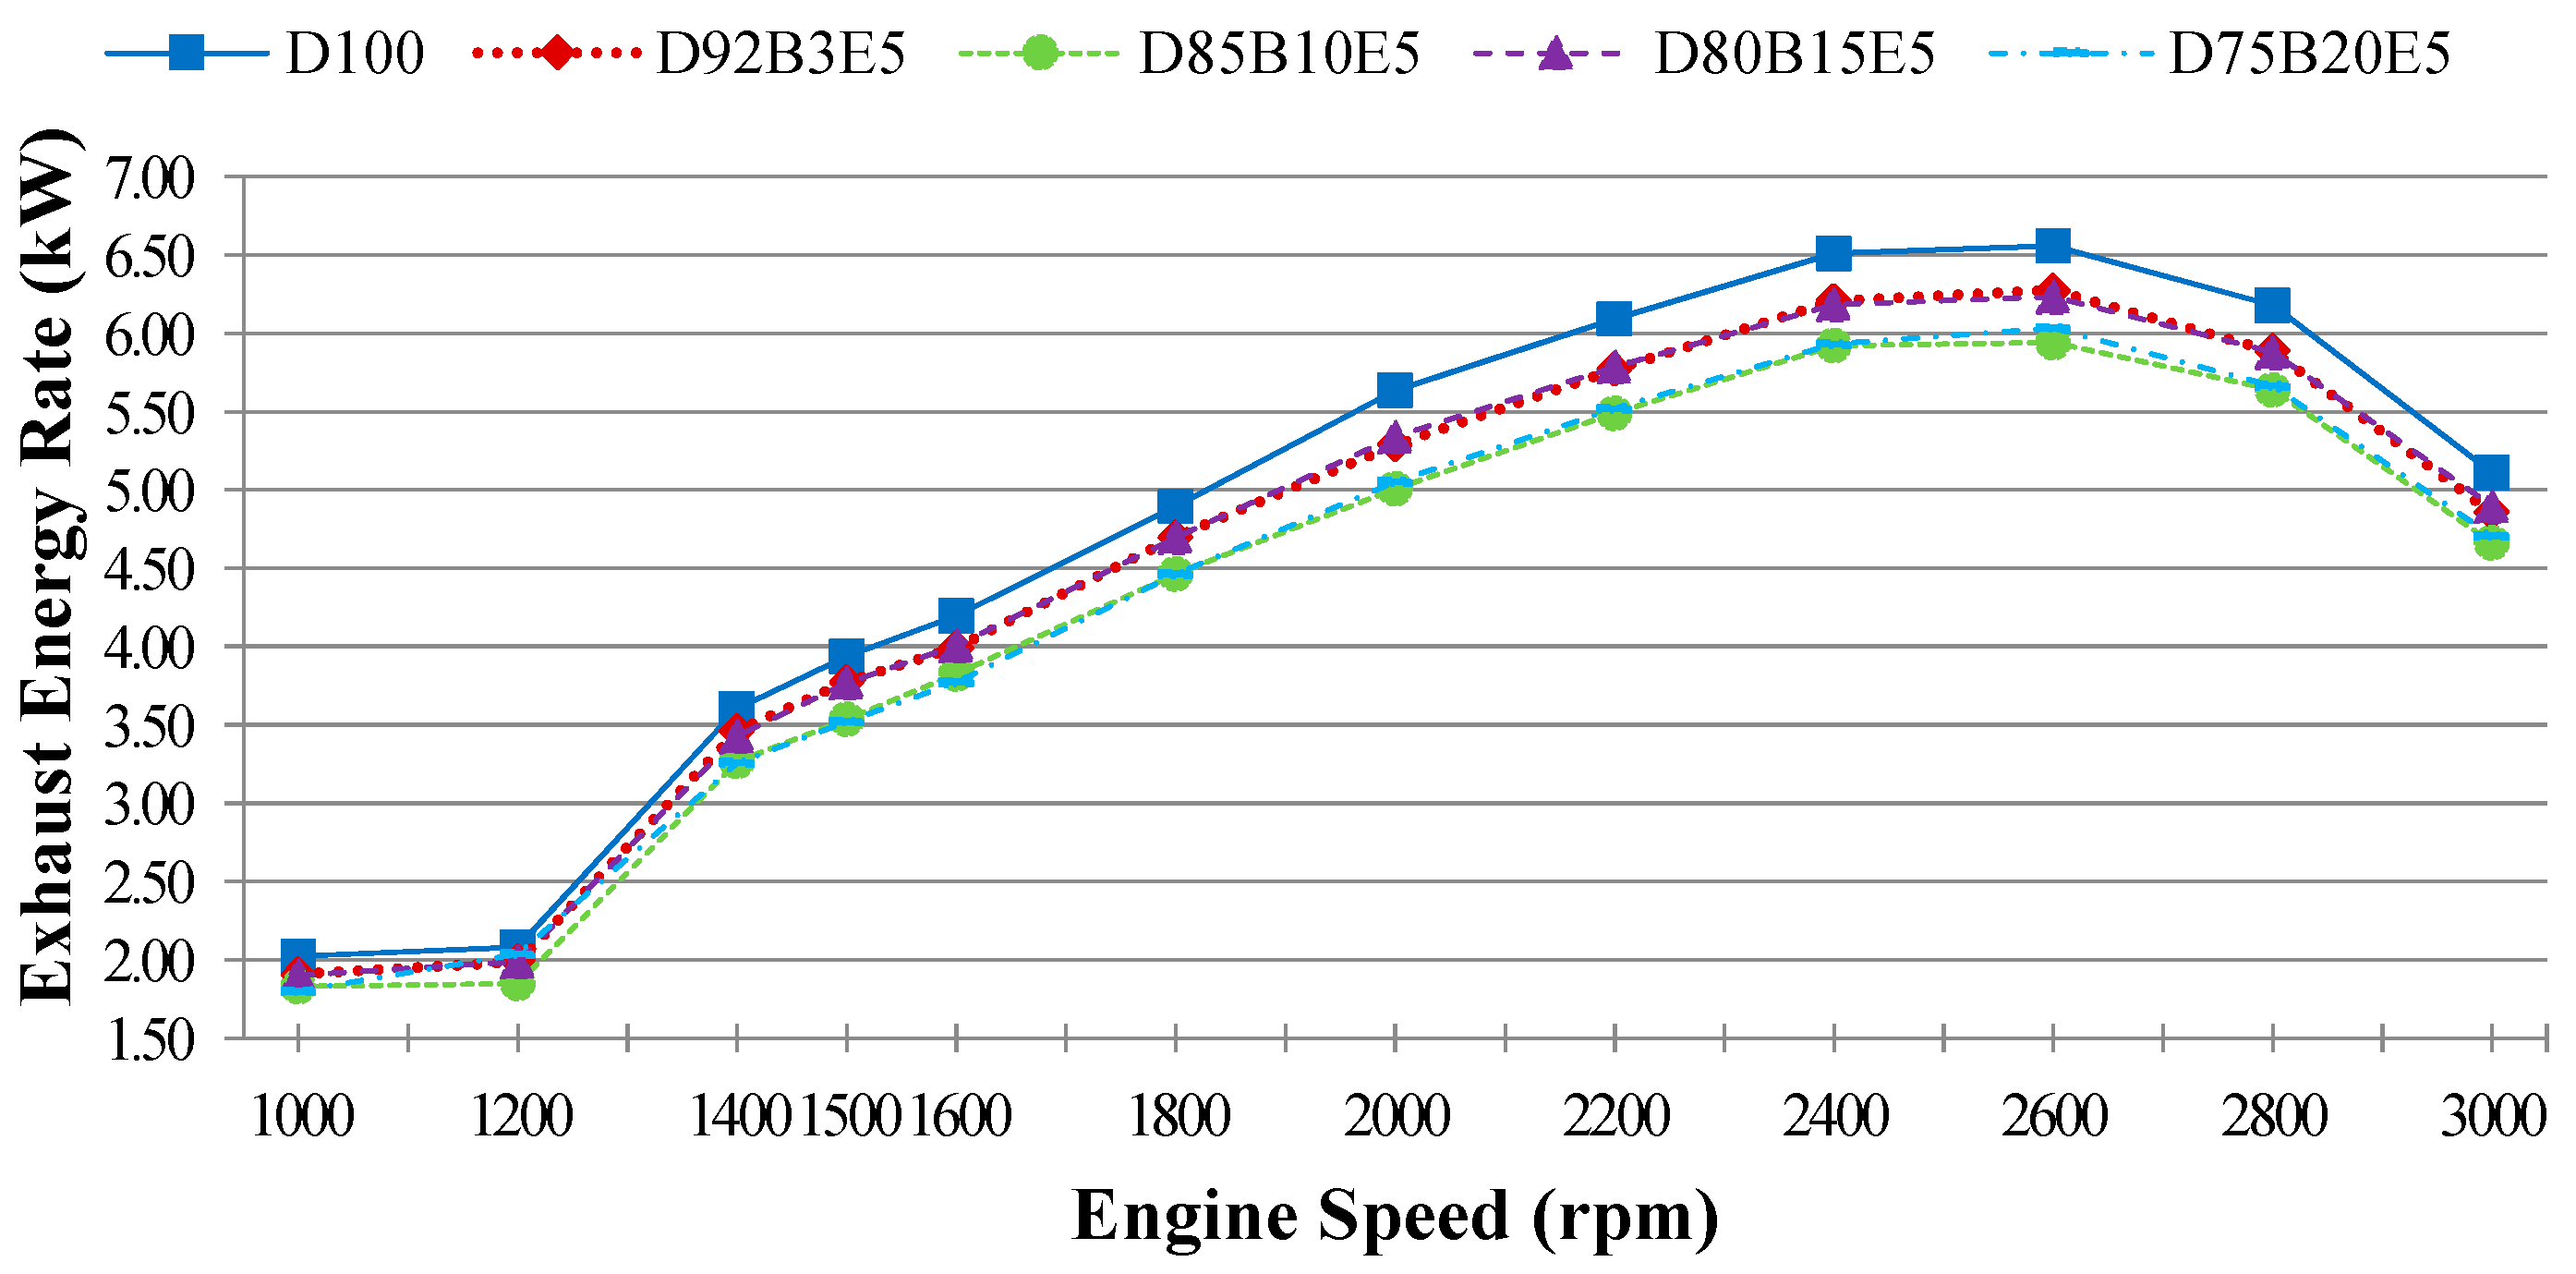
Exhaust energy rate,
can be calculated as a function of the mass flow rate of each exhaust gas components
which is obtained using combustion equations and the enthalpy change Δ
h represented by the difference between the enthalpy of the exhaust temperature and the reference temperature of each exhaust gas species as given in Equation (6). The mass flow rate and mole fractions of each exhaust component, and the chemical reactions of combustion were obtained by using molecular weight and emission measurement results which were converted into g/kWh units. Multipliers (35.91, 63.47) were used at the stage of converting from % unit to the g/kWh unit of CO and CO
2 emissions [
24]:
Part of the energy obtained by burning the fuel passes into the cooling water and lubricating oil by heat transfer. The other part of it is discharged through the exhaust. The lost energy rate consists of all that energy losses can be evaluated by substituting other parameters in Equation (3).
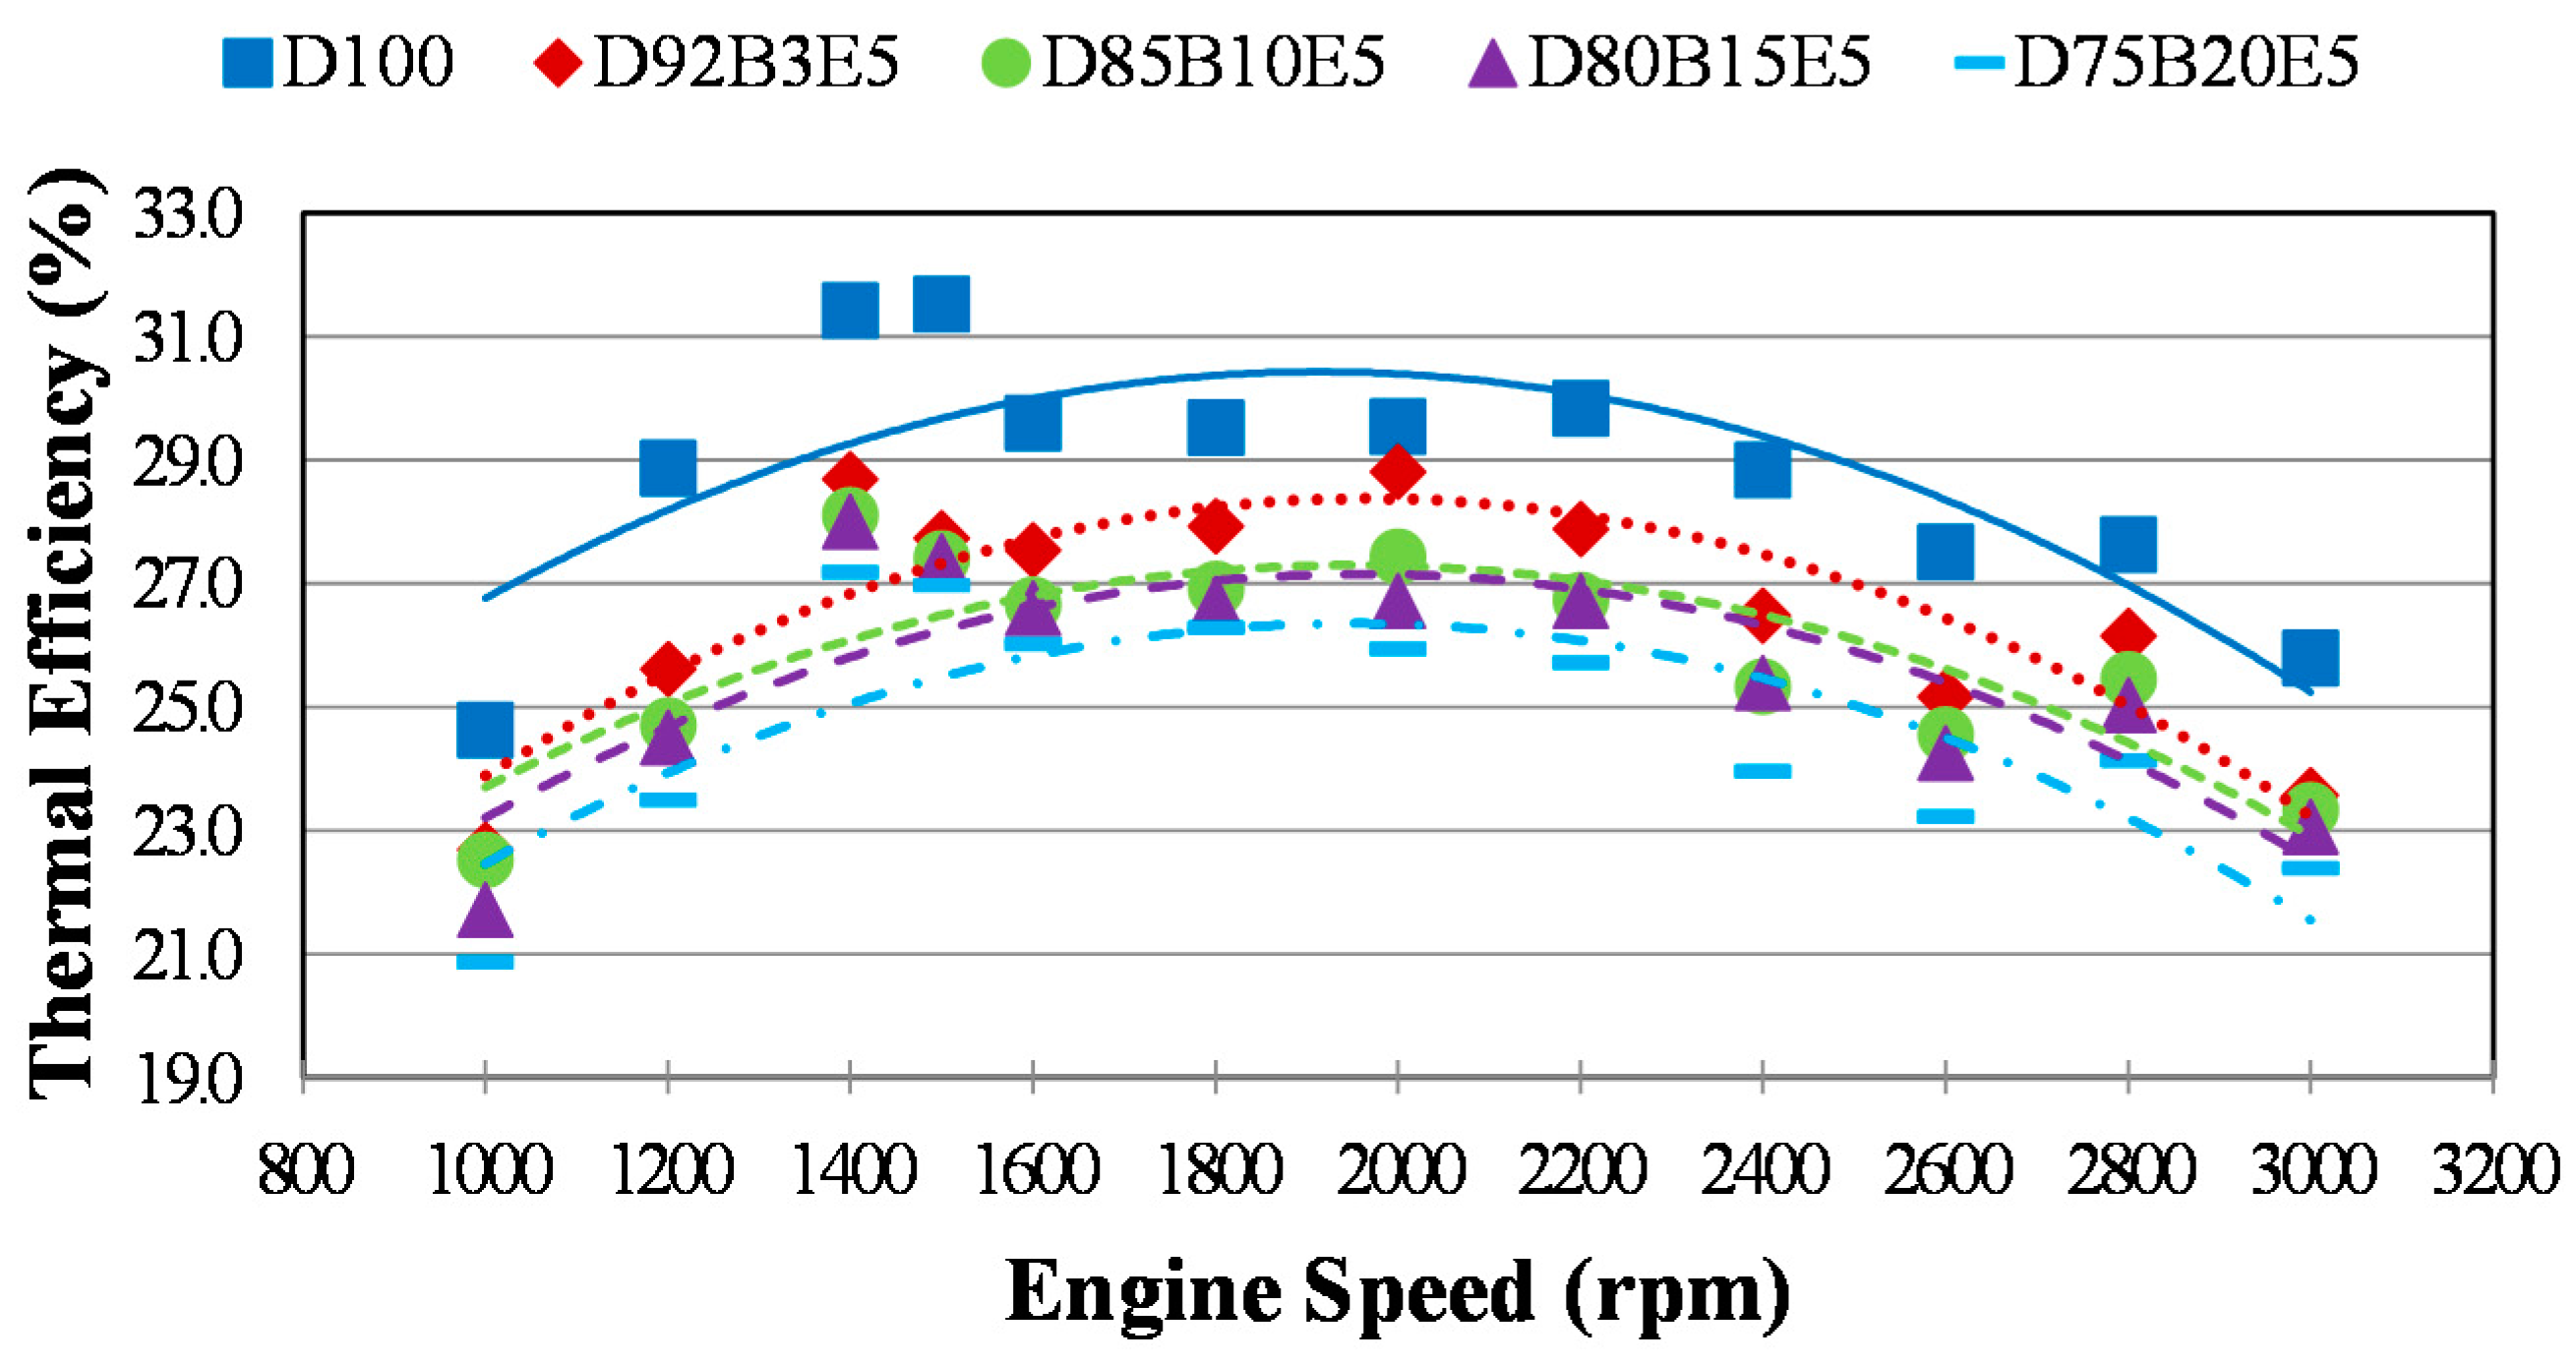
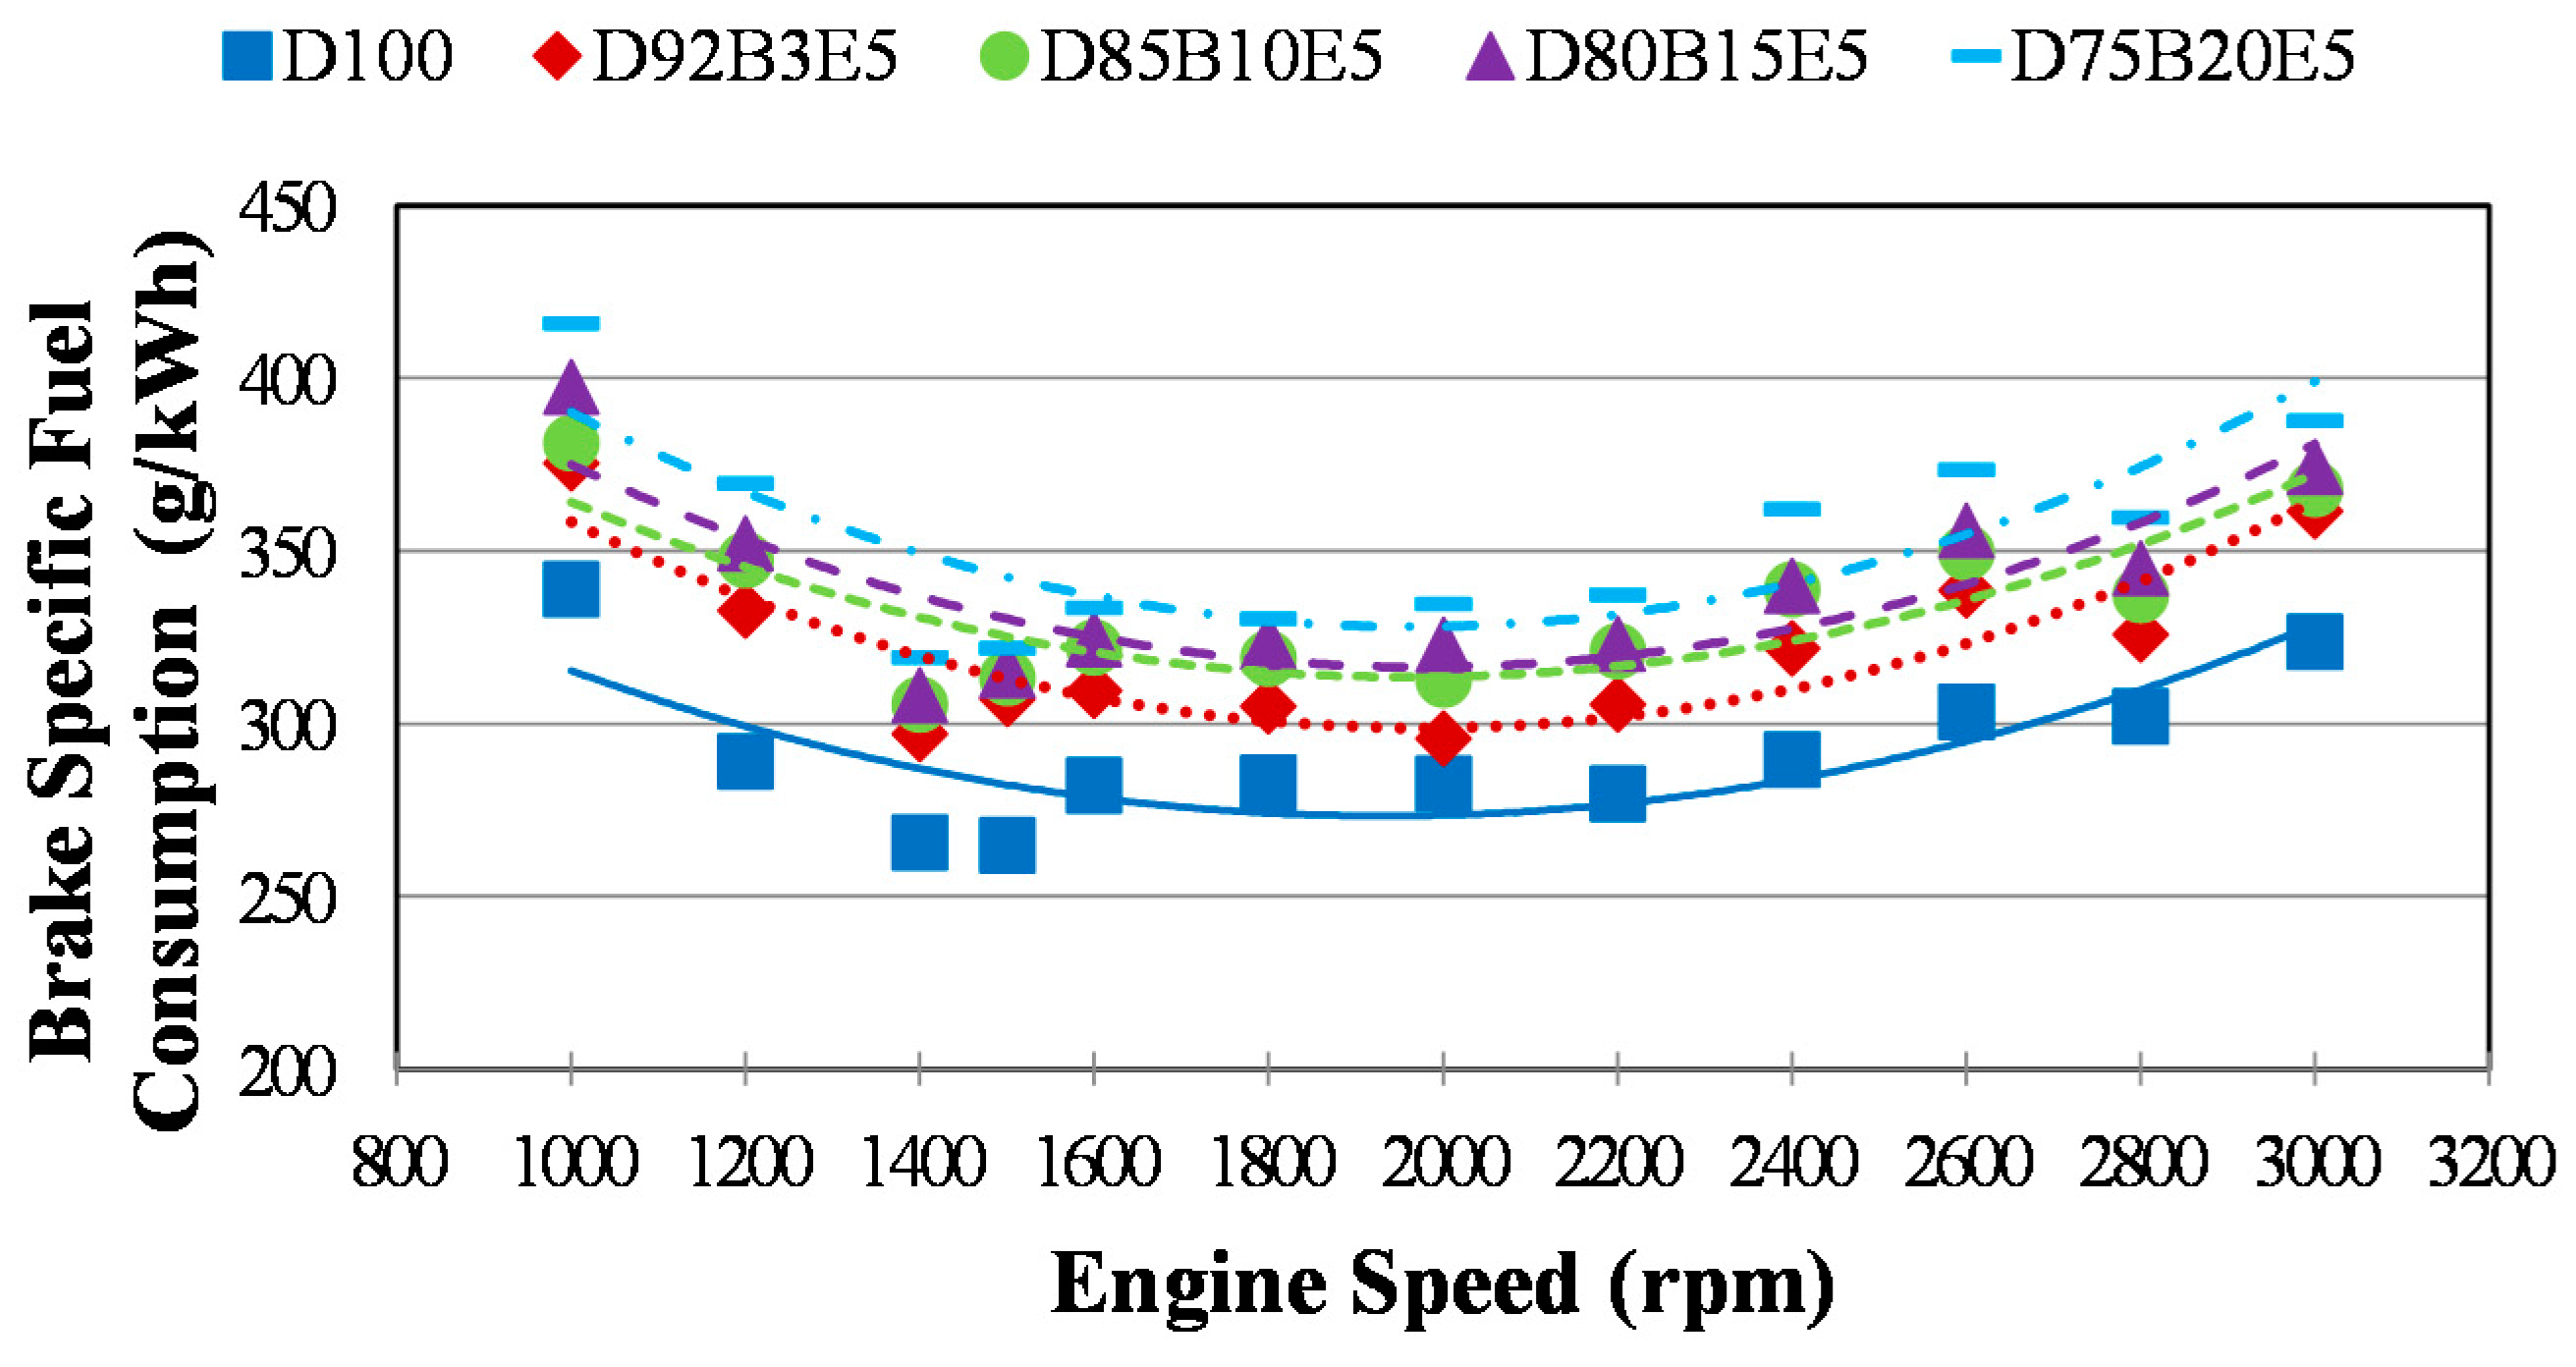
The engine characteristics are essentially expressed by thermal efficiency
η and brake specific fuel consumption
bsfc. While thermal efficiency is determined as the ratio of brake power to the fuel energy rate of the control volume,
bsfc is defined as a measure of how much fuel is consumed in one hour to obtain one kilowatt brake power and they are denoted as in Equations (7) and (8):
2.2. Exergy Analysis
Exergy has been described by scientists in many different forms. It was first defined by Baehr as the part of the energy converted into other forms of energy. Amore quantitative and detailed description of exergy corresponds to Bosnjakovic, who expressed it as the maximum amount of work that can be obtained by a reversible process, if the system goes to equilibrium with the surroundings [
25]. Unlike energy, which is conserved during any process, exergy is destroyed because of irreversibilities such as combustion, heat transfer through a finite temperature difference, air-fuel mixing, throttling, friction, etc. [
1,
4,
10].
According to Kotas [
26], even though exergy analysis is similar to energy analysis in characteristics, there are some fundamental differences between them. While the energy analysis base on the law of energy conservation, exergy analysis is based on the law of degradation of energy. Degradation of energy means the loss of exergy stems from the irreversibilities mentioned in the preceding paragraph [
26]. Using only energy analysis is not adequate to analyses energy utilization processes and additionally it leads to poor decisions about them [
4,
21]. Exergy analysis, more complicated than energy analysis, determines the portion of energy which cannot be used and it states where the losses occur in a system [
1,
4]. By applying it to a thermal system in addition to the energy analysis, irreversibilities could be detected and so the best ways to minimize energy destruction, losses and increase efficiency can be understood.
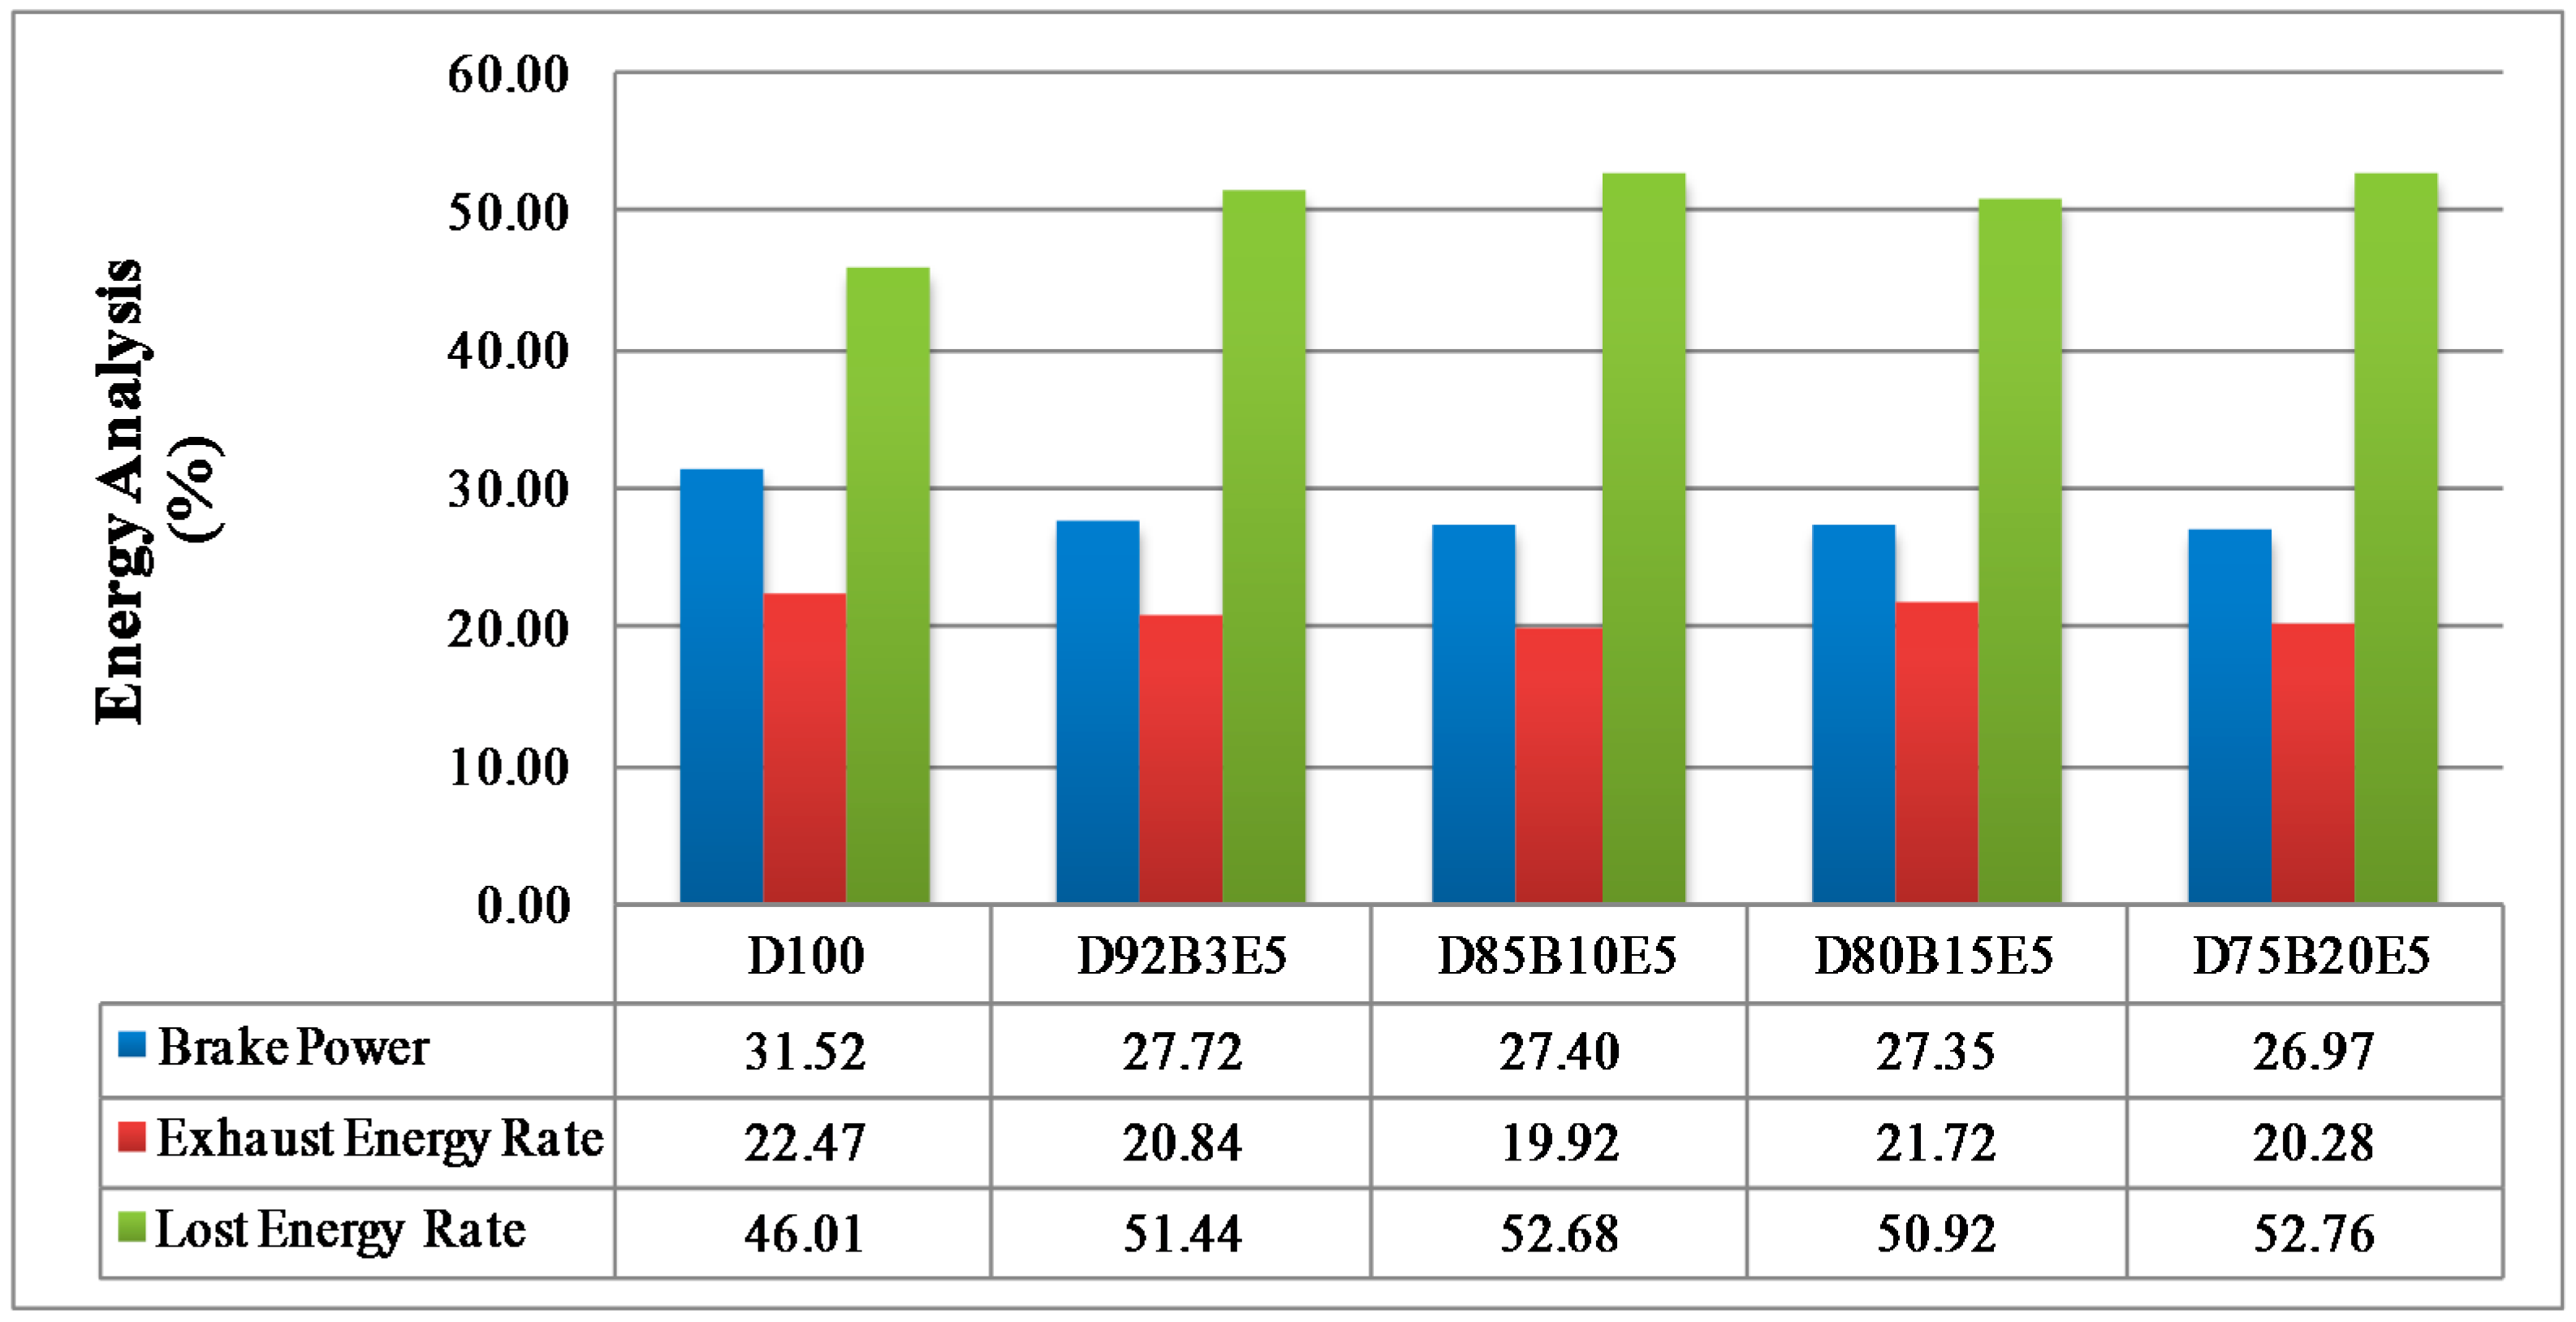
The assumptions made for energy analysis is also applicable for exergy analysis. Based on these assumptions, the exergy balance for the control volume can be given in the general sense by Equation (9):
where
is the exergy transfer rate related to heat transfer between the control volume and the environment;
is the exergy transfer rate associated with work transfer;
is the exergy destruction rate of the control volume. Furthermore,
and
are the exergy transfer through the intake and exhaust process where
,
are the specific exergies of the fuel and exhaust gas, and similarly
,
are the mass flow rates of the fuel and exhaust gas.
Exergy input rate with mass transfer to the engine consists of fuel exergy and combustion air exergy. However the effect of combustion air exergy can be neglected by assuming that combustion air enters the engine at ambient conditions. The specific chemical exergy of fuel is computed by multiplying the lower heating value and chemical exergy factor as in the following equation:
The chemical exergy factor for liquid fuels can be calculated by Equation (11), where
h,
c,
o and
α are the mass fractions of H, C, O and S, respectively [
26]:
The exergy transfer rate associated with work is equal to the net work for the engine:
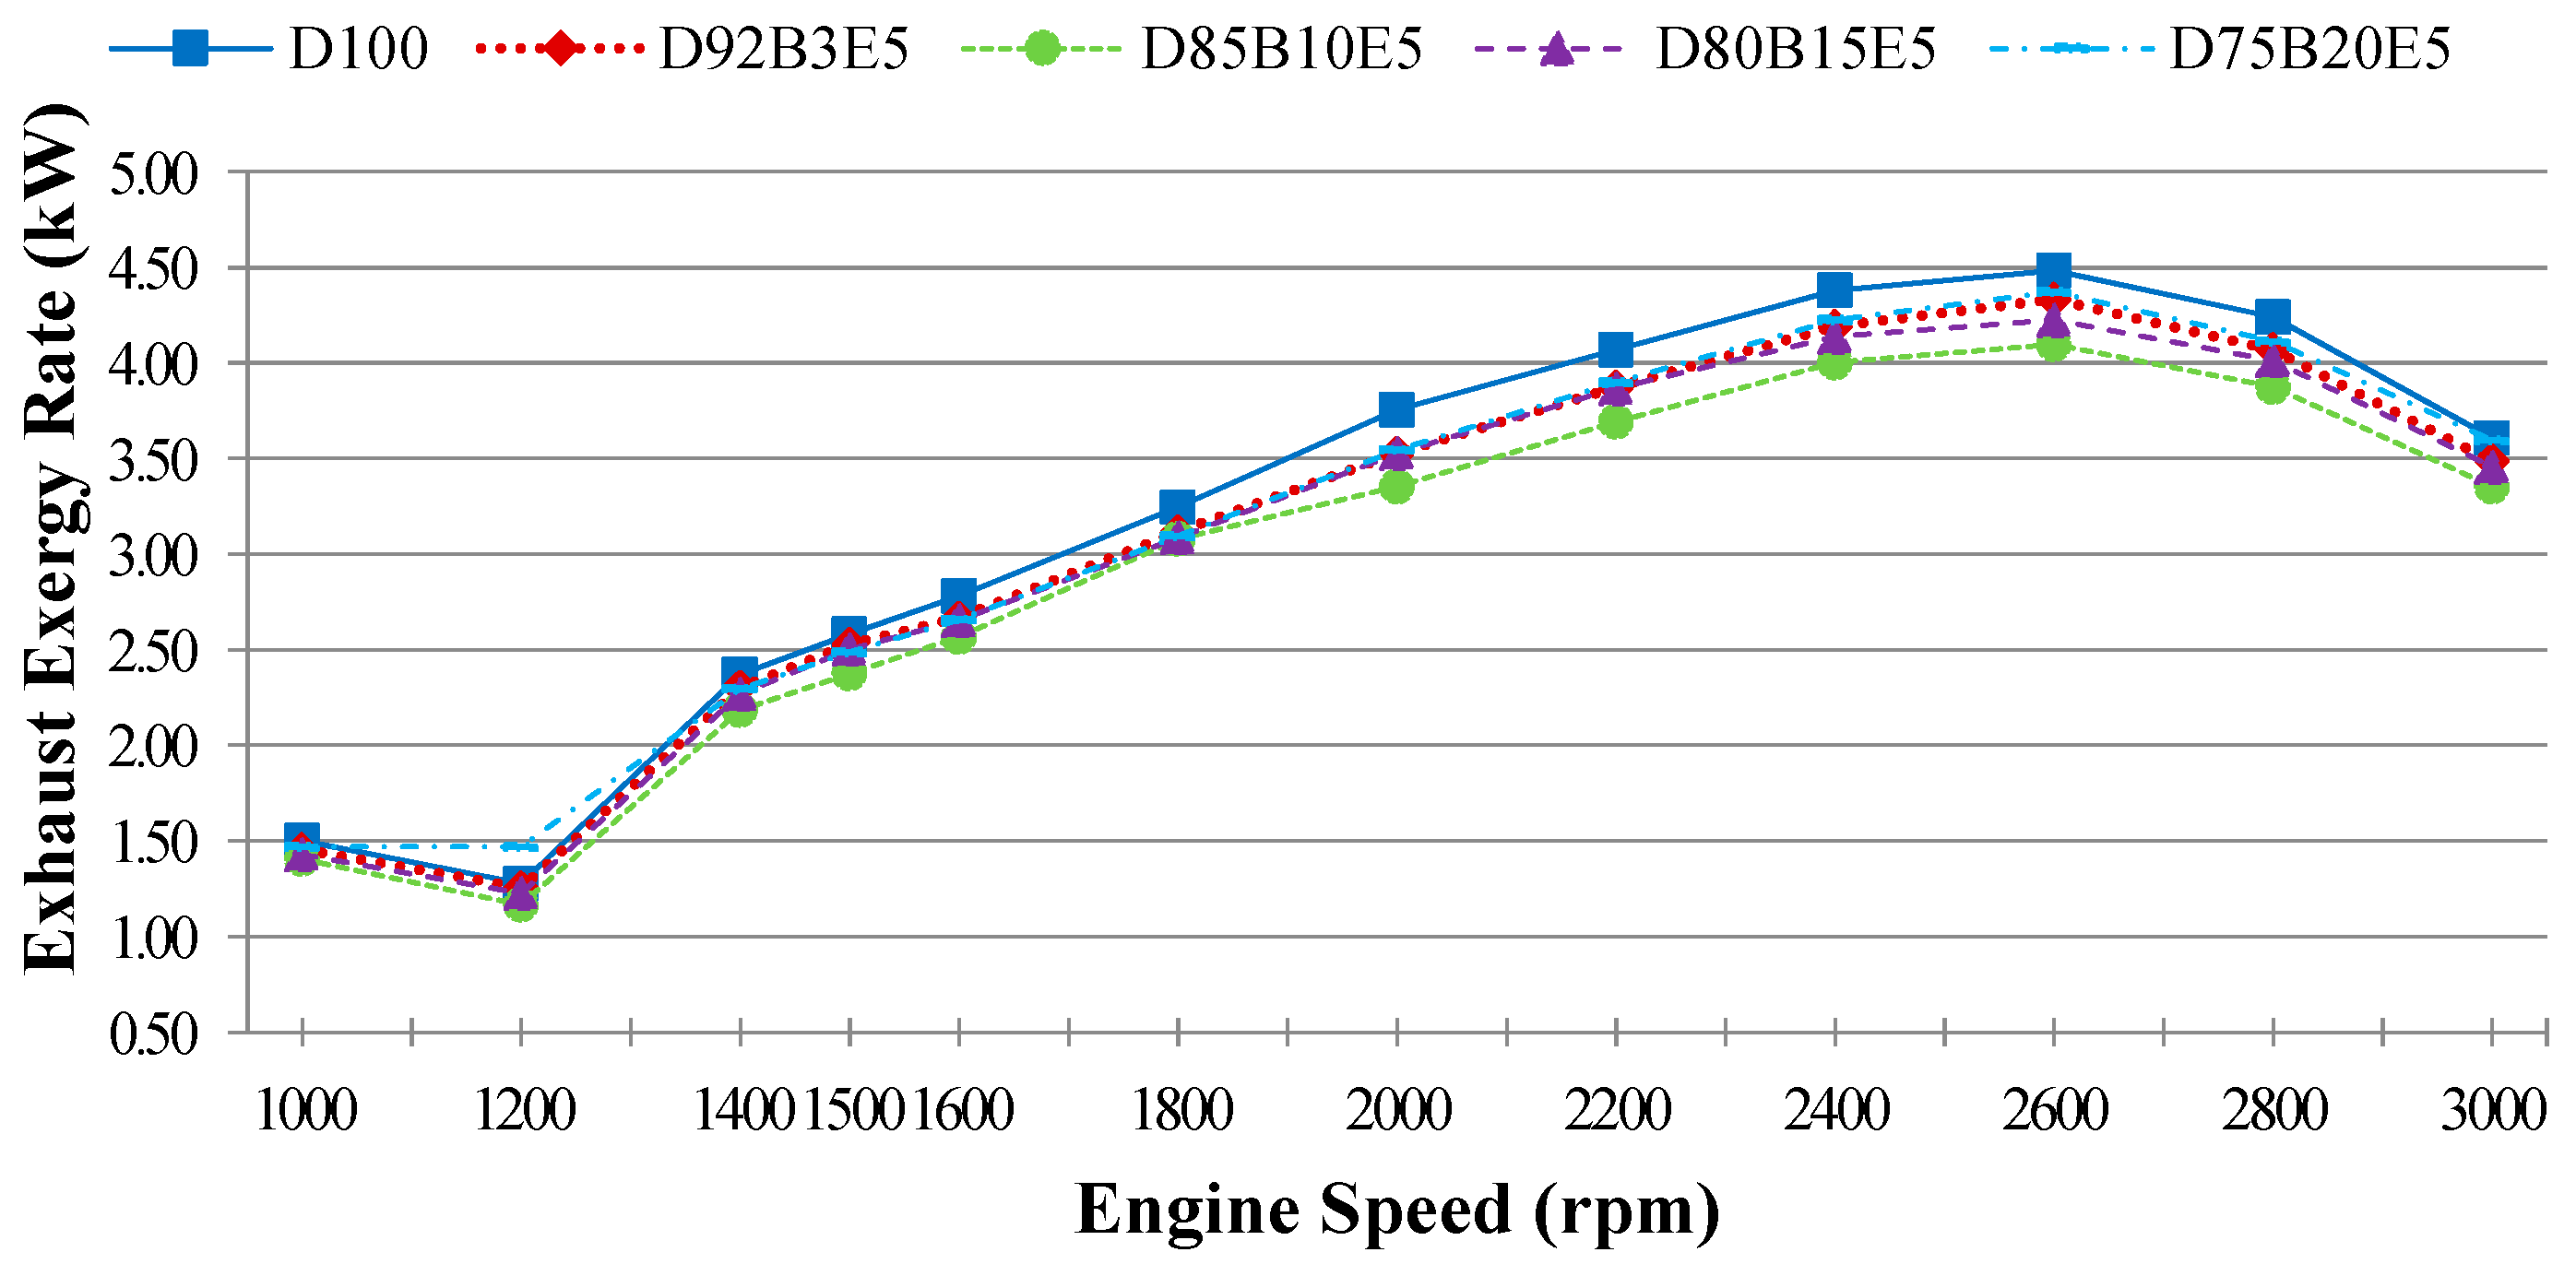
Exergy output rate with mass transfer from the engine consists of exhaust exergy which can be expressed as in Equation (13):
Exhaust exergy per unit mass can be expressed as the sum of the specific thermo mechanical and chemical exergies of the exhaust gases as seen in Equation (14). Using the assumption that the exhaust gas is an ideal gas mixture, the specific thermo mechanical and chemical exergies of the exhaust gas containing n components can be calculated by Equations (15) and (16), respectively. The term Ta in these equations represents the ambient temperature and it has been obtained approximately as 19 °C, 23 °C, 20 °C, 21 °C, 21 °C for D100, D92B3E5, D85B10E5, D80B15E5, respectively.
where
s is the specific entropy and
h is the specific enthalpy of the exhaust gas and
is the universal gas constant,
yi is the molar fraction of the component in the exhaust gas and
is the molar fraction of the component in the exhaust gas for the reference environment. Subscript “0” represents the reference state values. It is accepted that the reference state, defined as
T0 = 25 °C and P
0 = 1 atm, consists of N
2, O
2, CO
2, H
2O and other components, the molar fractions of which are 75.67%, 20.35%, 0.03%, 3.12%, and 0.83%, respectively [
27].
Exergy transfer rate related to heat transfer can be given by Equation (17) by using
Qlost which is a parameter of the energy analysis:
where,
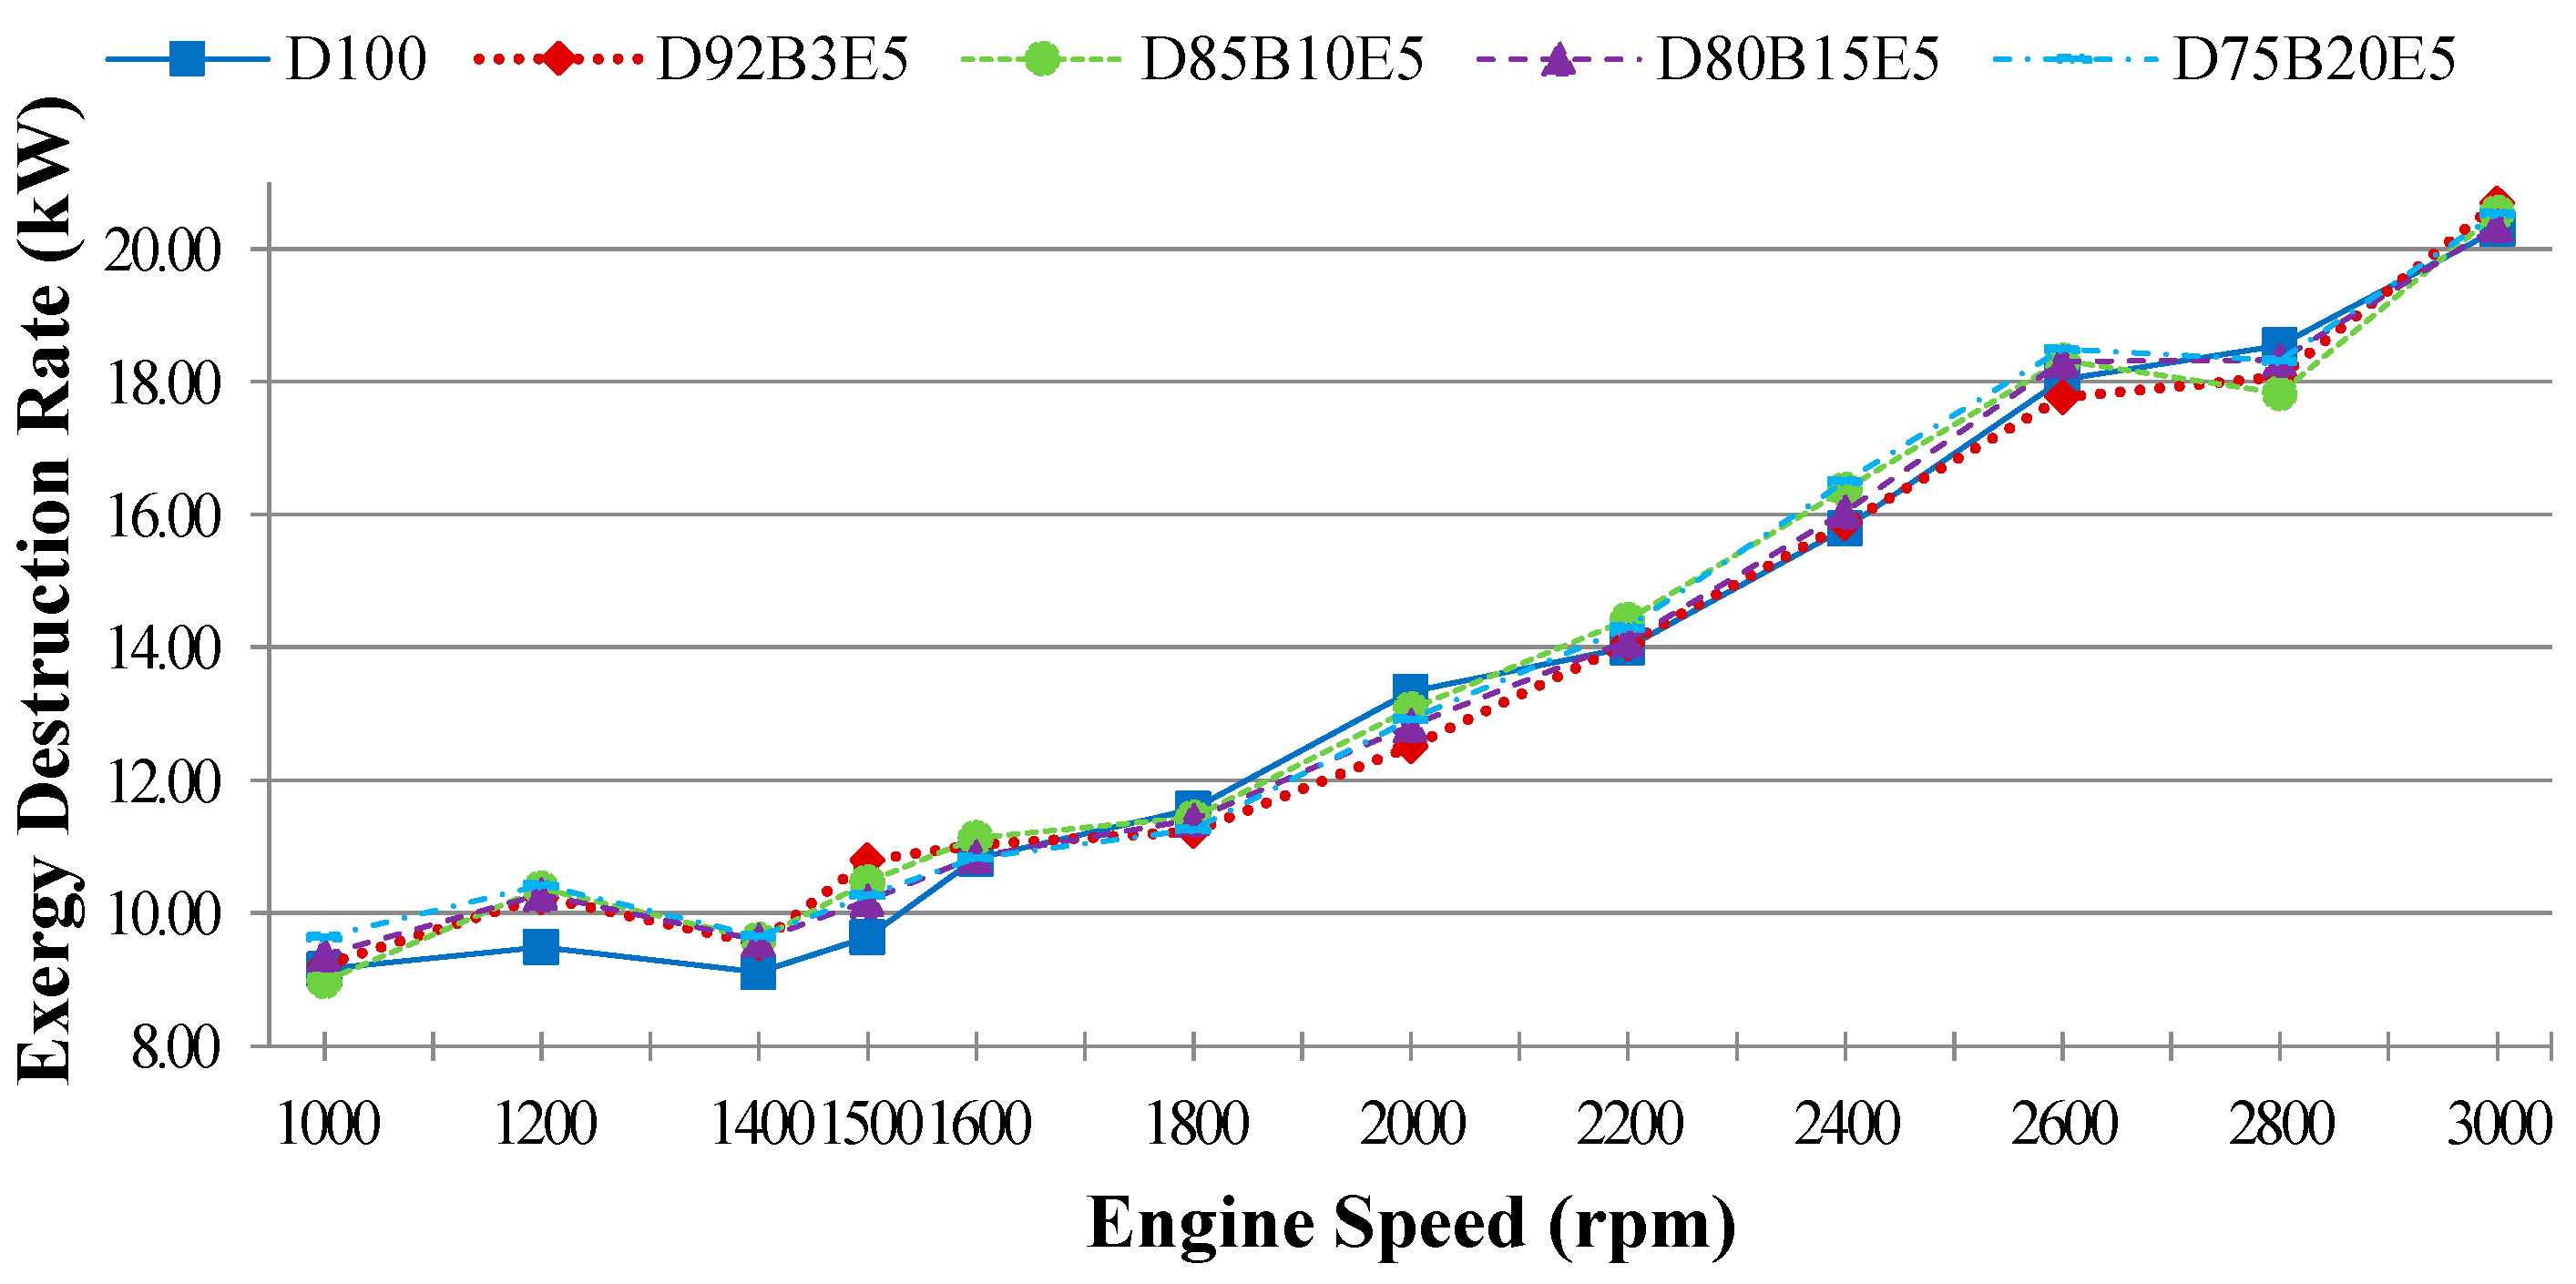
Tcw is the cooling water temperature considered to be the same as the system boundary temperature. Exergy destruction rate of the control volume
can be evaluated by replacing other parameters in Equation (9).
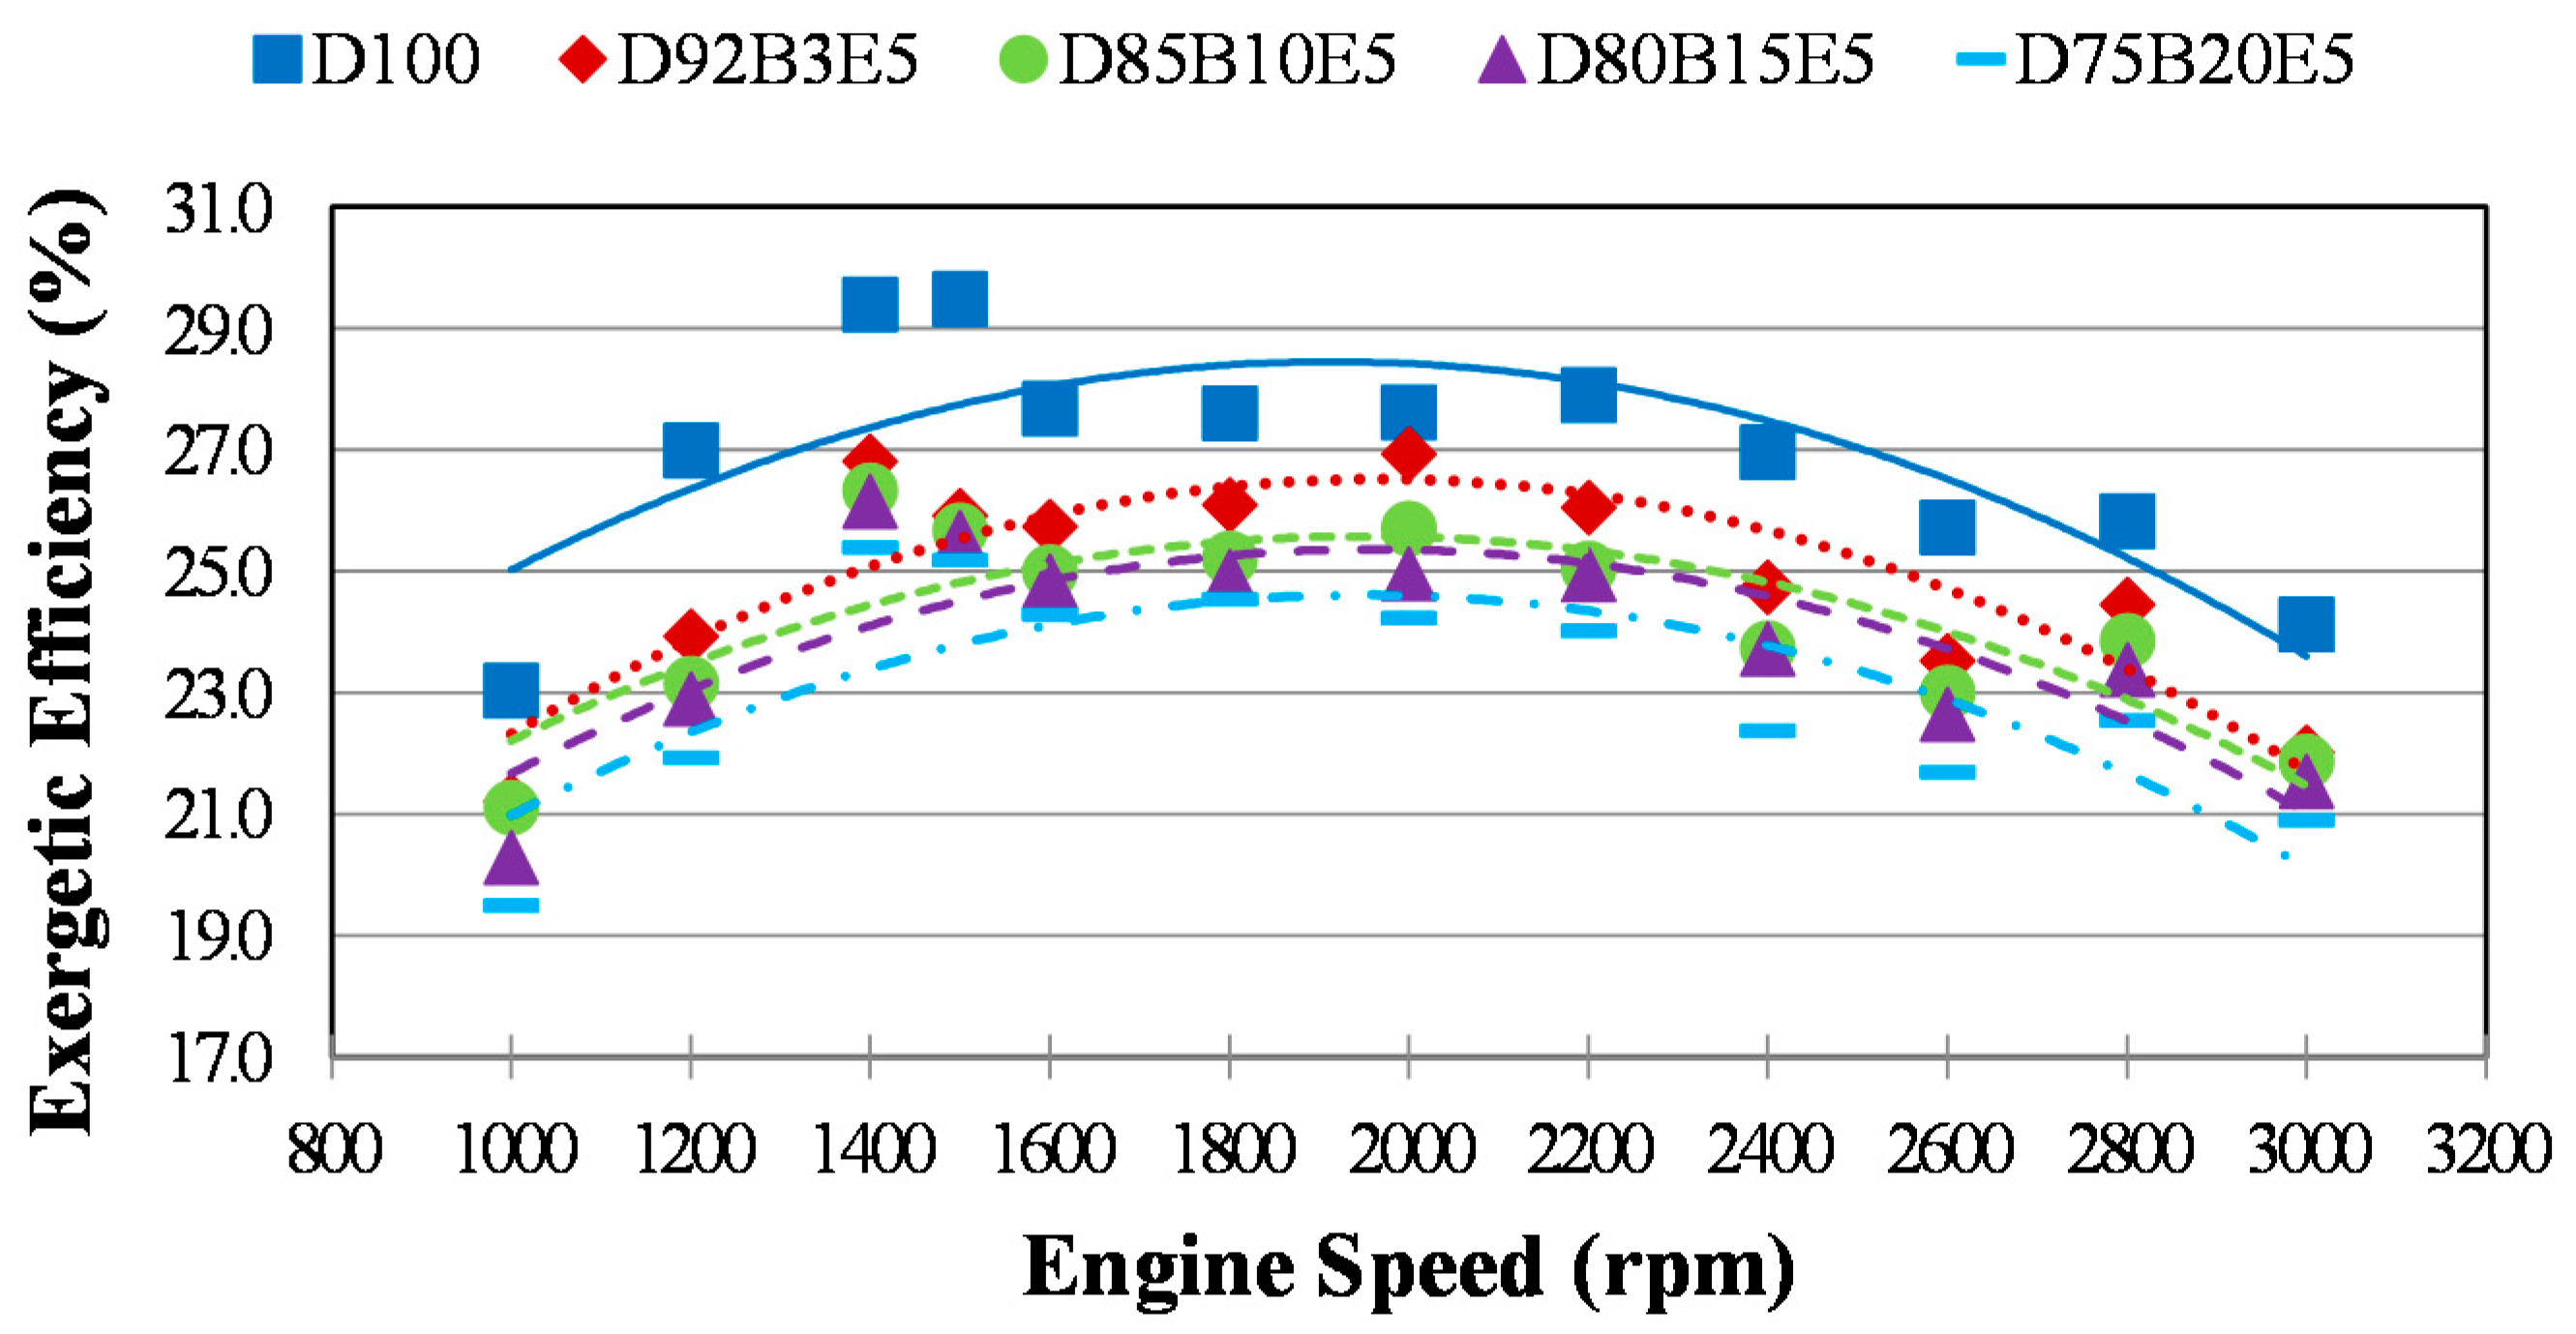
The exergetic efficiency is a more accurate measurement of the system performance compared to the first law efficiency and it answers the question “how much of the fuel exergy is converted into power”. The exergetic efficiency, expressed as the ratio of brake power exergy to the fuel exergy of control the volume, can be calculated as follows:


