Article

Influence of the Aqueous Environment on Protein Structure—A Plausible Hypothesis Concerning the Mechanism of Amyloidogenesis

1
Department of Bioinformatics and Telemedicine, Collegium Medium, Jagiellonian University, Lazarza 16, 31-530 Krakow, Poland
2
Faculty of Physics, Astronomy and Applied Computer Science, Jagiellonian University, 30-059 Krakow, Poland
3
Chair of Medical Biochemistry, Collegium Medicum, Jagiellonian University, Kopernika 7, 31-034 Krakow, Poland
*
Author to whom correspondence should be addressed.
Entropy 2016, 18(10), 351; https://doi.org/10.3390/e18100351
Submission received: 28 July 2016 / Revised: 13 September 2016 / Accepted: 19 September 2016 / Published: 28 September 2016
(This article belongs to the Section Information Theory, Probability and Statistics)

Abstract

:
The aqueous environment is a pervasive factor which, in many ways, determines the protein folding process and consequently the activity of proteins. Proteins are unable to perform their function unless immersed in water (membrane proteins excluded from this statement). Tertiary conformational stabilization is dependent on the presence of internal force fields (nonbonding interactions between atoms), as well as an external force field generated by water. The hitherto the unknown structuralization of water as the aqueous environment may be elucidated by analyzing its effects on protein structure and function. Our study is based on the fuzzy oil drop model—a mechanism which describes the formation of a hydrophobic core and attempts to explain the emergence of amyloid-like fibrils. A set of proteins which vary with respect to their fuzzy oil drop status (including titin, transthyretin and a prion protein) have been selected for in-depth analysis to suggest the plausible mechanism of amyloidogenesis.

1. Introduction

The search for algorithms which enable simulation of protein folding and tertiary structure prediction has been ongoing for more than 50 years [1]. The Critical Assessment of Structure Prediction (CASP) challenge provides a platform for the exchange of views and comparison of models underpinning various IT solutions [2,3]. Each participating software package is expected to be able to generate the 3D structure of a protein body on the basis of its residue sequence. Cursory analysis of to-date results suggests that progress has so far been fairly limited [3]. Similarly, the recently published outcomes of the WeFold project, which brings together the world’s top experts in the field, indicate that satisfactory solutions are yet to emerge [4].
Paradoxically, Nature itself provides an interesting study subject in the form of misfolded proteins (nothing in common with mutation) which are the origin of the so-called misfolding diseases, where incorrectly folded proteins (or proteins which undergo undesirable conformational changes) create insoluble fibrillary aggregations, leading to a variety of degenerative conditions [5]. This phenomenon drives the search for algorithms which would explain how proteins attain their native 3D form as well as indicate why the folding process sometimes produces incorrect results [6,7].
Existing protein structure prediction models are generally based on one of two approaches: comparative modeling which seeks evolutionary relations between the structures of protein homologues, and ab initio techniques (also referred to as “new fold” models) which attempt to describe the force fields involved and thus recreate the folding process itself.
In all such models the influence of the aqueous environment is described in form of pair-wise interactions between atoms belonging to the protein molecule and the environment. This kind of description is highly detailed (individual atoms interacting with each other), yet surprisingly imprecise as it restricts interactions to the local neighborhood of each atom, without considering their impact on the protein as a whole.
Our work attempts to relate the structure of the protein to the properties of its aqueous environment. The structuralization of water—although poorly understood [8]—may be studied from the point of view of its effects on the protein body. In the fuzzy oil drop (FOD) model the hydrophobic core emerges as a result of the structural properties of water which cause aggregation of hydrophobic residues near the center of the protein with simultaneous exposure of hydrophobic residues on its surface. Such structuralization is obviously dependent on the presence of ions, acidity (pH), proximity to other molecules (such as membranes), ionic potentials etc. Changes in these parameters —as reported according to experiments [9]—influence the structuralization of water and in consequence influence the protein folding process leading to adoption of non-native tertiary conformations.
Under normal conditions, it is assumed that structuralization of water creates a characteristic environment which causes hydrophobic residues to congregate near the center of the protein and be shielded from contact with water by hydrophilic residues exposed on the proteins surface [10]. The FOD model simulates this phenomenon through extension of the original discrete oil drop [10] model by introducing a continuous hydrophobicity density distribution gradient—a 3D Gaussian [11], more recently described in [12].
The aggregation of hydrophobic residues in the central part of the molecule corresponds to values of the 3D Gaussian which peak at the geometric center of the protein and decrease along with distance from the center, becoming close to 0 on the surface. This protein surface utilized by the FOD model is not a molecular or solvent-accessible surface, but an axis-aligned ellipsoid, which forms a 3-dimensional “capsule” container for the molecule, centered on the origin of the coordinate system.
If we assume that the “natural” external force field produces an ordered hydrophobic core, an interesting question emerges—can variations in this field produce alternative distributions of hydrophobicity density? We have identified several protein families in which the actual (observed) hydrophobicity density distribution very closely matches theoretical values. This includes the antifreeze [13] and downhill [14] proteins. Local discordances between the idealized and observed distributions frequently correspond to active sites: local hydrophobicity deficiencies usually suggest the presence of a ligand binding cavity [15,16] while local excess hydrophobicity—if present on the surface of the protein—may indicate a complexation site [17,18].
In this work we focus on a set of proteins implicated in amyloidogenesis. The spectrum of structures ranges from proteins with very low propensity for structural changes to molecules which readily undergo amyloid-like and amyloid structural changes. Human titin (1TIT) [19], with a well-ordered hydrophobic core which closely matches the predictions of the fuzzy oil drop model [20], represents the former group. The presence of such a core is consistent with the function of titin, which —being part of muscle tissue—is subject to powerful stretching forces and must be able to revert to its original shape in the absence of deforming factors [21,22,23]. The presence of a well-defined hydrophobic core appears to enable the molecule to revert to its initial form when external forces disappear.
The second protein, human transthyretin (1DVQ) [24], is widely recognized as susceptible to amyloid formation, both in vitro and in vivo [24,25,26,27,28,29,30,31]. This protein exhibits local deviations from the idealized hydrophobic core structure which may be treated as the seed for amyloidogenesis.
Our third object of study is the SufC-SufD complex involved in iron-sulfur cluster biosynthesis (2ZU0) [32]. There are no direct reports which would relate it to amyloidogenesis. However, comparing several publications focusing on structural analysis of amyloid fibrils [33,34,35,36,37,38] suggests that a large fragment of 2ZU0 appears to adopt an amyloid-like conformation. Accordingly, we have classified a fragment of this structure as “amyloid-like” (AmL) for the purposes of our analysis.
Our study also involves a prion protein (1B10) [39] and synuclein (1XQ8) [40], both of which are prone to amyloid aggregation. Finally, sequence analysis has been performed for the amyloid protofibrils of the Alzheimer Aβ(9–40) peptide [41].
To make the study complete, three amyloid fibrillary structures are presented: Amyloid β 1–40 Osaka mutant (22EΔ) fibrils (2MVX) [42], Amyloid β 1–40 Iowa mutation N23D fibrils (2MPZ) [43] and Amyloid β 1–42 fibrils (2MXU) [44]. All of them have been studied with the use of solid-state NMR and are implicated in Alzheimer’s disease. This is why the inclusion of these molecular systems is important for the hypothesis presented in this paper.

2. Theory

The fuzzy oil drop (FOD) model is a modification of the previously described oil drop model which asserts that hydrophobic residues tend to migrate to the center of the protein body while hydrophilic residues are exposed on its surface [11,12]. A visual description of this model is presented in Figure 1A where the dark area corresponds to a highly hydrophobic “core” while light areas represent the hydrophilic “shell”. The fuzzy oil drop replaces the binary discrete model with a continuous function peaking at the center of the molecule [11] (Figure 1B), which causes hydrophobicity density values to decrease along with distance from the center, reaching zero on the molecular surface. Visual comparison between the two models is presented on Figure 1C,D.
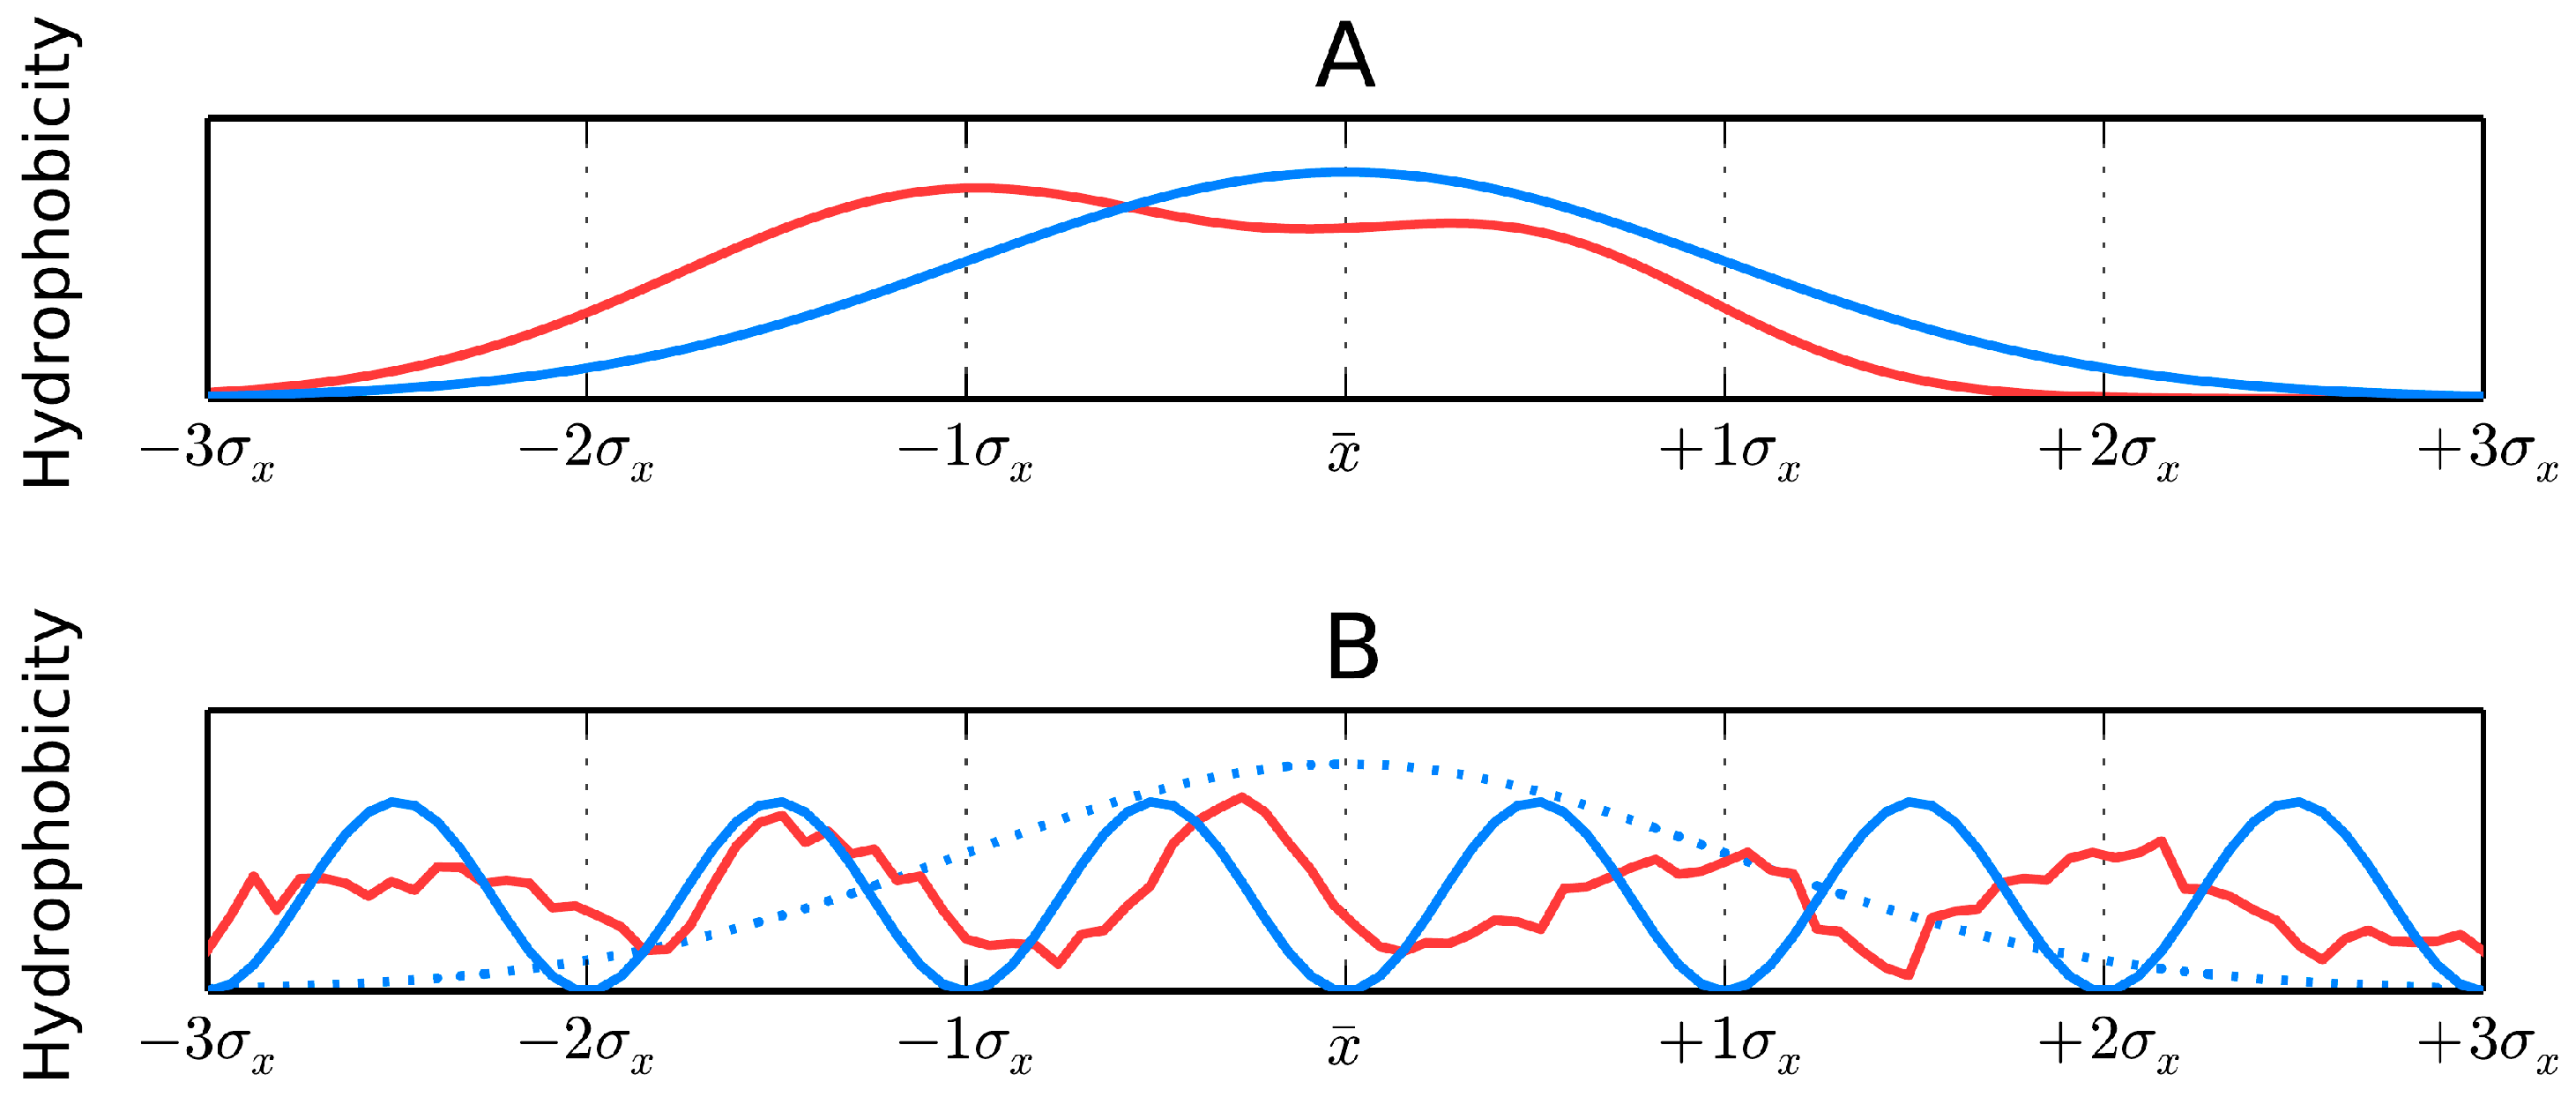
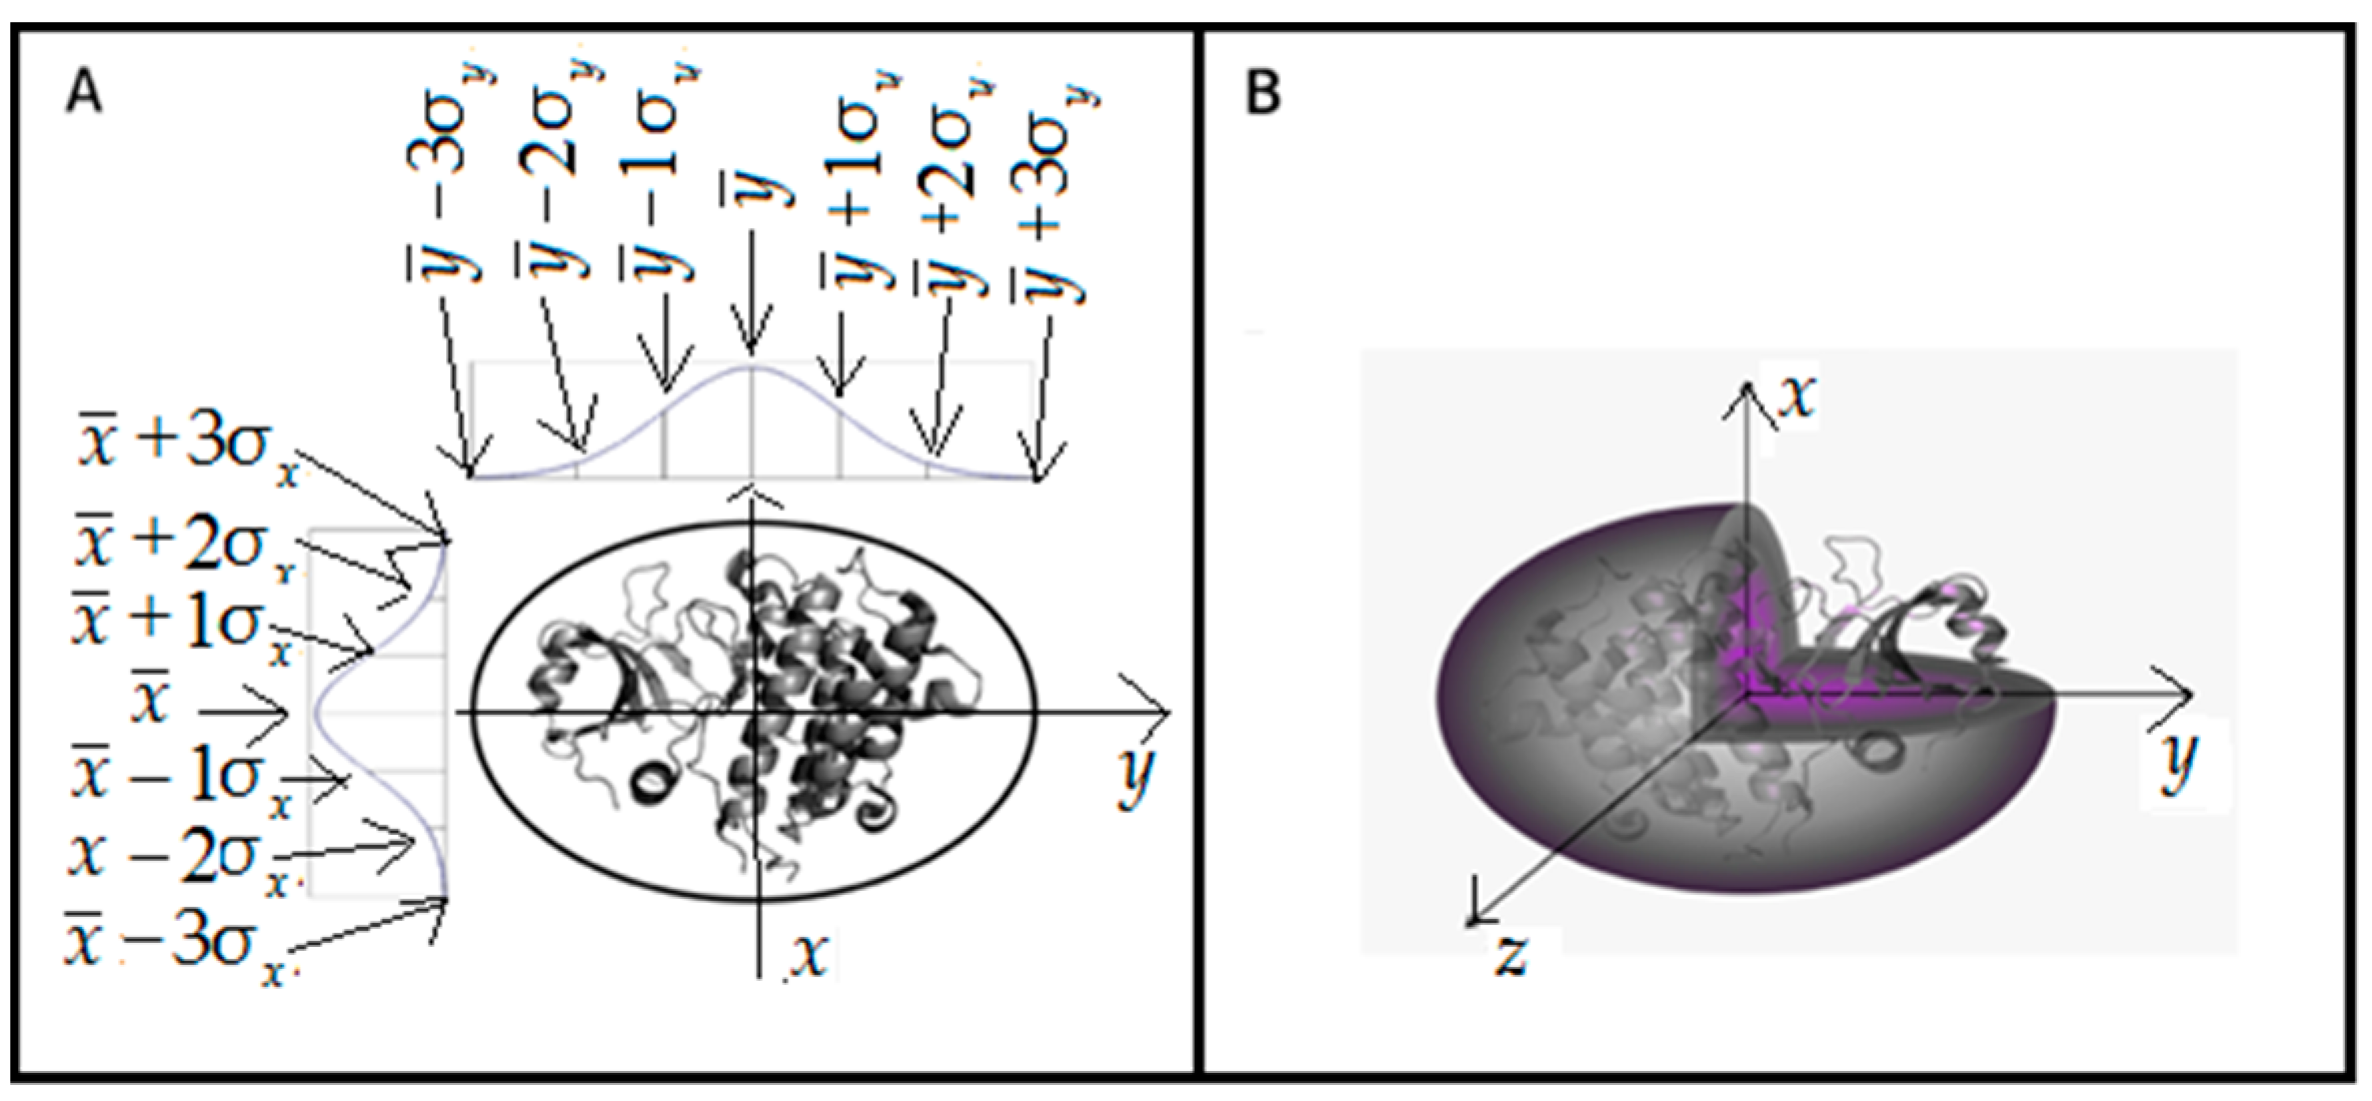
The above-mentioned continuous hydrophobicity density distribution can be represented by a 3D Gaussian, which assumes the shape of a bell curve centered on the midrange point of the free variable distribution range. Accordingly, the molecule is encapsulated in an axis-aligned ellipsoid upon which this 3D Gaussian function can be superimposed. The size of this ellipsoid (expressed by three sigma parameters) corresponds to the approximate size of the protein under consideration. The idealized hydrophobicity distribution in protein body follows the 3D Gaussian:
H t j = 1 H t s u m exp ( ( x j x ¯ ) 2 2 σ x 2 ) exp ( ( y j y ¯ ) 2 2 σ y 2 ) exp ( ( z j z ¯ ) 2 2 σ z 2 )
H t j is the theoretical hydrophobicity density (hence the t designation) at the j-th point in the protein body. x ¯ , y ¯ , z ¯ correspond to the peak of the Gaussian in each of the three principal directions, while σ x , σ y , σ z denote the range of arguments for each coordinate system axis. These coefficients are selected in such a way that 99% of the Gaussian’s integral is confined to a range of x ¯ ± 3 σ . Values of the distribution can be assumed to be equal to 0 beyond this range.
If the molecule is placed inside a capsule whose dimensions are given by x ¯ ± 3 σ x , y ¯ ± 3 σ y , z ¯ ± 3 σ z then the values of the corresponding Gaussian represent the idealized hydrophobicity density distribution for the target protein. If σ x = σ y = σ z the capsule is perfectly spherical; otherwise it is an ellipsoid. The Gaussian yields hydrophobicity density values at arbitrary points in the protein body—for example at points which correspond to the placement of effective atoms (one per side chain). H t j is the expected hydrophobicity density determined for the j-th amino acid while x, y and z indicate the placement of its corresponding effective atom.
The denominator of 1 H t sum expresses the aggregate sum of all values given by the Gaussian for each amino acid making up the protein. This enables normalization of the distribution since H t j will always be equal to 1.
H t j values reflect the expected hydrophobicity density which should correspond to each amino acid in order for the hydrophobic core to match theoretical predictions with perfect accuracy (with all hydrophobic residues internalized and all hydrophilic residues exposed on the surface). The closer to the surface the lower the expected hydrophobicity density.
The position of the j-th residue is represented by so called “effective atom” which is localized at the geometric center of each residue. A visualization of how the protein molecule is encapsulated by a 3D Gaussian is provided in Figure 2B. Figure 2A also visualizes how the size of the protein molecule in σ-units.
On the other hand, actual distribution of hydrophobicity density observed in a protein molecule depends on inter-chain interactions, which, in turn, depend on the intrinsic hydrophobicity of each amino acid. Intrinsic hydrophobicity can be determined by experimental studies or theoretical reasoning—our work bases on the scale published in [45], whereas the force of hydrophobic interactions has been calculated using other scales, as shown in [45]. For each amino acid j (or, more accurately, for each effective atom) the sum of interactions with its neighbors (9 Å cutoff distance) is computed and subsequently normalized by dividing it by the number of elementary interactions (following the function proposed in [46]):
H o j = 1 H o sum i = 1 N ( H i r + H j r ) { [ 1 1 2 ( 7 ( r i j c ) 2 9 ( r i j c ) 4 + 5 ( r i j c ) 6 ( r i j c ) 8 ) ]   for   r i j c 0   for   r i j > c
N is the number of amino acids in the protein, H i r and H j r express the intrinsic hydrophobicity parameters of the i-th and j-th residues while rij expresses the distance between two interacting residues (j-th effective atom and i-th effective atom). The parameter c expresses the cutoff distance for hydrophobic interactions, which is taken as 9.0 Å (following [46]). The H o sum coefficient, representing the aggregate sum of all components, is needed to normalize the distribution which, in turn, enables meaningful comparisons between the observed and theoretical hydrophobicity density distributions.
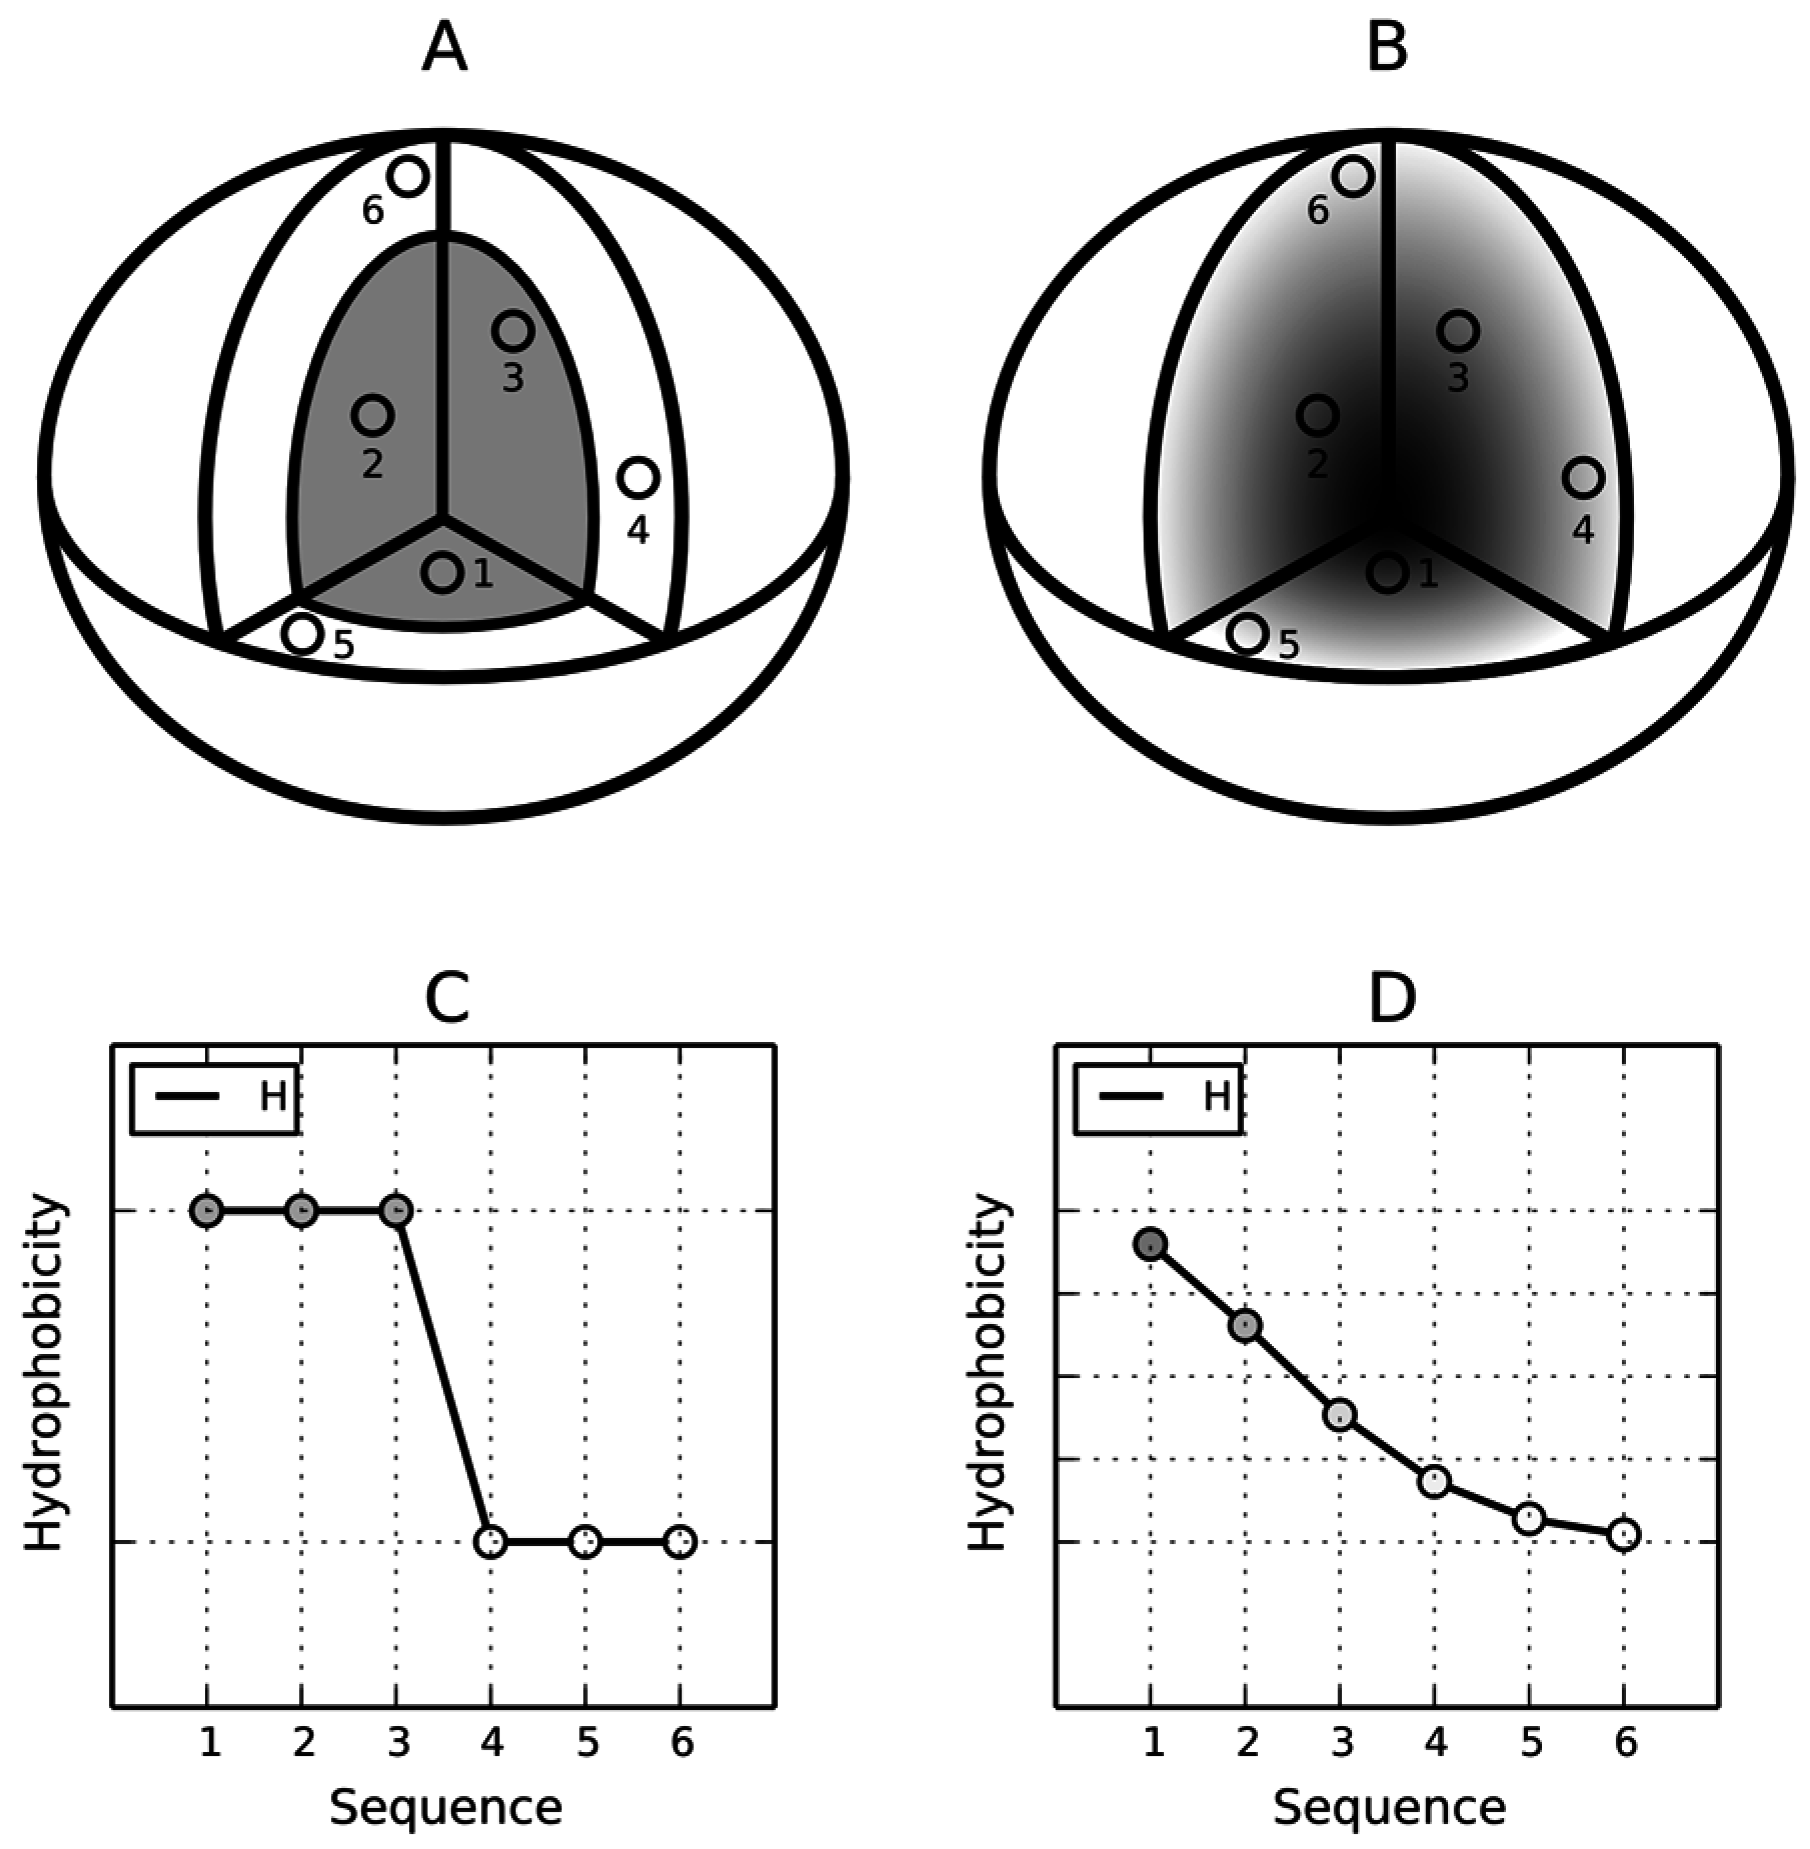
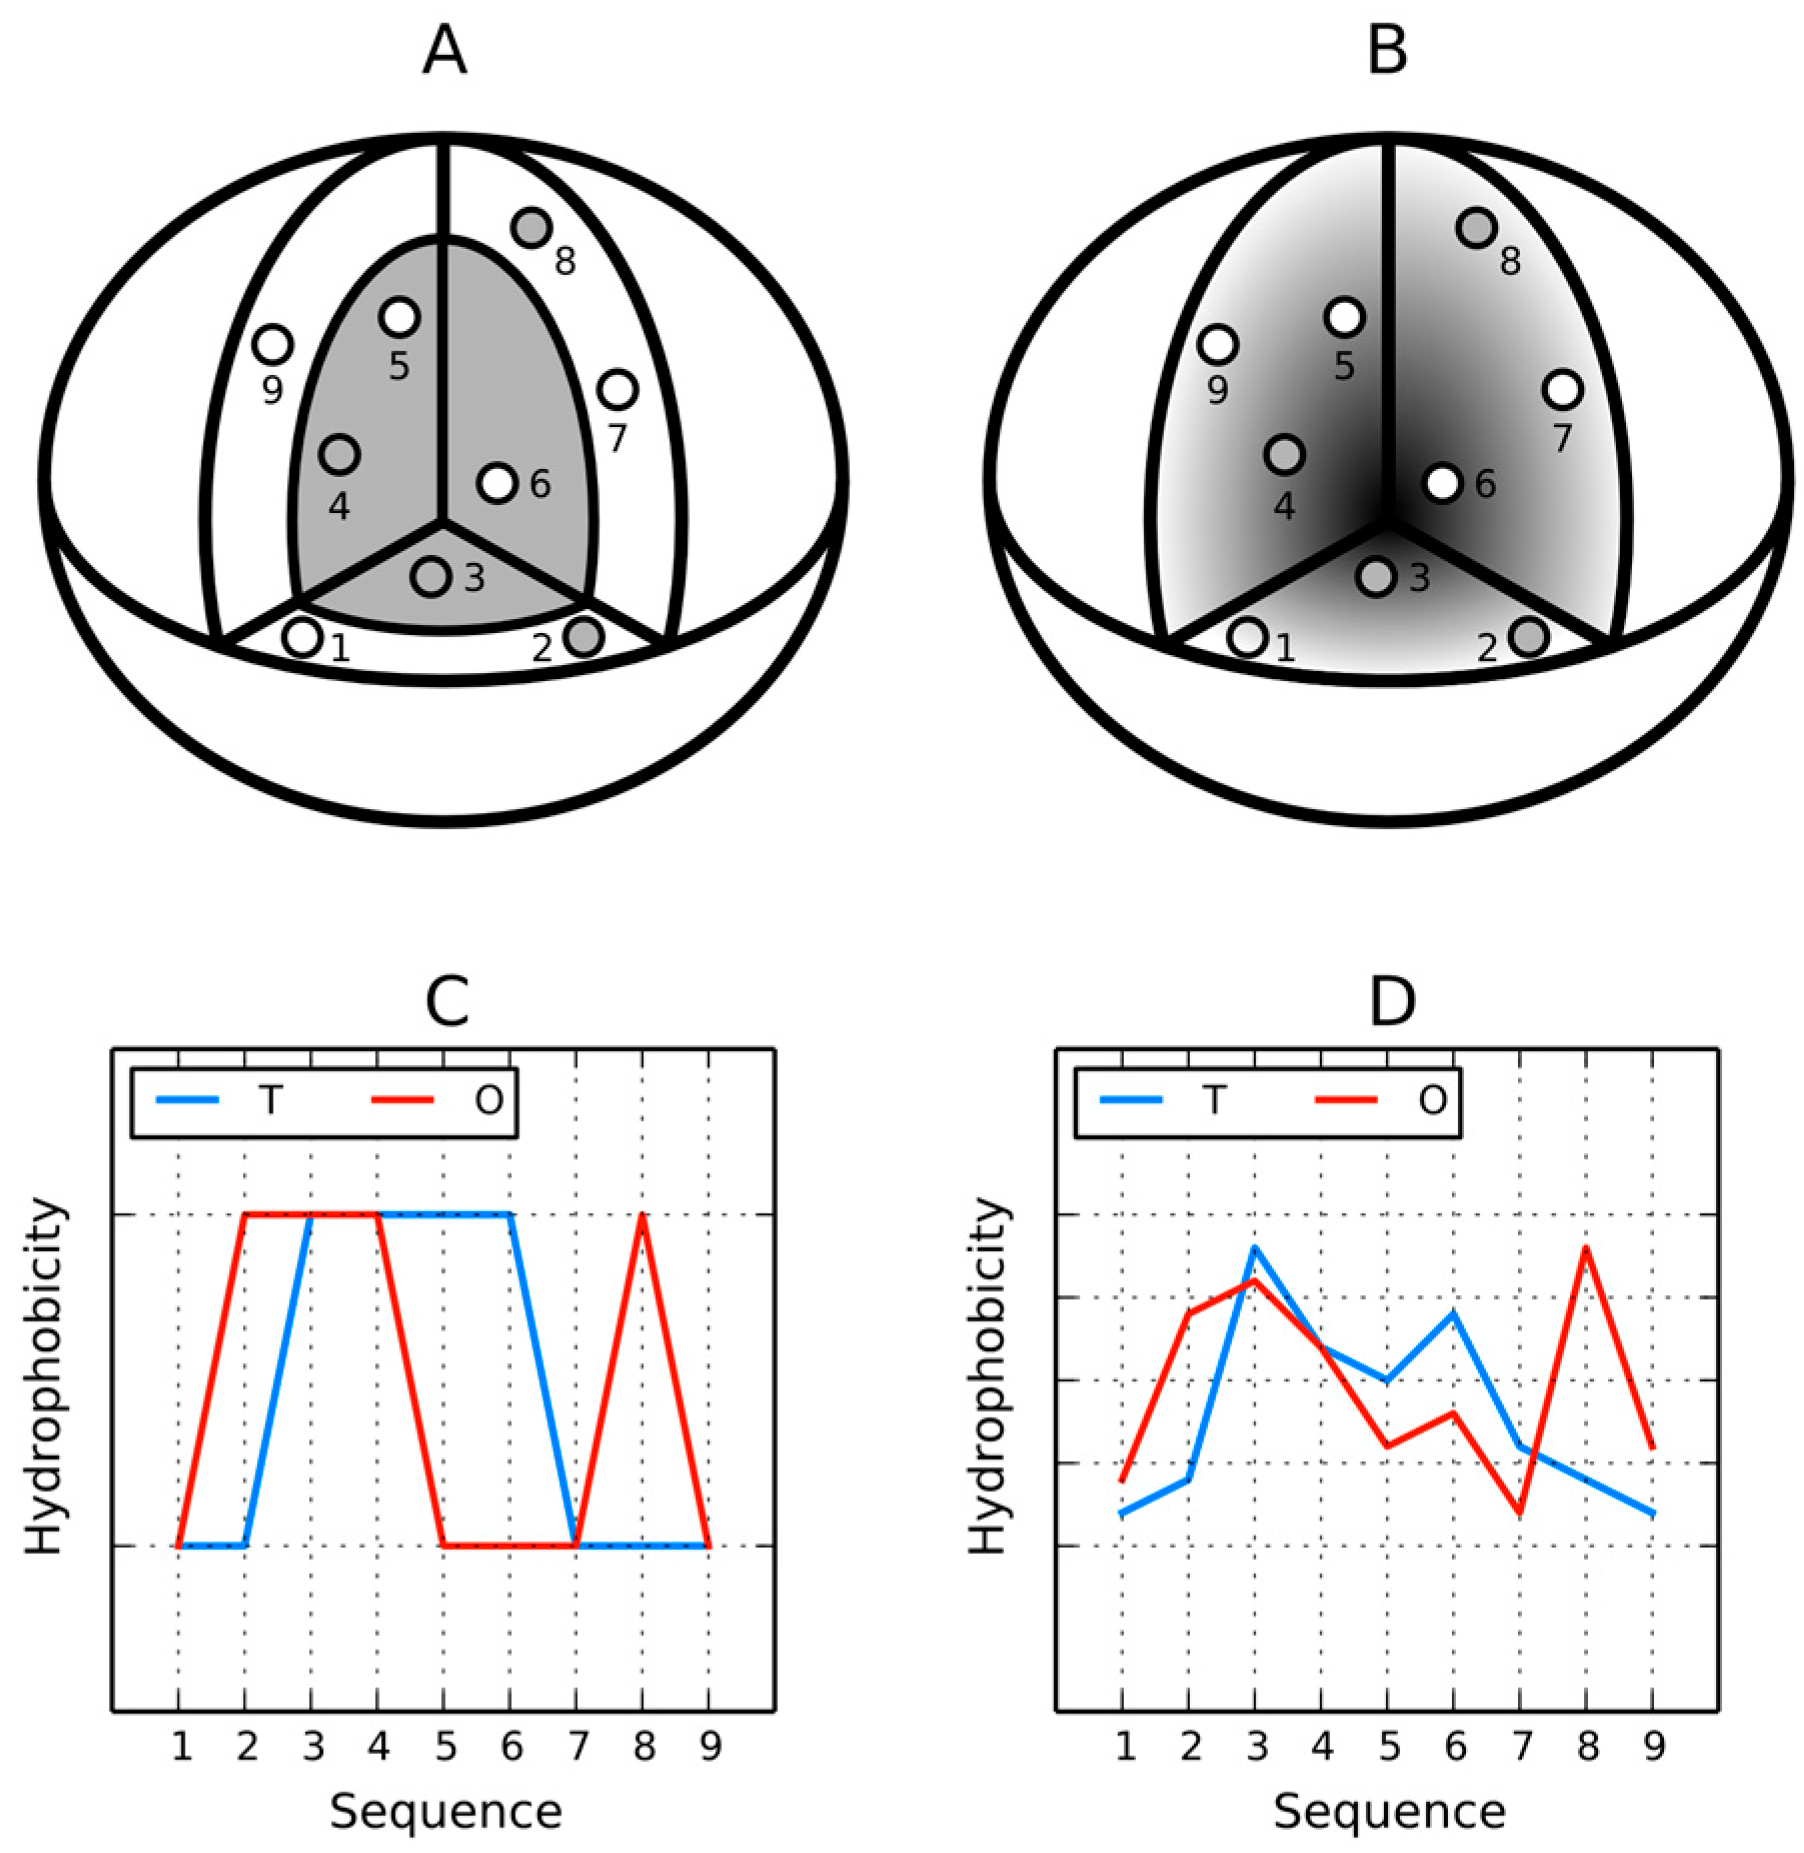
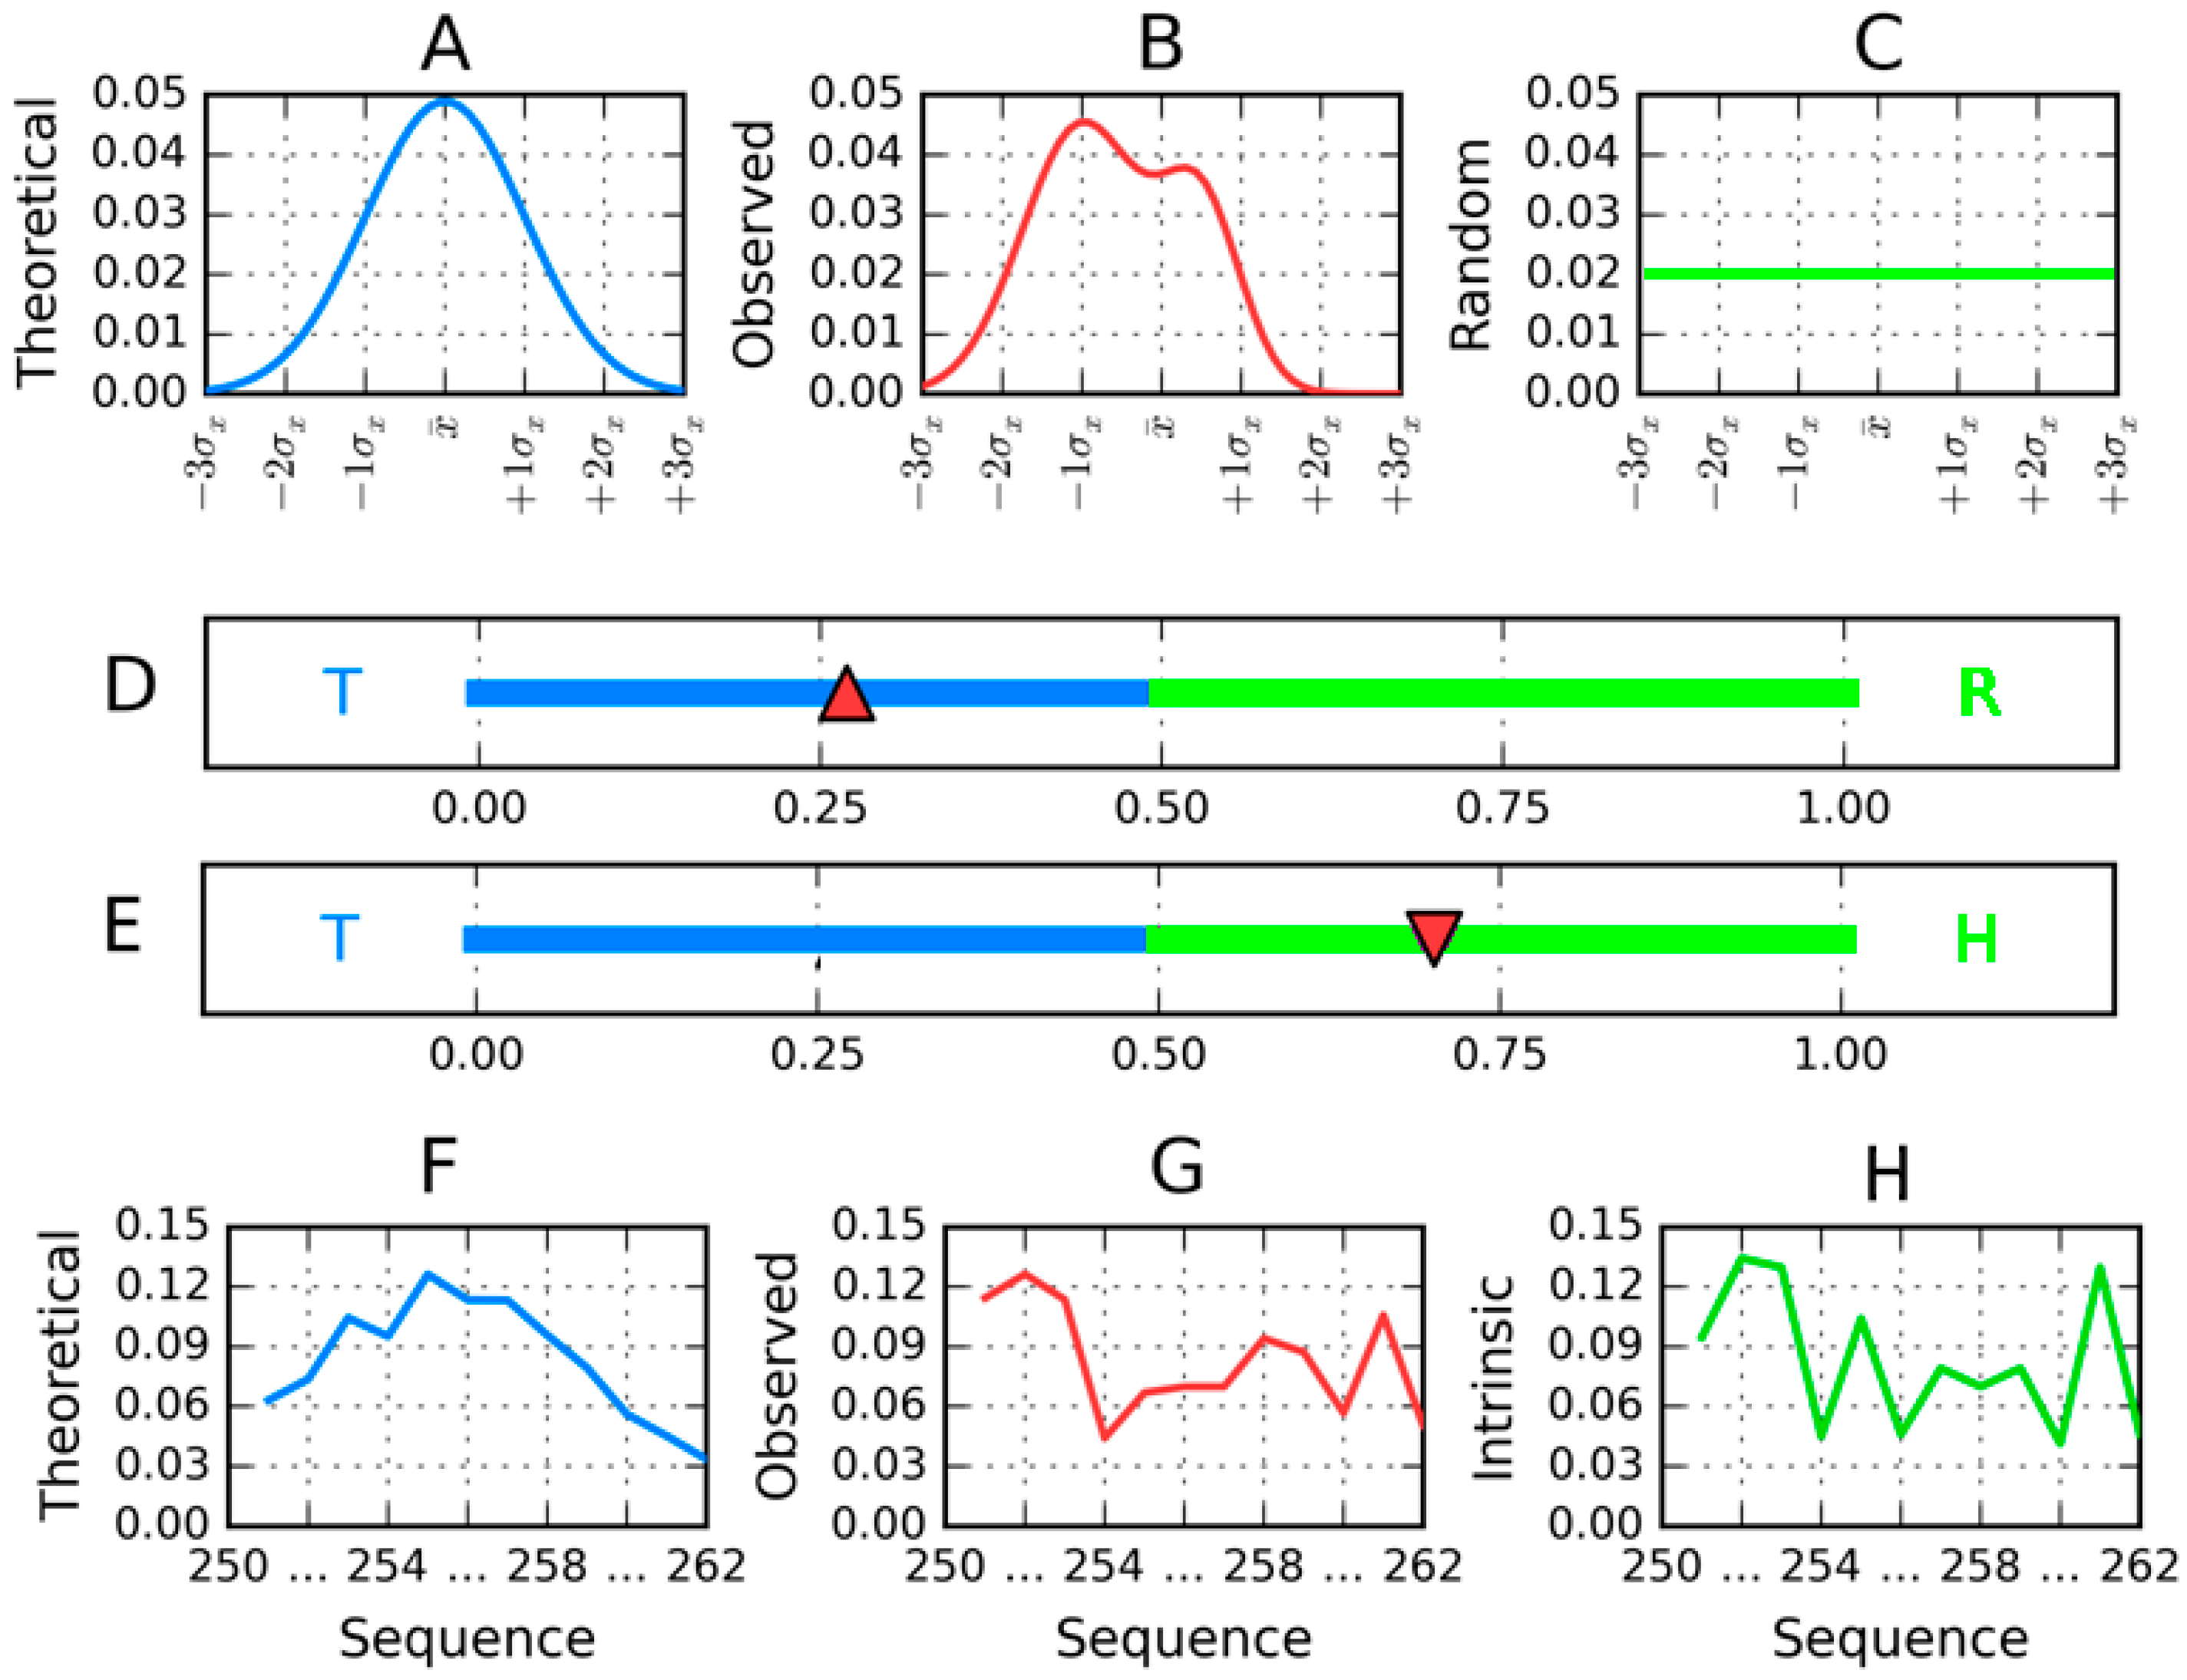
The residues in the protein body may be located in accordance with their own hydrophobicity (hydrophobic ones near the center and hydrophilic ones on the surface). However, it may also happen that this rule is not followed (Figure 3). The discrete model can be used to qualitatively characterize each residue as either “properly” or “improperly” located in the protein body (Figure 3A,C). In contrast, the continuous (fuzzy oil drop) model expresses this phenomenon in quantitative terms (Figure 3B,D). If we assign two parameters to each residue—its theoretical (T) and observed (O) hydrophobicity density—and then present both values for all residues in the protein chain in the form of a profile, the resulting charts can be superimposed to discover areas of disagreement between both distributions.
Actual distribution of hydrophobicity density in a protein molecule may differ from theoretical expectations since it is influenced by the properties of each residue—its placement in the protein body (including neighboring residues) and its intrinsic hydrophobicity (compare Figure 1 and Figure 3).
Both diagrams are accompanied by hydrophobicity density distribution profiles, revealing the expected (T) and observed (O) distributions. The latter takes into account the variable intrinsic hydrophobicity of each residue and its relative location in the protein body (which does not necessarily correspond to its individual properties).
Quantitative analysis, expressing the difference between the expected (T) and observed (O) distribution, is based on Kullback-Leibler divergence entropy formula [47]:
D K L ( p | p 0 ) = i = 1 N p i log 2 ( p i / p i 0 )
The value of DKL expresses the distance between the observed (p) and target (p0) distributions, the latter of which is given by the 3D Gaussian (T). The observed distribution is referred to as O.
For the sake of simplicity, we introduce the following notation:
D K L ( p | p 0 ) = i = 1 N p i log 2 ( p i / p i 0 )
O | T = i = 1 N O i log 2 ( O i / T i )
Since DKL is a measure of entropy it must be compared to a reference value. In order to facilitate meaningful comparisons, we have introduced another opposite boundary distribution (referred to as “uniform” or R) which corresponds to a situation where each effective atom possesses the same hydrophobicity density (1/N, where N is the number of residues in the chain). This distribution is deprived of any form of hydrophobicity concentration at any point in the protein body:
O | R = i = 1 N O i log 2 ( O i / R i )
Comparing O|T and O|R tells us whether the given protein (O) more closely approximates the theoretical (T) or uniform (R) distribution. Proteins for which O|T > O|R are regarded as lacking a prominent hydrophobic core. To further simplify matters we introduced the following relative distance (RD) criterion:
R D = O | T O | T + O | R
RD < 0.5 is understood to indicate the presence of a hydrophobic core.
Figure 4 presents a graphical representation of RD values, restricted (for simplicity) to a single dimension.
DKL (as well as O|T, O|R and RD) may be calculated for specific structural units (protein complex, single molecule, single chain, selected domain, etc.) In such cases the bounding ellipsoid is restricted to the selected fragment of the protein. It is also possible to determine the status of polypeptide chain fragments within the context of a given ellipsoid. This procedure requires prior normalization of O|T and O|R values describing the analyzed fragment.
RD values calculated for a selected fragment (following normalization of Ti and Oi values for the fragment under consideration). The complete profile shown in Figure 3D corresponds to RD = 0.657; however the fragment at 3–7 is characterized by RD = 0.338. The interpretation of this distribution is that, as a whole, the molecule lacks a stable hydrophobic core, although the selected fragment (3–7) represents very good local agreement between the observed and idealized hydrophobicity density distribution. The fragment at 3–7 can be interpreted as responsible for local hydrophobic core stabilization, independently of the status of the complete fold (which is seen as discordant).
The above procedure will be applied in the analysis of proteins described in this paper. By restricting our analysis to individual fragments we can determine whether a given fragment participates in the formation of a hydrophobic core. In particular, well defined secondary folds which satisfy RD < 0.5 are thought to contribute to structural stabilization, while fragments for which RD ≥ 0.5 are less stable. Such fragments, if present on the surface of the protein, may potentially form complexation sites. Identification of secondary structural folds and composition of protein domains follows the CATH [48] and PDBSum [49] classifications. Likewise, inter-domain/inter-chain contacts have been identified on the basis of the PDBSum distance criterion [49].
For the purposes of this publication we have defined another reference distribution, denoted H (Figure 4). This distribution expresses solely the intrinsic hydrophobicity of each amino acid residue (according to a preselected scale) [45]. In our work it replaces the uniform reference distribution (R) and is therefore regarded as the polar opposite of the theoretical distribution (T). H is only applied in the analysis of individual secondary folds. In order to avoid ambiguities, we introduce the following two parameters: RD(R) and RD(H), which express the status of the observed distribution with respect to two boundary cases: ranges defined by T and R, and by T and H respectively. The value of RD(R) is equivalent to the RD parameter, expressing the “distance” between the observed distribution and both “standard” reference distributions (T and R). Accordingly, it informs us whether the protein in question contains a well ordered hydrophobic core. In contrast, RD(H) reveals the degree to which the placement of individual residues in a given sequence matches their intrinsic hydrophobicity.

3. Materials and Methods

3.1. Data

Our work attempts to explain the observed variations in protein structure on the grounds of the fuzzy oil drop model. Table 1 lists the proteins subjected to analysis and supplies the justification for each selection. The selection criteria are based on the status of each molecule (domain) with regard to the fuzzy oil drop model, along with its propensity for amyloidogenesis. All analyzed proteins are dominated by β-strands. Human titin (1TIT) is a major structural component of muscle tissue. It exhibits very good accordance with the theoretical hydrophobicity density distribution and, accordingly, should not readily undergo conformational changes. This phenomenon appears related to its role—the muscle tissue is frequently subjected to stretching forces and the protein must be able to revert to its native form in the absence of external stimuli [19,20,21,22,23].
Our second study subject is human transthyretin, in which the distribution of hydrophobicity density diverges from theoretical expectations (based on the FOD model). This protein exhibits a notable tendency to generate amyloid fibrils, both in vitro and in vivo [24,25,26,27,28,29].
The third protein in the study set is the SufC-SufD bacterial complex involved in iron-sulfur cluster biosynthesis (2ZU0) which contains a large amyloid-like fragment—as indicated in several publications [30]. Due to the large size and varied structure of the SufC-SufD complex involved in the iron-sulfur cluster biosynthesis (2ZU0), we have singled out amyloid-like fragments which form part of its A and B chains. These residues (found at positions 151–367) are jointly referred to as “AmL”, while the protein itself is simply referred to as SufC-SufD (as its full name is somewhat lengthy).
In order to facilitate comparative analysis, we also extended our study with a prion protein (1B10) and synuclein (1XQ8). This yields a wider spectrum of structures upon which to identify structural changes which lead to the formation of amyloid aggregates.

3.2. Comparison of Sequences Expressed by Property Factor Approach

The manner in which we performed sequential comparisons of the presented proteins differs from standard practice. The usual algorithm is to process both chains one residue at a time and calculate the number of positions where residues either match or are closely related (e.g., Ile and Leu). In our study, however, the object of analysis is not a sequence of characters (amino acid codes) but rather the distribution of hydrophobicity along the input chain. The intrinsic hydrophobicity scale proposed in [12] is taken as the basis for computing correlation coefficients. Correlation is calculated for the intrinsic hydrophobicity (as embodied by a particular fragment) and for the observed (O) as well as theoretical (T) distributions. The correlation coefficients serve as a measure of similarity of each pair of fragments. Individual β folds of AmLare taken as templates. Each of them is treated as a window, which then overlaps fragments of the compared protein. The window is shifted along the chain with a step of 1 amino acid. For each overlap, the corresponding correlation coefficient is calculated. A high value is seen as indication that the given fragment (in the protein undergoing analysis) closely corresponds to the template and is therefore a potential seed for amyloid formation.

4. Results

4.1. Β-Sandwich Domain in Titin—Assumed Low Susceptibility to Amyloid Transformation

The titin domain is an example of a structure which contains a prominent hydrophobic core (RD = 0.382). This low value indicates that the observed distribution (Table 2) closely corresponds to theoretical values and that therefore the protein contains a concentration of hydrophobicity density at its center, encapsulated in a hydrophilic shield (which, according to the fuzzy oil drop model, forms an integral part of what we refer to as the “hydrophobic core”). 
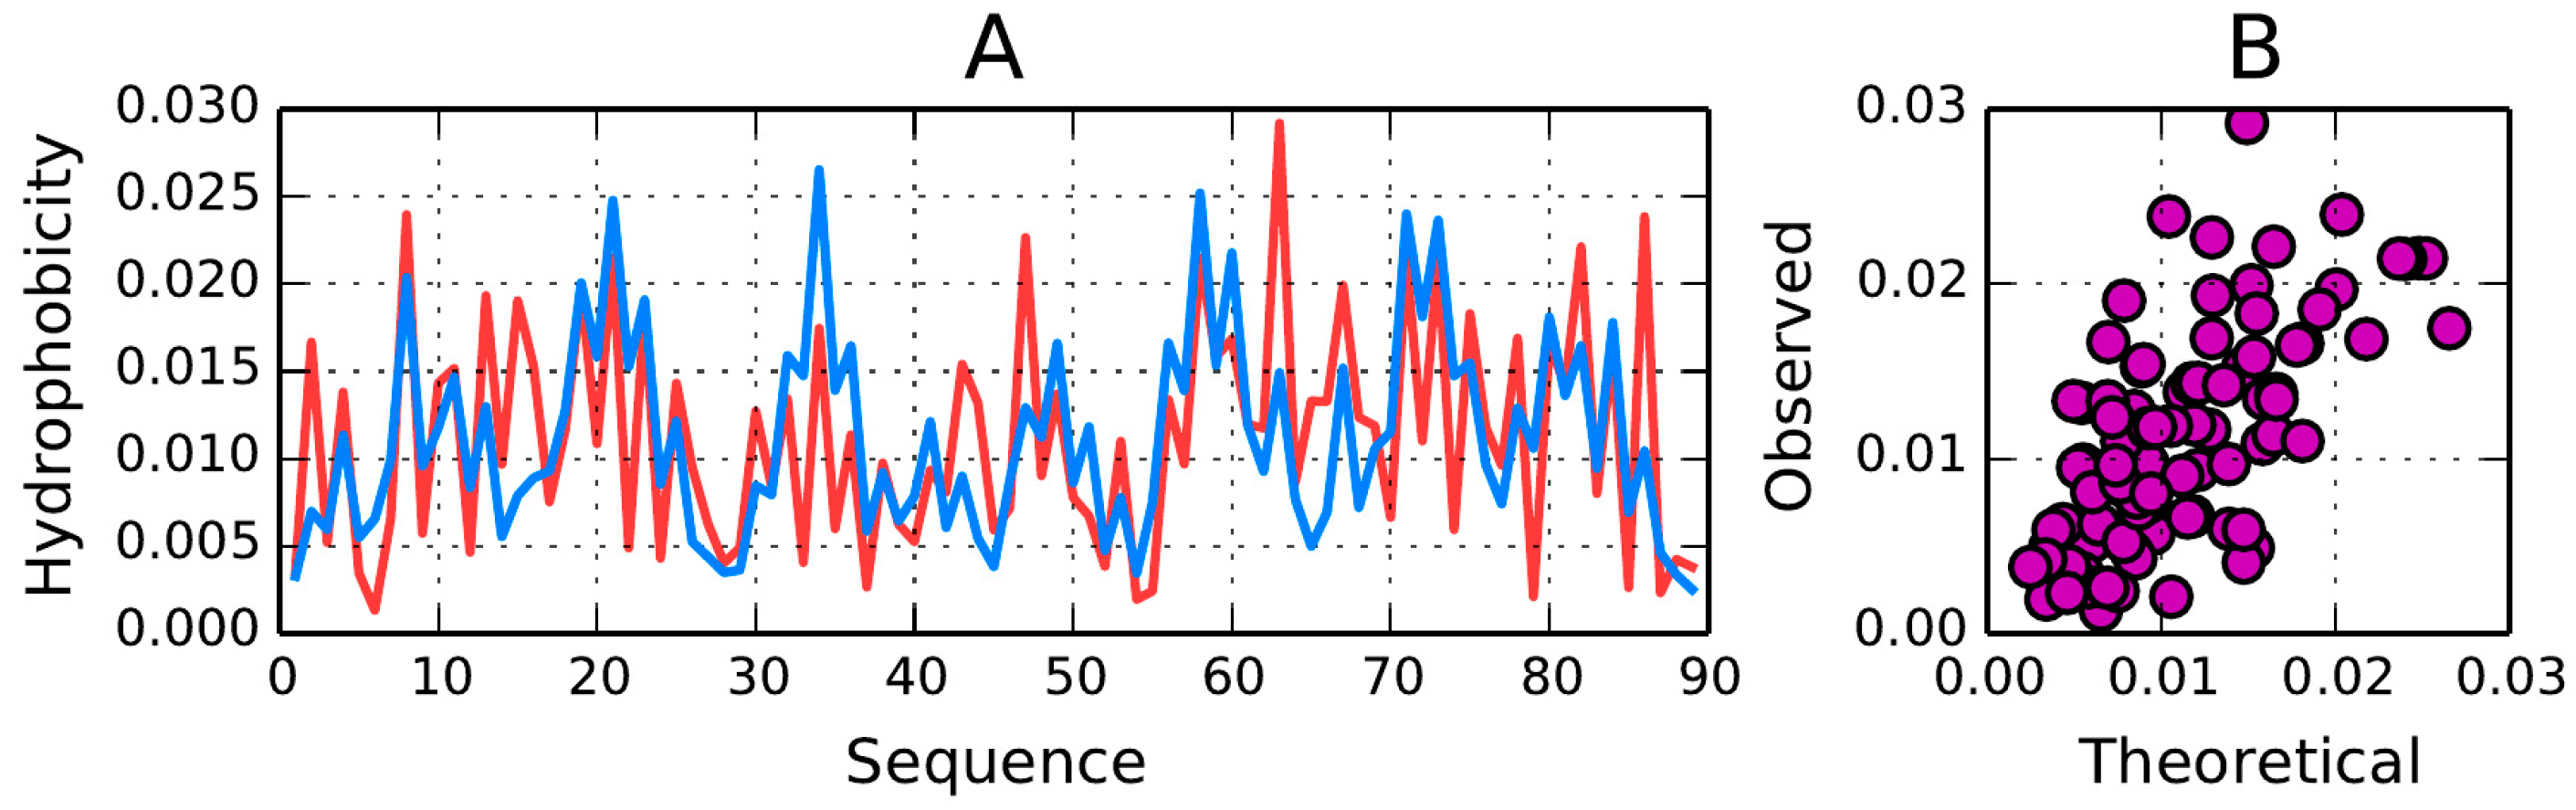
Figure 5A illustrates good agreement between T and O in titin. Local deviations from the model (excess hydrophobicity at positions 15, 16, 43–44, 65–66 and 63, along with a hydrophobicity deficiency at positions 33–35) do not spoil the big picture—the molecule as a whole is regarded as stable. This observation is also in agreement with the correlation coefficient (observed versus expected) computed for the whole domain (correlation coefficient = 0.661—Figure 5B).
The very low values of RD (RD(R)) obtained for the whole domain as well as for its individual β-strands suggest the presence of a well-ordered hydrophobic core (the observed structure is a much better match for the theoretical distribution than for the uniform distribution where no hydrophobicity density concentration is expected at any point in the protein body).
With regard to RD(H), the corresponding RD values suggest variations in the status of individual folds, with five of them approximating the H distribution (dependent—as remarked above—only on the intrinsic hydrophobicity of each residue).
The correlation coefficients calculated for both pairs of distributions (O vs. T and O vs. H) for individual β-strands are generally high, indicating good agreement between all three profiles (T, O and H), as depicted in Figure 6. Their obvious similarity is confirmed by numerical data in Table 2, with particularly good agreement observed for T and O at positions 46–52 and 54–61.
The β-strands forming the β-sandwich are positioned coaxially, linking the poles of this elongated structure. We can therefore expect hydrophobicity to peak in the central section of each fold, with lower values observed near its terminal fragments.
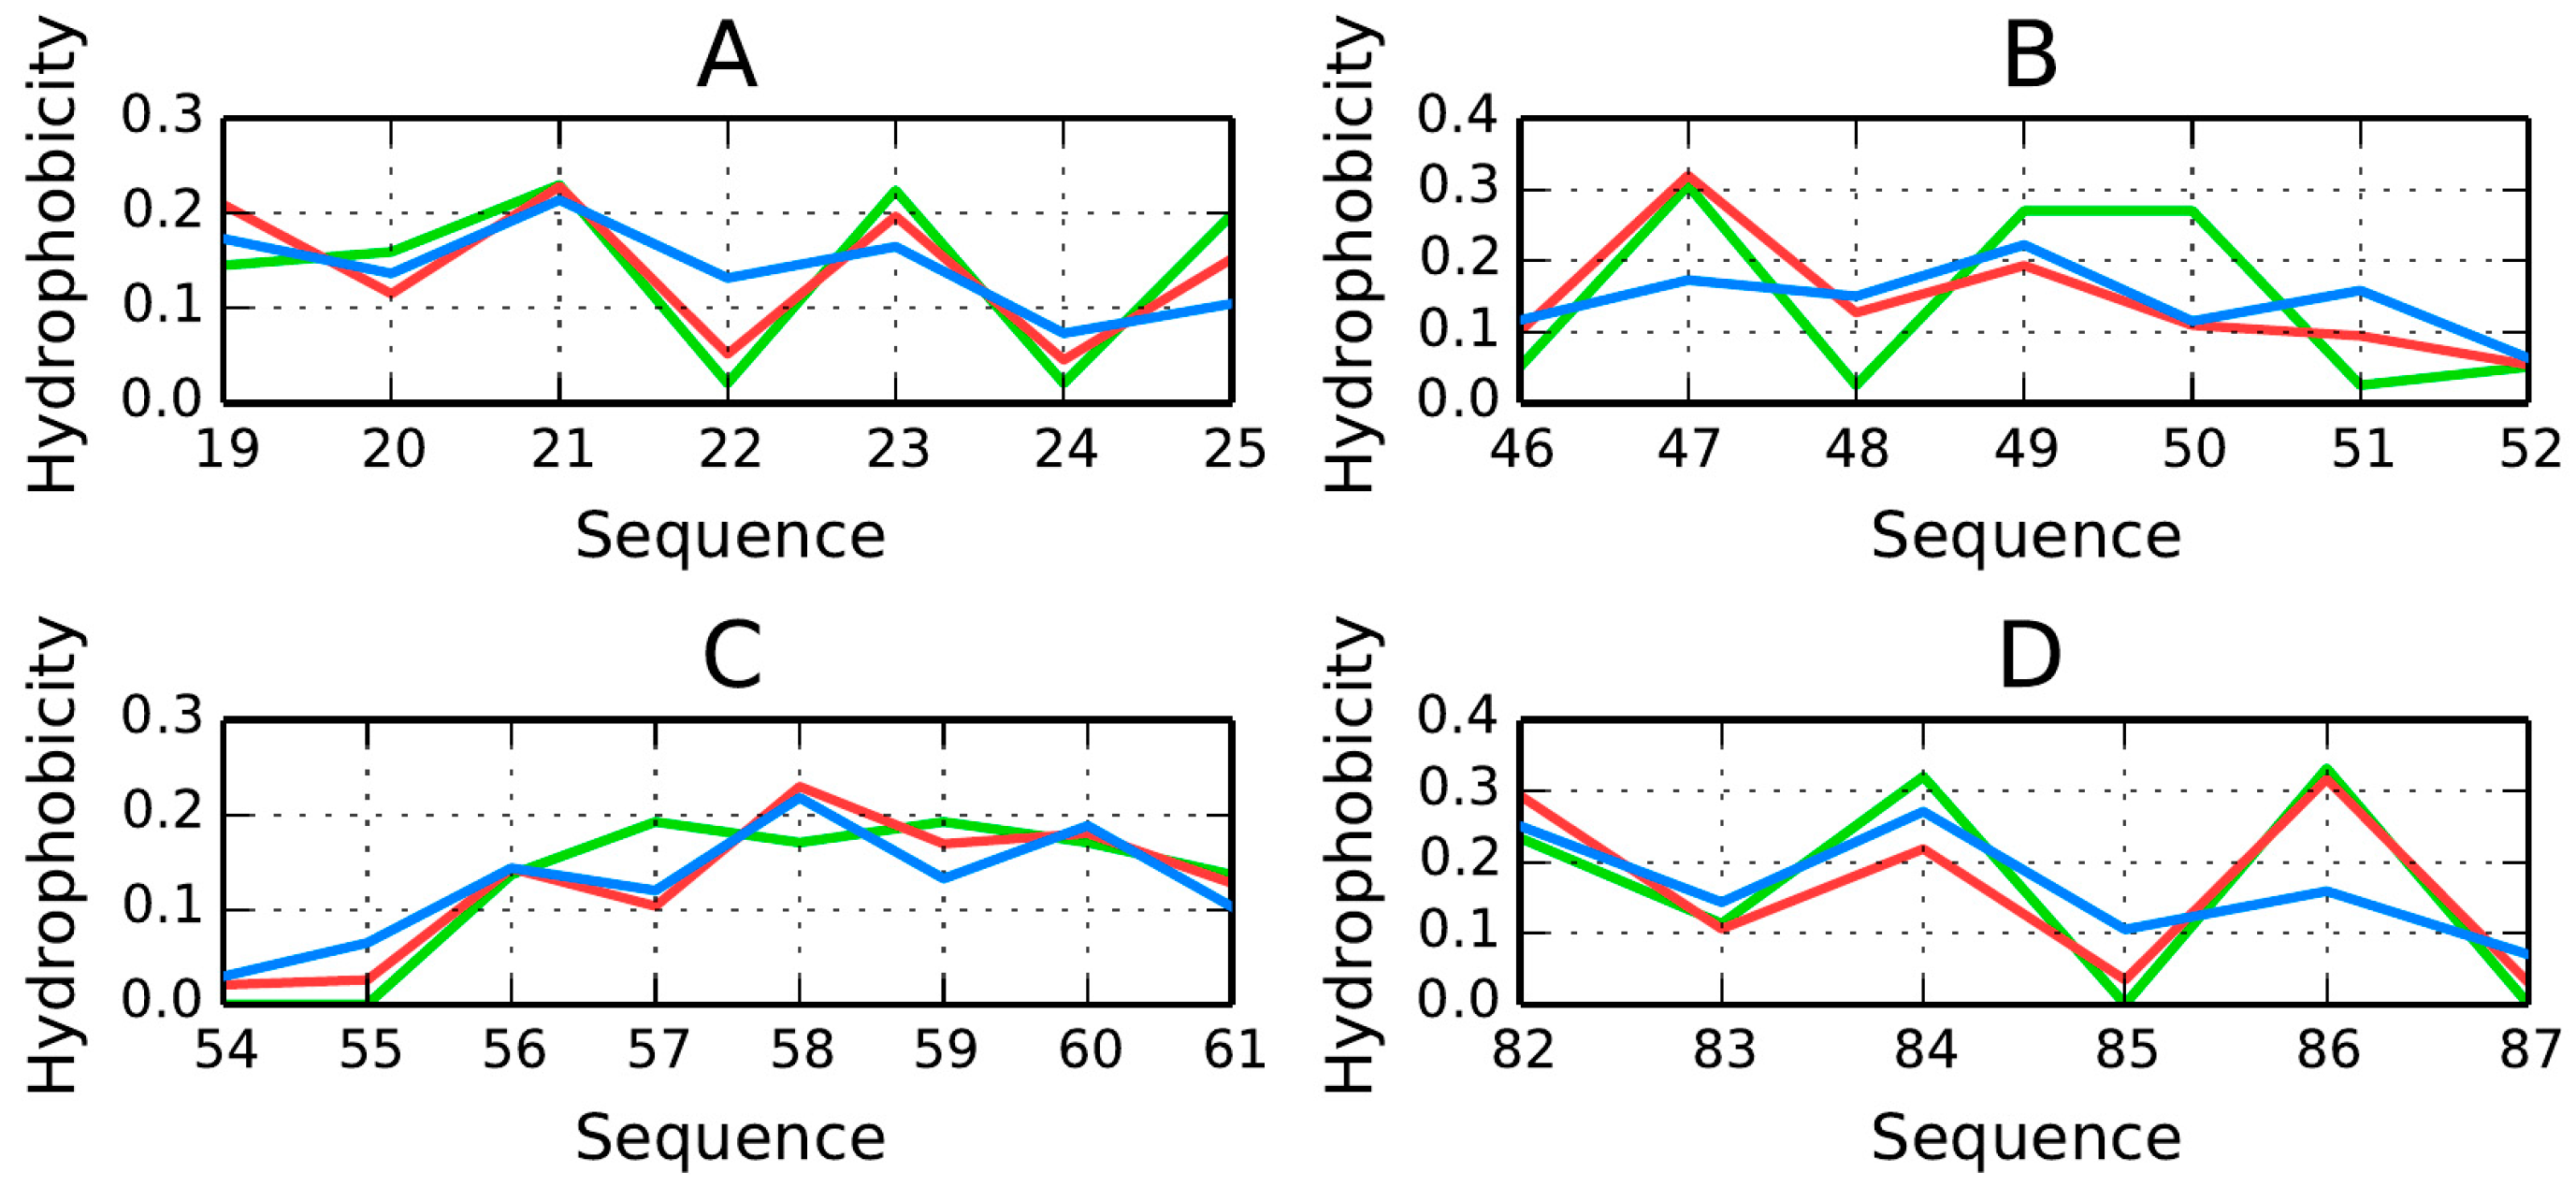
Figure 6 presents hydrophobicity density distribution charts for each β-strand, confirming that each fold contains a hydrophobic section near its center (except fragments 19–25 (Figure 6A) and 82–87 (Figure 6D) for which RD > 0.5—Table 2). These maxima are particularly evident in T and O, suggesting that the central sections of β-strands participate in the formation of a stable hydrophobic core. Equally important are the lower density values computed for terminal residues. This phenomenon is also evident when analyzing the intrinsic hydrophobicity of each residue (recall that, according to the fuzzy oil drop model, the “hydrophobic core” actually comprises a highly hydrophobic central section along with an encapsulating hydrophilic shield). It appears that β-strands which stretch from one pole of the elongated sandwich structure to the other provide 1TIT with a hydrophobic core matching theoretical expectations.
The β-strands at 54–61 (Figure 6C) and 46–52 (Figure 6B) are in particularly good agreement with theoretical values, possessing hydrophobic fragments in their central sections and hydrophilic fragments on the outside.
RD(H) values (highlighted in Table 2) do not seem to be important for hydrophobic core formation, taking into account the high correlation coefficients for both T/O and T/H. This means that a consensus has emerged among all distributions in this molecule. Figure 7 shows a highly accordant β-strand in the titin domain.
The correlation coefficients calculated for the complete domain seem to be dominated by the status of loops, since only loop fragments express local discordance versus fuzzy oil drop model expectations.

4.2. β-Sandwich Domain in Transthyretin—Amyloid Transformation Observed in Vivo and in Vitro

The second object of our analysis is transthyretin—a protein dominated by β-strands. This protein is a common study subject in amyloidogenesis research due to its susceptibility to conformational changes which produce fibrillary structures, both in vivo and in vitro [25,26,27,28,29].
According to FOD criteria, this protein is significantly less stable than titin (RD for the whole molecule is equal to 0.650). 
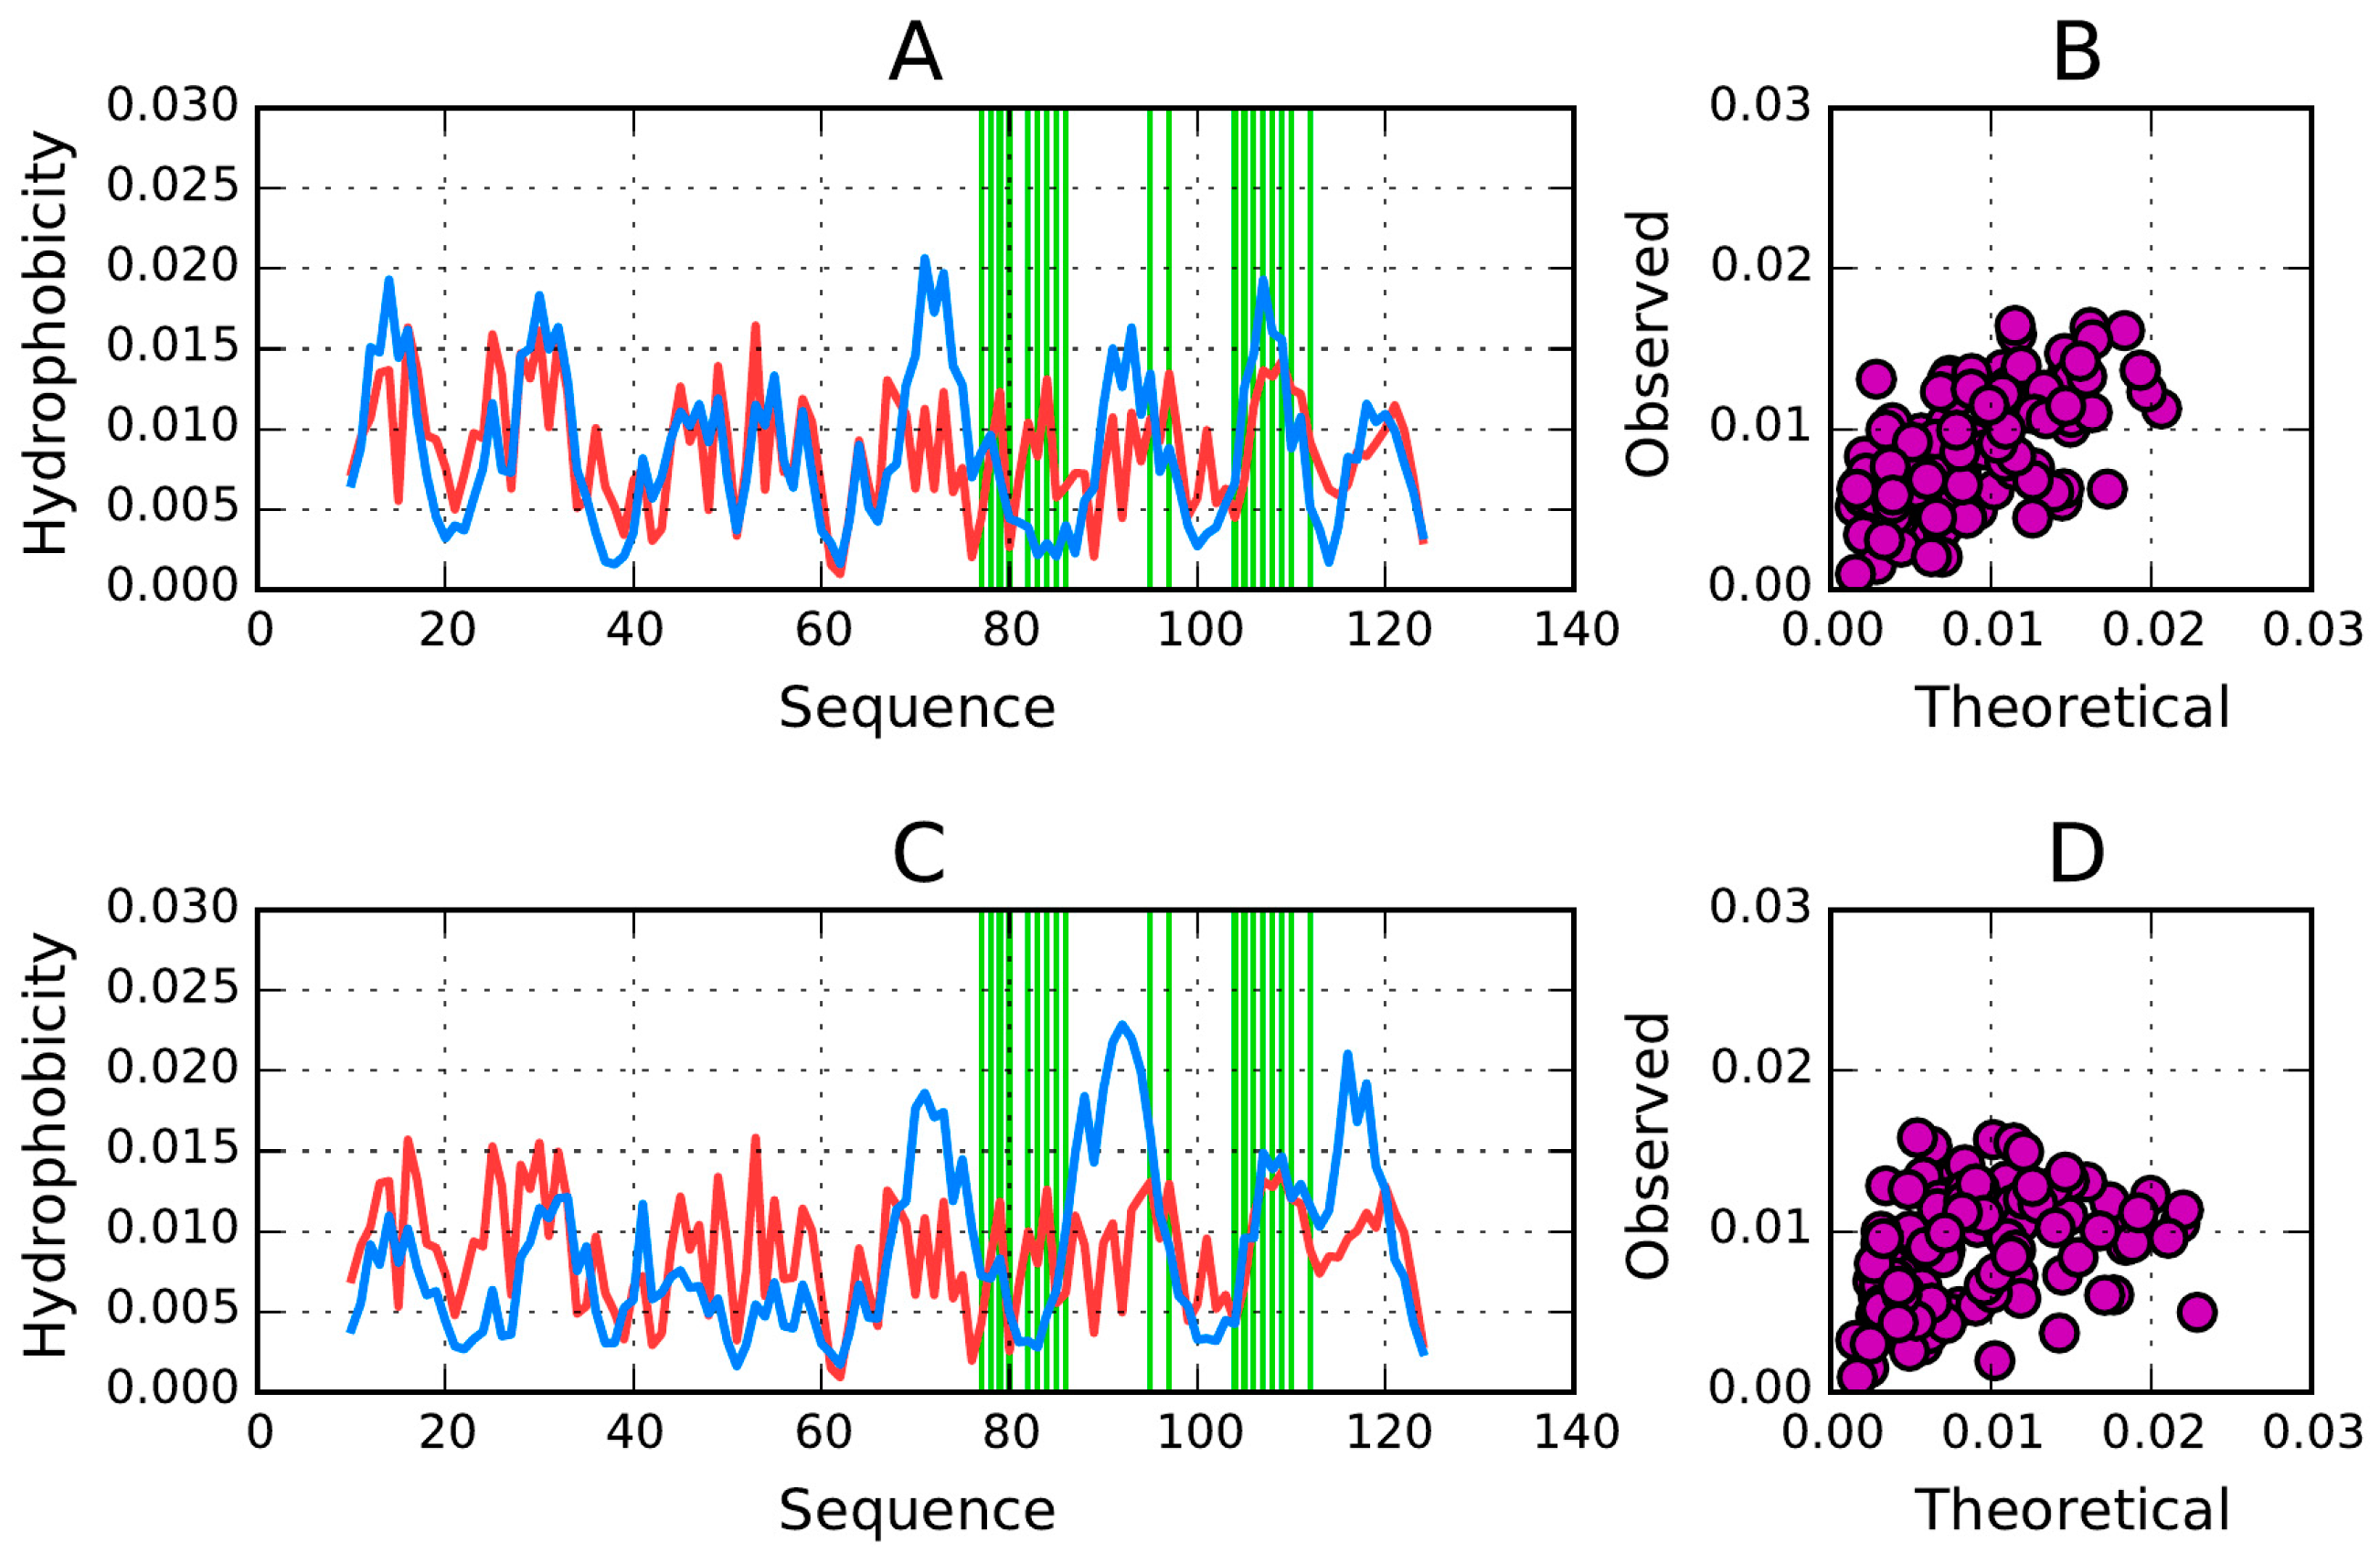
Figure 7A,C illustrate T and O hydrophobicity density distribution profiles for transthyretin. Its RD value of 0.650, which far exceeds the corresponding value for 1TIT, results from the variable status of individual β-strands (Table 2).
Interpretation of hydrophobicity density distribution profiles in transthyretin (monomeric and dimeric forms) reveals gaps in the structure of their hydrophobic cores—specifically, there is insufficient hydrophobicity at the center of the molecule, where, according to the FOD model, highly hydrophobic conditions should exist (residues 60–80) (Figure 7). We can also discern areas of excess hydrophobicity on the molecular surface. Surprisingly, these areas appear to not participate in dimerization.
On the other hand, in the protein’s dimeric form fragments which should comprise a shared core are, in fact, weakly hydrophobic, while polar regions contributed by each monomer exhibit excess hydrophobicity (Figure 8). Fragments given in bold in Table 3 and Table 4 reveal the most discordant positions. In particular, the high correlation coefficient for O/H, along with the low correlation coefficient for O/T suggest high discordance versus the theoretical model. The additional fragment at 87–96 upholds this discordant status in the complex (Figure 8).
Elimination of fragments at 70–76 and 81–94 renders the remainder of the molecule consistent with the theoretical distribution. Accordingly, the remaining fragments are thought to contribute to structural stabilization of the protein RD (RD(R) = 0.45), while the two eliminated fragments distort its hydrophobic core structure.
The fragment at 40–60 which, in the monomeric form, exhibits excellent accordance with the model, is seen as overly hydrophobic in the dimer. It may mediate complexation of additional monomers via contact between hydrophobic areas exposed on their surface.
A measure of how much the dimeric form diverges from theoretical expectations (compared to the monomer) is provided by the scatterplot relating theoretical and observed values for each of its residues (Figure 9B,D). The correlation coefficients calculated for the monomeric and dimeric forms of transthyretin (theoretical versus observed) are 0.366 and 0.592, respectively.
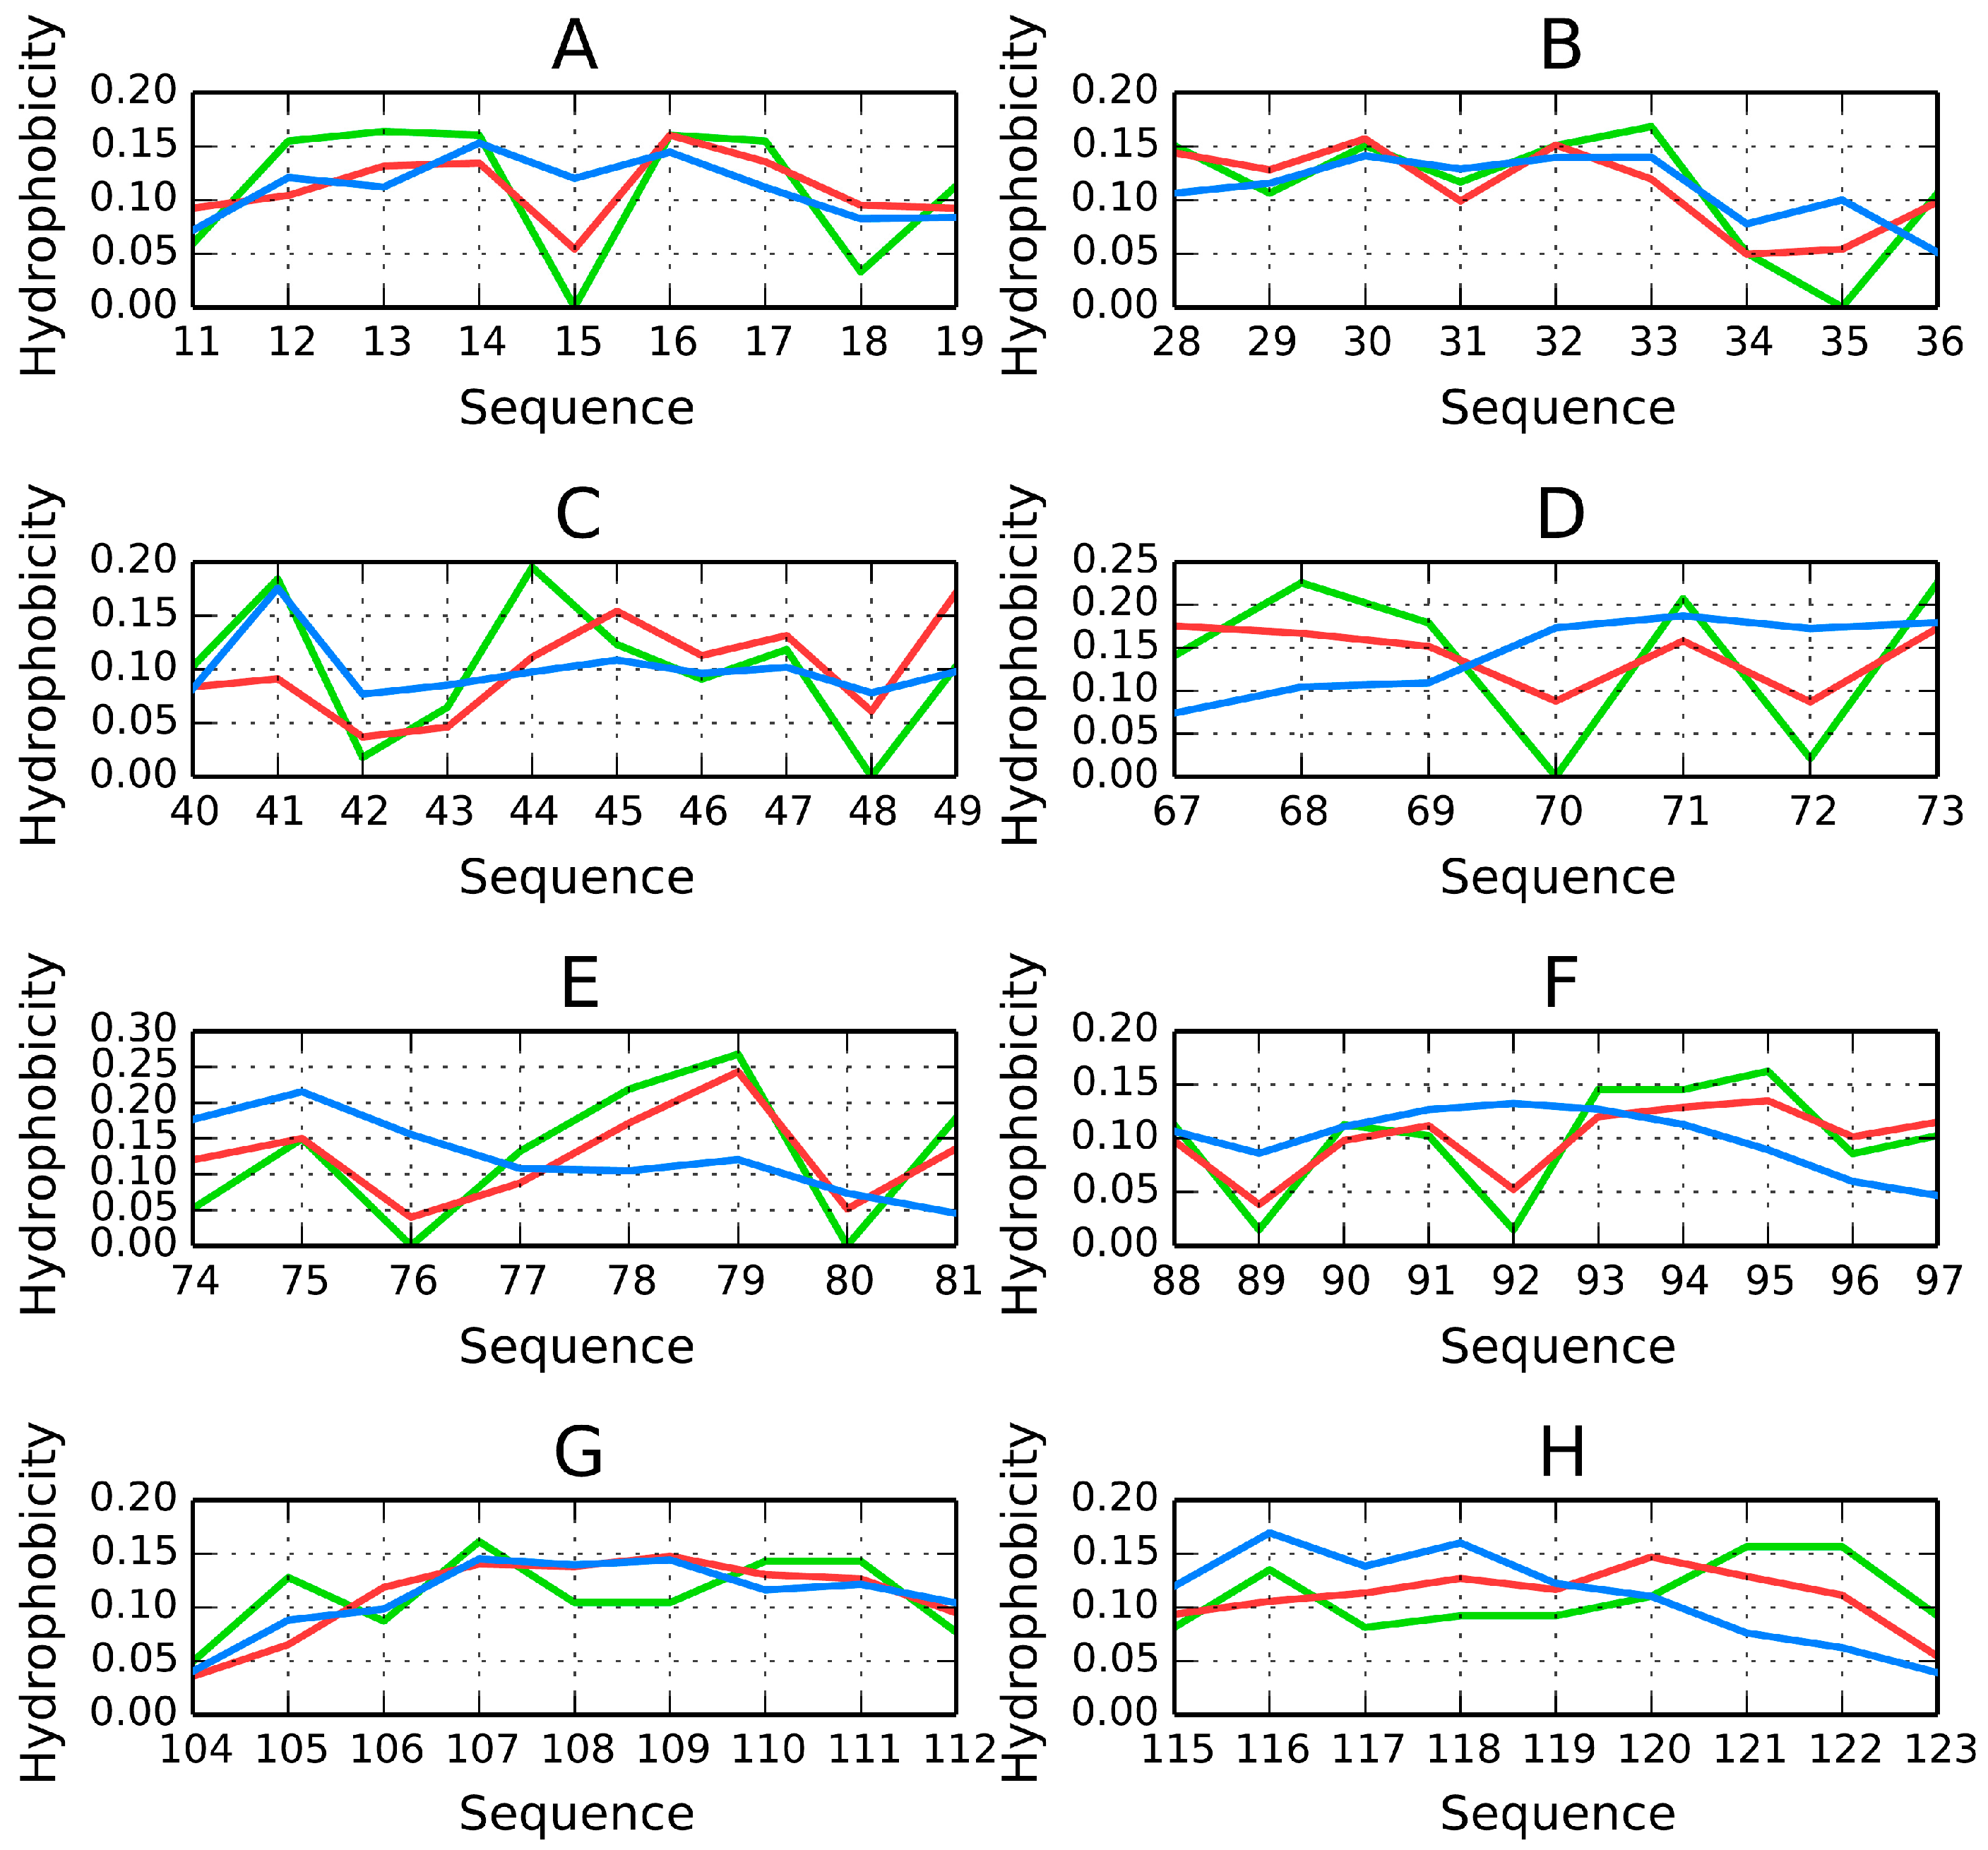
Particular attention should be devoted to fragments at 23–25, 28–36 and 104–112 (Figure 9B,G), listed in Table 3. All of them conform to the model with high accuracy. Much like in titin, good agreement is observed for both sets of reference distributions (T vs. O and T vs. H). Fragments at 11–19, 67–73, 74–81 and 88–97 (Figure 9A,D–F) diverge from the model, with high RD values calculated for the T distribution (meaning significant deviations from the concentric hydrophobicity density field), as well as for the H distribution (indicating that the placement of individual residues is not aligned with the structure of the shared core but instead corresponds to their intrinsic hydrophobicity, and can therefore be called “selfish”). This phenomenon is readily apparent in Figure 9A,C–F.
Two β-strands (67–73 and 87–97) diverge substantially from the theoretical distribution in favor of the intrinsic distribution.
It appears that the fragments at 28–36 and 104–112 participate in the formation of a shared hydrophobic core, while those at 67–73, 74–81 and 87–97 exhibit increased hydrophobicity in an area where low hydrophobicity is expected (exposure of hydrophilic residues on the protein surface).
Comparative analysis of the monomeric and dimeric forms of transthyretin leads to the following conclusions:
  • The monomer as well as the dimer are devoid of a prominent, shared hydrophobic core (theoretical profile maxima do not correspond to observed areas of high hydrophobicity).
  • Contrary to expectations, residues exposed on the surface do not participate in transthyretin dimer formation (Figure 9A,C).
  • The correlation coefficient between T and O increases for the dimer versus the monomer (Figure 9B,D).
  • Individual β folds in both the monomer and the dimer tend to be accordant with the model and therefore participate in the formation of a shared (dimeric) hydrophobic core.

4.3. SufC-SufD Complex Involved in Iron—Sulfur Cluster Biosynthesis, Containing an Amyloid-Like Structural Motif

The SufC-SufD complex involved in iron-sulfur cluster biosynthesis (2ZU0) is a very large molecule comprising four chains: A and B (416 residues each), C (247 residues) and D (42 residues—partially represented). Table 4 lists the status of each chain. The B chain is further subdivided into three parts: the N-terminal fragment, the AmL section and the C-terminal fragment. As mentioned above and highlighted in numerous publications [36,37,38] AmL exhibits an amyloid-like structural form [50,51,52,53,54,55]. Results listed in Table 5 describe the SufC-SufD complex involved in iron-sulfur cluster biosynthesis as a whole (single common 3D Gaussian) and individually for each chain.
Interpretation of results listed in Table 5 indicates that no shared hydrophobic core is present in the complex. This is confirmed by the specific arrangement of individual chains, which assemble into a highly non-globular structure. Each chain appears to be a distinct unit rather than part of a larger whole (RD values in excess of 0.7 for chains analyzed as parts of the complex, but significantly lower for chains analyzed separately). RD ≥ 0.5 typically indicates the lack of a well-ordered hydrophobic core; however, given the length of each chain (over 400 aa for chains A and B), we should not expect RD values to be lower than 0.5 (such values are generally seen in domains not larger than 150 aa). Accordingly, we treat slight violations of the “RD < 0.5” rule as indicative that the chain in question does contain a hydrophobic core while also exposing a sizeable interface useful in attracting complexation partners. Elimination of residues involved in P-P interactions results in lower RD values, confirming that complexation requires local instabilities in the protein body.
Chains labeled A and B both include a peculiar, rarely observed structural motif—a long β-sheet exhibiting a distinct periodicity. This fragment resembles typical amyloid structures, as presented in numerous research papers discussing the conformation of amyloids [36,37,38]. For this reason the fragment in question (151–365 in the A–B complex) is singled out and labeled “AmL”, while the remaining components of each chain (the N- and C-terminal fragments) are analyzed separately.
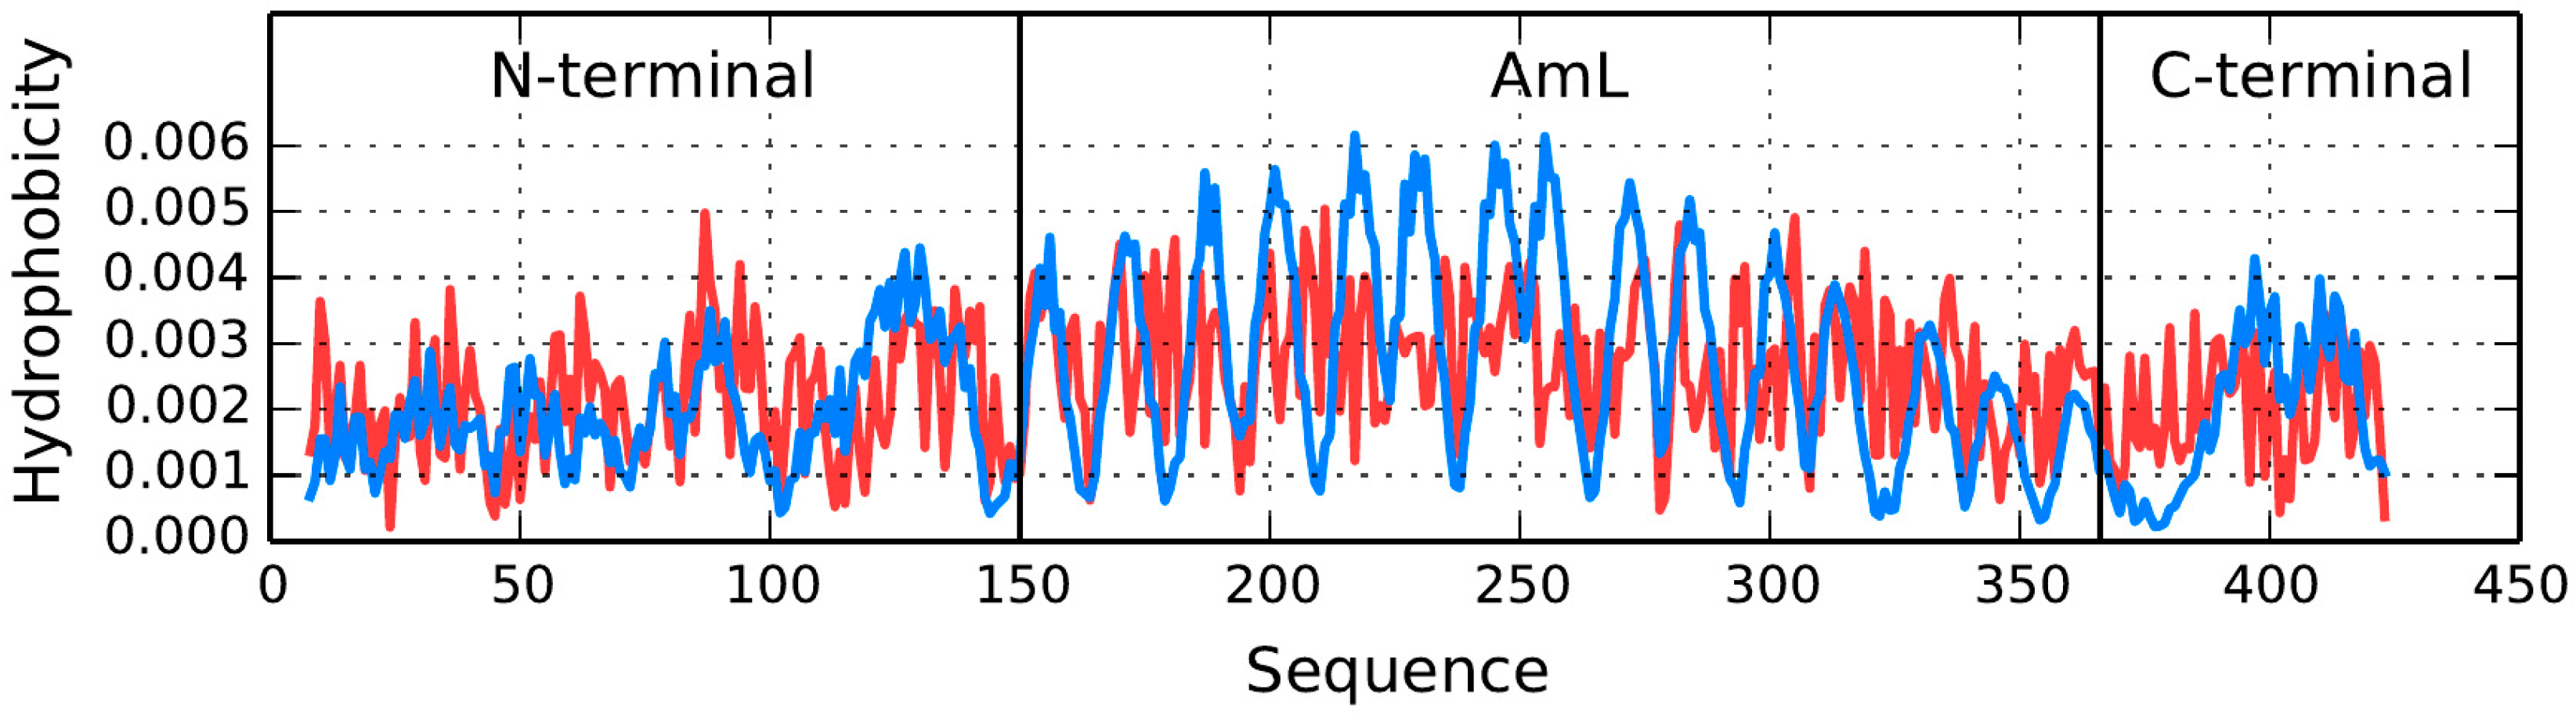
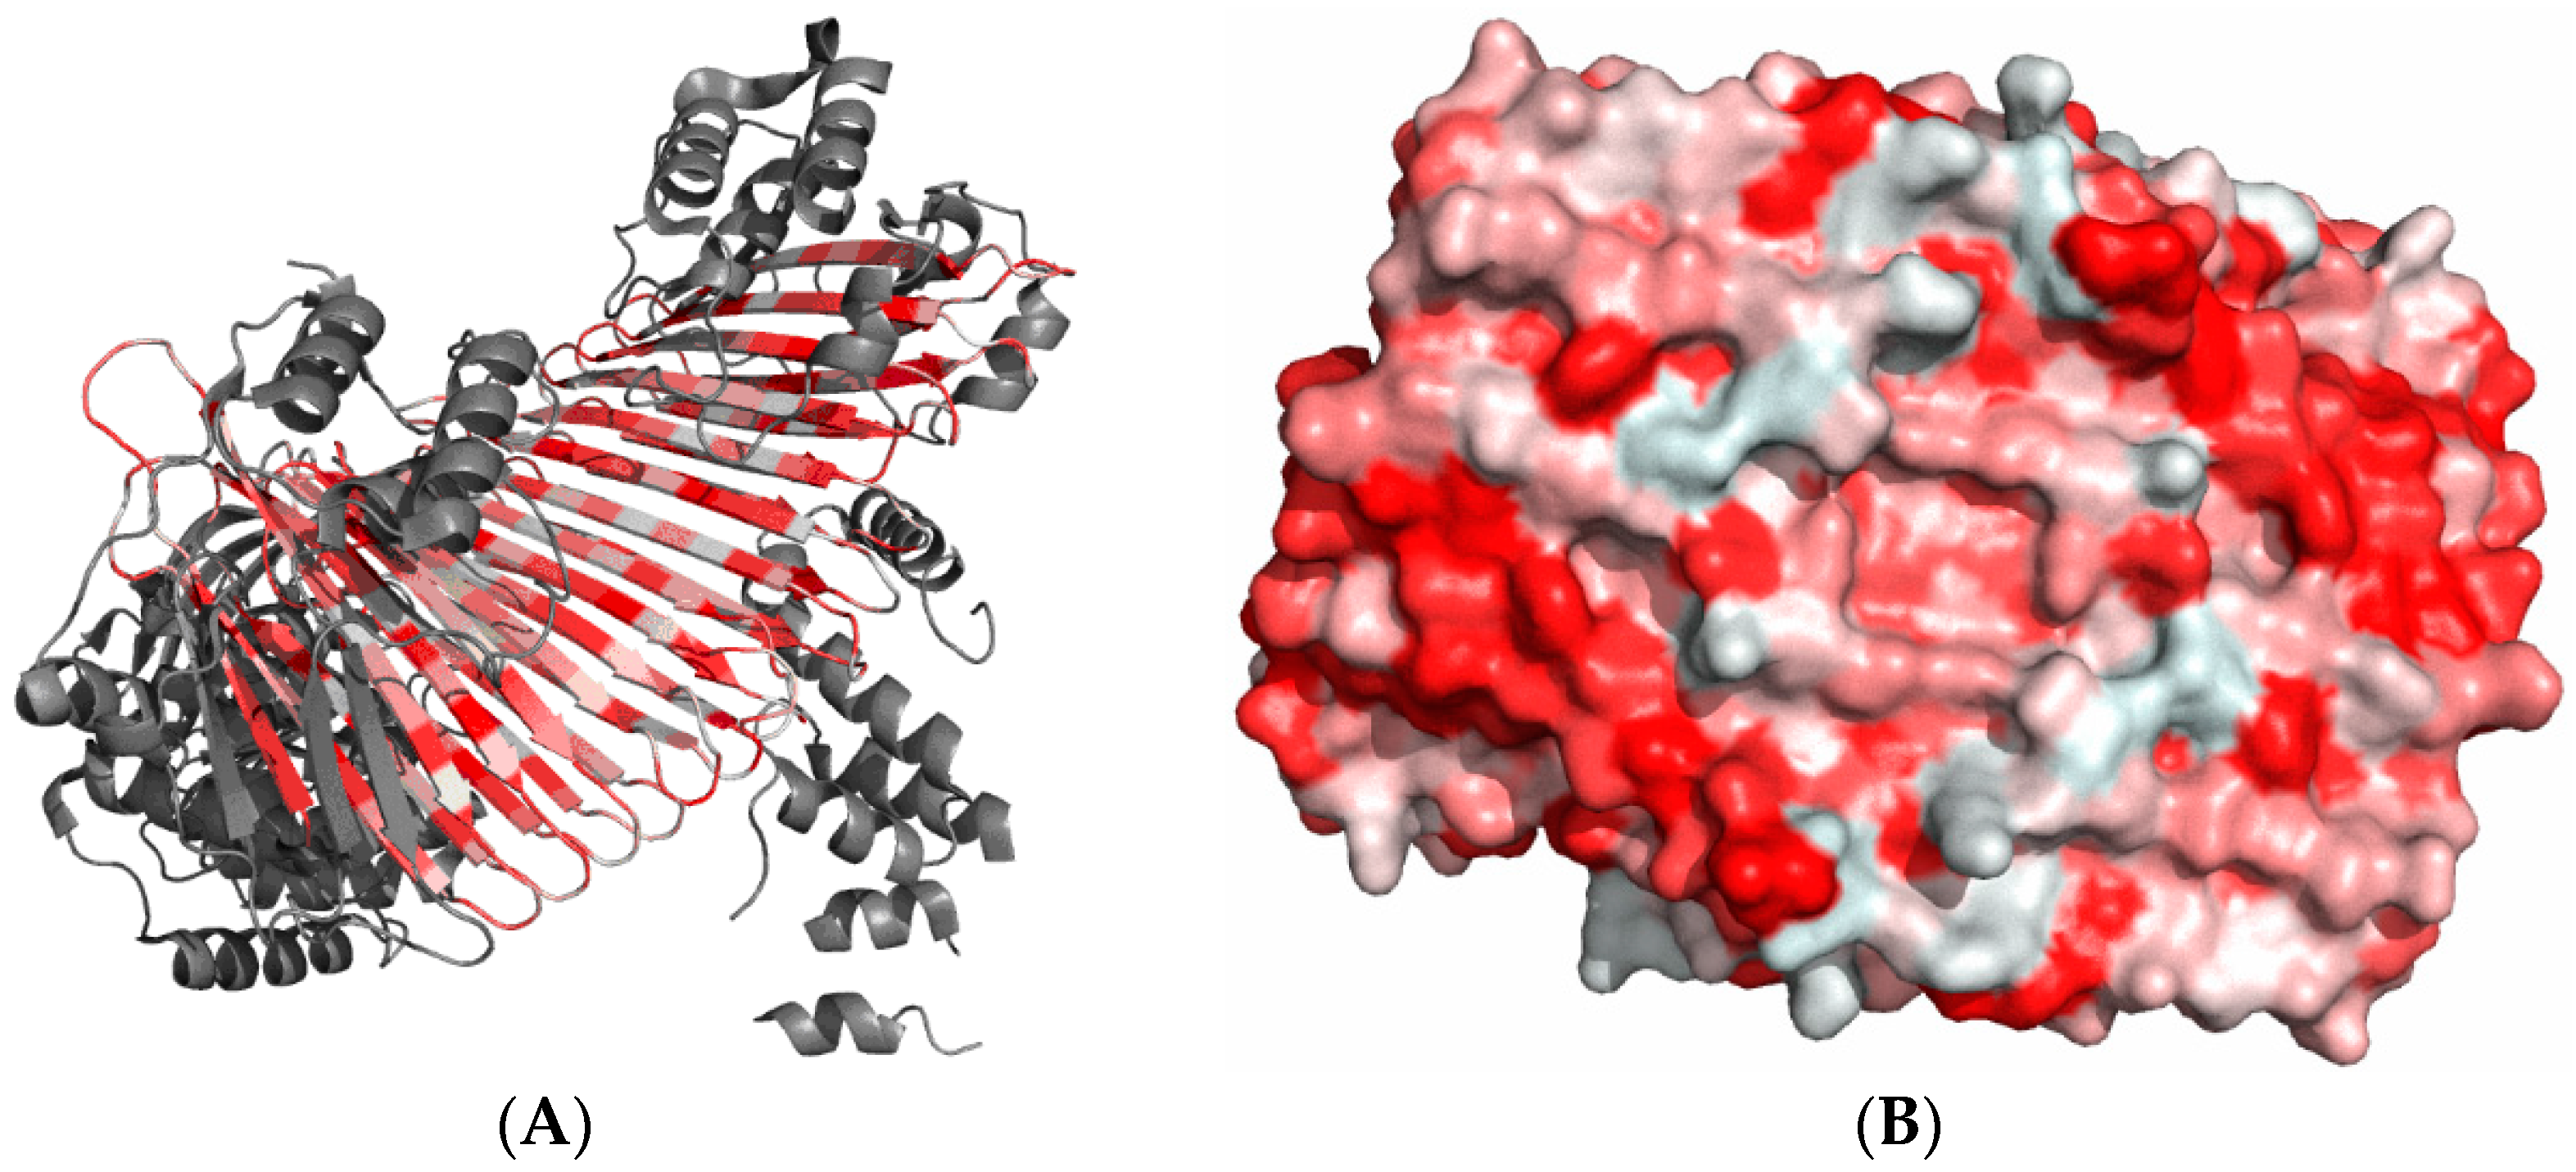
T and O hydrophobicity density distribution profiles plotted for chain A (Figure 10) reveal that no substantial hydrophobic core is present—which is consistent with the RD values listed in Table 5. Wherever high observed hydrophobicity is expected in AmL, actual hydrophobicity is found to be low. A similar discrepancy is observed for loops, where observed hydrophobicity is expected to be low but in fact remains elevated. Of note is also the difference between the N- and C-terminal fragments and the AmL section.
Figure 10 also reveals that the N- and C-terminal fragments exhibit better accordance between the expected and observed hydrophobicity density distribution profiles. This means that—in line with expectations—hydrophilic residues are exposed on the surface. A similar phenomenon is observed in chain C. This suggest that the protein owes its solubility to proper alignment of the N- and C-terminal fragments of chains A and B, as well as to the conformation of chains C and partially D (Figure 10 and Figure 11, Table 5). Note the heightened RD values for fragments involved in protein complexation, particularly with regard to the C-terminal fragment. Such phenomena are often observed, as the fragment engaged in complexation folds in the presence of two contradictory factors: the preferences of the chain itself and the influence of external molecules.
Values given in Table 6 and analysis of profiles on Figure 11 visualize the local discrepancy between T and O for residues engaged in P-P interaction, explaining the fairly high RD value for chain C. Eliminating residues engaged in P-P interaction results in a lower RD value.
One may conclude that the solubility of the molecule is due to the presence of chains C and D as well as due to its N- and C-terminal fragments. The properties of all these parts are similar to those of many other proteins examined with the use of the fuzzy oil drop model (Figure 11).

AmL Section

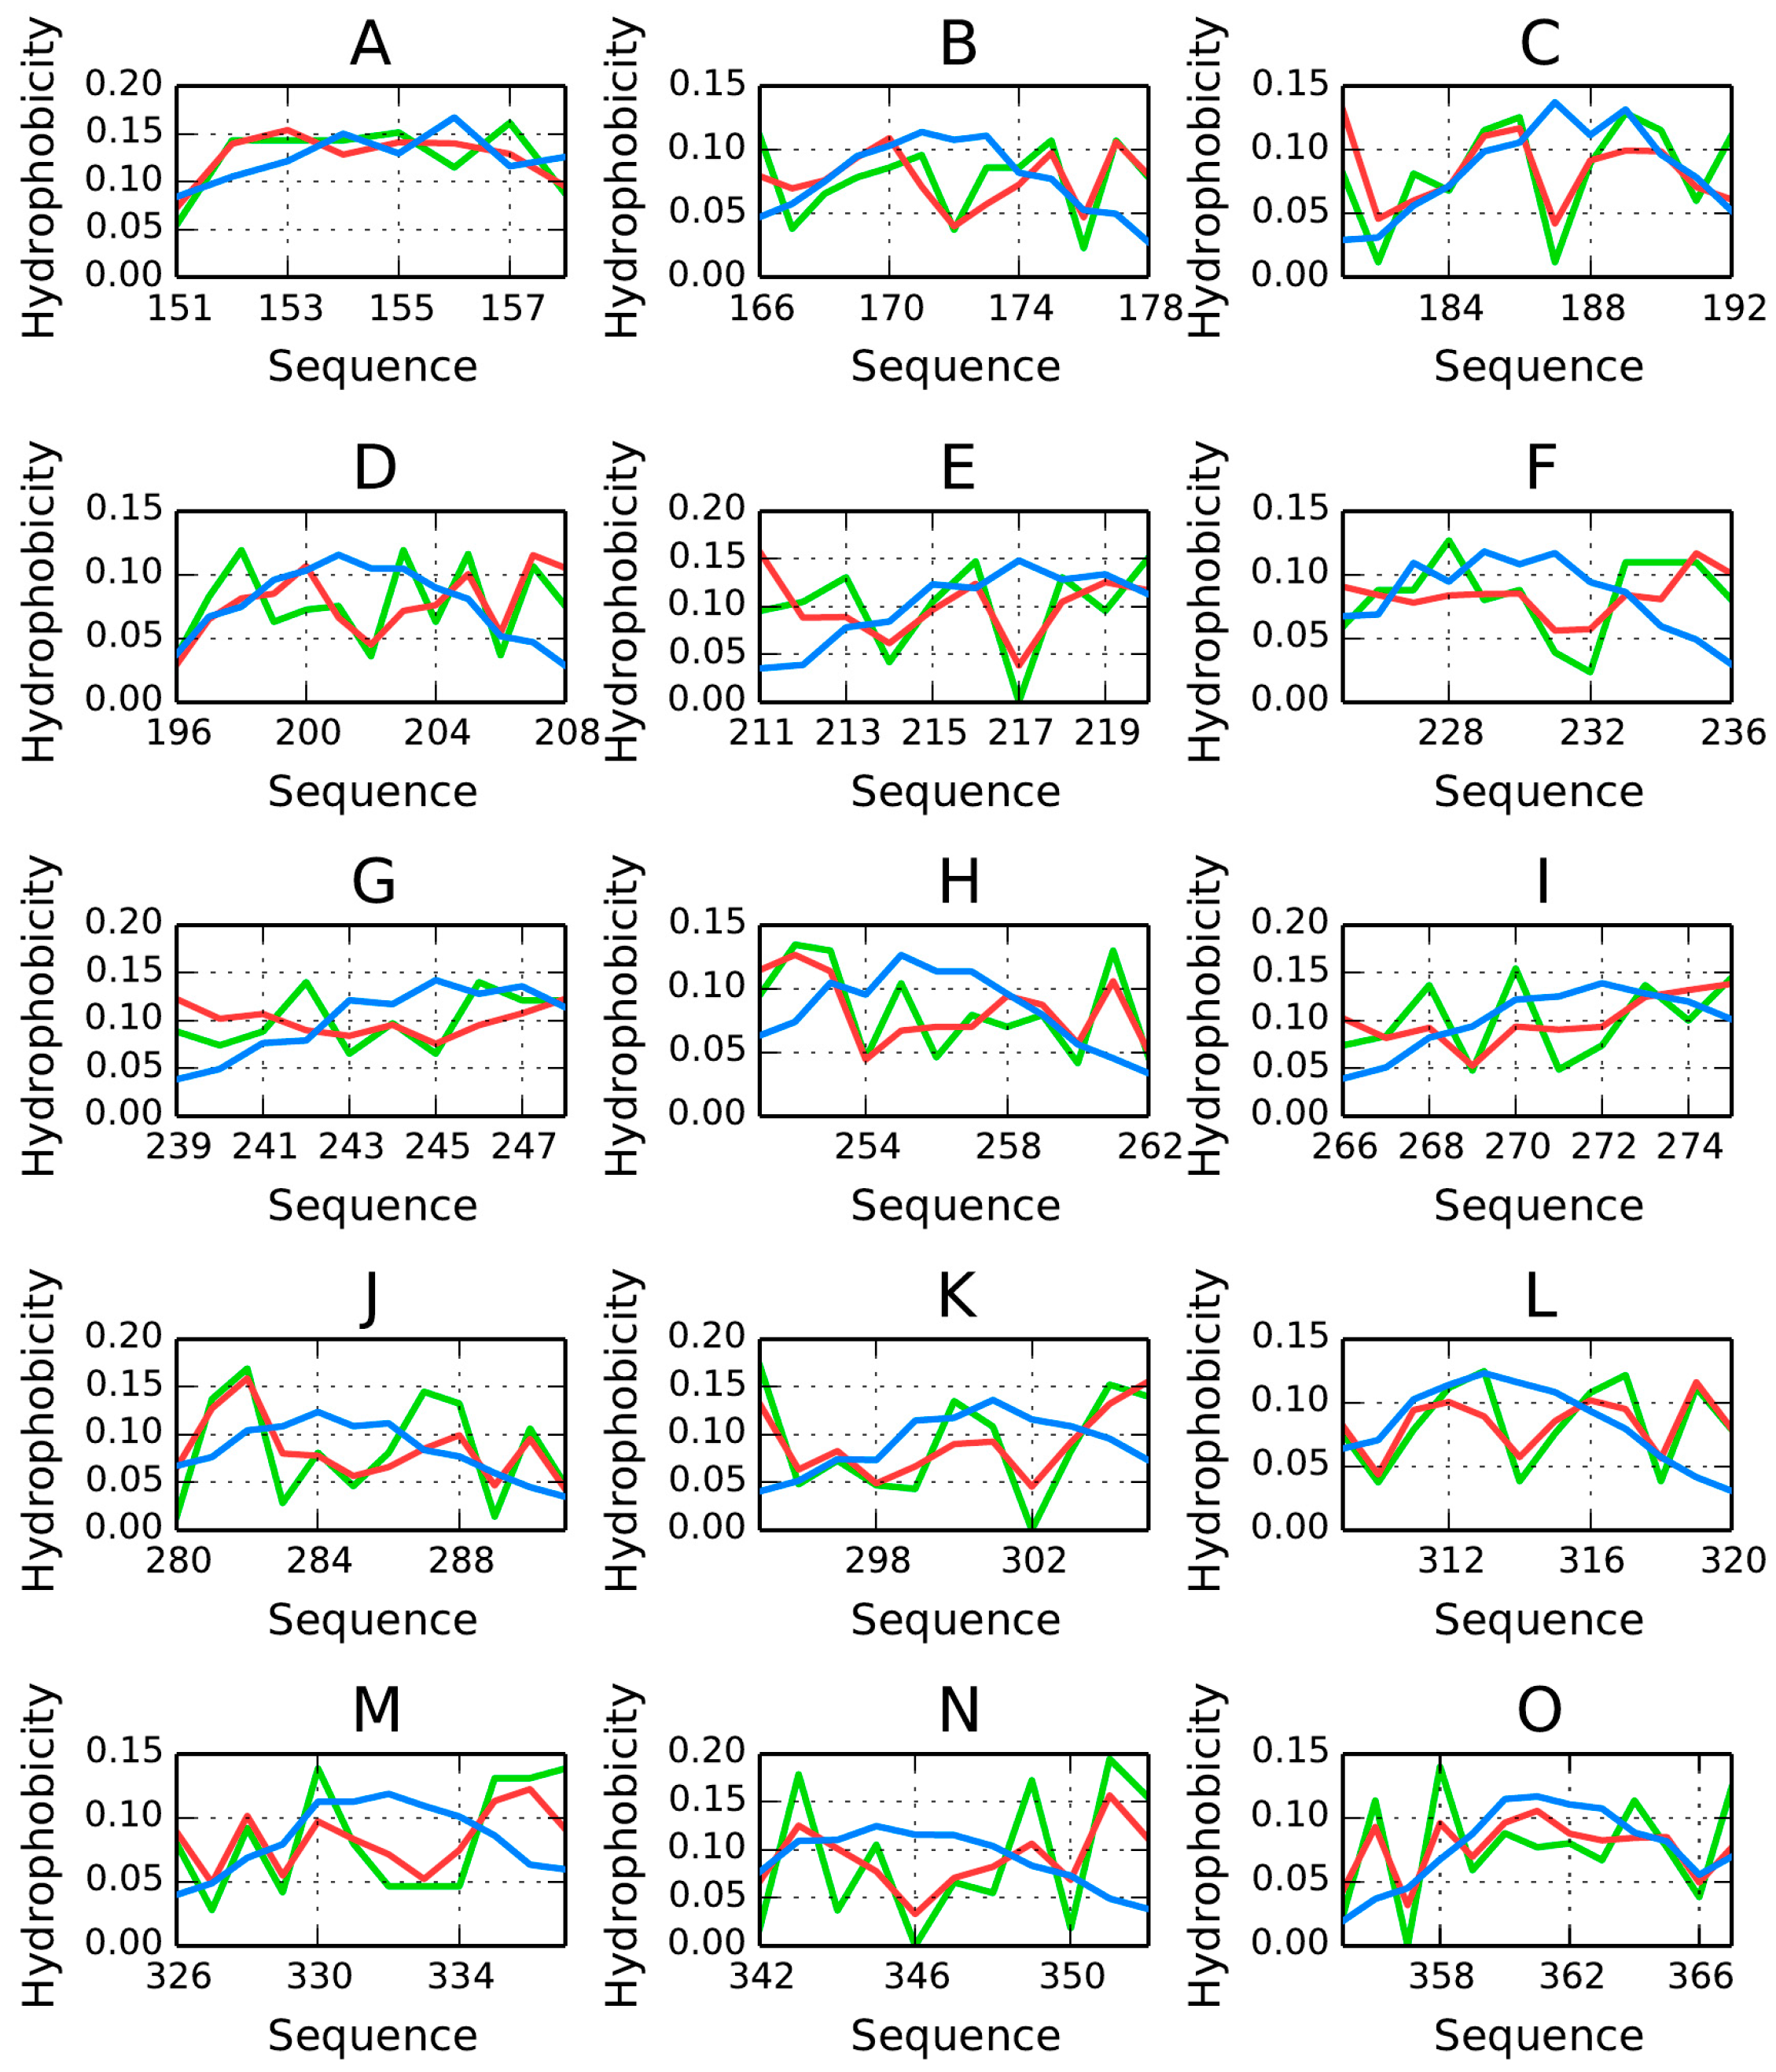
The properties of β-strands comprising the AmL section are listed in Table 7 and Table 8. As can be seen, they generally do not conform to the fuzzy oil drop model, with the exception of the fragment at 151–158—the only one for which RD < 0.5.
The RD(R) and RD(H) values for the dimer are 0.737 and 0.539, respectively, while correlation coefficients—ρ(O,T), ρ(O,H) and ρ(H,T)—are 0.277, 0.759 and 0.111, respectively.
The table also includes correlation coefficients for the observed-vs.-theoretical (T), observed-vs.-intrinsic (H) and theoretical-vs.-intrinsic (H) relations.
The loops exhibit high values of RD (RD(R))—in excess of 0.689—which means that they are a poor match for the theoretical distribution and that hydrophobic residues are exposed on their surface.
The correlation coefficients are particularly high for the ρ(O,H) relation. Negative correlation coefficients for ρ(O,T) and ρ(H,T) suggest that, in some sections, the observed distribution is a polar opposite of the expected distribution. Detailed characteristics of each β-strand are shown in 
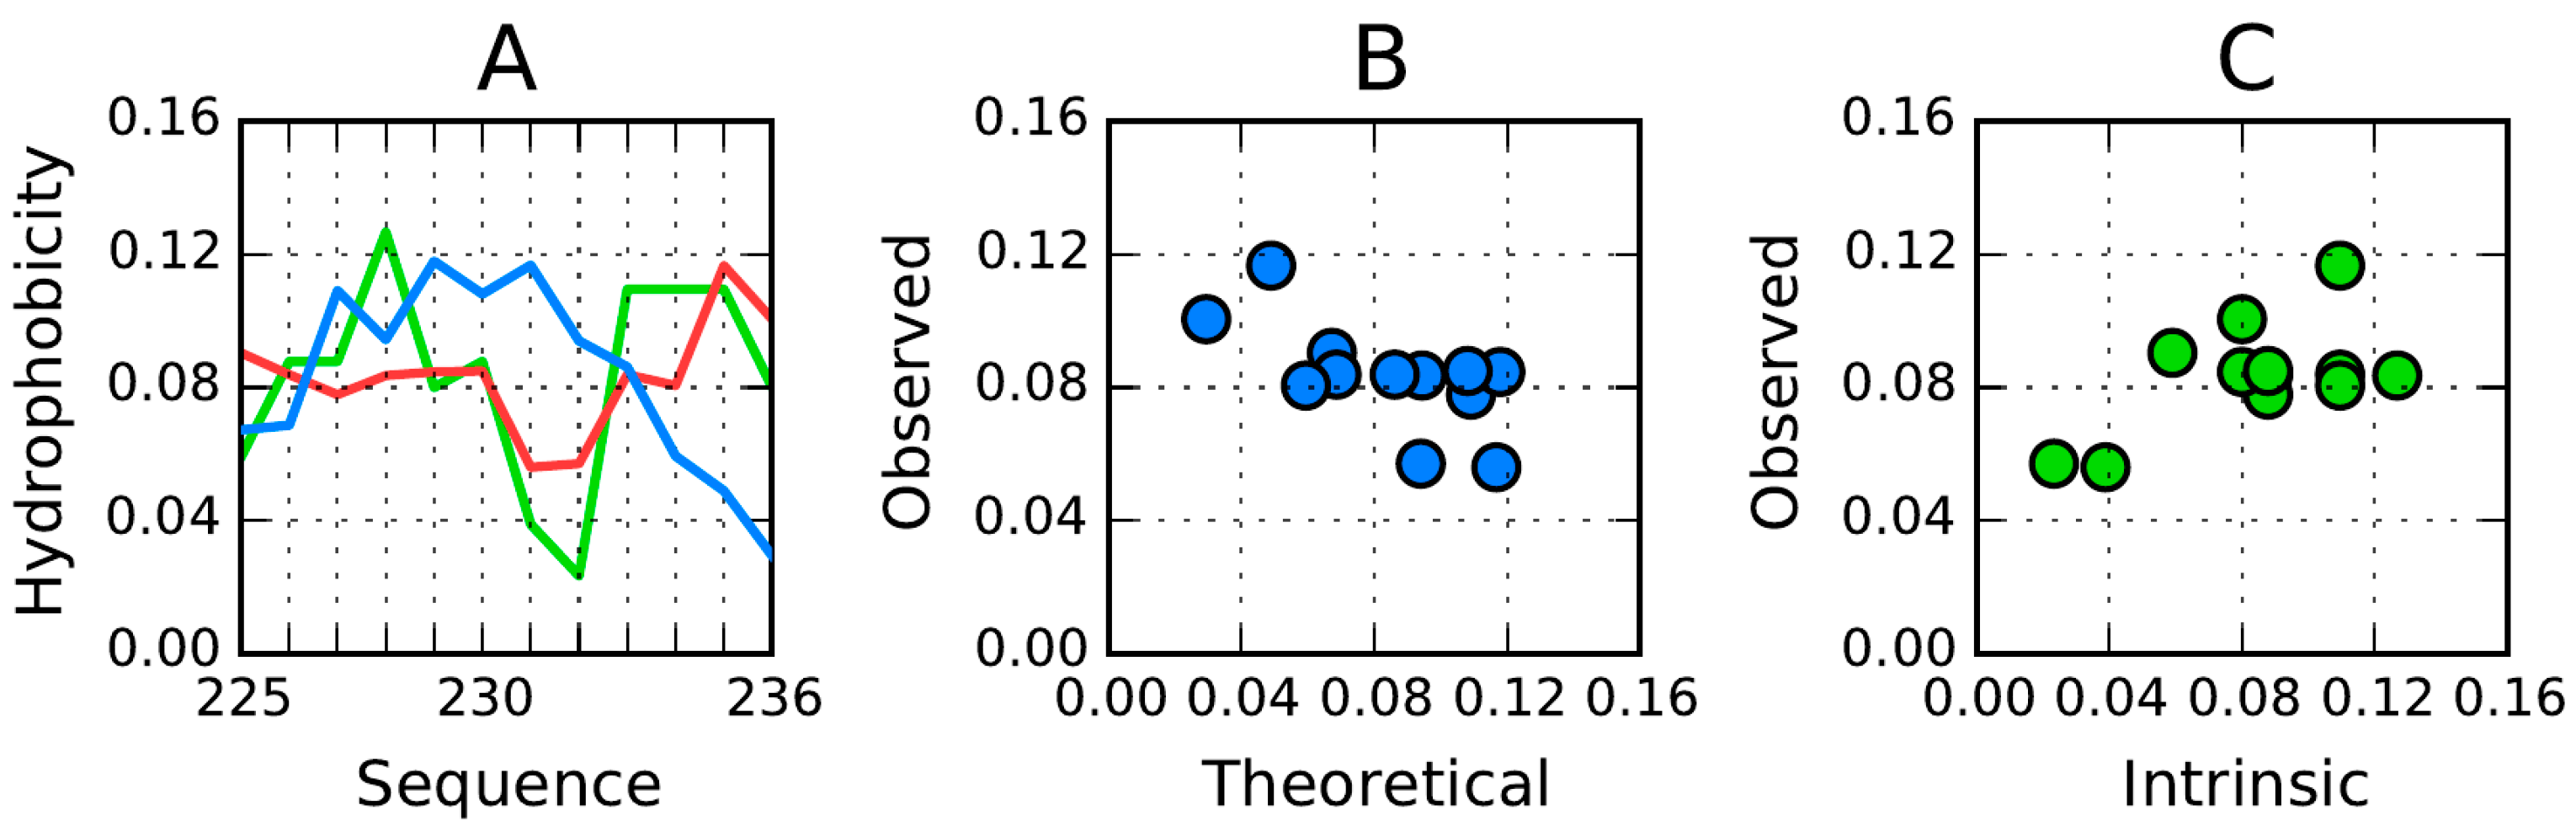
Figure 12. We should note that—ideally—each β-strand should contain one centrally placed hydrophobicity peak; however for certain folds the opposite is true (see for example the fragments at 166–178 and 225–236) (Figure 12B,F). Of note is also the high hydrophobicity observed at the terminal sections of β-strands (which would have been expected to attain an entropically advantageous conformation by exposing hydrophilic residues to the outside environment).
For the AmL section, the observed distribution differs substantially from the expected “single-peak” theoretical distribution. The β-strand in particular includes two distinct profile maxima, with a negative T/O correlation coefficient. In other words, this section exhibits high hydrophobicity in areas where the theoretical model would expect hydrophobicity to remain low (and the other way around).
The properties of the 225–236 are of special interest due to its extreme discordance versus the theoretical distribution (negative correlation coefficient: −0.657) along with good accordant with the intrinsic distribution (correlation coefficient: 0.616) (Figure 12 and Figure 13). This suggests that the polypeptide fragment folds on its own, with no regard to higher-order structures—it behaves in a very “selfish” manner, taking into account solely its own (sequence-mandated) properties. The observed distribution is a polar opposite of the expected distribution—hydrophobicity remains high in areas where the model would expect it to be low (and vice versa). The distribution of hydrophobic residues seems random, without any order which would suggest the presence of a hydrophobic core (Figure 14).

4.4. Therapy

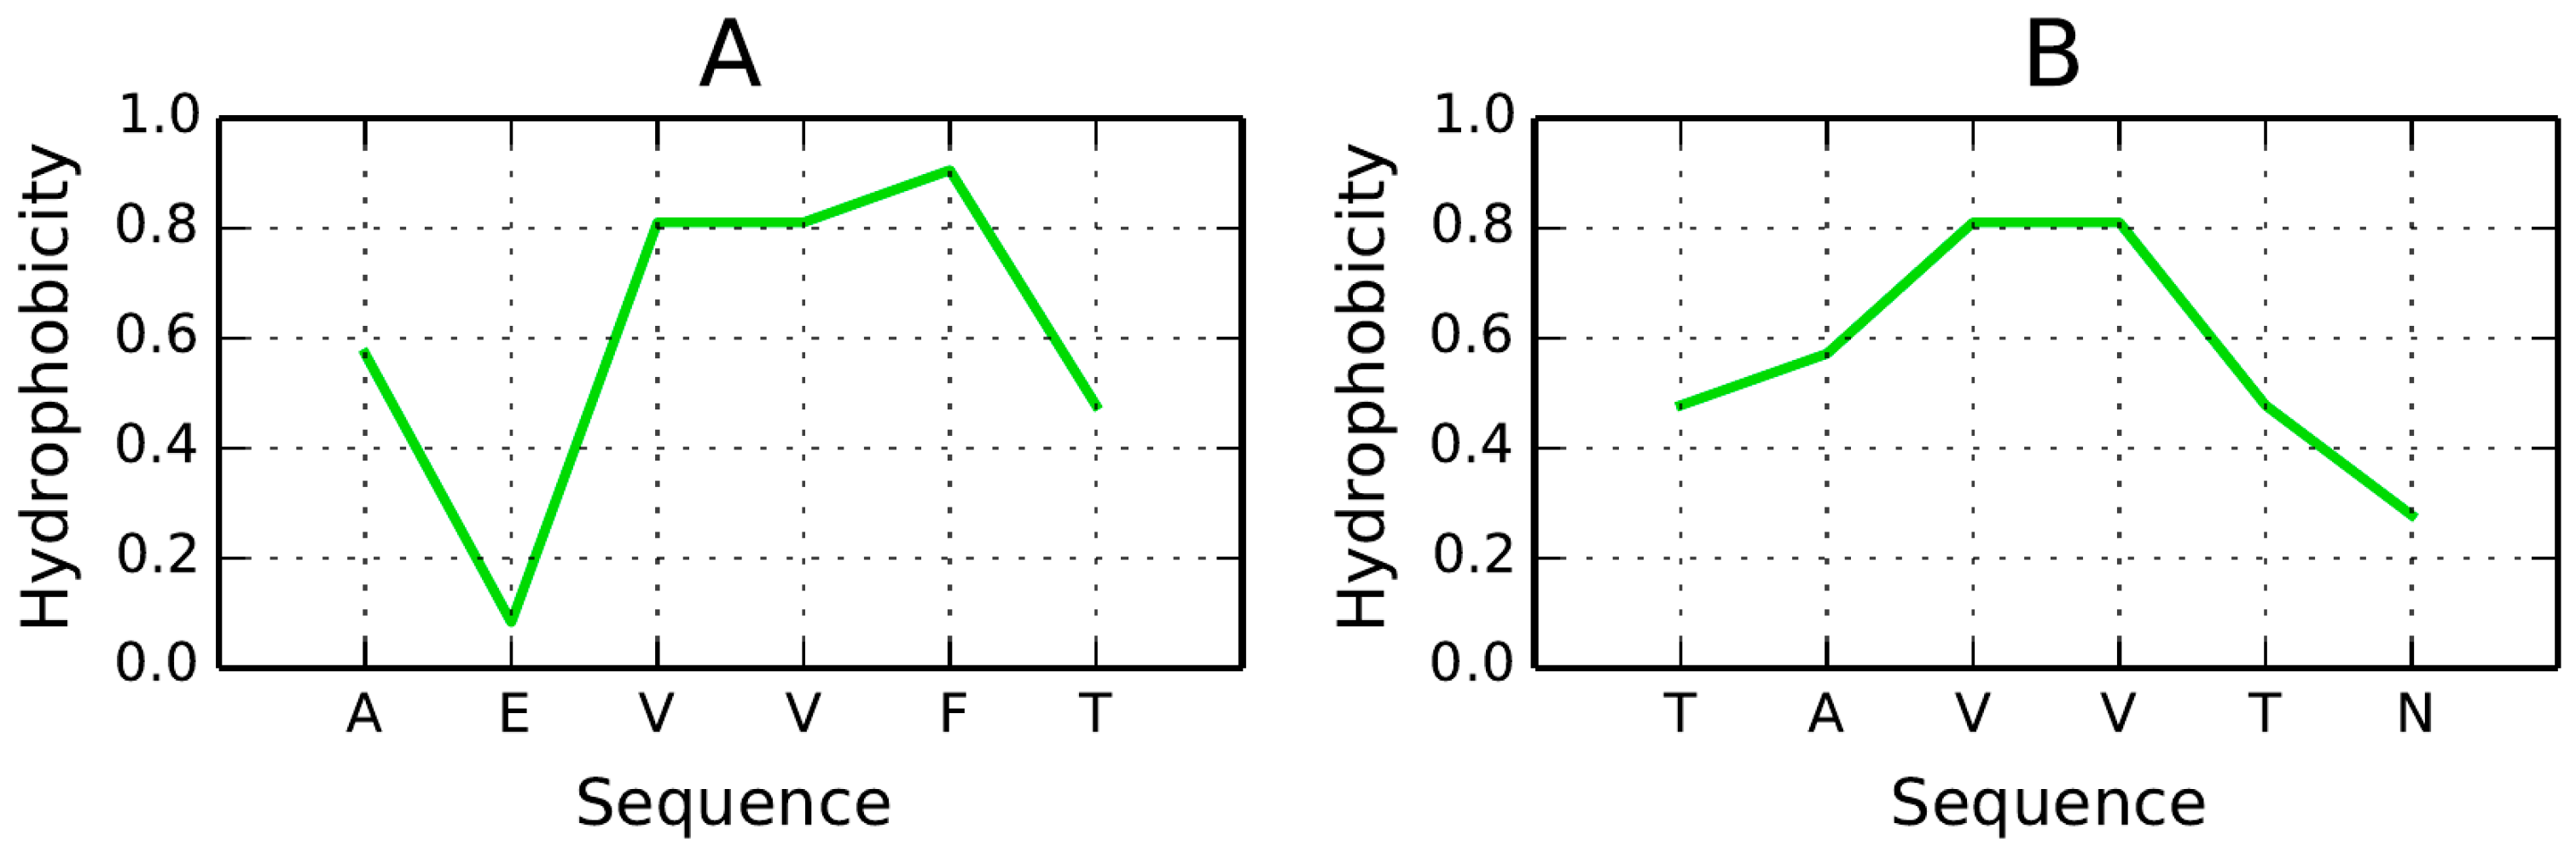
In the context of seeking potential new drugs, several promising peptides are presented in [57], among them two sequences with length 6: AEVVFT and TAVVTN. Their hydrophobicity density distribution profiles are illustrated in Figure 15. If the analyzed sequence adopts a β-conformation, its hydrophobicity profile appears to correspond to theoretical values, with hydrophobic residues confined to the central part of the peptide (bell curve). Attaching such a structure to a molecule which, by itself, remains susceptible to complexation, would effectively “lock it” in a hydrophilic bracket. While the suggested peptides are too short to enable meaningful FOD analysis, a longer peptide (10–12 aa) consistent with the FOD model could also enforce an accordant distribution if oriented in parallel to the β-strands.
Hypothetically, in order to arrest axial propagation of the fibril, we should insert a set of hydrophilic residues along the entire length of the peptide. Being able to position such a peptide at an arbitrary point in the fibril would prevent it from elongating.
In light of the presented model the TAVVN sequence appears more promising since it exhibits a monocentric hydrophobicity peak. The orientation of the attached peptide (vis-a-vis the β sheet) seems to be of critical importance—if the fragment remains parallel to a pair of β-strands, the resulting hydrophobicity distribution would approximate the theoretical model, with low hydrophobicity values in the terminal sections. This, in turn, would render the amyloid more soluble.
The same mechanism can be adopted for the analysis of mutation influence on the resultant stability of particular β-fragments of transthyrein [58].

4.5. Sequence Comparison

While the β-strands present in AmL (fifteen separate folds in A and B) can be used as a pattern for the generation of amyloid-like forms, we are also able to identify some fragments in other proteins as potential amlyloid seeds. Shifting-frame analysis of each sequence singles out fragments which promote amyloidogenesis in the target proteins (including the 1B10 prion protein). The assessment criterion—as discussed in the Materials and Methods section—is the similarity between the observed hydrophobicity density distribution in the target molecule (AmL) and the molecule under consideration. Quantitative assessment of this similarity is supplied by the correlation coefficient. Table 9 shows which fragments exhibit intrinsic hydrophobicity profiles similar to those present in AmL.
Table 9 shows fragments for which the correlation coefficient exceeds 0.8. The 2ZU0 column lists RD values for β-strands as they appear in AmL to underscore their status as highly discordant. The fragment at 151–158 is present in all target proteins (note, however, that its status in AmL is accordant, which means that it should not be treated as amyloidogenic).
Results shown in Table 9 reveal high similarity of hydrophobicity distributions in a single-dimensional presentation (sequence) of transthyretin, with five fragments exhibiting correlation in excess of 0.8. Synuclein appears to represent sequential hydrophobicity similar to that of AmL. However, the AmLfragment at 239–248 is the most frequently observed one in the protein under consideration. Of particular interest is the loop at 131–140 in 1B10—a purported promoter of amyloidogenesis (correlation coefficient: 0.846). Somewhat surprisingly, in the individual molecule this loop is well aligned with the fuzzy oil drop model, as evidenced by its RD values (RD(R) = 0.169; RD(H) = 0.168). Taking the 1B10 molecule as a whole, the RD coefficient is equal to 0.428, which suggests the presence of a well-ordered hydrophobic core (including an encapsulating hydrophilic shell). Accordingly, this molecule should not exhibit “interest” in structural rearrangement. Such good accordance between the observed and theoretical distribution for the 131–140 fragment, both by itself and as part of the protein molecule, persists as long as 1B10 remains an individual entity, immersed in an aqueous environment. However, its hydrophobicity profile is similar to that of AmL, rendering it a potential candidate for generating a β-structural fragment whose hydrophobicity distribution does not follow the bell-curve template (again, similar to AmL). Such similarity has been observed for the 131–140 fragment, taking the highly discordant AmL fragment at 239–248 as a reference (RD(R) = 0.846).
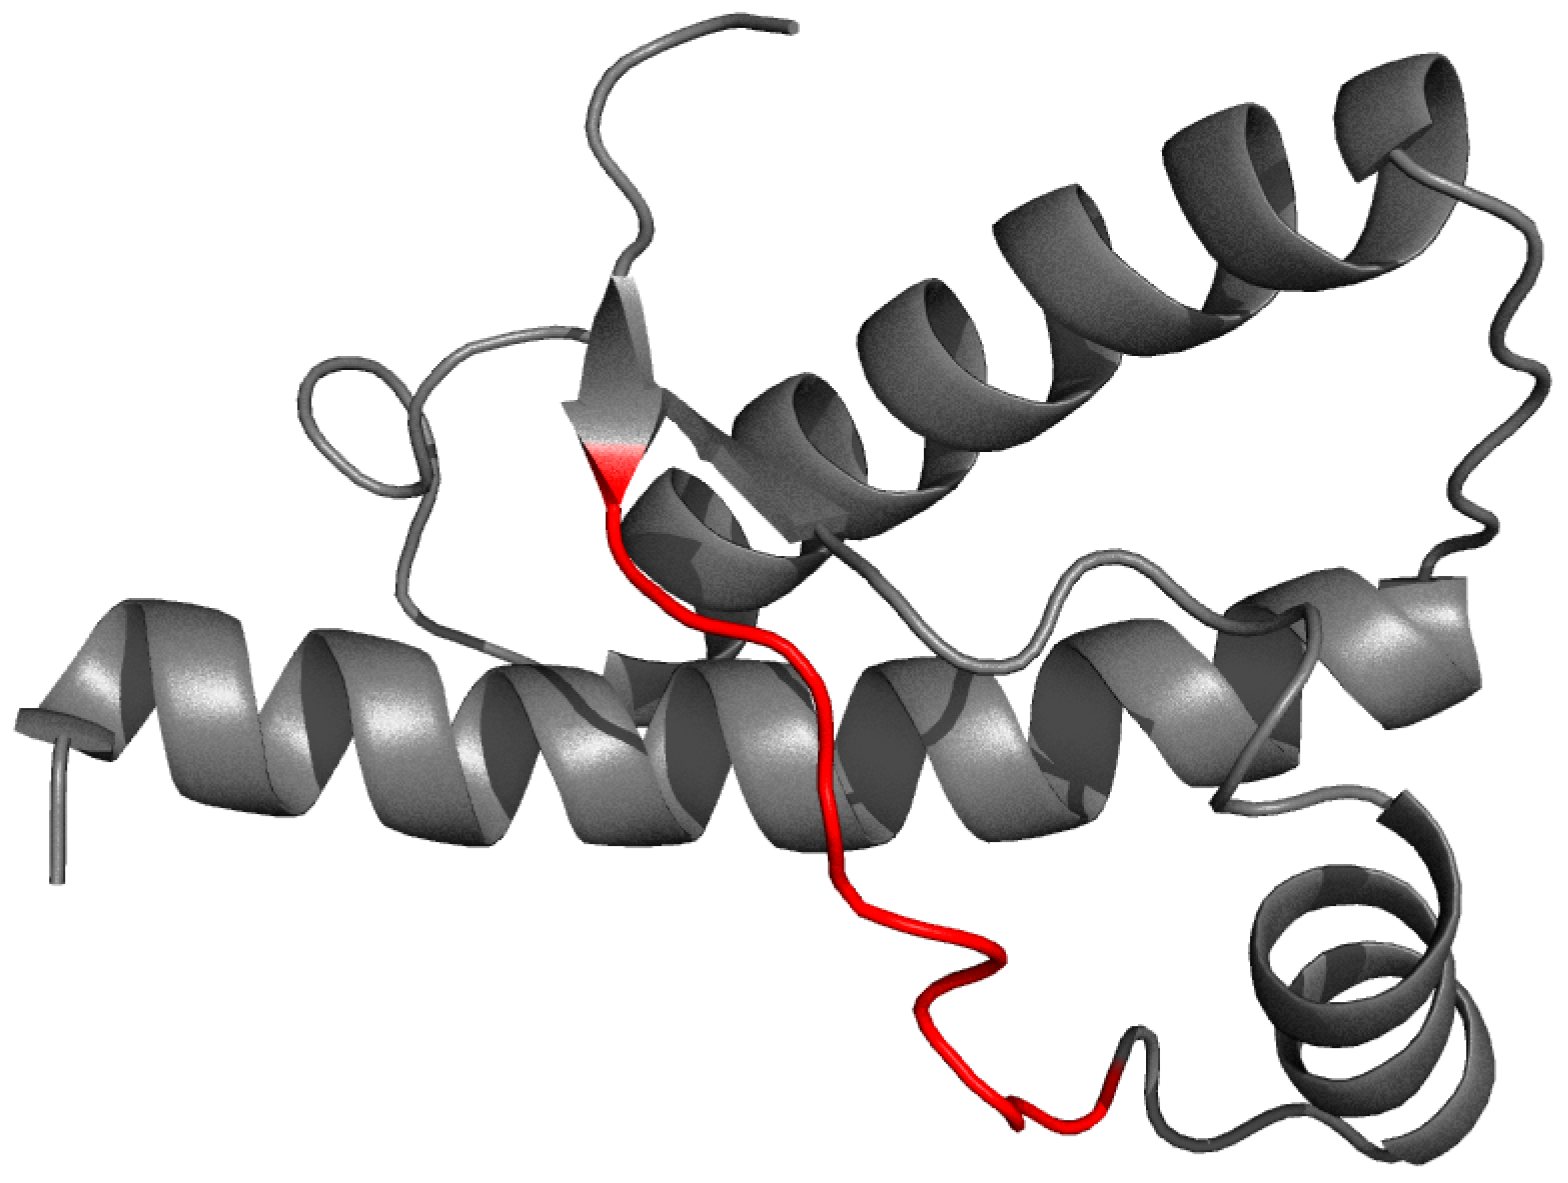
On the basis of the fuzzy oil drop model the presented phenomenon can be interpreted as follows: as long as 1B10 remains immersed in water, which enforces the generation of an “accordant” hydrophobic core, the protein does not form aggregates. The signal to adopt a different conformation (potentially one which promotes amyloidogenesis) is therefore supplied by the external force field. Assuming that the fuzzy oil drop model correctly models the influence of water, the water environment is responsible for generating a hydrophobic-core-like structure. If water is absent, the molecule behaves according its own “selfish” interests, as shown in 
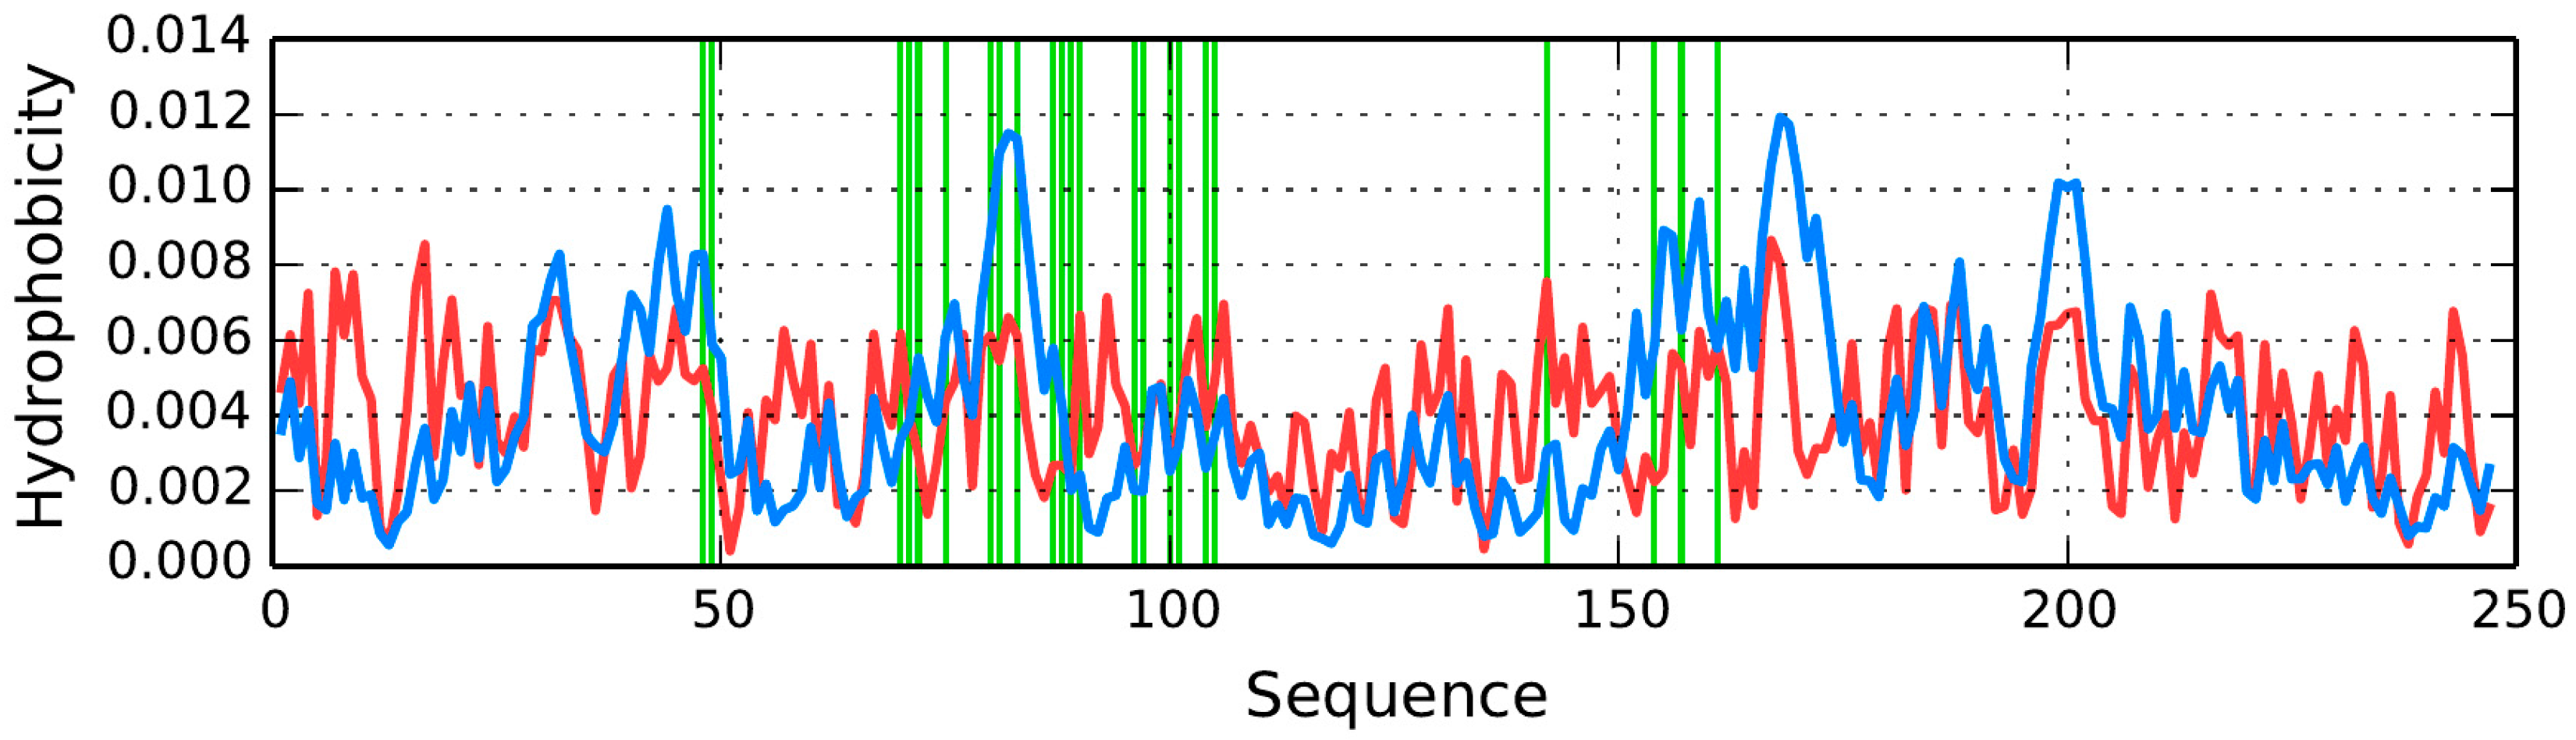
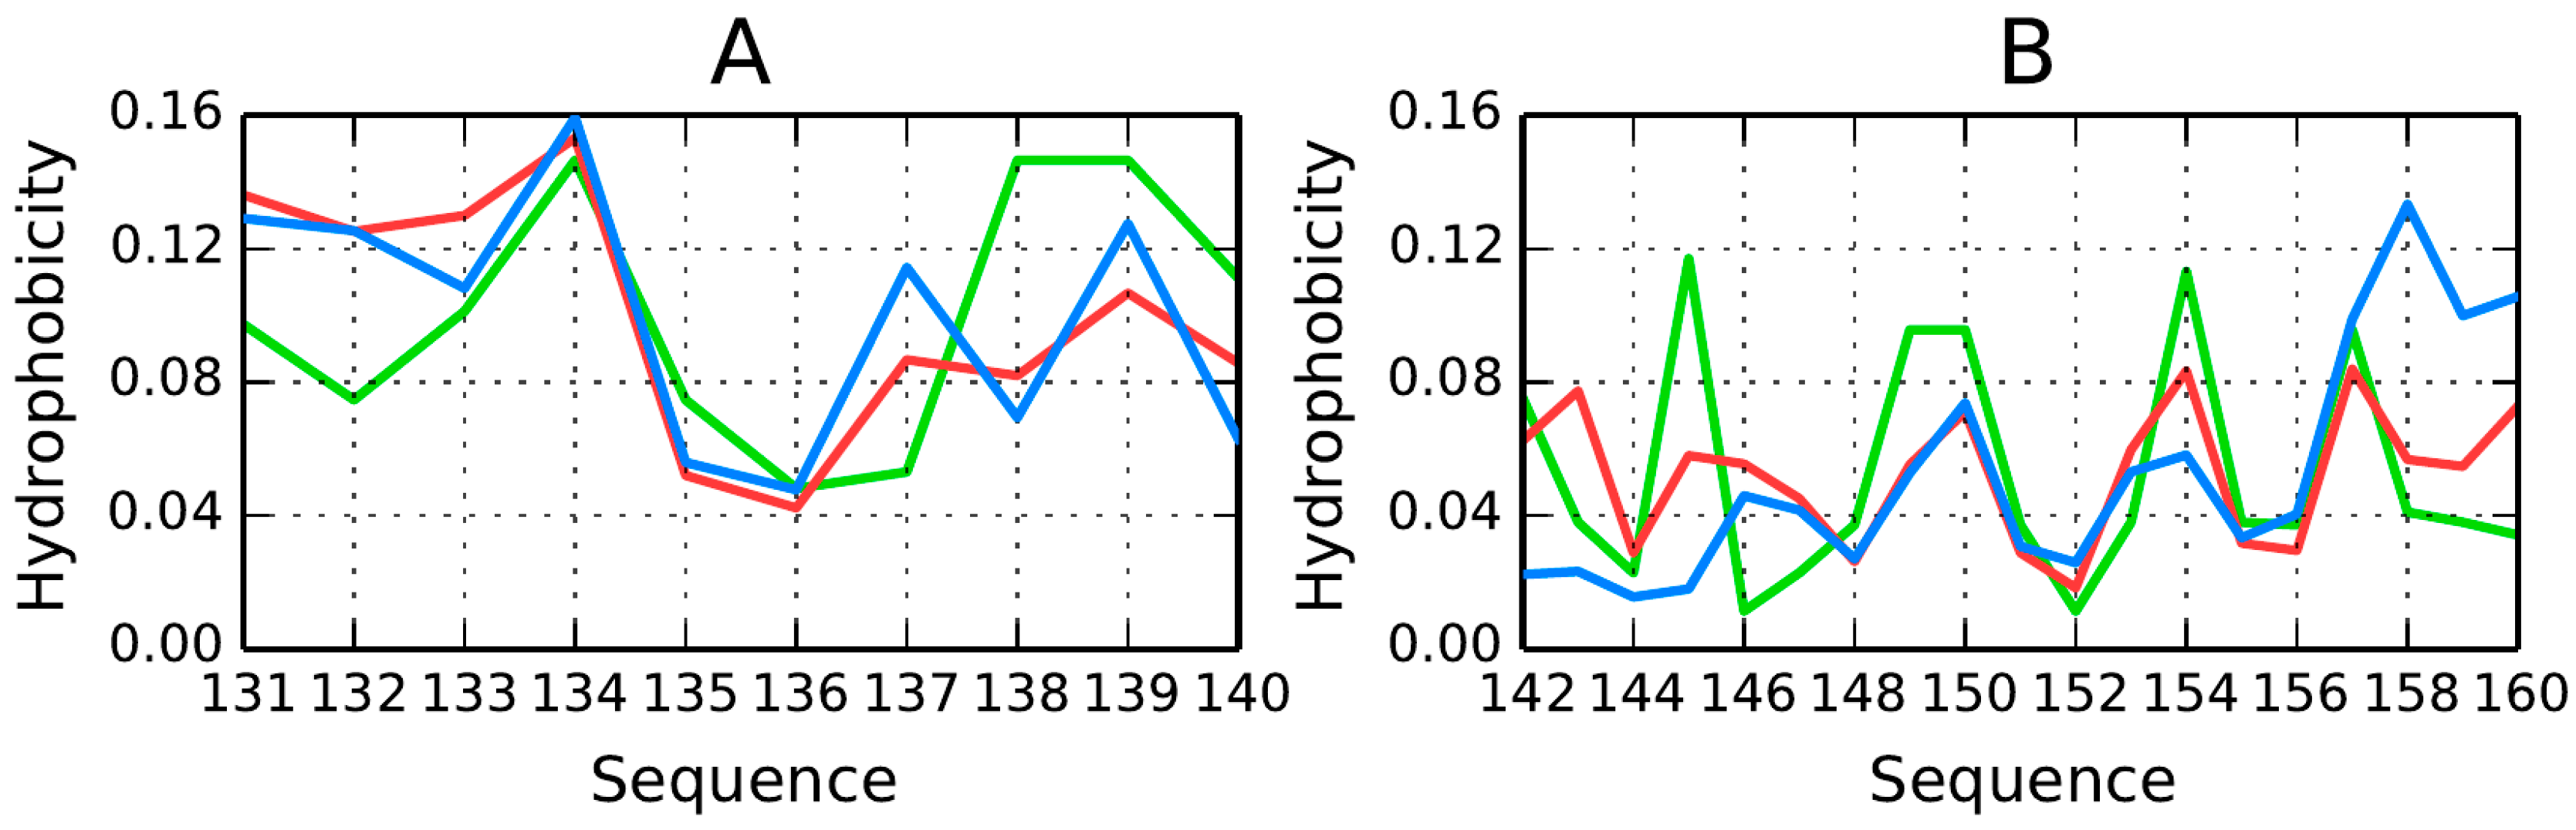
Figure 16. The structure of 1B10 shows good agreement between the theoretical model and observed properties, suggesting high stability (at least with regard to hydrophobic core formation). Here, differentiated stability should not be interpreted as propensity for structural changes—instead it appears that conformational rearrangement of the molecule requires changes in the structure of the external force field (structuralization of water). Hydrophobicity density distribution profiles plotted for fragments at 131–140 and 142–160 (Figure 16) indicate the presence of a local minimum in the central part of each fragment along with exposure of hydrophobic residues in its terminal sections. This distribution is acceptable under FOD criteria as long as the molecule is analyzed in isolation. If both fragments become independent (i.e., do not participate in forming a hydrophobic core), a structure similar to AmL is likely to appear. If the fragment at 131–140 adopts a β-like conformation, the resulting structure may potentially closely resemble the one observed for AmL.
Two fragments identified as potential candidates for generating structures similar to AmL are the long loop at 131–140 and the helical fold at 142–160. Both fragments are highlighted in Figure 17. The 131–140 fragment appears particularly susceptible to adopting conformations enforced by other protein molecules (or—as suggested by the FOD model—by changes in the structruralization of the water environment), given its own lack of secondary ordering. Good agreement between the empirical and theoretical distributions in the prion molecule (1B10) seems to be a coincidence. Regarding the fragment at 142–160, its “zigzagging” hydrophobicity density profile renders it hydropathic and promotes alignment with the molecular hydrophobic core.
For 1B10 the listed correlation coefficient is below 0.8 due to the presence of the so-called chameleon sequence. Such sequences frequently adopt varying conformations, depending on the protein to which they belong.

4.6. Structural Properties of AmL

Table 10 provides a comparison of parameters describing individual β-strands in the presented proteins. Geometric and sequential analysis indicates molecule-specific tendencies, revealing differences in the length of β-strands and the adjacent loops. Of note is the high structural uniformity observed in AmL, where the distance between sheets remains nearly identical at all points, while the angle formed by individual β-strands is the lowest among the analyzed proteins.
Table 10 reveals the geometry of β-sheets, showing relatively high diversity in 1TIT and 1DVQ, while the amyloid-like SufC-SufD fragment exhibits notable uniformity both in terms of its length and the distance between parallel sheets. Of note is also the relatively limited number of loop-forming residues. The length of loops in 1TIT and 1DVQ suggests potential readiness for structural rearrangement, resulting in a highly regular structure.
Analysis of geometric parameters listed in Table 10 suggests elongation of β-strands, with participation of loops. Loop fragments tend to alter their structure, aligning themselves to the β-structural system, with parameters indicating changes in the twist angle in the dorsal and ventral β-sheet. This also results in fixation of the distance between sheets, unlike the native forms of 1TIT and 1DVQ where the corresponding distance varies significantly. The postulated mechanism of structural transformation of the β-sandwich (as it appears in transthyretin) leading to amyloid-like forms (assuming that AmL represents such properties) is shown in Figure 18.
It appears that the presence of stretching forces may engage terminal sections of loops, reducing their length as observed in AmL. Elongation of β-strands spreads to residues which form loops, but also to helical sections. In general, elongation of transthyretin may reduce the angle between backbones in the top and bottom layer, as shown in Figure 18. It should be noted that if a structure modified in this fashion includes a sequence whose own distribution diverges from the monocentric peak, it may provide a starting point for the propagation of an ordered structure, such as the one found in AmL. Many fibrillary aggregates are found to contain similar “seed” sequences distributed evenly along their length.
As shown in Figure 19, an ordered distribution may differ from the classic bell curve—it seems that such distributions are dominated by the intrinsic hydrophobicity of each molecule, with negligible influence of the water environment.

4.7. Amyloid β a4 Protein

As mentioned in the Introduction, three fibril forms experimentally tested using solid-state NMR were selected for fuzzy oil drop model analysis. The general characteristics of hydrophobicity distribution in each of these fibrils are given in Table 11.
Strong correlation can be observed only for O/H in all three cases. Low correlation coefficients for O/T and T/H suggest that intrinsic hydrophobicity is the main driving force leading to the formation of such structures.
Coming back to titin (Table 2), it is evident that this protein represents a balance between all three distribution types (intrinsic, expected and observed). It seems that the titin domain is shaped by all three types of interactions. The same is not true for fibril forms, where the O/H relation clearly dominates, as shown in Table 11.

5. Discussion and Conclusions

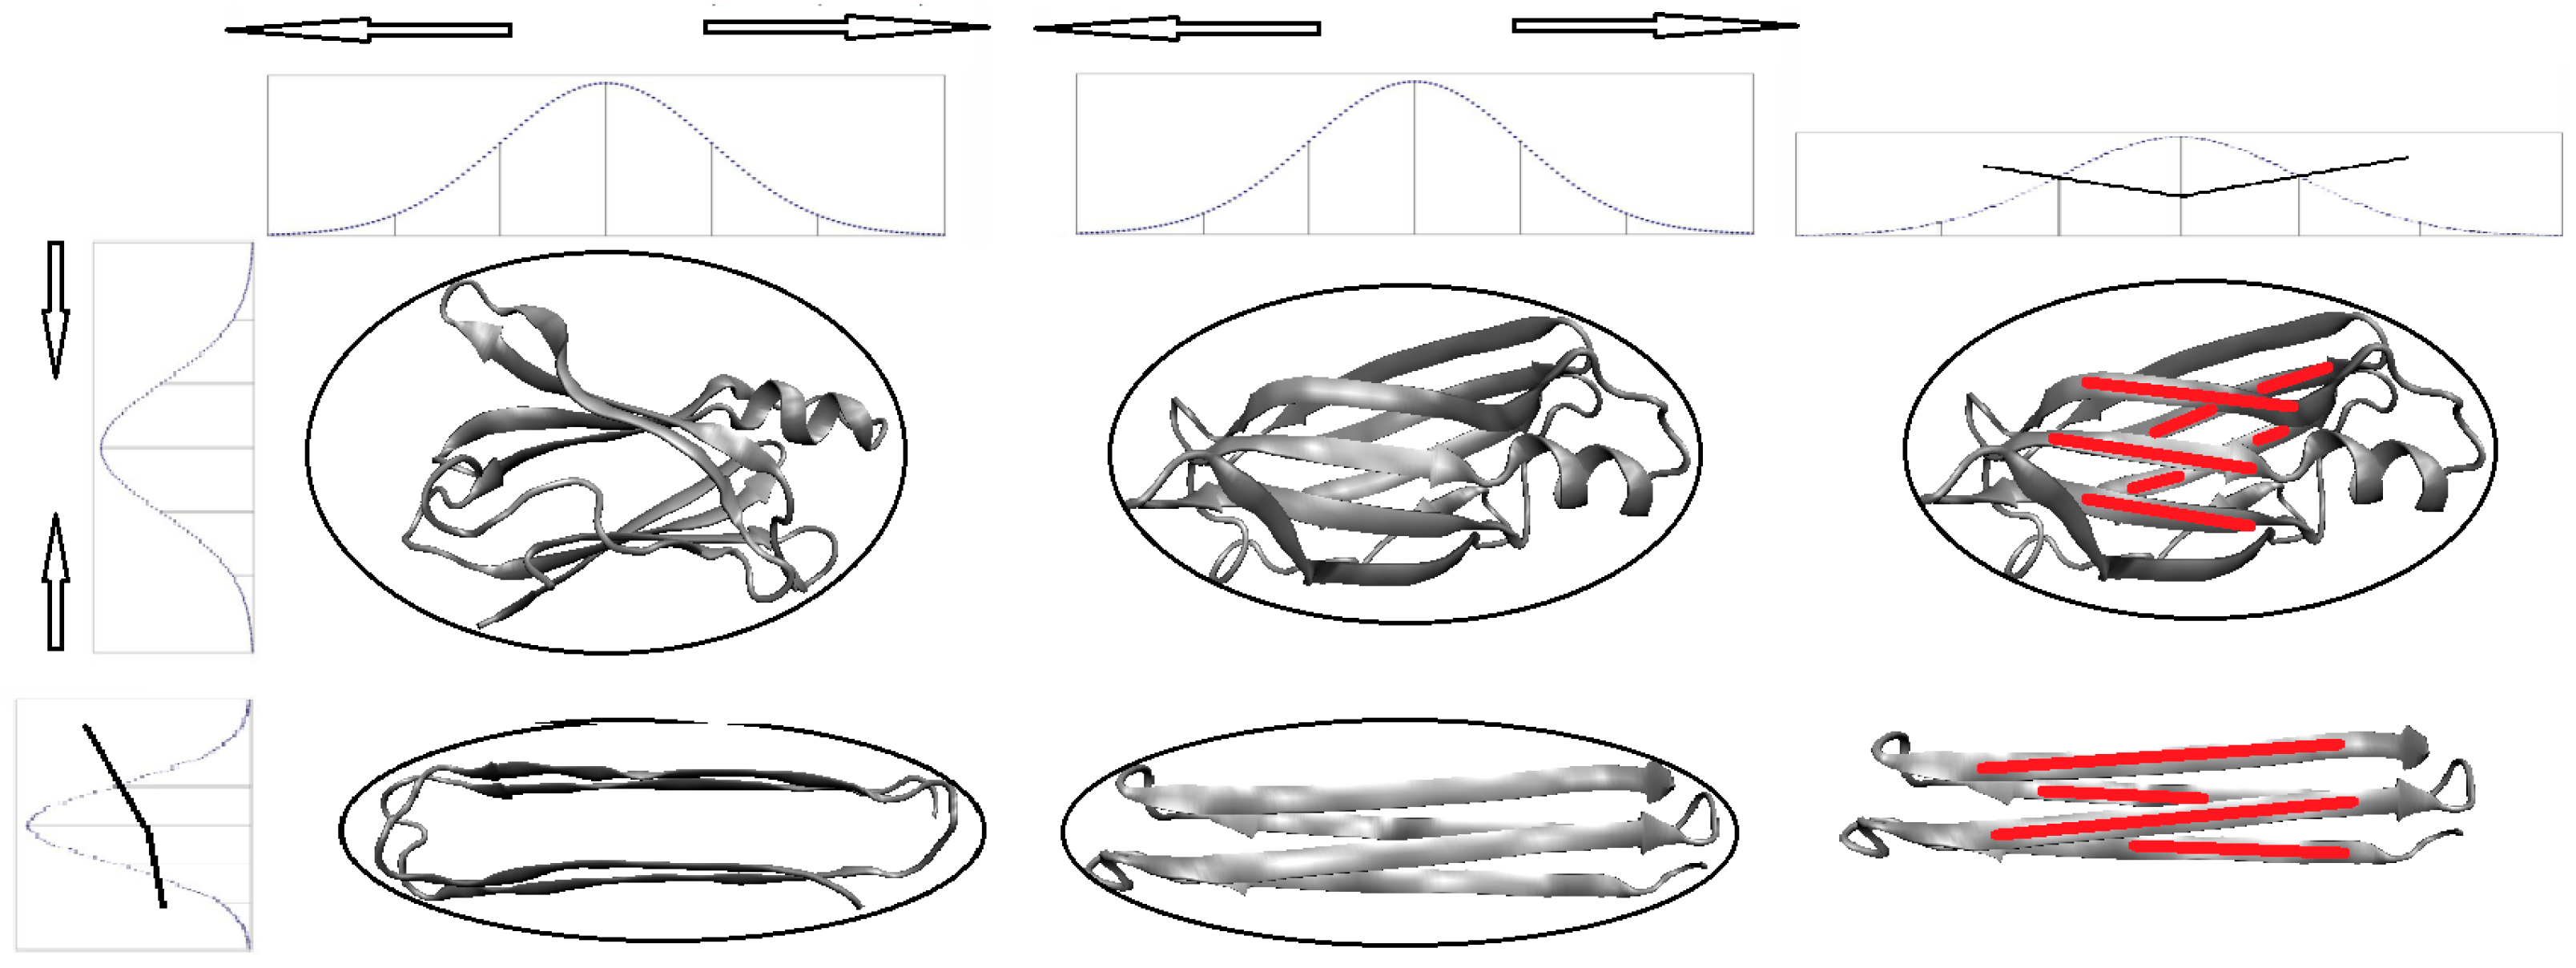
In light of the presented results it appears that the external force field (i.e., the water environment which facilitates biological activity) determines the structural characteristics of polypeptides. The ordering enforced as a result of interaction with water seems limited to domain-sized units (up to approximately 150 aa). The chain seeks a balance between optimization of nonbinding interactions within the molecule (internal forces) and optimization of its interactions with the water environment. An important factor in this process is the structuralization of water, which may depend on the presence of dissolved substances. This observation is supported by the study of external conditions promoting the formation of amyloids, presented in [48], which points to pH (in a fairly wide range), presence of substances not found in the cell’s natural environment and proximity to cellular components, such as membranes. The fact that aromatic compounds stimulate amyloidosis lends support to implication of changes in water structuralizationin the process [36].
The fuzzy oil drop model provides us with a means of generalizing the presented results. If the external environment is simulated by a 3D Gaussian, the result is a hydrophobically ordered structure which includes a hydrophobic core and an encapsulating hydrophilic shield, protecting the core from contact with water and ensuring its structural stability. Simulating the folding process under different (non-Gaussian) external conditions might potentially lead to a set of dissimilar structures, since the folding chain—owing to its large number of degrees of freedom—can easily adapt to external stimuli. This phenomenon is exhibited by proteins which fold in the presence of ligands, resulting in local distortions in the structure of their hydrophobic cores [16]. From a theoretical perspective it may be interesting to perform folding simulations for a variety of external conditions, including conditions which are known to promote amyloidogenesis. The required conditions could be generated e.g., by reducing the value of one of the σ coefficients (such as σx) or by slightly increasing σy. This would result in elongation of β-strands, with involvement of loops and even of the short helical fragment. The result would be a reduction in the angle formed by both β-sheets. The final σ coefficient (σz) could be freely increased (as shown in Figure 18), producing an ever longer molecule. Such manipulation prevents the protein from adopting a “drop-like” shape since it does not promote the emergence of a hydrophilic shell. Additionally, it upsets the balance between the internal and external forces. Tipping this balance in favor of internal forces leads to the formation of a backbone which counteracts hydrophobic effects and itself enforces a specific arrangement of hydrophobic and hydrophilic residues. This explains the good correlation between the observed hydrophobicity density distribution and the corresponding intrinsic distribution (dependent on the intrinsic hydrophobicity of each residue in the chain). Low—or even negative—correlation coefficients calculated for the observed and theoretical distribution in selected β-strands reveal structures where no discernible hydrophobic core is present.
The solubility of the AmL fragment is facilitated by chains C and D, along with the N- and C-terminal sections of chains A and B. These fragments exhibit low surficial hydrophobicity (Figure 11—N-terminal fragment, and Figure 12—C-chain: the expected low hydrophobicity is encountered on the surface), as predicted by the FOD model, despite the fact that the protein, as a whole, diverges from the model (no concentration of hydrophobicity in the core). Exposure of hydrophilic residues on the surface promotes solubility, despite the presence of a prominent “strange” AmL structure.
A situation such as this may emerge when the external force field does not cause hydrophobic residues to congregate in the central part of the protein body. Another property of the AmL structure is that it lacks a single concentration of hydrophobicity and instead exhibits several distinct peaks spread along the sheet. This prevents “closure” around a common core and produces a highly non-globular protein. Our work provides several examples of how proteins undergo progressive departure from the Gaussian distribution.
In summarizing the effects of the aqueous environment upon the structural properties of proteins it should be noted that the formation of a hydrophobic core is a generalized process. The quantity of information carried by the amino acid sequence is insufficient to unambiguously determine the conformation of each residue [58,59,60]. This work postulates that the aqueous environment remains an integral factor in the folding process and compensates for the observed shortfall in information [9,15,58,59,60].
The predisposition of certain structures towards amyloid transformation may be dependent on the degree to which they align themselves with this “unknown” external force field. An example is provided by transthyretin, the structure of which is highly differentiated (taking the fuzzy oil drop model as the criterion) [20].
Generation of a highly specific enzymatically active site requires certain distortions in the hydrophobic force field, as described in [12,61]. This process also calls for a suitable carrier of information which must be contributed by the protein’s environment. The final structure of the protein represents a balance between the internal force field (nonbinding interactions between pairs of atoms belonging to the molecule) and the external force field (dependent on the structural properties of water). Accordingly, changes in the (heretofore unknown) external field may lead to different results as the protein chain adapts itself to its environment. It would be interesting to consider the reasons behind environmental changes in organisms afflicted by the propagation of amyloid plaques—assuming, of course, that the presented hypothesis holds true.
Finally, one can conclude that an amyloid molecule is one which does not follow the general tendency to produce a common hydrophobic core (ignoring the external force field) and instead favors a conformation which depends solely on its own properties (internal force field).
Structural transformation (taking transthyretin as an example) can be imagined as the effect of stretching forces acting in the plane of β-strands and reducing the distance between sheets (compressing the β-sandwich). As a result, residues which originally form loops, are “recruited” for further β-strands. In this context it seems that the angle between adjacent sheets is of critical importance—in amyloid structures the observed angle is close to zero (near-parallel structures) (Figure 18). Compression of loops may be the reason behind the inability of proteolytic enzymes to react with amyloid molecules (insufficient space to interact with peptide bonds).
The authors of [56] propose a potential therapeutic approach where the introduction of a suitable peptide may cause the protein to revert to a classic “core-like” conformation—although our study suggests that the required peptide should be somewhat longer. Furthermore, it appears that a peptide carrying a greater number of hydrophilic residues might “complete” the protein’s hydrophilic shield, producing a quasi-globular form.
It must be noted that under the fuzzy oil drop model the hydrophobic core is defined as a concentration of hydrophobic residues in the central part of the protein body together with an encapsulating hydrophilic shield. Elongation of amyloid fibrils is facilitated by the exposure of hydrophobic residues on the protein surface, along the external walls of the β-sandwich. Note that similar exposure in the area of external loops does not cause lateral complexation due to the fact that the fibril is usually twisted around its axis of propagation.
The reasons behind changes in the structure of the external force field (i.e., departures from the Gaussian distribution) remain unknown. One hypothesis refers to changes in the structuralization of water upsetting the balance between the influence of the external field and the intrinsic properties of individual residues: in amyloid aggregates these residues appear “liberated” from cooperative interactions which would otherwise produce a shared core. This hypothesis is consistent with to-date observations regarding external factors which promote in vitro amyloidogenesis (such as shaking). The authors plan to perform simulations of the folding process under a variety of external conditions, represented by deformed hydrophobicity “capsules”, including forms which do not resemble the idealized 3D Gaussian [60].
Thus far, the lowest RD value expressing the status of the entire domain has been identified for titin, suggesting exceptionally high stability (as determined by the fuzzy oil drop model). This domain therefore represents a good study subjects in experiments revealing the step-wise mechanism of protein unfolding [62].
Three proteins which are classified as amyloids in PDB (2MXU, 2MVX and 2MPZ) [41,42,43] have been analyzed in search for possible generalizations of the presented fibril formation mechanism. Results firmly support the conclusion that amyloidogenesis is related to the lack of a hydrophobic core, with the protein’s structural form dominated by the intrinsic hydrophobicity of individual residues.
The topic of amyloidogenesis has been the subject of many scientific endeavors and a great variety of papers have been published, approaching the problem from all possible angles: diagnostics [63,64,65,66], therapeutic [67,68,69,70,71,72,73,74,75,76,77,78,79,80,81] and structural/molecular [82,83,84,85]. Our publication does not, however, discuss amyloidogenesis as such, but rather the molecular processes which lead to the formation of fibrillary aggregates commonly referred to as amyloids. The model described in this paper applied to lysozyme structure allows the recognition of the seed and possible mechanism of amyloid changes in this molecule, what experimentally was observed in [86].

Acknowledgments

The authors would like to express their thanks to Piotr Nowakowski and Anna Śmietańska for valuable suggestions and editorial work. This research was supported by the Jagiellonian University Medical College grant No. K/ZDS/006363.

Author Contributions

Irena Roterman and Leszek Konieczny conceived and designed the experiments; Mateusz Banach performed the experiments; Irena Roterman analyzed the data; Barbara Kalinowska contributed reagents/materials/analysis tools; Irena Roterman wrote the paper. All authors have read and approved the final manuscript.

Conflicts of Interest

The authors declare no conflict of interest.

References

  1. Dill, K.A.; MacCallum, J.L. The protein-folding problem, 50 years on. Science 2012, 338, 1042–1046. [Google Scholar] [CrossRef] [PubMed]
  2. Moult, J.; Fidelis, K.; Kryshtafovych, A.; Schwede, T.; Tramontano, A. Critical assessment of methods of protein structure prediction (CASP)—Round X. Proteins 2014, 82 (Suppl. S2), 1–6. [Google Scholar] [CrossRef] [PubMed]
  3. Protein Structure Prediction Center. Available online: www.predictioncenter.org (accessed on 20 September 2016).
  4. Khoury, G.A.; Liwo, A.; Khatib, F.; Zhou, H.; Chopra, G.; Bacardit, J.; Bortot, L.O.; Faccioli, R.A.; Deng, X.; He, Y.; et al. WeFold: A coopetition for protein structure prediction. Proteins 2014, 82, 1850–1868. [Google Scholar] [CrossRef] [PubMed]
  5. Herczenik, E.; Gebbink, M.F.B.G. Molecular and cellular aspects of protein misfolding and disease. FASEB J. 2008, 22, 2115–2133. [Google Scholar] [CrossRef] [PubMed]
  6. Reynaud, E. Protein Misfolding and Degenerative Diseases. Nat. Educ. 2010, 3, 28. [Google Scholar]
  7. Bross, P.; Gregersen, N. Protein Misfolding and Cellular Stress in Disease and Aging; Humana: New York, NY, USA, 2010. [Google Scholar]
  8. Biedermann, F.; Nau, W.M.; Schneider, H.-J.S. The hydrophobic effect revisited—Studies with supramolecular complexes imply high-energy water as a noncovalent driving force. Angew. Chem. 2014, 53, 11158–11171. [Google Scholar] [CrossRef] [PubMed]
  9. Serpell, L.C. Alzheimer’s amyloid fibrils: Structure and assembly. Biochim. Biophys. Acta 2000, 1502, 16–30. [Google Scholar] [CrossRef]
  10. Kauzmann, W. Some factors in the interpretation of protein denaturation. Adv. Protein Chem. 1959, 14, 1–63. [Google Scholar] [CrossRef] [PubMed]
  11. Konieczny, L.; Brylinski, M.; Roterman, I. Gauss-Function-Based Model of Hydrophobicity Density in Proteins. In Silico Biol. 2006, 6, 15–22. [Google Scholar] [PubMed]
  12. Banach, M.; Kalinowska, B.; Konieczny, L.; Roterman, I. Role of Disulfide Bonds in Stabilizing the Conformation of Selected Enzymes—An Approach Based on Divergence Entropy Applied to the Structure of Hydrophobic Core in Proteins. Entropy 2016, 18, 67. [Google Scholar] [CrossRef]
  13. Banach, M.; Prymula, K.; Jurkowski, W.; Konieczny, L.; Roterman, I. Fuzzy oil drop model to interpret the structure of antifreeze proteins and their mutants. J. Mol. Model. 2012, 18, 229–237. [Google Scholar] [CrossRef] [PubMed]
  14. Roterman, I.; Konieczny, L.; Jurkowski, W.; Prymula, K.; Banach, M. Two-intermediate model to characterize the structure of fast-folding proteins. J. Theor. Biol. 2011, 283, 60–70. [Google Scholar] [CrossRef] [PubMed]
  15. Prymula, K.; Jadczyk, T.; Roterman, I. Catalytic residues in hydrolases: Analysis of methods designed for ligand-binding site prediction. J. Comput. Aided Mol. Des. 2011, 25, 117–133. [Google Scholar] [CrossRef] [PubMed]
  16. Banach, M.; Konieczny, L.; Roterman-Konieczna, I. Ligand-binding-site recognition. In Protein Folding in Silico; Woodhead: Cambridge, UK, 2012; pp. 79–93. [Google Scholar]
  17. Banach, M.; Konieczny, L.; Roterman-Konieczna, I. Can the structure of hydrophobic core determine the complexation site? In Identification of Ligand Binding Site and Protein-Protein Interaction Area; Springer: Dordrecht, The Netherlands, 2013; pp. 41–54. [Google Scholar]
  18. Banach, M.; Konieczny, L.; Roterman-Konieczna, I. Use of the “fuzzy oil drop” model to identify the complexation area in protein homodimers. In Protein Folding in Silico; Woodhead: Cambridge, UK, 2012; pp. 95–122. [Google Scholar]
  19. Improta, S.; Politou, A.S.; Pastore, A. Immunoglobulin-like modules from titin I-band: Extensible components of muscle elasticity. Structure 1996, 4, 323–337. [Google Scholar] [CrossRef]
  20. Banach, M.; Konieczny, L.; Roterman-Konieczna, I. The fuzzy oil drop model, based on hydrophobicity density distribution, generalizes the influence of water environment on protein structure and function. J. Theor. Biol. 2014, 359, 6–17. [Google Scholar] [CrossRef] [PubMed]
  21. Rico, F.; Gonzales, L.; Casuso, I.; Puig-Vidal, M.; Scheuring, S. High-speed force spectroscopy unfolds titin at the velocity of molecular dynamics simulation. Science 2013, 342, 741–743. [Google Scholar] [CrossRef] [PubMed] [Green Version]
  22. Perrakis, A.; Tews, I.; Dauter, Z.; Oppenheim, A.B.; Chet, I.; Wilson, K.S.; Vorgias, C.E. Crystal structure of a bacterial chitinase at 2.3 A resolution. Structure 1994, 2, 1169–1180. [Google Scholar] [CrossRef]
  23. Lu, H.; Schulten, K. The key event in force-induced unfolding of titin’s immunoglobulin domains. Biophys. J. 2000, 79, 51–65. [Google Scholar] [CrossRef]
  24. Klabunde, T.; Petrassi, H.M.; Oza, V.B.; Raman, P.; Kelly, J.W.; Sacchettini, J.C. Rational design of potent human transthyretin amyloid disease inhibitors. Nat. Struct. Biol. 2000, 7, 312–321. [Google Scholar] [PubMed]
  25. Umehara, T.; Nakamura, Y.; Jang, M.K.; Nakano, K.; Tanaka, A.; Ozato, K.; Padmanabhan, B.; Yokoyama, S. Structural basis for acetylated histone H4 recognition by the human BRD2 bromodomain. J. Biol. Chem. 2010, 285, 7610–7618. [Google Scholar] [CrossRef] [PubMed]
  26. Sebastião, M.P.; Saraiva, M.J.; Damas, A.M. The crystal structure of amyloidogenic Leu55 → Pro transthyretin variant reveals a possible pathway for transthyretin polymerization into amyloid fibrils. J. Biol. Chem. 1998, 273, 24715–24722. [Google Scholar] [CrossRef] [PubMed]
  27. Hawkins, P.N.; Ando, Y.; Dispenzeri, A.; Gonzalez-Duarte, A.; Adams, D.; Suhr, O.B. Evolving landscape in the management oftransthyretinamyloidosis. Ann. Med. 2015, 47, 625–638. [Google Scholar] [CrossRef] [PubMed]
  28. Mizuguchi, M.; Yokoyama, T.; Nabeshima, Y.; Kawano, K.; Tanaka, I.; Niimura, N. Quaternary structure, aggregation and cytotoxicity of transthyretin. Amyloid 2012, 19 (Suppl. S1), 5–7. [Google Scholar] [CrossRef] [PubMed]
  29. Van der Wel, P.C.A. Domain swapping and amyloid fibril conformation. Prion 2012, 6, 211–216. [Google Scholar] [CrossRef] [PubMed]
  30. Pires, R.H.; Saraiva, M.J.; Damas, A.M.; Kellermayer, M.S. Structureand assembly-disassembly properties of wild-typetransthyretinamyloidprotofibrils observed with atomic force microscopy. J. Mol. Recognit. 2011, 24, 467–476. [Google Scholar] [CrossRef] [PubMed]
  31. Du, J.; Murphy, R.M. Characterization of the interaction of β-amyloidwithtransthyretinmonomers and tetramers. Biochemistry 2010, 49, 8276–8289. [Google Scholar] [CrossRef] [PubMed]
  32. Cendron, L.; Trovato, A.; Seno, F.; Folli, C.; Alfieri, B.; Zanotti, G.; Berni, R. Amyloidogenic potential oftransthyretinvariants: Insights from structural and computational analyses. J. Biol. Chem. 2009, 284, 25832–25841. [Google Scholar] [CrossRef] [PubMed]
  33. Wada, K.; Sumi, N.; Nagai, R.; Iwasaki, K.; Sato, T.; Suzuki, K.; Hasegawa, Y.; Kitaoka, S.; Minami, Y.; Outten, F.W.; et al. Molecular dynamism of Fe–S cluster biosynthesis implicated by the structure of the SufC2–SufD2 complex. J. Mol. Biol. 2009, 387, 245–258. [Google Scholar] [CrossRef] [PubMed]
  34. Lu, J.X.; Qiang, W.; Yau, W.M.; Schwieters, C.D.; Meredith, S.C.; Tycko, R. Molecular structure of β-amyloid fibrils in Alzheimer’s disease brain tissue. Cell 2013, 154, 1257–1268. [Google Scholar] [CrossRef] [PubMed]
  35. Eisenberg, D.; Jucker, M. The amyloid state of proteins in human diseases. Cell 2012, 148, 1188–1203. [Google Scholar] [CrossRef] [PubMed]
  36. Lührs, T.; Ritter, C.; Adrian, M.; Riek-Loher, D.; Bohrmann, B.; Döbeli, H.; Schubert, D.; Riek, R. 3D structure of Alzheimer’s amyloid-β(1–42) fibrils. Proc. Natl. Acad. Sci. USA 2005, 102, 17342–17347. [Google Scholar] [CrossRef] [PubMed]
  37. Pedersen, M.Ø.; Mikkelsen, K.; Behrens, M.A.; Pedersen, J.S.; Enghild, J.J.; Skrydstrup, T.; Malmendal, A.; Nielsen, N.C. NMR Reveals Two-Step Association of Congo Red to Amyloid β in Low-Molecular-Weight Aggregates. J. Phys. Chem. B 2010, 114, 16003–16010. [Google Scholar] [CrossRef] [PubMed]
  38. Bose, P.P.; Chatterjee, U.; Xie, L.; Johansson, J.; Göthelid, E.; Arvidsson, P.I. Effects of Congo Red on Aβ1–40 Fibril Formation Process and Morphology. ACS Chem. Neurosci. 2010, 1, 315–324. [Google Scholar] [CrossRef] [PubMed]
  39. James, T.J.; Liu, H.; Ulyanov, N.B.; Farr-Jones, S.; Zhang, Z.; Donne, D.G.; Kaneko, K.; Groth, D.; Mehlhorn, I.; Prusiner, S.B.; et al. Solution structure of a 142-residue recombinant prion protein corresponding to the infectious fragment of the scrapie isoform. Proc. Natl. Acad. Sci. USA 1997, 94, 10086–10091. [Google Scholar] [CrossRef] [PubMed]
  40. Luna, E.; Luk, K.C. Bent out of shape: α-Synuclein misfolding and the convergence of pathogenic pathways in Parkinson’s disease. FEBS Lett. 2015, 589, 3749–3759. [Google Scholar] [CrossRef] [PubMed]
  41. Wu, C.; Scott, J.; Shea, J.E. Binding of Congo Red to Amyloid Protofibrils of the Alzheimer Aβ9–40 Peptide Probed by Molecular Dynamics Simulations. Biophys. J. 2012, 103, 550–557. [Google Scholar] [CrossRef] [PubMed]
  42. Schütz, A.K.; Vagt, T.; Huber, M.; Ovchinnikova, O.Y.; Adalbert, R.; Wall, J.; Güntert, P.; Böckmann, A.; Glockshuber, R.; Meier, B.H. Atomic-resolution three-dimensional structure of amyloid β fibrils bearing the Osaka mutation. Angew. Chem. 2015, 54, 331–335. [Google Scholar] [CrossRef] [PubMed]
  43. Sgourakis, N.G.; Yau, W.M.; Qiang, W. Modeling an In-Register, Parallel “Iowa” Aβ Fibril Structure Using Solid-State NMR Data from Labeled Samples with Rosetta. Structure 2015, 23, 216–227. [Google Scholar] [CrossRef] [PubMed]
  44. Xiao, Y.; Ma, B.; McElheny, D.; Parthasarathy, S.; Long, F.; Hoshi, M.; Nussinov, R.; Ishii, Y. Aβ(1–42) fibril structure illuminates self-recognition and replication of amyloid in Alzheimer’s disease. Nat. Struct. Mol. Biol. 2015, 22, 499–505. [Google Scholar] [CrossRef] [PubMed]
  45. Chiche, L.; Gregoret, L.M.; Cohen, F.E.; Kollman, P.A. Protein model structure evaluation using the solvation free energy of folding. Proc. Natl. Acad. Sci. USA 1990, 87, 3240–3243. [Google Scholar] [CrossRef] [PubMed]
  46. Kalinowska, B.; Banach, M.; Konieczny, L.; Roterman, I. Application of Divergence Entropy to Characterize the Structure of the Hydrophobic Core in DNA Interacting Proteins. Entropy 2015, 17, 1477–1507. [Google Scholar] [CrossRef]
  47. Levitt, M.A. A simplified representation of protein conformations for rapid simulation of protein folding. J. Mol. Biol. 1976, 104, 59–107. [Google Scholar] [CrossRef]
  48. Kullback, S.; Leibler, R.A. On information and sufficiency. Ann. Math. Stat. 1951, 22, 79–86. [Google Scholar] [CrossRef]
  49. Sillitoe, I.; Lewis, T.E.; Cuff, A.L.; Das, S.; Ashford, P.; Dawson, N.L.; Furnham, N.; Laskowski, R.A.; Lee, D.; Lees, J.; et al. CATH: Comprehensive structural and functional annotations for genome sequences. Nucl. Acids Res. 2015, 43, D376–D381. [Google Scholar] [CrossRef] [PubMed]
  50. De Beer, T.A.P.; Berka, K.; Thornton, J.M.; Laskowski, R.A. PDBsum additions. Nucl. Acids Res. 2014, 42, D292–D296. [Google Scholar] [CrossRef] [PubMed]
  51. Solar, M.; Buehler, M.J. Tensile deformation and failure of amyloid and amyloid-like protein fibrils. Nanotechnology 2014, 25, 105703. [Google Scholar] [CrossRef] [PubMed]
  52. Wasmer, C.; Lange, A.; van Melckebeke, H.; Siemer, A.B.; Riek, R.; Meier, B.H. Amyloid Fibrils of the HET-s(218–289) Prion Form a β Solenoid with a Triangular Hydrophobic Core. Science 2008, 319, 1523–1526. [Google Scholar] [CrossRef] [PubMed]
  53. Saini, A.; Mapolelo, D.T.; Chahal, H.K.; Johnson, M.K.; Outten, F.W. SufD and SufC ATPase activity are required for iron acquisition during in vivo Fe-S cluster formation on SufB. Biochemistry 2010, 49, 9402–9412. [Google Scholar] [CrossRef] [PubMed]
  54. Sato, S. The apicomplexan plastid and its evolution. Cell. Mol. Life Sci. 2011, 68, 1285–1296. [Google Scholar] [CrossRef] [PubMed]
  55. Py, B.; Barras, F. Building Fe–S proteins: Bacterial strategies. Nat. Rev. Microbiol. 2010, 8, 436–446. [Google Scholar] [CrossRef] [PubMed]
  56. PyMOL. Available online: https://www.pymol.org/ (accessed on 20 September 2016).
  57. Saelices, L.; Johnson, L.M.; Liang, W.Y.; Sawaya, M.R.; Cascio, D.; Ruchala, P.; Whitelegge, J.; Jiang, L.; Riek, R.; Eisenberg, D.S. Uncovering the Mechanism of Aggregation of Human Transthyretin. J. Biol. Chem. 2015, 290, 28932–28943. [Google Scholar] [CrossRef] [PubMed]
  58. Sant’Anna, R.; Braga, C.; Varejão, N.; Pimenta, K.M.; Graña-Montes, R.; Alves, A.; Cortines, J.; Cordeiro, Y.; Ventura, S.; Foguel, D. The importance of a gatekeeper residue on the aggregation of transthyretin: Implications for transthyretin-related amyloidoses. J. Biol. Chem. 2014, 289, 28324–28337. [Google Scholar] [CrossRef] [PubMed]
  59. Piwowar, M.; Banach, M.; Konieczny, L.; Roterman, I. Hydrophobic core formation in protein complex of cathepsin. J. Biomol. Struct. Dyn. 2014, 32, 1023–1032. [Google Scholar] [CrossRef] [PubMed]
  60. Alejster, P.; Jurkowski, W.; Roterman-Konieczna, I. Structural information involved in the interpretation of the stepwise protein folding process. In Protein Folding in Silico; Woodhead: Cambridge, UK, 2012; pp. 39–54. [Google Scholar]
  61. Jurkowski, W.; Brylinski, M.; Konieczny, L.; Wiíniowski, Z.; Roterman, I. Conformational subspace in simulation of early-stage protein folding. Proteins 2004, 55, 115–127. [Google Scholar] [CrossRef] [PubMed]
  62. Konieczny, L.; Roterman-Konieczna, I. Conclusion. In Protein Folding in Silico; Woodhead: Cambridge, UK, 2012; pp. 191–201. [Google Scholar]
  63. Schönfelder, J.; Perez-Jimenez, R.; Muñoz, V. A simple two-state protein unfolds mechanically via multiple heterogeneous pathways at single-molecule resolution. Nat. Commun. 2016, 7, 11777. [Google Scholar] [CrossRef] [PubMed]
  64. Bittner, T.; Zetterberg, H.; Teunissen, C.E.; Ostlund, R.E., Jr.; Militello, M.; Andreasson, U.; Hubeek, I.; Gibson, D.; Chu, D.C.; Eichenlaub, U.; et al. Technical performance of a novel, fully automated electrochemiluminescence immunoassay for the quantitation of β-amyloid(1–42) in human cerebrospinal fluid. Alzheimers Dement. 2016, 12, 517–526. [Google Scholar] [CrossRef] [PubMed]
  65. Gilson, V.; Mbebi-Liegeois, C.; Sellal, F.; de Barry, J. Effects of Low Amyloid-β (Aβ) Concentration on Aβ1–42 Oligomers Binding and GluN2B Membrane Expression. J. Alzheimers Dis. 2015, 47, 453–466. [Google Scholar] [PubMed]
  66. Viola, K.L.; Klein, W.L. Amyloid β oligomers in Alzheimer’s disease pathogenesis, treatment, and diagnosis. Acta Neuropathol. 2015, 129, 183–206. [Google Scholar] [CrossRef] [PubMed]
  67. Kopecky, C.; Genser, B.; Drechsler, C.; Krane, V.; Kaltenecker, C.C.; Hengstschläger, M.; März, W.; Wanner, C.; Säemann, M.D.; Weichhart, T. Quantification of HDL proteins, cardiac events, and mortality in patients with type 2 diabetes on hemodialysis. Clin. J. Am. Soc. Nephrol. 2015, 10, 224–231. [Google Scholar] [CrossRef] [PubMed]
  68. Daniels, M.J.; Rivers-Auty, J.; Schilling, T.; Spencer, N.G.; Watremez, W.; Fasolino, V.; Booth, S.J.; White, C.S.; Baldwin, A.G.; Freeman, S.; et al. FenamateNSAIDs inhibit the NLRP3 inflammasome and protect against Alzheimer’s disease in rodent models. Nat. Commun. 2016, 7, 12504. [Google Scholar] [CrossRef] [PubMed]
  69. Stanley, M.; Macauley, S.L.; Holtzman, D.M. Changes in insulin and insulin signaling in Alzheimer’s disease: Cause or consequence? J. Exp. Med. 2016, 213, 1375–1385. [Google Scholar] [CrossRef] [PubMed]
  70. Yan, R. Stepping closer to treating Alzheimer’s disease patients with BACE1 inhibitor drugs. Transl. Neurodegener. 2016, 5, 13. [Google Scholar] [CrossRef] [PubMed]
  71. Miller-Thomas, M.M.; Sipe, A.L.; Benzinger, T.L.; McConathy, J.; Connolly, S.; Schwetye, K.E. Multimodality Review of Amyloid-related Diseases of the Central Nervous System. Radiographics 2016, 36, 1147–1163. [Google Scholar] [CrossRef] [PubMed]
  72. Busche, M.A.; Konnerth, A. Impairments of neural circuit function in Alzheimer’s disease. Philos. Trans. R. Soc. Lond. B Biol. Sci. 2016, 371. [Google Scholar] [CrossRef] [PubMed]
  73. Di Scala, C.; Yahi, N.; Boutemeur, S.; Flores, A.; Rodriguez, L.; Chahinian, H.; Fantini, J. Common molecular mechanism of amyloid pore formation by Alzheimer’s β-amyloid peptide and α-synuclein. Sci. Rep. 2016, 6, 28781. [Google Scholar] [CrossRef] [PubMed]
  74. López, L.C.; Varea, O.; Navarro, S.; Carrodeguas, J.A.; Sanchez de Groot, N.; Ventura, S.; Sancho, J. Benzbromarone, Quercetin, and Folic Acid Inhibit Amylin Aggregation. Int. J. Mol. Sci. 2016, 17, 964. [Google Scholar] [CrossRef] [PubMed]
  75. Fisher, J.R.; Wallace, C.E.; Tripoli, D.L.; Sheline, Y.I.; Cirrito, J.R. Redundant Gs-coupled serotonin receptors regulate amyloid-β metabolism in vivo. Mol. Neurodegener. 2016, 11, 45. [Google Scholar] [CrossRef] [PubMed]
  76. Harwell, C.S.; Coleman, M.P. Synaptophysin depletion and intraneuronal Aβ in organotypic hippocampal slice cultures from huAPP transgenic mice. Mol. Neurodegener. 2016, 11, 44. [Google Scholar] [CrossRef] [PubMed]
  77. Dinet, V.; Ciccotosto, G.D.; Delaunay, K.; Borras, C.; Ranchon-Cole, I.; Kostic, C.; Savoldelli, M.; El Sanharawi, M.; Jonet, L.; Pirou, C.; et al. Amyloid Precursor-Like Protein 2 deletion-induced retinal synaptopathy related to congenital stationary night blindness: Structural, functional and molecular characteristics. Mol. Brain 2016, 9, 64. [Google Scholar] [CrossRef] [PubMed] [Green Version]
  78. Tetz, V.; Tetz, G. Effect of deoxyribonuclease I treatment for dementia in end-stage Alzheimer’s disease: A case report. J. Med. Case Rep. 2016, 10, 131. [Google Scholar] [CrossRef] [PubMed]
  79. Knight, E.M.; Kim, S.H.; Kottwitz, J.C.; Hatami, A.; Albay, R.; Suzuki, A.; Lublin, A.; Alberini, C.M.; Klein, W.L.; Szabo, P.; et al. Effective anti-Alzheimer Aβtherapy involves depletion of specific Aβ oligomer subtypes. Neurol. Neuroimmunol. Neuroinflamm. 2016, 3, e237. [Google Scholar] [CrossRef] [PubMed]
  80. Kantarci, K.; Lowe, V.J.; Lesnick, T.G.; Tosakulwong, N.; Bailey, K.R.; Fields, J.A.; Shuster, L.T.; Zuk, S.M.; Senjem, M.L.; Mielke, M.M.; et al. Early Postmenopausal Transdermal 17β-Estradiol Therapy and Amyloid-β Deposition. J. Alzheimers Dis. 2016, 53, 547–556. [Google Scholar] [CrossRef] [PubMed]
  81. Bobkova, N.; Vorobyov, V.; Medvinskaya, N.; Nesterova, I.; Tatarnikova, O.; Nekrasov, P.; Samokhin, A.; Deev, A.; Sengpiel, F.; Koroev, D.; et al. Immunization against Specific Fragments of Neurotrophin p75 Receptor Protects Forebrain Cholinergic Neurons in the Olfactory Bulbectomized Mice. J. Alzheimers Dis. 2016, 53, 289–301. [Google Scholar] [CrossRef] [PubMed]
  82. Lisenko, K.; Schönland, S.O.; Jauch, A.; Andrulis, M.; Röcken, C.; Ho, A.D.; Goldschmidt, H.; Hegenbart, U.; Hundemer, M. Flow cytometry-based characterization of underlying clonal B and plasma cells in patients with light chain amyloidosis. Cancer Med. 2016, 5, 1464–1472. [Google Scholar] [CrossRef] [PubMed]
  83. Boke, E.; Ruer, M.; Wühr, M.; Coughlin, M.; Lemaitre, R.; Gygi, S.P.; Alberti, S.; Drechsel, D.; Hyman, A.A.; Mitchison, T.J. Amyloid-Like Self-Assembly of a Cellular Compartment. Cell 2016, 166, 637–650. [Google Scholar] [CrossRef] [PubMed]
  84. Wälti, M.A.; Ravotti, F.; Arai, H.; Glabe, C.G.; Wall, J.S.; Böckmann, A.; Güntert, P.; Meier, B.H.; Riek, R. Atomic-resolution structure of a disease-relevant Aβ(1–42) amyloid fibril. Proc. Natl. Acad. Sci. USA 2016, 113, E4976–E4984. [Google Scholar] [CrossRef] [PubMed]
  85. Voges, M.; Schneider, C.; Sinn, M.; Hartig, J.S.; Reimer, R.; Hauber, J.; Moelling, K. Abolishing HIV-1 infectivity using a polypurine tract-specific G-quadruplex-forming oligonucleotide. BMC Infect. Dis. 2016, 16, 358. [Google Scholar] [CrossRef] [PubMed]
  86. Helmfors, L.; Bergkvist, L.; Brorsson, A.C. Serum Amyloid P Component Ameliorates Neurological Damage Caused by Expressing a Lysozyme Variant in the Central Nervous System of Drosophila melanogaster. PLoS ONE 2016, 11, e0159294. [Google Scholar] [CrossRef] [PubMed]
Figure 1. Comparison between the classical discrete oil drop model (A,C) and the fuzzy oil drop model (B,D). Circles represent positions of hydrophobic (dark) and hydrophilic (white) residues. The charts represent the assumed distribution of hydrophobicity density in each model. The figure intentionally resembles the one presented in [44] so as to visualize the continuity and evolution of theoretical hydrophobic core models.
Entropy 18 00351 g001
Figure 2. Graphical representation of the encapsulation of the protein molecule with a 3D Gaussian. (A) two-dimensional Gaussian forms plotted along the horizontal (X-axis) and vertical (Y-axis) axes. The volume of the capsule (drop) is determined by its σ coefficients. Since σx > σy, the molecule is stretched along the X axis. The boundary of the 3D capsule is given by the so-called three-sigma rule for each axis independently ( x ¯ ± 3 σ x , y ¯ ± 3 σ y , z ¯ ± 3 σ z ); (B) protein molecule encapsulated in an ellipsoid. Changes in coloring (from gray to purple) represent increasing hydrophobicity density.
Entropy 18 00351 g002
Figure 3. Hydrophobicity density distribution according to the discrete (A,C) and continuous models (B,D). The placement of residues may not correspond to their intrinsic hydrophobicity. Here, white circles (hydrophilic residues) are localized in the central part of the protein body (left). The right-hand diagram presents the continuous distribution, with shades of grey indicating varying hydrophobicity. Diagrams B and D present the hydrophobicity distribution in the discrete and continuous models respectively: T (blue)—expected; O (brown)—observed.
Entropy 18 00351 g003
Figure 4. Graphical representation of fuzzy oil drop model parameters reduced to a single dimension for simplicity. The leftmost figure (A) presents the theorized Gaussian distribution (T—blue) while the chart on the right corresponds to the uniform distribution (R—green) (C). Actual (observed—red) hydrophobicity density distribution (B) in the target protein is shown in the center, while the corresponding value of RD(R) (R denotes a reference to the R distribution) (below 0.5) is marked on the horizontal axis with a red triangle (D). According to the fuzzy oil drop model this protein contains a well-defined hydrophobic core. For the purpose of analysis of selected secondary folds, the reference (R) is replaced by a distribution matching the intrinsic hydrophobicity of each residue in a given fragment. The observed distribution (G) is then compared to the expected one (F) as well as to the “intrinsic” distribution (H). The red triangle on the axis (E) marks a point above 0.5—this means that distribution G more closely approximates the “intrinsic” distribution.
Entropy 18 00351 g004
Figure 5. Hydrophobicity density distribution profile in 1TIT. (A) theoretical (T—blue) and observed (O—red) hydrophobicity density distribution; (B) correlation between T and O distributions in 1TIT (correlation coefficient = 0.661).
Entropy 18 00351 g005
Figure 6. Hydrophobicity density distribution profiles for successive β-strands present in titin. Residue numbers are listed for each fragment. Theoretical distribution–blue; intrinsic hydrophobicity—green; observed distribution—red. (A) β-fragment 19–25; (B) β-fragment 46–52; (C) β-fragment 54–61; (D) β-fragment 82–87.
Entropy 18 00351 g006
Figure 7. T and O distributions in transthyretin. (A,C) Hydrophobicity profile in chain A: in monomer (A) and in dimer (C)—T (blue) and O (red); (B,D) correlation between T and O values for each residue, calculated for chain A. Correlation coefficients are 0.592 for the monomer (B) and 0.353 for the dimer (D).
Entropy 18 00351 g007
Figure 8. 3D presentation of transthyretin (A) monomer unit; (B) dimer. Red—fragments recognized as irregular (versus the theoretical distribution); dark blue—highly accordant fragments; cyan—second chain in the dimer. Data has been derived from Table 3 and Table 4.
Entropy 18 00351 g008
Figure 9. T, O and H hydrophobicity density distribution profiles for individual β-strands in transthyretin. Numbers indicate which residues form part of the selected fragment. Distribution: T—blue, O—red, H—green. (A) β-fragment 11–19; (B) β-fragment 28–36; (C) β-fragment 40–49; (D) β-fragment 67–73; (E) β-fragment 74–81; (F) β-fragment 88–97; (G) β-fragment 104–112; (H) β-fragment 115–123.
Entropy 18 00351 g009
Figure 10. Theoretical (T—blue) and observed (O—red) hydrophobicitydensity distribution profiles for the A chain of the analyzed protein. The AmL fragment comprises residues 151 through 365 (inclusive).
Entropy 18 00351 g010
Figure 11. Hydrophobicity density distribution profiles for the C chain:theoretical (T—blue) and observed (O—red). Green vertical lines distinguish residues engaged in P-P interaction.
Entropy 18 00351 g011
Figure 12. Hydrophobicity density distribution profiles for successive layers of the β-system in AmL: T—blue, O—red, H—green. According to the theoretical distribution, a single, prominent peak should be observed in the central part of each fragment. In fact, many fragments exhibit multiple peaks as well as increased hydrophobicity in their terminal sections, resulting in poor solubility. (A) fragment 151–158; (B) fragment 166–178; (C) fragment 181–192; (D) fragment 196–208; (E) fragment 211–220; (F) fragment 225–236; (G) fragment 239–248; (H) fragment 251–262; (I) fragment 266–275; (J) fragment 280–291; (K) fragment 295–305; (L) fragment 309–320; (M) fragment 326–337; (N) fragment 342–352; (O) fragment 355–367.
Entropy 18 00351 g012
Figure 13. Properties of the 225–236 fragment. (A) Distribution profile: theoretical (T—blue) and observed (O—red) hydrophobicity density distribution for the fragment at 225–236. The green line represents a distribution given by the intrinsic hydrophobicity of each residue; (B) correlation between theoretical and observed distributions (correlation coefficient = −0.657); (C) correlation between intrinsic hydrophobicity and observed hydrophobicity (correlation coefficient = 0.616).
Entropy 18 00351 g013
Figure 14. 3D structure of 2ZU0. (A) gray sections distinguish chains C and D and fragments of chains A and B not belonging to AmL. The AmL fragment is colored according to the hydrophobicity of each residue; (B) the AmL fragment in a space-filling representation colored according to residual hydrophobicity. It is evident that hydrophobic residues (red) do not form any organized system (seemingly random distribution). The red-white scale is derived from PyMol, with hydrophobicity taken as the coloring criterion [56].
Entropy 18 00351 g014
Figure 15. Hydrophobicity density distribution in peptides which are considered for therapeutic use as amyloid solubility promoters (only intrinsic hydrophobicity is presented). (A) sequence AEVVFT; (B) sequence TAVVTN.
Entropy 18 00351 g015
Figure 16. Intrinsic (green), theoretical (blue) and observed (red) hydrophobicity density distributions for fragments at 131–140 (A) and 142–160 (B) in 1B10. These fragments are regarded as candidates for amyloidogenic conformational changes given the similarity between their hydrophobicity density distribution profiles and those observed for the corresponding fragments in AmL. Both fragments have been identified by comparing the correlation coefficients for individual fragments of 1B10 against AmL (Table 7 and Table 8). Note the presence of a left-handed helix (131–140) which occupies a highly energetic zone on the Ramachandran plot.
Entropy 18 00351 g016
Figure 17. 3D structure of the prion protein with the fragment at 131–140 marked in red. This fragment was identified as susceptible to conformational changes on the basis of its similarity with AmL in the context of hydrophobicity density distribution (Table 7 and Table 8).
Entropy 18 00351 g017
Figure 18. Hypothetical mechanism of structural changes in transthyretin leading to formation of an AmL-like structure. The sandwich structure in transthyretin (upper row) exhibits greater distance between sheets, along with greater differences in their mutual orientation when compared to AmL (lower row). The two rightmost structures visualize different angles between β-fragments in β-sheets. 3D structures are compared with Gaussian plots. The arrows at the top and on the left visualize external forces (elongation and stretching respectively). Black lines on the rightmost Gauss curve and in the bottom left-hand image visualize the distribution of hydrophobicity as observed in AmL, showing how it diverges from theoretical predictions.
Entropy 18 00351 g018
Figure 19. Hydrophobicity density distributions: (A) theoretical distribution (with a central peak)—blue line; observed distribution (somewhat divergent from the theoretical model but retaining the overall shape)—red line; (B) theoretical distribution—dotted line; hypothetical distorted distributions exhibiting several local peaks—blue and red lines.
Entropy 18 00351 g019
Table 1. Proteins subjected to analysis along with the reasons for their inclusion in the study set.
ProteinCharacteristicsSourceReason for InclusionRef.
1TITTitin–domainHSAccording to FOD model—very stable domain with low propensity for amyloid transformation[19]
2DVQTransthyretinHSAmyloidogenic protein[25]
2ZU0SufC-SufD complex involved in the iron- sulfur cluster biosynthesisE. coliContains an amyloid-like fragment[30]
1B10Recombinant prion protein (90–231)M. auratusPrion protein capable of amyloidogenesis[39]
1XQ8SynucleinHSα-Synuclein (aS) associated with Parkinson’s disease[40]
Amyloid β peptide[41]
2MVXAmyloid β a4 proteinHSAlzheimer related fibril[42]
2MPZAmyloid β a4 proteinHSAlzheimer related fibril[43]
2MXUAmyloid β a4 proteinHSAlzheimer related fibril[44]
HS: Homo Sapiens.
Table 2. RD values describing the status of the hydrophobic core in titin with T/R and T/H as reference distributions respectively. Correlation coefficients have been calculated for each β-strand.
1TITRDCorrelation Coefficient
RD(R)RD(H)ρ(H,T)ρ(T,O)ρ(H,O)
DOMAIN0.3820.4720.6600.757
11–130.3020.5590.9650.8560.961
19–250.2980.5110.6330.8140.883
46–520.3250.2190.4660.6540.723
54–610.1250.1990.7780.9510.842
69–710.1940.2460.7320.9120.947
73–750.3770.9060.7120.9420.864
78–800.4000.6930.5430.7250.972
82–870.3060.5370.8000.7430.929
LOOPS0.4390.3320.4520.7500.705
Values listed in boldface indicate significant deviations from T (RD ≥ 0.5).
Table 3. RD (RD(R)) and RD (RD(H)) parameters calculated for the monomeric form of transthyretin. The three rightmost columns list correlation coefficients for H/T, T/O and H/O respectively.
1DVQRDCorrelation Coefficient
RD(R)RD(H)ρ(H,T)ρ(O,T)ρ(H,O)
MONOMER0.6500.328/0.3170.592/0.5910.687/0.687
11–190.658/0.6540.282/0.1890.433/0.9800.428/0.9910.851/0.991
23–250.531/0.4780.710/0.7090.934/0.9340.914/0.9140.195/0.161
28–360.458/0.4370.270/0.2180.703/0.7160.874/0.8750.803/0.801
40–490.349/0.3320.181/0.1440.247/−0.0010.760/0.4640.532/0.524
53–550.436/0.4370.300/0.2970.959/0.9840.522/0.6030.742/0.735
67–730.803/0.8110.317/0.223−0.038/0.062−0.295/−0.2660.894/0.916
74–81*0.564/0.5690.437/0.2880.013/0.0060.190/0.1890.914/0.915
87–960.637/0.6480.617/0.6240.070/0.0250.509/0.4580.745/0.740
104–1120.518/0.4830.581/0.5690.504/0.4940.633/0.6250.584/0.577
115–1230.513/0.4200.468/0.4290.211/0.2530.660/0.6840.555/0.551
* denotes a helix. The doubled values at each position represents chains A and B respectively (chain A/chain B). Values listed in boldface distinguish highly discordant β-strands—potential seeds for amyloidogenesis. The underlined values distinguish the fragments of highest predisposition to conformational changes.
Table 4. RD (RD(R)) and RD (RD(H)) parameters calculated for the dimeric form of transthyretin. The three rightmost columns list correlation coefficients for H/T, T/O and H/O, respectively.
1DVQRDCorrelation Coefficient
O vs. T and RO vs. T and HH/TT/OH/O
DIMER0.6500.2220.3660.722
MONOMER0.652/0.6480.328/0.2200.592/0.3800.687/0.720
11–190.440/0.4660.139/0.1500.593/0.5300.557/0.5320.852/0.849
23–250.081/0.0720.295/0.2720.824/0.8100.982/0.9770.914/0.915
28–360.467/0.4410.277/0.2580.471/0.5450.489/0.6020.874/0.876
40–490.517/0.4810.306/0.2730.714/0.6820.155/0.2600.533/0.522
53–550.435/0.4380.299/0.2970.936/0.9550.458/0.5020.742/0.735
67–730.760/0.7870.267/0.292−0.262/−0.240−0.549/−0.4750.898/0.920
74–81 *0.617/0.6240.493/0.500−0.134/−0.1560.080/0.0570.915/0.915
87–960.578/0.6460.560/0.581−0.014/−0.0640.033/−0.0250.951/0.952
104–1120.148/0.1020.184/0.1390.677/0.6520.911/0.9440.586/0.580
115–1230.854/0.6930.715/0.588−0.319/−0.3000.294/0.4210.284/0.279
* denotes a helix. The doubled values at each position represents chains A and B respectively (chain A/chain B).Values listed in boldface distinguish highly discordant β-strands—potential seeds for amyloidogenesis. The underlined values distinguish the fragments of highest predisposition to conformational changes.
Table 5. Status of the SufC-SufD complex and its individual chains, analyzed separately and as part of the complex.
FragmentRD(R)
Complex ABCD0.767
Chain AChain BChain CChain D **
In Complex0.7140.7580.7320.783
Individual Chains0.6460.6450.6030.608
No P-P0.6340.6430.587
N-terminal 8–1500.5230.540
C-terminal 370–4230.7390.706
N-terminal No P-P0.547
C-terminal No P-P0.6340.668
AmL0.7110.706
** Note that chain D has been truncated. “No P-P” expresses the status of the chain with residues engaged in P-P interaction eliminated from FOD calculations.
Table 6. N- and C-terminal fragments—RD values calculated for individual secondary folds in chains A and B respectively.
FragmentRD (RD(R))
Chain AChain B
N-Terminal
9–20 H0.3870.352
26–40 H0.4190.453
54–59 H0.4990.417
61–63 B0.1010.123
70–78 H0.6310.588
84–90 B0.4940.479
92–94 B0.5960.621
95–98 H0.3340.313
107–111 B0.2620.257
124–134 B0.6090.611
137–142 B0.8980.911
C–Terminal
368–378 H0.670 P-P0.644 P-P
381–399 H0.668 P-P0.625 P-P
403–417 H0.4110.423
Values listed in boldface diverge from the theoretical hydrophobicity density distribution model. “P-P” indicates the presence of an inter-chain interface within the specified fragment.
Table 7. Properties of the AmL section in chains A and B. Highlighted values diverge from the model. Only the initial β-strand remains consistent with theoretical values. RD parameters have been calculated with regard to two reference profiles—T (RD(R)) and H (RD(H)).
Fragm.Chain AChain B
RDCorr. coeff.RDCorr. coeff.
RD(R)RD(H)ρ(O,T)ρ(O,H)ρ(T,H)RD(R,T)RD(H,T)ρ(O,T)ρ(O,H)ρ(H,T)
AmL0.6450.2800.7100.1510.6440.2770.7050.147
151–1580.4580.6450.5050.8650.3380.4540.7080.5150.8860.387
166–1780.7730.752−0.1500.6860.0290.7830.750−0.2200.6440.029
181–1920.7290.6350.0910.7060.2290.7250.6530.1160.7250.230
196–2080.7210.761−0.0400.6200.1160.7370.763−0.1200.6020.207
211–2200.7840.622−0.2900.675−0.1200.7790.6120.2520.645−0.120
225–2360.8840.743−0.6500.615−0.2600.8840.740−0.7000.600−0.270
239–2480.9190.776−0.480.2660.1450.9260.751−0.4800.1010.153
251–2620.7020.821−0.0800.8330.0460.7020.815−0.1000.8330.027
266–2750.7190.6150.2460.5780.1650.7340.6170.2730.6000.182
280–2910.5700.4230.2250.8240.1330.5800.4200.2000.8280.125
295–3050.7030.558−0.2500.896−0.2100.6980.550−0.2100.898−0.200
309–3200.7710.8440.0550.8790.1670.7650.8270.0760.8730.172
326–3370.7320.720−0.1500.871−0.1100.7380.700−0.1200.828−0.110
342–3520.7470.462−0.7300.908−0.5900.7380.435−0.4100.870−0.390
355–3670.5700.3540.6580.7980.2870.5720.4280.5680.8040.318
LOOPs0.6890.1650.6990.1130.6860.3820.7620.037
Fragments for which the O/H correlation coefficient significantly exceeds its O/T and T/H counterparts are marked in boldface.
Table 8. Properties of the AmL section in chains A and B when calculated for both chains as a whole. Values listed in boldface distinguish positions supporting the amyloid-like conformation. Only the initial β-strand remains consistent with theoretical values. RD parameters have been calculated with regard to two reference profiles—T (RD(R)) and H (RD(H)).
Fragm.Chain AChain B
RDCorr. coeff.RDCorr. coeff.
RD(R)RD(H)ρ(O,T)ρ(O,H)ρ(T,H)RD(R,T)RD(H,T)ρ(O,T)ρ(O,H)ρ(H,T)
AmL0.7520.5640.1400.7240.0100.7190.5100.1230.7220.001
151–1580.3850.4850.6740.6530.0800.3400.5190.7050.7230.162
166–1780.6350.6350.0090.5480.2180.6360.622−0.1290.5110.199
181–1920.6550.5760.2420.7700.0620.6430.6070.2300.7810.090
196–2080.5970.6710.0780.6250.2040.6410.693−0.1410.6020.133
211–2200.7510.428−0.3870.617−0.2490.7470.425−0.3170.593−0.269
225–2360.7940.639−0.5410.467−0.0770.8050.646−0.6490.457−0.064
239–2480.8960.679−0.5880.0400.0570.8890.629−0.460−0.1300.012
251–2620.6650.847−0.3040.868−0.1560.6460.831−0.2510.866−0.123
266–2750.6950.5410.2210.5620.1870.6950.5160.1970.5680.190
280–2910.5720.4060.0160.7480.1930.5570.3820.0630.7600.196
295–3050.6290.463−0.2280.880−0.2420.6150.466−0.2140.887−0.248
309–3200.6270.7260.1520.8700.2640.6260.7090.1520.8620.238
326–3370.6710.688−0.1050.827−0.1770.7010.697−0.1880.792−0.238
342–3520.6110.379−0.3770.947−0.2360.6090.348−0.3200.954−0.244
355–3670.2850.1580.7820.6350.3310.3000.1950.7470.6520.297
LOOPs0.7520.5630.2920.7560.1070.7190.5100.2620.7620.114
Fragments for which the O/H correlation coefficient significantly exceeds its O/T and T/H counterparts are marked in boldface.
Table 9. Fragments identified as exhibiting hydrophobicity density profiles highly similar to the ones observed for AmL, which is treated as the reference (correlation coefficients in excess of 0.8).
2ZU01TIT1DVQ1B101XQ8
Fragm.RDFragm. Corr. coeff.Fragm. Corr. coeff.Fragm. Corr. coeff.Fragm. Corr. coeff.Fragm. Corr. coeff.
151–1580.378/0.47855–62 BB 0.86354–61 BL 0.854178–185 H 0.78646–53 0.854
166–1780.705/0.706
181–1920.699/0.62660–72 LB 0.86522–34 0.818
196–2080.604/0.677
211–2200.768/0.453
225–2360.793/0.639
239–2480.883/0.65123–32 BLB 0.812131–140 L 0.846 142–160 HL 0.7601–11 0.634
251–2620.666/0.847
266–2750.734/0.589
280–2910.535/0.370
295–3050.690/0.53073–83 H 0.869
309–3200.768/0.83861–72 LBB 0.877
326–3370.820/0.802
342–3520.764/0.42940–50 LB 0.87772–82 H 0.8573–13 0.931
355–3670.583/0.580
The RD column lists the status of each fragment in AmL, facilitating assessment of the potential amyloidogenic properties in target proteins (1TIT, 1DVQ, 1B10, 1XQ8); “BB”, “BL” and “H” indicate β-strands wholly contained by the target fragment, β-loop combinations and helices, respectively; The first row of values is italicized to distinguish its status as accordant with the idealized distribution. The numbers in bold distinguish the status of RD > 0.5 in AmL.
Table 10. Structural properties of β-sandwich domains in titin and transthyretin compared to the structure of β-sheets in AmL SufC-SufD.
ProteinLength [Å]No. of Residues in β-StrandAverage Number of Residues in Adjoining Loops (range)Inter-Strand Angle [deg]Inter-Sheet [Å]
1TIT32–356–85.8 (1–20)30–408.1–11.5
1DVQ20–267–106.7 (3–18)about 3011.5–13.6
2ZU044–4610–124.3 (3–8)about 107.5–7.9
1B10 **8–10 **
The “Length” column indicates the length of the β fold (in Å), which corresponds to the number of residues listed in the adjacent column. It is followed by the number of residues present in loops; The distance between parallel sheets is also given in Å; The rightmost column shows the angle at which β-structures propagate in adjacent sheets; The 1B10 molecule does not contain a β-sandwich. Values are listed only for fragments regarded as susceptible to amyloid transformation; ** distinguish the only protein 1B10 as the molecule where no β-structural fragment is taken as the potential fragment for amyloid transformation in contrast to all others present in this Table.
Table 11. Mean values of correlation coefficients for fibril forms. Correlation coefficients were calculated for β-strands in all chains present in the deposited structure.
Proteinρ(O,T)ρ(O,H)ρ(T,H)
2MPZ0.0040.8220.053
2MVX0.4420.7950.336
2MXU0.4730.8390.396

