1. Introduction
Online shopping has recently become a major part of people’s lifestyles. It allows people to directly buy or sell goods or services over the Internet by using a web browser. Additionally, it offers various methods for buying and selling goods or services. For example, on shopping websites such as Amazon.com and Tmall, sellers can list goods for sale only at a fixed price, whereas on other shopping websites such as eBay, Ruten, and Taobao, sellers can list goods for sale either at a fixed price or through an auction.
In online shopping, a consumer typically lacks the first-hand experience with both the merchandise and the seller that is expected in a physical store. To compensate for this, most online shopping websites employ a reputation system or a review system to collect users’ feedback regarding their shopping experience to assist potential buyers for selecting suitable merchandise and trustworthy sellers. For example, Amazon.com and Rakuten (
www.rakuten.co.jp) employ a unidirectional reputation system in which only buyers can rate both sellers and merchandise, but not
vice versa. By contrast, some shopping websites, such as eBay, Ruten (
www.ruten.com.tw), Taobao (
www.taobao.com), and Tmall (
www.tmall.com), use a bidirectional reputation system in which the buyer and the seller in a transaction can rate each other. The reputation system allots a high reputation score to users who have received many positive ratings and few or no negative ratings. Houser and Wooders [
1] indicated that seller reputation has an economically and statistically significant effect on the price of merchandise in an online auction. For example, a buyer is often willing to purchase the same merchandise at a higher price from a more reputable seller than from a less reputable seller. Therefore, maintaining a high reputation score is crucial for an online seller to attract sales and gain a price advantage.
Due to the lucrative opportunity associated with reputation scores, many fraudulent users attempt to tamper with the reputation system to obtain a high reputation score. Typically, a group of collusive users create fake transactions within the group for low-price merchandise and give each other positive ratings [
2]. Such a fraudulent scheme, referred as “inflated-reputation fraud” [
3], has become common, and can damage the trustworthiness of the reputation system if appropriate measures are not taken.
Numerous approaches have been proposed in the literature to detect inflated-reputation fraud [
3,
4,
5,
6,
7,
8,
9]. Most approaches build a social network of users based on their transaction history, in which nodes and links represent users and transactions, respectively. Social network analysis (SNA) is then applied to derive effective features for fraudster detection. Fraudsters improve their reputation scores by relying on collusive users creating many fake transactions and thus forming a cohesive group in the social network. Therefore, several studies have focused on detecting cohesive groups in social networks [
3,
4,
5,
6]. By contrast, a recent study [
7] suggested that the neighbors of a fraudster in a social network exhibit similar behavior leading to low neighbor diversity. Thus, the concept of neighbor diversity was proposed for fraudster detection. Although neighbor diversity has been shown to outperform previous approaches, it often falsely identifies legitimate users with considerably low neighbor diversity as fraudsters.
To improve the neighbor diversity approach, this paper proposes the concept of neighbor-driven attributes (NDAs) for fraudster detection. In brief, an NDA is an attribute of a node that is calculated using a user-selected feature of the neighbors of the node. We present several NDAs that are calculated as maximum or mean of neighbors’ feature values, based on features such as the
k-core, the number of received ratings, and the number of canceled transactions [
3,
5,
7]. The objective of this study is to extend the neighbor diversity to NDAs such that the shortcomings of the neighbor diversity are avoided and the performance of fraudster detection is improved. Experimental results on a real-world dataset show that these NDAs improve classification accuracy compared with state-of-the-art methods that use SNA features such as
k-core, center weight, and neighbor diversity.
The remainder of this paper is organized as follows:
Section 2 reviews SNA features for fraudster detection mentioned in the literature.
Section 3 proposes the concept of NDAs.
Section 4 describes the data collection process.
Section 5 presents the performance study and discusses the results. Finally,
Section 6 concludes the paper and provides directions for future studies.
2. SNA for Fraudster Detection
This section reviews essential SNA features that are particularly effective for fraudster detection in online auctions. However, not all fraudster detection approaches are SNA-based approaches. For example, user-level features such as the median, sum, mean, or standard deviation of the prices of merchandise that a user bought or sold within a certain period were used in [
8,
9]; transaction-related features (including price, frequency, comment, and connectedness in the transaction network) and user-level features (including reputation and age) were used in [
10]. For a brief review of recent fraudster detection approaches, please refer to [
7]. For surveys on online auction frauds in general, please refer to [
11,
12].
2.1. Construction of a Social Network
Before applying the SNA for fraudster detection, a social network of users must be created. One option is to use a transaction network, where each node represents a user and each link represents a transaction between a buyer and a seller. Another option is to use a rating network, where each node represents a user and each link represents a rating given by a user to another user after a transaction.
After a transaction on an auction website, such as eBay or Ruten, the buyer and the seller can give each other a positive, neutral, or negative rating to reflect their experience in the transaction. Thus, each link in the rating network has a corresponding link in the transaction network; however, because a user is not required to give a rating after a transaction, not all links in the transaction network have a corresponding link in the rating network.
In auction websites such as eBays, Taobao, Ruten and Yahoo!Kimo, the rating history used to construct the rating network is accessible to the public. However, the transaction history used to construct the transaction network is not available, unless with the permission of the auction websites [
10]. As a result, most previous studies used the rating network [
4,
5,
6,
13]. Since inflated-reputation fraud relies on the accumulation of positive ratings, this study also used the rating network.
2.2. SNA Features
As described in
Section 1, numerous SNA-based approaches for fraudster detection have focused on detecting cohesive groups in a social network [
3,
4,
5,
6]. In SNA, various measurements for cohesive groups are available, such as component, clique, community,
k-core, and
k-plex. Among them,
k-core is the most effective for fraudster detection because fraudsters tend to appear in
k-core subgraphs with
k = 2 [
4]. A
k-core of a graph
G is a maximal connected subgraph of
G in which all nodes have a degree of at least
k. A node may be present in several
k-core subgraphs, each with a different
k value. The maximum of these
k values is referred to as the
k-core value of the node. To calculate the
k-core value of each node in a graph, Batagelj and Zaversnik proposed an
O(
m)-time algorithm (
Figure 1), where
m is the number of links in the graph [
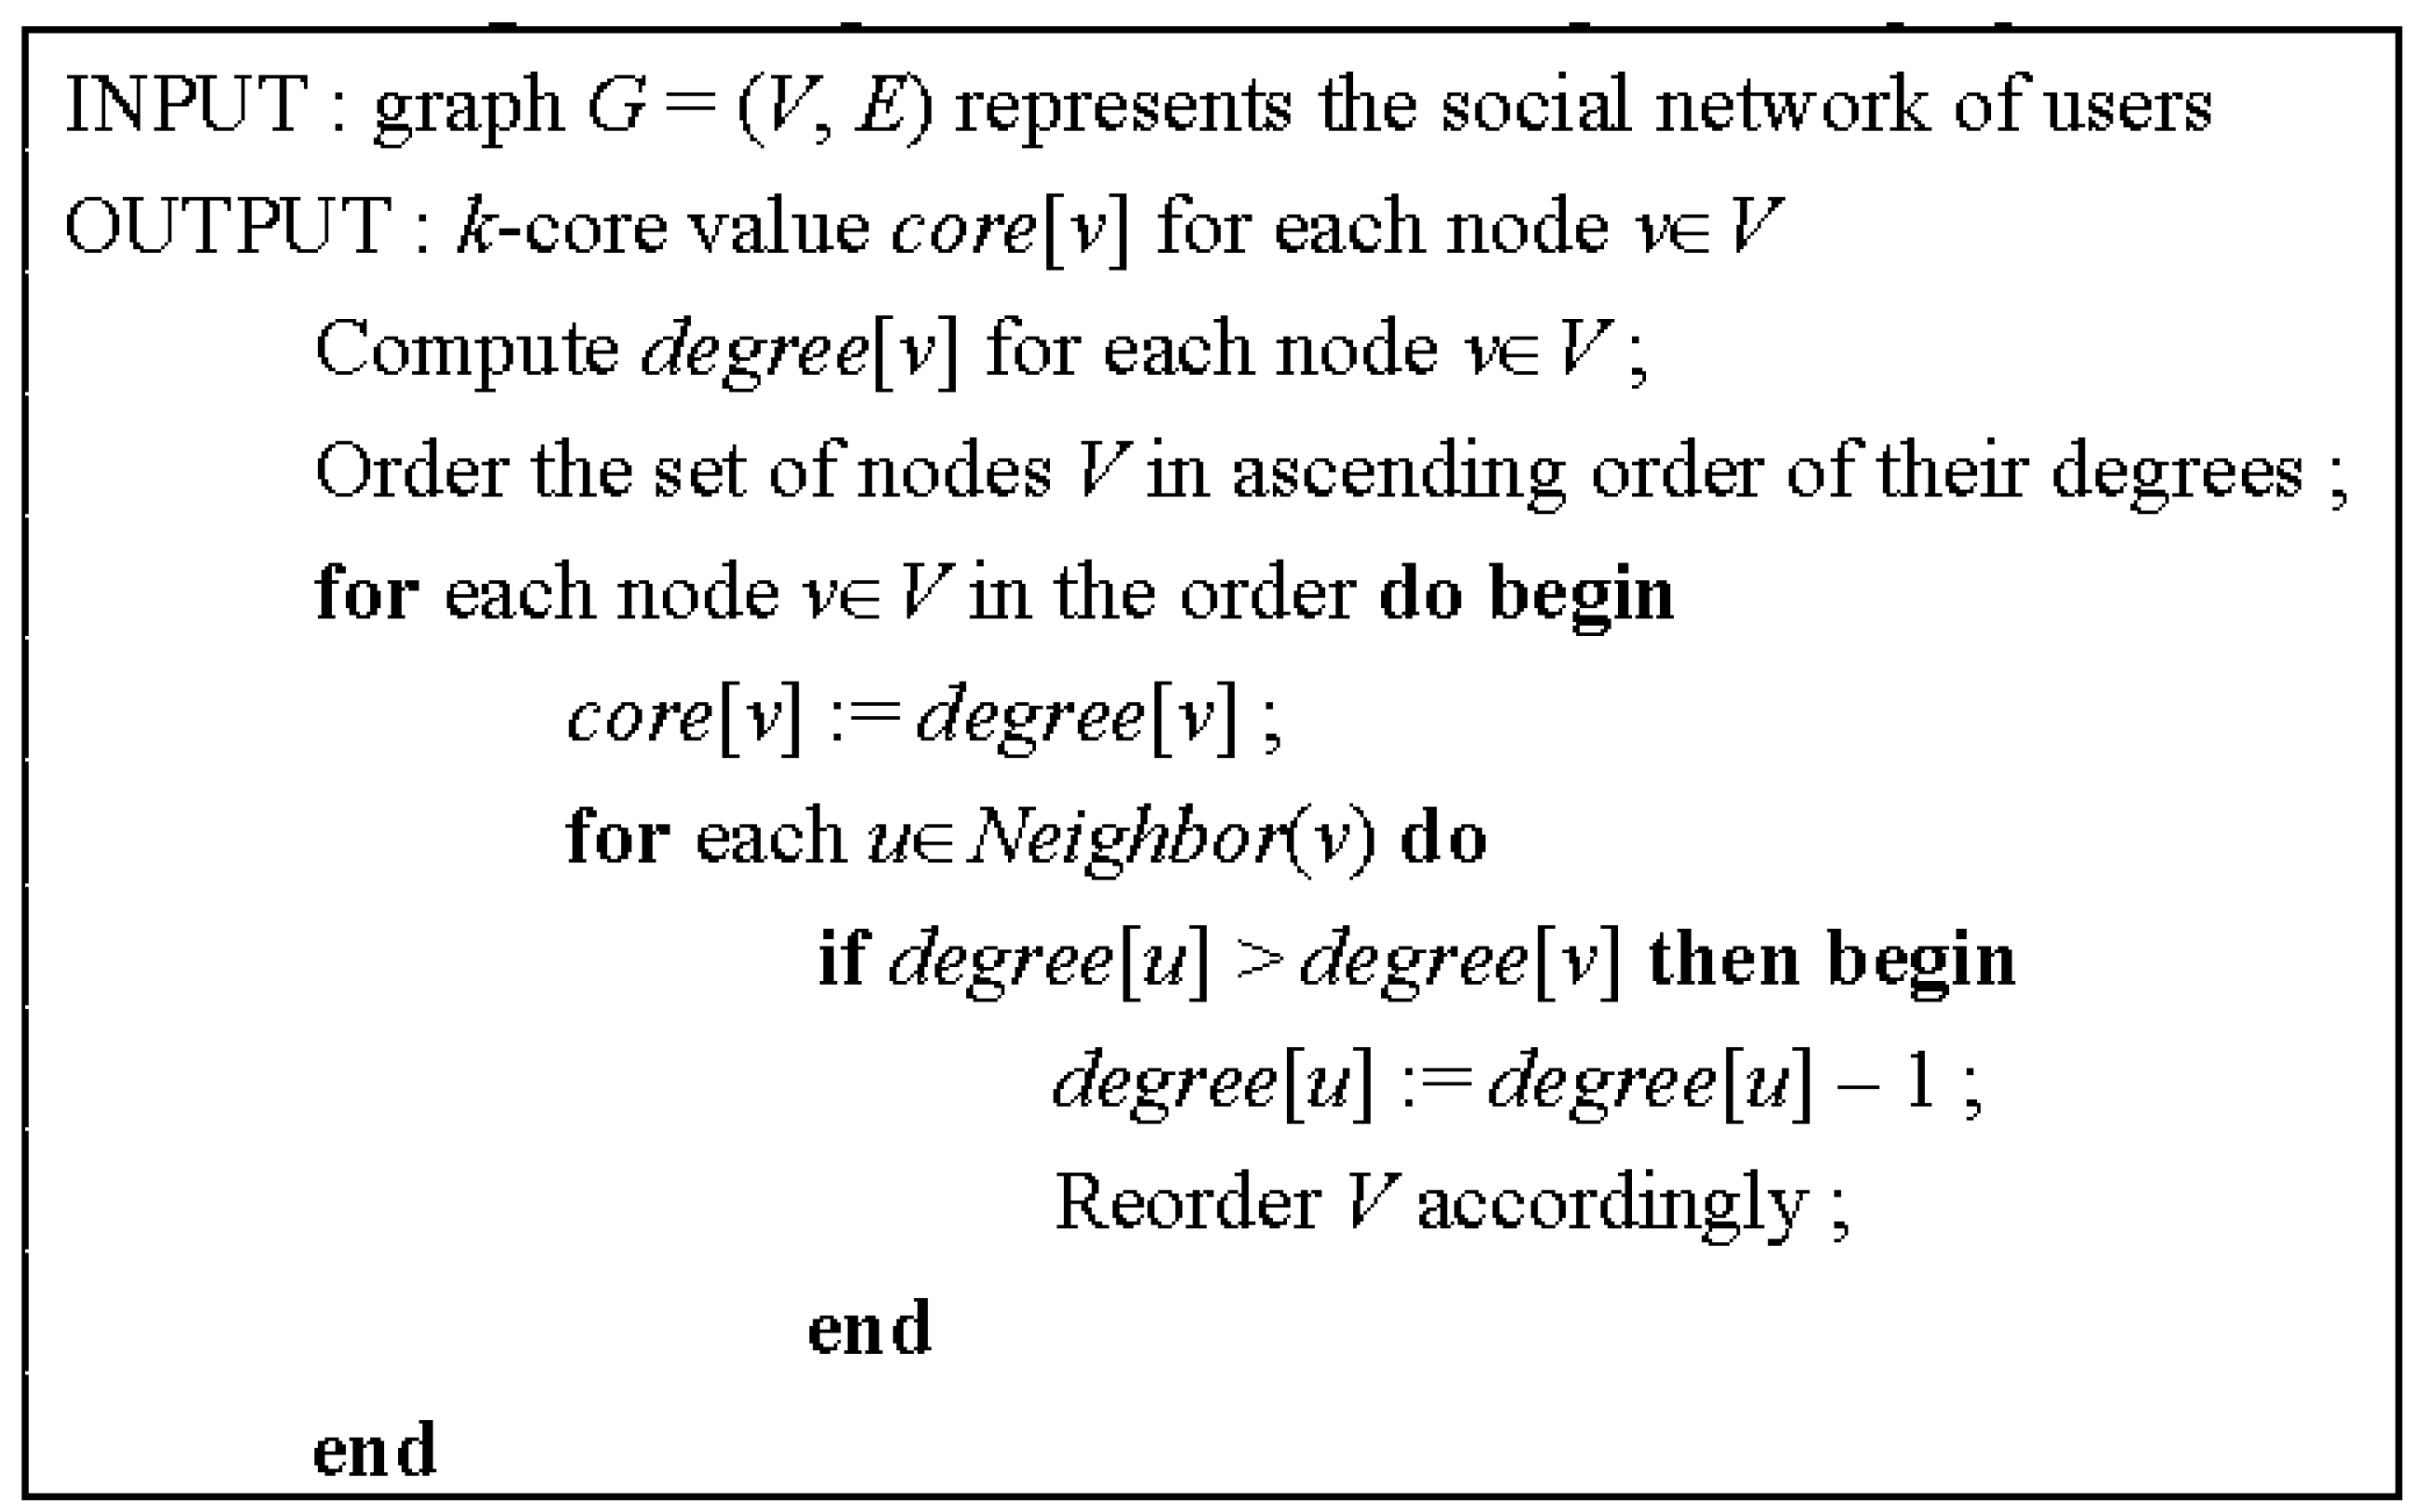
14]. The algorithm repeatedly prunes the least connected nodes and, thus, disentangles the hierarchical structure of the graph. Although
k-core is widely used for detecting fraudsters [
3,
4,
5,
6], it often results in low precision.
Figure 1.
Algorithm for calculating
k-core [
14].
Figure 1.
Algorithm for calculating
k-core [
14].
Wang and Chiu [
4] suggested using the “center weight” feature included in the SNA program Pajek [
15] to improve precision. A “robbery” algorithm (
Figure 2) was used to calculate the center weight of each node in a graph [
15]. Initially, the algorithm sets the center weight of each node as the degree of the node. The nodes with larger weights then repeatedly steal weights from adjacent nodes with smaller weights. Finally, only a small number of nodes have a center weight greater than zero, and all of the adjacent nodes have a center weight equal to zero. Essentially, nodes with non-zero center weight are the centers of the network and are classified as fraudsters. Although the center weight improves the precision of fraudster detection, it reduces the recall [
4].
Figure 2.
Robbery algorithm for calculating center weight.
Figure 2.
Robbery algorithm for calculating center weight.
Lin and Khomnotai [
7] suggested that the neighbors of fraudsters in social networks exhibit similar patterns because fraudsters need their collusive neighbors to give them positive ratings in the reputation system. Thus, the concept of neighbor diversity was proposed for fraudster detection, where nodes with low neighbor diversity are likely to be fraudsters. Before calculating neighbor diversity, a node’s feature (e.g., the number of received ratings, the number of canceled transactions, the
k-core value, and the join date) is selected. All nodes in the network are then divided into several groups, based on their values on the selected feature. Finally, the neighbor diversity on the selected feature of a node is calculated as the Shannon entropy [
16] of the group distribution of the node’s neighbors, as follows:
where
Dattr(
x) denotes the neighbor diversity on the selected feature
attr of the node
x,
n is the number of groups, and
pi(
x) is the number of
x’s neighbors in group
i divided by the number of
x’s neighbors. Although neighbor diversity has been shown to outperform the
k-core value and the center weight for fraudster detection [
7], it has three limitations. First, the use of neighbor diversity tends to misclassify nodes with few neighbors as fraudsters. For example, consider the extreme case of a user with only one neighbor. Since the user does not have many collusive neighbors with whom to engage in inflated-reputation fraud, the user is not likely to be a fraudster. However, the neighbor diversity of a one-neighbor user is minimal. Consequently, such users are falsely classified as fraudsters because of their low neighbor diversity. Second, if all neighboring nodes of a node
x belong to the same group (
i.e.,
n = 1 and
p1 = 1 in Equation (1)), then
x’s neighbor diversity also reaches the minimum regardless of the number of
x’s neighboring nodes. This observation suggests that neighbor diversity cannot distinguish between a node with only one neighboring node and a node with numerous neighboring nodes that belong to the same group. Third, the method used in this study to divide the nodes into groups based on a selected feature was
ad hoc, and requires adjustments for different features.
Some approaches defined their features in a recursive manner, similar to the Authority and Popularity scores in HITS and Google’s PageRank [
17]. Therefore, the values of these features were also calculated recursively. For example, Chau
et al. [
9] constructed a Markov Random Field (MRF) model from the transaction history among all traders, and applied the belief propagation algorithm to calculate the probabilities of fraudster, accomplice and normal user for each node. The same approach was also used in [
18] except that the observed values of the nodes in the MRF model were instantiated to a constant. Additionally, Bin and Faloutsos [
19] used the loopy belief propagation algorithm instead of the belief propagation algorithm to derive the features’ values.
3. Neighbor-Driven Attributes
Although the k-core value, center weight, and neighbor diversity all have limitations, the concept of neighbors is crucial in calculating these features. This motivates the idea of NDAs; in other words, deriving a new attribute of a node by using a feature of the node’s neighbors. For deriving an NDA, first, an existing feature of a node is selected. An NDA based on the selected feature of the node can then be defined as the mean or maximum of the feature values of the node’s neighbors. Unlike neighbor diversity, the neighbors are not required to be divided into groups according to the selected feature. This simplifies the calculation and avoids the ad hoc nature of neighbor diversity.
In this study, we chose one of the three features (
i.e., the
k-core value, number of received ratings, and number of canceled transactions) for calculating NDAs, because these three features have been shown to be related to inflated-reputation fraud in online auctions [
3,
5,
7]. Six NDAs were defined, as shown in
Table 1.
Our proposed method is to use each of these NDAs alone and in conjunction with the
k-core value, center weight, and neighbor diversity to build a classifier for fraudster detection. The algorithm used to construct a classifier is decision tree or support vector machine. The experimental results in
Section 5 show that the use of some of these NDAs significantly improves the classification accuracy for detecting fraudsters.
Table 1.
Neighbor-Driven Attributes.
Table 1.
Neighbor-Driven Attributes.
| NDA | Description |
|---|
| the mean of the k-core values of node x’s neighbors |
| the max of the k-core values of node x’s neighbors |
| the mean of the numbers of received ratings of node x’s neighbors |
| the max of the numbers of received ratings of node x’s neighbors |
| the mean of the numbers of canceled transactions of node x’s neighbors |
| the max of the numbers of canceled transactions of node x’s neighbors |
Notably, the idea of deriving features of a node from the node’s neighbors is not new. Neighbor diversity is an example. Features, such as
k-core and center weight, depend on all the nodes in a connected graph, not just the neighboring nodes. In comparison, they all are more complex than the NDAs in
Table 1 because the NDAs in
Table 1 only require a mean or max operation. However, the proposed NDAs can be viewed as a simple extension of an existing feature. For example,
and
in
Table 1 are the extensions of
k-core. The same process can be applied to other existing features to derive new NDAs. Furthermore, the choice of the aggregation function for an NDA is likely to be application-dependent. In this study, mean and max are chosen due to the intensive interaction between the members in a collusive group.
4. Datasets for Experiment
Ruten (
www.ruten.com.tw) is one of the largest auction websites in Taiwan, funded by eBay and PChome Online [
13]. In this performance study, we used a dataset collected from Ruten’s website. This dataset was also used in [
7] and was collected in a level-wise manner, as in [
4,
5,
6,
10,
13]. The data collection process started with 932 accounts (denoted as the first level accounts) that were posted in the suspended list by Ruten during July 2013. Then, it extended to the next level of accounts, including those accounts that had given ratings to or received ratings from the accounts on the first level. The same process was then repeated for the next level. Finally, the dataset, denoted as
Dall, contained 4407 accounts.
If an account in Dall was suspended by Ruten due to fraudulent behaviors (e.g., fake biddings, evaluation hype, selling counterfeit products, or fail to deliver product), then the account was classified as a fraudster; otherwise, the account was classified as a non-fraudster. As a result, the Dall dataset contained 1080 fraudsters and 3327 non-fraudsters.
To calculate the neighbor diversity and NDAs for each account in Dall, we needed to build a social network containing all the accounts in Dall and their neighboring accounts. Thus, we repeated the same data collection process to one more level down so that all neighbors of the accounts in Dall were identified. This step identified 233,169 new accounts. Finally, a social network with 237,576 nodes (i.e., 4407 accounts of Dall plus the 233,169 new accounts) and 348,259 undirected links was built, where each node represented an account, and each undirected link represented a positive rating from one account to another account. Notably, the social network was an undirected, unweighted graph, where duplicate links between any two nodes were removed. Furthermore, because our list of suspended accounts was collected during July 2013, the social network did not include those links for the ratings that occurred after 31 July, 2013.
For each node in the social network, the following features were first calculated: the
k-core value (
Figure 1), center weight (
Figure 2), the number of received ratings, and the number of canceled transactions. Then, the following features were calculated only for those nodes representing the 4407 accounts in
Dall: neighbor diversity on the number of received ratings [
7] and the six NDAs in
Table 1. Notably, we did not calculate the neighbor diversity and the NDAs for the 233,169 new accounts because the social network was only a part of the complete rating network and it did not include all neighbors of the 233,169 new accounts. The
Dall dataset with 4407 records and nine features (
i.e.,
k-core value, center weight, neighbor diversity on the number of received ratings, and six NDAs) was used for the experiment in
Section 5.
As described in
Section 2, using neighbor diversity often classifies a node with all of its neighboring nodes having similar numbers of received ratings as a fraudster. Misclassification could occur when the number of its neighboring nodes is small. To verify this statement, we constructed two sub-datasets,
Done and
Dmore, of
Dall for the experiment in
Section 5.2 and
Section 5.3. The
Done dataset contained those nodes whose neighboring nodes having similar numbers of received ratings, and the
Dmore dataset contained those nodes whose neighboring nodes having diverse numbers of received ratings. Specifically, this was achieved by first dividing all nodes into several groups based on their number of received ratings, where the first group contained nodes with a number of received ratings between 0 and 49, and the
ith group contained nodes with a number of received ratings between 25 × 2
i − 1 and 25 × 2
i, for
i > 1, as did in [
7]. Subsequently, the
Done dataset included those nodes whose neighboring nodes were all in the same group, and by Equation (1), those nodes had low neighbor diversity. The
Dmore dataset included those nodes whose neighboring nodes appeared in more than one group, and by Equation (1), those nodes had higher neighbor diversity than the nodes in
Done.
To check whether a classifier learned from one dataset could effectively apply to another unrelated dataset, we constructed two sub-datasets,
Dtrain and
Dtest, of
Dall for the experiment in
Section 5.4. Specifically, this was achieved by randomly dividing the social network into two disjoint subgraphs of approximately equal size, and then each subgraph corresponded to a sub-dataset. Notably, no link existed between an account in
Dtrain and an account in
Dtest. Thus, if a classifier learned from
Dtrain could detect the fraudsters in
Dtest with high accuracy, then the features and the classification algorithm used to construct the classifier were effective.
Table 2 summarizes the number of fraudsters and the number of non-fraudsters in these datasets.
Table 2.
Datasets.
| Dataset | # of Fraudsters | # of Non-Fraudsters | # of Accounts |
|---|
| Dall | 1080 | 3327 | 4407 |
| Done | 716 | 430 | 1146 |
| Dmore | 364 | 2897 | 3261 |
| Dtrain | 524 | 1681 | 2205 |
| Dtest | 556 | 1646 | 2202 |
5. Experimental Settings and Results
The experimental study contained four classification tests. In Tests 1–3, datasets Dall, Done, and Dmore were used to conduct 10-fold cross validation, respectively. In Test 4, dataset Dtrain was used to train a classifier, and then the classifier was used to detect the fraudsters in Dtest.
In each test, the following experiments were conducted. First, to study the effectiveness of the NDAs, we used only one NDA at a time as an input in a classification algorithm. Then, to compare the performance of the existing approaches with that of our approach, we used the following three attribute combinations as inputs in a classification algorithm:
Dr;
k-core and
CW;
k-core,
CW, and
Dr, where
Dr,
k-core, and
CW refer to the neighbor diversity on the number of received ratings [
7],
k-core value, and center weight [
4], respectively. Finally, we repeated the same experiment with the addition of an NDA to study how the NDA could help to improve the performance of the existing approaches.
Two classification algorithms (J48 decision tree and support vector machine (SVM)) from Weka [
20] were used in this study. Default parameter settings of both algorithms in Weka were adopted. Since previous work [
7] also used the same classification algorithms and parameter settings, our performance results reflected the impact of using the NDA as input to the classification algorithms.
5.1. Test 1: Dall Dataset
Table 3 shows the performance of using only one NDA to classify all accounts in the
Dall dataset. As shown in
Table 2, the
Dall dataset contained 3327 non-fraudsters in 4407 accounts and, thus, 75.5% (3327/4407 = 75.5%) was considered as the baseline for the classification accuracy. The two NDAs based on
k-core (
i.e.,
and
) underperformed in the experiment. Thus, for the rest of the experiment, we retained only the four NDAs (
i.e.,
,
,
, and
), the classification accuracy of which (
Table 3) was above 83%. Among them,
and
performed the most effectively. Boldface type indicates the best performance in each column of
Table 3,
Table 4,
Table 5,
Table 6,
Table 7,
Table 8,
Table 9,
Table 10,
Table 11,
Table 12,
Table 13,
Table 14,
Table 15,
Table 16,
Table 17 and
Table 18.
Table 3.
Performance of an NDA on the Dall dataset.
Table 3.
Performance of an NDA on the Dall dataset.
| NDA | J48 | SVM |
|---|
| Accuracy | Precision | Recall | F1 | Accuracy | Precision | Recall | F1 |
|---|
| 0.76197 | 0.2028 | 0.5381 | 0.2946 | 0.75402 | 0.0806 | 0.4888 | 0.1383 |
| 0.76900 | 0.3981 | 0.5388 | 0.4579 | 0.76378 | 0.3639 | 0.5261 | 0.4302 |
| 0.88223 | 0.8167 | 0.7332 | 0.7727 | 0.89448 | 0.8324 | 0.7599 | 0.7945 |
| 0.88314 | 0.8389 | 0.7265 | 0.7787 | 0.88835 | 0.7565 | 0.7811 | 0.7686 |
| 0.83140 | 0.6741 | 0.6506 | 0.6621 | 0.83662 | 0.7676 | 0.6387 | 0.6972 |
| 0.84343 | 0.8694 | 0.6310 | 0.7313 | 0.84887 | 0.8636 | 0.6393 | 0.7347 |
Table 4.
Performance of Dr with or without an NDA on the Dall dataset.
Table 4.
Performance of Dr with or without an NDA on the Dall dataset.
| NDA | J48 | SVM |
|---|
| Accuracy | Precision | Recall | F1 | Accuracy | Precision | Recall | F1 |
|---|
| w/o NDA | 0.84184 | 0.8019 | 0.6420 | 0.7131 | 0.83140 | 0.7306 | 0.6358 | 0.6799 |
| 0.88994 | 0.8593 | 0.7359 | 0.7928 | 0.89584 | 0.8333 | 0.7634 | 0.7968 |
| 0.89312 | 0.8741 | 0.7381 | 0.8003 | 0.89221 | 0.7741 | 0.7835 | 0.7788 |
| 0.87678 | 0.8343 | 0.7123 | 0.7684 | 0.87633 | 0.8333 | 0.7115 | 0.7676 |
| 0.87338 | 0.8611 | 0.6951 | 0.7692 | 0.86839 | 0.8565 | 0.6852 | 0.7613 |
Table 5.
Performance of k-core and CW with or without an NDA on the Dall dataset.
Table 5.
Performance of k-core and CW with or without an NDA on the Dall dataset.
| NDA | J48 | SVM |
|---|
| Accuracy | Precision | Recall | F1 | Accuracy | Precision | Recall | F1 |
|---|
| w/o NDA | 0.82981 | 0.5000 | 0.7200 | 0.5902 | 0.82936 | 0.4917 | 0.7234 | 0.5854 |
| 0.90537 | 0.8769 | 0.7693 | 0.8196 | 0.86748 | 0.6361 | 0.7825 | 0.7017 |
| 0.90764 | 0.8713 | 0.7783 | 0.8222 | 0.85749 | 0.5750 | 0.7861 | 0.6642 |
| 0.87020 | 0.8185 | 0.7016 | 0.7556 | 0.85772 | 0.7176 | 0.7065 | 0.7120 |
| 0.86566 | 0.7815 | 0.7033 | 0.7404 | 0.85455 | 0.6852 | 0.7109 | 0.6978 |
Table 6.
Performance of k-core, CW, and Dr with or without an NDA on the Dall dataset.
Table 6.
Performance of k-core, CW, and Dr with or without an NDA on the Dall dataset.
| NDA | J48 | SVM |
|---|
| Accuracy | Precision | Recall | F1 | Accuracy | Precision | Recall | F1 |
|---|
| w/o NDA | 0.85818 | 0.8731 | 0.6590 | 0.7511 | 0.84411 | 0.7685 | 0.6551 | 0.7073 |
| 0.90447 | 0.8843 | 0.7634 | 0.8194 | 0.87656 | 0.6750 | 0.7907 | 0.7283 |
| 0.90628 | 0.8676 | 0.7763 | 0.8194 | 0.86135 | 0.6028 | 0.7815 | 0.6806 |
| 0.88518 | 0.8213 | 0.7392 | 0.7781 | 0.87315 | 0.7880 | 0.7206 | 0.7528 |
| 0.87928 | 0.8407 | 0.7161 | 0.7734 | 0.87156 | 0.7472 | 0.7336 | 0.7404 |
Table 7.
Performance of an NDA on the Done dataset.
Table 7.
Performance of an NDA on the Done dataset.
| NDA | J48 | SVM |
|---|
| Accuracy | Precision | Recall | F1 | Accuracy | Precision | Recall | F1 |
|---|
| 0.76439 | 0.9204 | 0.7557 | 0.8300 | 0.76701 | 0.8911 | 0.7715 | 0.8270 |
| 0.78010 | 0.9302 | 0.7673 | 0.8409 | 0.77836 | 0.8953 | 0.7817 | 0.8346 |
Table 8.
Performance of Dr with or without an NDA on the Done dataset.
Table 8.
Performance of Dr with or without an NDA on the Done dataset.
| NDA | J48 | SVM |
|---|
| Accuracy | Precision | Recall | F1 | Accuracy | Precision | Recall | F1 |
|---|
| w/o NDA | 0.62478 | 1.0000 | 0.6248 | 0.7691 | 0.52530 | 0.6006 | 0.6250 | 0.6125 |
| 0.76439 | 0.9204 | 0.7557 | 0.8300 | 0.76701 | 0.8911 | 0.7715 | 0.8270 |
| 0.78010 | 0.9302 | 0.7673 | 0.8409 | 0.77836 | 0.8953 | 0.7817 | 0.8346 |
Table 9.
Performance of k-core and CW with or without an NDA on the Done dataset.
Table 9.
Performance of k-core and CW with or without an NDA on the Done dataset.
| NDA | J48 | SVM |
|---|
| Accuracy | Precision | Recall | F1 | Accuracy | Precision | Recall | F1 |
|---|
| w/o NDA | 0.63612 | 0.9888 | 0.6338 | 0.7725 | 0.63961 | 1.0000 | 0.6342 | 0.7762 |
| 0.78446 | 0.9441 | 0.7656 | 0.8455 | 0.76352 | 0.8659 | 0.7799 | 0.8206 |
| 0.79057 | 0.9441 | 0.7717 | 0.8492 | 0.76003 | 0.8534 | 0.7823 | 0.8163 |
Table 10.
Performance of k-core, CW, and Dr with or without an NDA on the Done dataset.
Table 10.
Performance of k-core, CW, and Dr with or without an NDA on the Done dataset.
| NDA | J48 | SVM |
|---|
| Accuracy | Precision | Recall | F1 | Accuracy | Precision | Recall | F1 |
|---|
| w/o NDA | 0.63612 | 0.9888 | 0.6338 | 0.7725 | 0.63961 | 1.0000 | 0.6342 | 0.7762 |
| 0.78446 | 0.9441 | 0.7656 | 0.8455 | 0.76352 | 0.8659 | 0.7799 | 0.8206 |
| 0.79057 | 0.9441 | 0.7717 | 0.8492 | 0.76003 | 0.8534 | 0.7823 | 0.8163 |
Table 11.
Performance of an NDA on the Dmore dataset.
Table 11.
Performance of an NDA on the Dmore dataset.
| NDA | J48 | SVM |
|---|
| Accuracy | Precision | Recall | F1 | Accuracy | Precision | Recall | F1 |
|---|
| 0.93529 | 0.7060 | 0.7119 | 0.7090 | 0.93345 | 0.6209 | 0.7410 | 0.6756 |
| 0.93958 | 0.8104 | 0.6974 | 0.7497 | 0.92763 | 0.4615 | 0.8077 | 0.5874 |
Table 12.
Performance of Dr with or without an NDA on the Dmore dataset.
Table 12.
Performance of Dr with or without an NDA on the Dmore dataset.
| NDA | J48 | SVM |
|---|
| Accuracy | Precision | Recall | F1 | Accuracy | Precision | Recall | F1 |
|---|
| w/o NDA | 0.91935 | 0.4258 | 0.7416 | 0.5410 | 0.90371 | 0.1978 | 0.7660 | 0.3144 |
| 0.93560 | 0.6896 | 0.7213 | 0.7051 | 0.93897 | 0.6538 | 0.7653 | 0.7052 |
| 0.93836 | 0.7363 | 0.7185 | 0.7273 | 0.92763 | 0.4780 | 0.7909 | 0.5959 |
Table 13.
Performance of k-core and CW with or without an NDA on the Dmore dataset.
Table 13.
Performance of k-core and CW with or without an NDA on the Dmore dataset.
| NDA | J48 | SVM |
|---|
| Accuracy | Precision | Recall | F1 | Accuracy | Precision | Recall | F1 |
|---|
| w/o NDA | 0.90616 | 0.4423 | 0.6098 | 0.5127 | 0.90585 | 0.3516 | 0.6432 | 0.4547 |
| 0.94694 | 0.7143 | 0.7903 | 0.7504 | 0.90493 | 0.1896 | 0.8214 | 0.3080 |
| 0.94694 | 0.7198 | 0.7868 | 0.7518 | 0.90647 | 0.1896 | 0.8734 | 0.3115 |
Table 14.
Performance of k-core, CW, and Dr with or without an NDA on the Dmore dataset.
Table 14.
Performance of k-core, CW, and Dr with or without an NDA on the Dmore dataset.
| NDA | J48 | SVM |
|---|
| Accuracy | Precision | Recall | F1 | Accuracy | Precision | Recall | F1 |
|---|
| w/o NDA | 0.93805 | 0.6236 | 0.7774 | 0.6921 | 0.92364 | 0.4368 | 0.7833 | 0.5608 |
| 0.94541 | 0.7198 | 0.7751 | 0.7464 | 0.90831 | 0.2280 | 0.8218 | 0.3570 |
| 0.94940 | 0.7390 | 0.7935 | 0.7653 | 0.90953 | 0.2143 | 0.8966 | 0.3459 |
Table 15.
Performance of an NDA on the Dtest dataset.
Table 15.
Performance of an NDA on the Dtest dataset.
| NDA | J48 | SVM |
|---|
| Accuracy | Precision | Recall | F1 | Accuracy | Precision | Recall | F1 |
|---|
| 0.87057 | 0.6890 | 0.8885 | 0.7761 | 0.86603 | 0.7017 | 0.8165 | 0.7548 |
| 0.84650 | 0.6373 | 0.9101 | 0.7496 | 0.86875 | 0.7314 | 0.7590 | 0.7449 |
Table 16.
Performance of Dr with or without an NDA on the Dtest dataset.
Table 16.
Performance of Dr with or without an NDA on the Dtest dataset.
| NDA | J48 | SVM |
|---|
| Accuracy | Precision | Recall | F1 | Accuracy | Precision | Recall | F1 |
|---|
| w/o NDA | 0.81426 | 0.6031 | 0.7734 | 0.6777 | 0.81062 | 0.5994 | 0.7536 | 0.6677 |
| 0.87284 | 0.7029 | 0.8597 | 0.7735 | 0.87238 | 0.7093 | 0.8381 | 0.7683 |
| 0.84650 | 0.6373 | 0.9101 | 0.7496 | 0.87284 | 0.7308 | 0.7860 | 0.7574 |
Table 17.
Performance of k-core and CW with or without an NDA on the Dtest dataset.
Table 17.
Performance of k-core and CW with or without an NDA on the Dtest dataset.
| NDA | J48 | SVM |
|---|
| Accuracy | Precision | Recall | F1 | Accuracy | Precision | Recall | F1 |
|---|
| w/o NDA | 0.78519 | 0.6640 | 0.3022 | 0.4153 | 0.78110 | 0.6595 | 0.2752 | 0.3883 |
| 0.84650 | 0.7011 | 0.6835 | 0.6922 | 0.81335 | 0.7526 | 0.3885 | 0.5125 |
| 0.83787 | 0.6562 | 0.7518 | 0.7008 | 0.80881 | 0.7273 | 0.3885 | 0.5064 |
Table 18.
Performance of k-core, CW, and Dr with or without an NDA on the Dtest dataset.
Table 18.
Performance of k-core, CW, and Dr with or without an NDA on the Dtest dataset.
| NDA | J48 | SVM |
|---|
| Accuracy | Precision | Recall | F1 | Accuracy | Precision | Recall | F1 |
|---|
| w/o NDA | 0.80426 | 0.6299 | 0.5450 | 0.5844 | 0.79518 | 0.7126 | 0.3165 | 0.4384 |
| 0.84650 | 0.7011 | 0.6835 | 0.6922 | 0.82288 | 0.7546 | 0.4424 | 0.5578 |
| 0.82515 | 0.6673 | 0.6133 | 0.6392 | 0.81244 | 0.7200 | 0.4209 | 0.5312 |
Table 4 shows the performance of using
Dr with or without an NDA. Compared with the use of only
Dr (Row 1 in
Table 4), the addition of
,
,
, or
invariably improved the accuracy, precision, and recall. Overall, the addition of
or
achieves the strongest improvement. In
Table 4,
Table 5,
Table 6,
Table 8,
Table 9,
Table 10,
Table 12,
Table 13,
Table 14,
Table 16,
Table 17 and
Table 18, italics show the performance values with an NDA that were lower than the corresponding values in Row 1 (
i.e., the case without any NDA).
Table 5 shows the performance of using
k-core and
CW with or without an NDA. Compared with the use of only
k-core and
CW (Row 1 in
Table 5), the addition of
or
improved the classification accuracy of J48 from 82.9816% to >90%, and the classification accuracy of SVM from 82.9362% to >85%. Thus, J48 was a more suitable algorithm for this problem than SVM. The addition of
or
often improved the accuracy and precision, but reduced the recall.
Table 6 shows the performance of using
k-core,
CW, and
Dr with or without an NDA. Compared with the use of only
k-core,
CW, and
Dr (Row 1 in
Table 6), the addition of
or
considerably improved the performance, and J48 achieved superior results than SVM did.
Overall, the existing approaches (
i.e., without NDAs) by using
Dr (Row 1 in
Table 4),
k-core and
CW (Row 1 in
Table 5), or
k-core,
CW and
Dr (Row 1 in
Table 6) all achieved a classification accuracy above 75.5% (the baseline for the
Dall dataset), indicating the effectiveness of these approaches. However, with the addition of NDAs (particularly
or
), the performance can be further improved.
5.2. Test 2: Done Dataset
According to the results in
Section 5.1,
and
achieved the best performance. Thus, for the rest of the performance study, we focused on these two NDAs. As shown in
Table 2, the
Done dataset contained 716 fraudsters in 1146 accounts, and thus, 62.5% (716/1146 = 62.5%) was considered as the baseline for the classification accuracy.
Table 7 shows the performance of using only one NDA. The accuracy of using
(
i.e., above 76%) or
(
i.e., above 77%) was significantly higher than the baseline performance of 62.5%.
The first row of
Table 8,
Table 9 and
Table 10 shows the performance of the existing approaches by using
Dr, or
k-core and
CW, or
k-core,
CW, and
Dr, respectively. Using these three combinations resulted in poor classification accuracy near the baseline value of 62.5%. The
Done dataset contained accounts for which the neighbors were from the same group (
Section 4), and the existing approaches that used
Dr, or
k-core and
CW, or
k-core,
CW, and
Dr were not effective on such datasets (
Section 2). However, with the addition of
or
, the performance was significantly improved (Rows 2 and 3 in
Table 8,
Table 9 and
Table 10). When using
or
alone (
Table 7), we observed that the classification accuracy exceeded 76% for
and 77% for
. When
or
was used with
Dr, or
k-core and
CW, or
k-core,
CW, and
Dr, the classification accuracy improved up to 79%, according to
Table 8,
Table 9 and
Table 10. Therefore, the addition of
or
was essential for detecting fraudsters in the
Done dataset.
5.3. Test 3: Dmore Dataset
The
Dmore dataset contained 2897 non-fraudsters in 3261 accounts (
Table 2) and, thus, 88.83% (2897/3261 = 88.83%) was considered the baseline for the classification accuracy.
Table 11 shows the performance of using
or
. By using
or
we achieved the classification accuracy of >92.7%, which was more satisfactory than the baseline value of 88.83%. However, for the
Dmore dataset, the improvement was not as significant as that observed for the
Done dataset, in which the classification accuracy improved from the baseline of 62.5% to >76% (
Table 7). Therefore,
and
performed more effectively in the
Done dataset than in the
Dmore dataset.
The first row of
Table 12,
Table 13 and
Table 14 shows the performance of the existing approaches by using
Dr, or
k-core and
CW, or
k-core,
CW, and
Dr, respectively. Using these three combinations achieved the classification accuracy to greater than 90%. Compared with the baseline value of 88.83% for the
Dmore dataset, the results indicate the effectiveness of the existing approaches on the
Dmore dataset. As described in
Section 4, the
Dmore dataset contained accounts where the neighbors were from various groups, whereas the
Done dataset contained accounts where the neighbors were from the same group. The existing approaches (
i.e., without using NDAs) performed more satisfactorily on the
Dmore dataset than on the
Done dataset. Finally, the addition of
or
can further improve the performance of the existing approaches (Rows 2 and 3 in
Table 12,
Table 13 and
Table 14) with J48 classifiers.
5.4. Test 4: Dtrain and Dtest Datasets
In Test 4,
Dtrain was used to train a classifier, and then the classifier was used to detect fraudsters in
Dtest.
Table 15,
Table 16,
Table 17 and
Table 18 show the performance results on
Dtest. The
Dtest dataset contained 1646 non-fraudsters in 2202 accounts (
Table 2), and thus, 74.75% (1646/2202 = 74.75%) was considered the baseline for the classification accuracy.
Table 15 shows the performance of using
or
. By using
or
, we achieved the classification accuracy of >84%, which was more satisfactory than the baseline value of 74.75%.
The first row of
Table 16,
Table 17 and
Table 18 shows the performance of the existing approaches by using
Dr, or
k-core and
CW, or
k-core,
CW, and
Dr, respectively. Using these three combinations achieved the classification accuracy to greater than 78%. However, with the addition of
or
, the performance can be further improved in accuracy, precision, recall, and
F1 (Rows 2 and 3 in
Table 16,
Table 17 and
Table 18). The results are consistent with the 10-fold cross validation results in Test 1 on the dataset
Dall.
Because
Dall was the union of its two disjoint subsets
Done and
Dmore, and
Dtest was a subset of
Dall, every account in
Dtest was in either
Done or
Dmore. Thus, we could study the performance results in
Table 16,
Table 17 and
Table 18 in more details by examining the classification accuracy on the two disjoint subsets of
Dtest:
Dtest ∩
Done and
Dtest ∩
Dmore.
Table 19 shows how the 2202 accounts of
Dtest were distributed in
Dtest ∩
Done and
Dtest ∩
Dmore.
Table 20 shows the percentage of correctly classified accounts in
Dtest ∩
Done or
Dtest ∩
Dmore. The addition of either
or
did not make a significant difference on the percentage of correctly classified accounts in
Dtest ∩
Dmore, but it did significantly improve the percentage of correctly classified accounts in
Dtest ∩
Done. The results are consistent with the 10-fold cross validation results in Tests 2 and 3.
Table 19.
Distribution of accounts in the Dtest dataset.
Table 19.
Distribution of accounts in the Dtest dataset.
| | # of Fraudsters | # of Non-Fraudsters | Total |
|---|
| Dtest ∩ Done | 364 | 260 | 624 |
| Dtest ∩ Dmore | 192 | 1386 | 1578 |
Table 20.
Percentage of correctly classified accounts in Dtest ∩ Done or Dtest ∩ Dmore.
Table 20.
Percentage of correctly classified accounts in Dtest ∩ Done or Dtest ∩ Dmore.
| Features Used to | J48 | SVM |
|---|
| Build a Classifier | Dtest ∩ Done | Dtest ∩ Dmore | Dtest ∩ Done | Dtest ∩ Dmore |
|---|
| Dr | 58.3333 | 90.5577 | 58.3333 | 90.0507 |
| Dr & | 73.3974 | 92.7757 | 76.4423 | 91.5082 |
| Dr & | 69.2308 | 90.7478 | 75.8013 | 91.8251 |
| k-core & CW | 52.7244 | 88.7199 | 52.8846 | 88.0862 |
| k-core & CW & | 70.3526 | 90.3042 | 63.1410 | 88.5298 |
| k-core & CW & | 66.6667 | 90.5577 | 62.8205 | 88.0228 |
| k-core & CW & Dr | 54.8077 | 90.5577 | 54.4872 | 89.4170 |
| k-core & CW & Dr & | 70.3526 | 90.3042 | 66.0256 | 88.7199 |
| k-core & CW & Dr & | 63.7821 | 89.9240 | 64.2628 | 87.9594 |
5.5. Discussion
There are four main findings in the above performance study. First, the existing approaches using
Dr, or
k-core and
CW, or
k-core,
CW, and
Dr performed well on the
Dmore dataset, but poorly on the
Done dataset (Row 1 of
Table 8,
Table 9,
Table 10,
Table 12,
Table 13 and
Table 14). As mentioned in
Section 4, the
Done dataset contained accounts where the neighbors were from the same group with a similar number of received ratings, and thus neighbor diversity of any account in the
Done dataset was minimal. This result showed the ineffectiveness of the existing approaches for accounts with low neighbor diversity.
Second, using
or
alone (
Table 3,
Table 7,
Table 11 and
Table 15) helped to achieve considerable improvement over the baseline performance on all four datasets,
Dall,
Done,
Dmore, and
Dtest. Thus,
or
has a high potential to improve the existing approaches.
Third, the addition of either
or
to the existing approaches improved the classification performance (
Table 4,
Table 5,
Table 6,
Table 8,
Table 9,
Table 10,
Table 12,
Table 13,
Table 14,
Table 16,
Table 17 and
Table 18). The Wilcoxon signed-rank test was used to compare the classification accuracy between the cases without using any NDA and the cases of adding either
or
. The results were in the expected direction and were significant (
Z = −4.172,
p < 0.005 for the addition of
, and
Z = −4.2,
p < 0.005 for the addition of
). The Wilcoxon signed rank test also shows that no significant difference on classification accuracy between the cases of adding
and the cases of adding
(
Z = −0.973,
p = 0.330). Specifically, the accuracy and recall were significantly improved, although the precision was occasionally reduced when using the SVM classifier. However, the J48 decision tree classifier, rather than the SVM classifier, seems more suitable for the problem of fraudster detection. Moreover, the decision tree classifier was adopted as the classification algorithm in previous studies [
5,
8,
21].
Fourth, according to
Table 3, using the NDAs based on the
k-core (
i.e.,
or
) did not achieve satisfactory results. Since the
k-core value of an account depends on the number of neighbors in the social network, it fails to capture the repeated ratings between two accounts. A possible remedy to this problem is to use a weighted graph for the social network where the weight of a link reflects the number of ratings between the two connected nodes. The algorithm for calculating the
k-core in
Figure 1 also needs to be adjusted to work in a weighted graph.
6. Conclusions
Most recent approaches use SNA to derive essential features (e.g.,
k-core, center weight, neighbor diversity) for distinguishing between fraudsters and normal users. In this study, we proposed the concept of NDAs, and found two NDAs (
i.e., the mean and the maximum of the number of received ratings of a user’s neighbors) that improved the performance of fraudster detection. Previous approaches performed poorly when users with low neighbor diversity were included (
Section 5.2). Our results suggested these two NDAs can help in such situations.
In this study, a user’s neighbors in both NDAs and neighbor diversity refer to immediate neighbors; in other words, those with whom the user directly interacts. However, it is possible to extend the same concept to indirect neighbors within a predefined distance. As the relationship between fraudsters and their collusive groups becomes sophisticated, it will be necessary to search beyond the immediate neighbors to reveal their network. The extension of NDAs and neighbor diversity warrants further study.
Three possible extensions to our data collection process are worthy of further investigation. First, the dataset for the experimental study was collected using breadth-first search. Since the number of the collected nodes grew rapidly in breadth-first search, we only proceeded to three levels. Other network sampling methods, such as depth-first search or random walk, can be applied to provide different aspects of the rating behavior in online auctions.
Second, because the dataset was crawled from Ruten’s website and not acquired directly from Ruten, its content is limited to what was on the website. Consequently, some important features related to fraudster detection (e.g., account creation time) are not available in our dataset. Extending the dataset to include those features could help unveil fraudsters’ activities.
Third, because the dataset was collected during July 2013, it only covers fraudsters’ activities during that period. Since fraudsters constantly change their fraudulent techniques, collecting datasets from different periods along the timeline will allow us to investigate how their fraudulent techniques evolve and validate the effectiveness of fraudster detection approaches.


