Article

Geometric Interpretation of Surface Tension Equilibrium in Superhydrophobic Systems

Department of Mechanical Engineering, University of Wisconsin-Milwaukee, 3200 N Cramer St, Milwaukee, WI 53211, USA
*
Author to whom correspondence should be addressed.
Entropy 2015, 17(7), 4684-4700; https://doi.org/10.3390/e17074684
Submission received: 18 June 2015 / Revised: 24 June 2015 / Accepted: 30 June 2015 / Published: 6 July 2015
(This article belongs to the Special Issue Geometry in Thermodynamics)

Abstract

:
Surface tension and surface energy are closely related, although not identical concepts. Surface tension is a generalized force; unlike a conventional mechanical force, it is not applied to any particular body or point. Using this notion, we suggest a simple geometric interpretation of the Young, Wenzel, Cassie, Antonoff and Girifalco–Good equations for the equilibrium during wetting. This approach extends the traditional concept of Neumann’s triangle. Substances are presented as points, while tensions are vectors connecting the points, and the equations and inequalities of wetting equilibrium obtain simple geometric meaning with the surface roughness effect interpreted as stretching of corresponding vectors; surface heterogeneity is their linear combination, and contact angle hysteresis is rotation. We discuss energy dissipation mechanisms during wetting due to contact angle hysteresis, the superhydrophobicity and the possible entropic nature of the surface tension.

1. Introduction

Surface tension is a fundamental concept in surface physics and chemistry, which appears quite simple. However, the concept is much more complex than it seems to a beginning student. The most common definition of surface tension is that it is force acting along a line of unit length parallel to the surface, but perpendicular to the line. The surface tension is often considered equivalent to the surface free energy, i.e., the energy needed to create a surface with unit area. Related to the surface tension is the concept of the surface stress, defined as the amount of reversible work per unit area needed to stretch the surface, which is identical to the surface free energy for the liquid to liquid and liquid to gas interfaces, but is different for the solid to liquid and solid to gas interfaces [1].
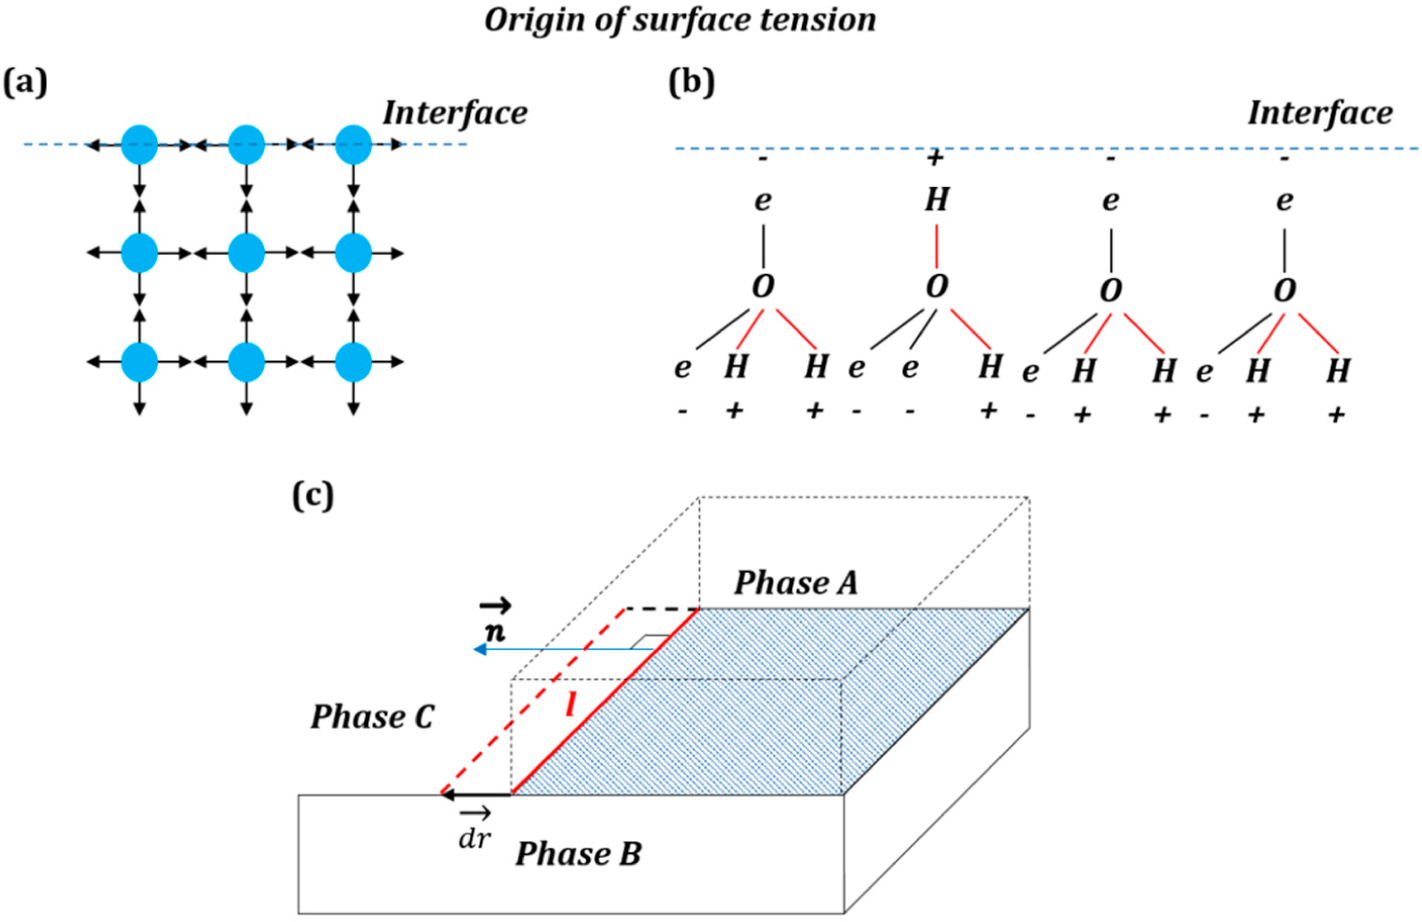
The simplest (and popular in textbooks) explanation of the origin of the surface free energy is that surface atoms and molecules have higher energy than those in the bulk due to lower amount of bonds with neighboring atoms and molecules (Figure 1a). An explanation of the origin of the interfacial energy is found in the popular textbook by Lautrup [2], who states that the binding energy per molecule may be estimated as the product of the specific heat of evaporation, h (evaporation enthalpy per unit of mass), and the mass of a single molecule. The surface tension is then obtained by multiplying the binding energy by the number of molecules in the surface layer, γ = h ρ l / 6, where ρ is the density and l is the molecular separation length. The factor 1/6 is due to the assumption of six bonds per molecule (one per each side). The formula overestimates water surface tension as γ = 0.129 Jm−2, while the true value is γ = 0.072 Jm−2.
The naive explanation of Figure 1a may be valid for non-polar molecules; however, the mechanisms leading to the surface energy can be much more complex in the case of polar molecules (e.g., water), involving reorientation of molecular networks in the surface layer and, thus, an entropic (rather than enthalpic) contribution to the surface energy (Figure 1b) [3].
An entropic force acts on the system in its entirety. The change of Gibbs free energy is given by ΔG = ΔHTΔS, where H, T and S are the enthalpy, temperature and entropy of the system. Water molecules form a regular “clathrate cage” around a hydrophobic non-polar (e.g., hydrocarbon) molecule, with an average number of hydrogen bonds in the cage larger than in the bulk volume. For an entropic force, such as the hydrophobic interaction between hydrophobic molecules in water, which prevents their dissolution, the decrease of the enthalpy ΔH due to the formation of new hydrogen bonds is smaller than the decrease of entropy TΔS due to the formation of a regularly-ordered structure around the hydrocarbon molecule, and thus, clathrate cages are energetically non-profitable, leading to the effective attraction of the hydrophobic molecules in water. It has been argued [3] that a similar entropic effect occurs at the water to air interface (where the water molecular network is more ordered than in the bulk), and it is responsible for the origin of the surface tension. Consequently, it is not possible often to demonstrate how the vector of the surface tension force results from the summation of the intermolecular forces, and the surface tension is thought of as a result of a complex interaction in the entire system, rather than a sum of forces in the surface layer.
It is noted, however, that unlike most entropic forces, the surface tension decreases with increasing temperature in accordance with the Eötvös rule [4]. As far as non-polar liquids are concerned, Bormashenko [5] argued that the surface tension of most organic liquids is governed by London dispersion forces.
Mechanical forces are vectors that are applied to bodies or material points. Unlike conventional mechanical forces, the tension forces are not applied to the three-phase line, which is a geometrical line and not a material object with mass, but rather constitute generalized forces or derivatives of the interfacial energies by the distance for which the three-phase line advances. These forces reflect the tendency of the system to reduce its energy (and increase entropy).
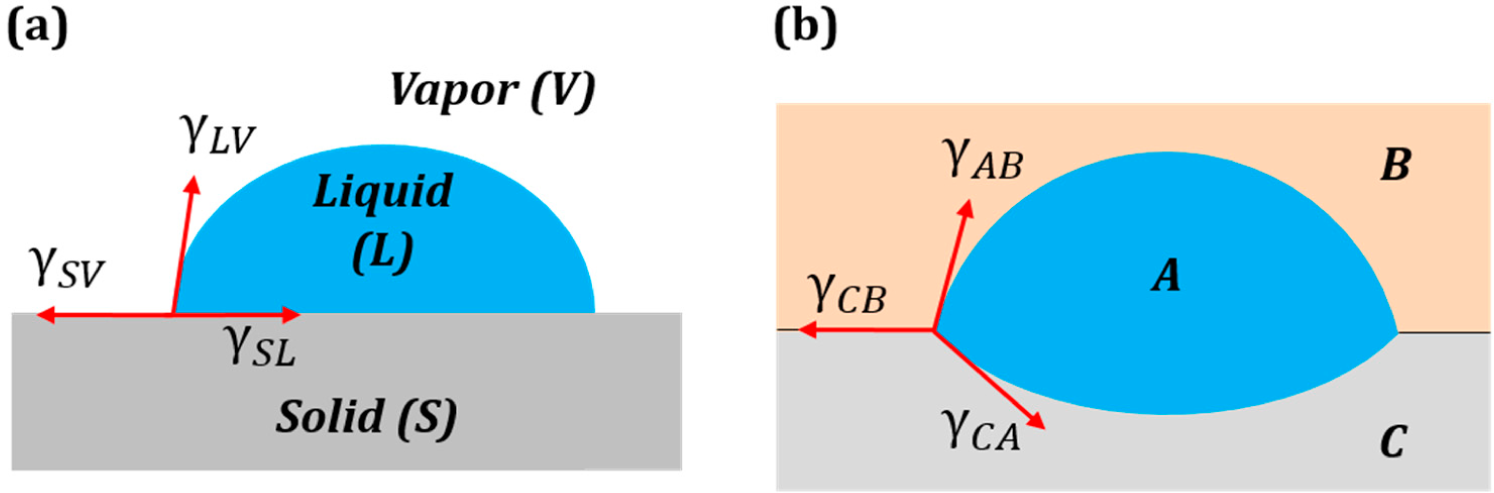
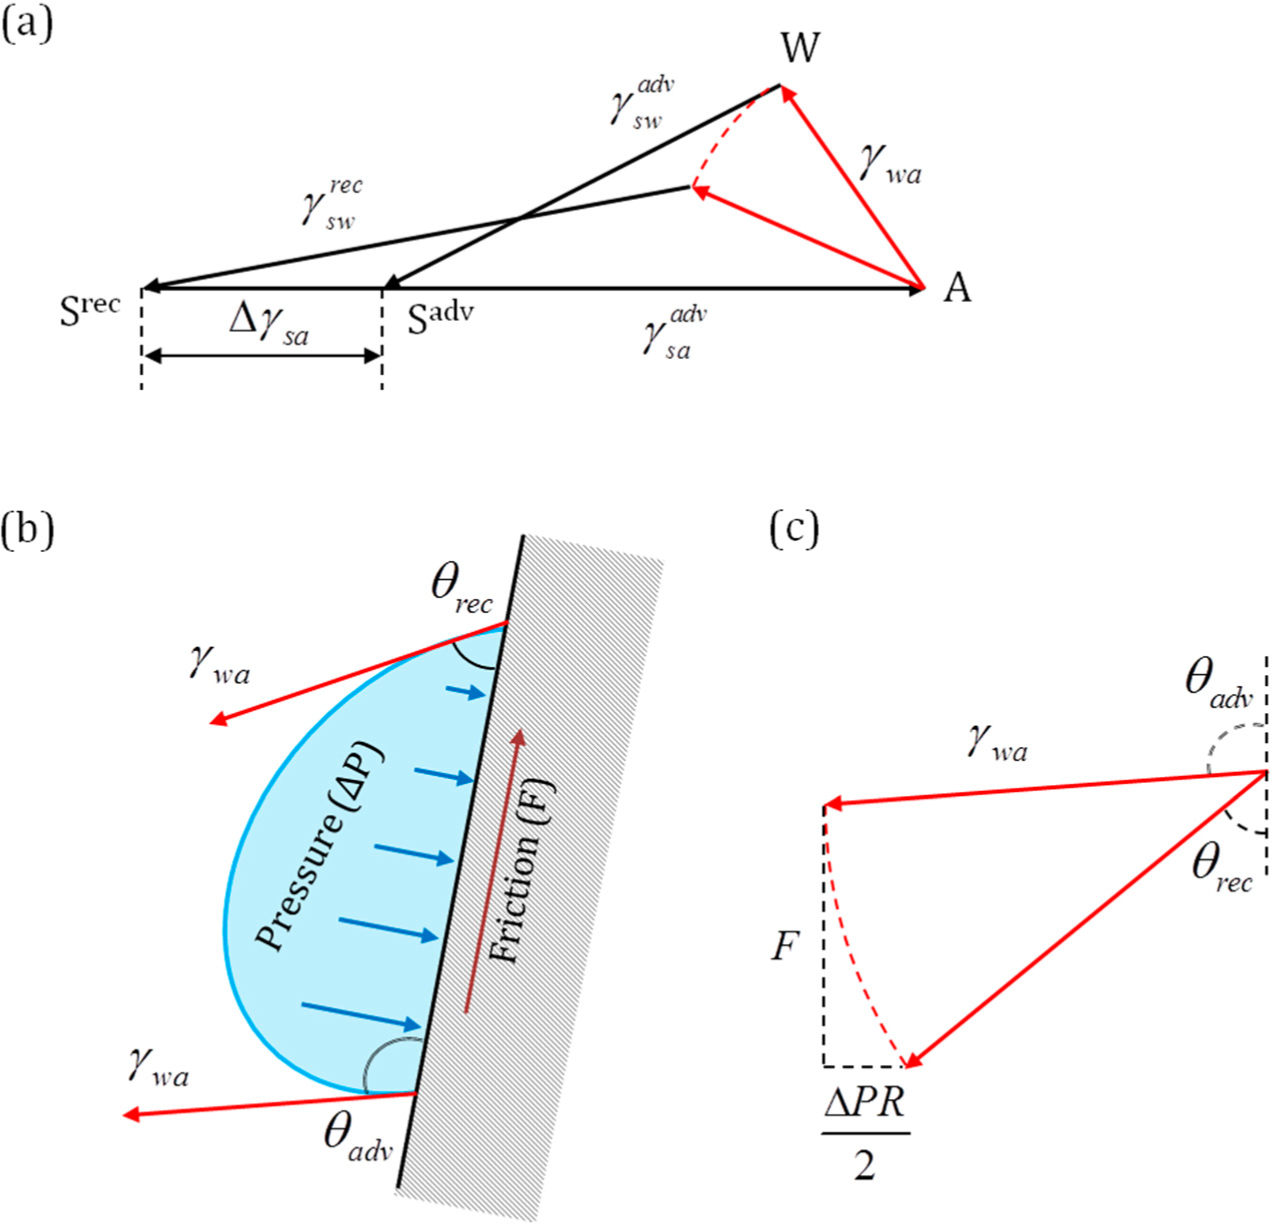
The high solid-vapor energy of an interface causes wetting of the solid surface and spreading of liquid on it (low θ), while low energy produces non-wetting interfaces (high θ). The surface tension force is assumed to be similar to the pressure in the sense that pressure P is a scalar, which, however, results in a vector force F = P A n when applied to an area A with the normal n . Similarly, the surface tension γ is a scalar that results in the force F = γ l n when applied to a line l with the normal n (the normal lies in the plane of the surface), (Figure 1c).
However, there is a significant difference between the pressure and surface tension due to the fact that the latter results in a concentrated force applied at a line. In mechanics, a concentrated force results in various types of singularities, e.g., infinite strains or accelerations. Thus, when Young’s law for the contact angle is derived, usually the considerations of the balance of three surface tension forces are employed. These forces are thought to be applied to the immaterial three-phase line, which is a geometric concept, rather than a material object with a finite mass.
Another important question in physical and colloidal chemistry is how to predict the value of the surface tension at the interface of two phases when tensions of each of these phases are known. Although in general, this may be an unsolvable task, since many forces of various natures are involved, there are two conflicting approaches that are often used. Antonow [6] suggested a simple rule based on the idea that the surface free energy is caused by broken molecular bonds at the surface. Therefore, when two substances of a similar nature (e.g., two immiscible liquids) come in contact, they partially compensate for the broken bonds. An alternative theory was developed by Girifalco and Good [7] on the basis of the assumption that dispersive forces act between the molecules of the substances. The topic has been extensively discussed in the literature and textbooks, although no single answer appropriate for all cases has been given.
In this paper, we suggest to view the surface tension as a generalized force and propose a geometric (vector) interpretation of various equations involving the surface tension at equilibrium (the Young, Wenzel, Cassie, Antonoff and Girifalco–Good equations). We also present some data on surface tension in multiphase systems.

2. Surface Tension, Surface Free Energy and Contact Angle

2.1. Young Equation

The concept of surface tension was introduced in 1805 by Thomas Young (1773–1829) and almost simultaneously by Pierre-Simon Laplace (1749–1827), while the idea of free surface energy was suggested by Josiah W. Gibbs (1839–1903) in about 1870. The accurate thermodynamic definition of the surface free energy involves a distinction between the concepts of the Gibbs free energy (the useful work obtainable from an isothermal isobaric thermodynamic system) and Helmholtz free energy (the useful work obtainable from a closed thermodynamic system).
Although the surface tension (measured in newton per meter, Nm−1) and interfacial energy (measured in joule per square meter, Jm−2) are often assumed to be identical, they are not exactly the same. The surface tension or, more exactly, the surface stress is the reversible work per unit area needed to elastically stretch a pre-existing surface. The surface stress tensor is defined as f i j = γ δ i j + γ / ε i j, where ε i j is the elastic strain tensor, γ is the surface energy and δ i j is the Kronecker delta. For a symmetric surface, the diagonal components of the surface stress can be calculated as f = γ + γ / ε. For liquids, the interfacial energy does not change when the surface is stretched; however, for solids, γ / ε is not zero, because the surface atomic structure of solids are modified in elastic deformation.
When a liquid droplet is placed on a smooth solid surface, the liquid forms a stable contact angle θ with the solid, which is related to the interfacial solid to liquid, solid to vapor and liquid to vapor tensions in accordance with the Young equation:
cos θ = γ S V γ S L γ L V
The theory of wetting represented by Equation (1) was formulated for the first time by Thomas Young in 1805 in his essay “On the Cohesion of Fluids” [8]. The essay does not contain the formula, but it establishes the contact angle as a parameter characterizing a combination of a solid and liquid, the three “forces” (interfacial tensions γSL, γSV and γLV) and contains a verbal description of Equation (1):
“…for each combination of a solid and a fluid, there is an appropriate angle of contact between the surfaces of the fluid, exposed to the air, and the solid…. We may therefore inquire into the conditions of equilibrium of the three forces acting on the angular particles, one in the direction of the surface of the fluid only, a second in that of the common surface of the solid and fluid, and the third in that of the exposed surface of the solid.” [8]
Even before Young, a concept similar to the surface tension was discussed by Galileo (1564–1642) in his Discourses about Two New Sciences (1638). Galileo states that “There is one great difficulty of which I have not been able to rid myself, namely, if there be no tenacity or coherence between the particles of water. How is it possible for those large drops of water to stand out in relief upon cabbage leaves without scattering or spreading out?” He suggests an experiment to investigate the capillary effect on water vs. wine. However, it is doubtful whether the experiment has ever been conducted [9]. It is remarkable that cabbage leaves were mentioned by Galileo, given the role of the plant leaves in the superhydrophobicity and, in particular, that of the cabbage leaves [10].
It has been argued [1] that the concept of the surface tension was introduced even before Galileo by Niccolò Cabeo (1586–1650) in his Philosophia Magnetica in 1629, and it was stated more explicitly by Johann Andreas Segner (1704–1777) in 1751, while the related phenomenon of the capillary rise had already been demonstrated by Leonardo da Vinci (1452–1519) and studied by Boyle, Leidenfrost and several other scholars [11]. However, the equilibrium of forces at the three-phase line was explained by Young [8] perhaps for the first time in the literature.
Note that Young’s equation implies only the equilibrium of the horizontal (parallel to the solid surface) components of the surface tension forces, γ L V cos θ = γ S V γ S L, whereas the vertical component γ L V cos θ remains unbalanced. It is however understood that this unbalanced component may result in the deformation of the substrate or even in the substrate’s dissolution under the droplet. The balance of forces on a liquid substrate (i.e., in a three-phase liquid system) is described by the so-called Neumann’s triangle of forces [12]/Figure 2a shows the surface tension forces on a solid substrate, while Figure 2b shows the equilibrium of surface tension forces in a three-liquid system.
A more important concern arises from the fact that while Young’s theory postulates the existence of the three surface tensions, γSL, γSV and γLV, it does not provide any tool to measure them as an observable quantity, since the only measurable parameter of Equation (1) is the contact angle. Furthermore, the nature of the surface tension has remained a matter of many arguments, including, in particular, how the surface tensions of different phases are related to each other and how these are related to the surface roughness and heterogeneity.

2.2. Antonow’s Equation

Perhaps the simplest theory explaining quantitatively the origin of the interfacial energy was suggested by George Antonow (Antonoff) in 1907 [6]. According to his model, which was intended to describe the tension at the interface between two liquids, the interfacial energy is caused by excess energy of the molecules or atoms at the interface due to the broken bonds. The atoms of the surface layer have on average fewer bonds with their neighbors; therefore, their energy is larger than that of the atoms’ or molecules’ in the bulk. When two liquid surfaces come into contact, the lack of neighboring bonds in the surface layer is partially compensated by the atoms or molecules in the opposite substance, with the total number of interactions defined by the substance providing the lower number of bonds of the two. Thus, the interfacial energy is proportional to the difference in the available bonds and, therefore, the difference between the higher and lower interfacial energies.
In accordance with the Antonoff’s rule, the surface tension at the interface between two saturated liquid layers in equilibrium, γab, is equal to the absolute value of the difference between the individual surface tensions of similar layers, γa and γb, when exposed to air:
γ a b = | γ a γ b |
Despite that, other authors note that Antonoff’s rule cannot always hold [13], and only an inequality γmax < γmed + γmin is valid where γmin < γmed < γmax are three interfacial tensions.
Antonoff claimed in 1942 that the validity of the rule “cannot be disputed, since it is a law of equilibrium, it is bound to be a precise law”; however, one should be careful in defining the surface tensions σa and σb [14]. According to Antonoff [14], the words “when exposed to air” were absent from his original definition of the rule [6], and this later addition by other scientist “places the whole principle in contradiction with the laws of thermodynamics.”

2.3. Girifalco and Good’s Equation

A different and more sophisticated theory of the origin of the interfacial energy in liquids has been suggested by Girifalco and Good (1957), who showed that when two media are in contact, the interfacial energy can be approximated as:
γ a b = γ a + γ b 2 Φ γ a γ b
While the exact value of Φ is a matter of calculations, it turns out to be on the order of the unity in most cases [7]. Furthermore, it was suggested that the contribution to the surface energy involves a polar component and a dispersion (van der Waals) component [15]. In the case when only dispersion forces are present, Φ 1 [3], and thus:
γ a b γ a + γ b 2 γ a γ b

2.4. Rough and Heterogeneous Surface

When the liquid droplet is placed on a solid surface that is rough or heterogeneous (i.e., consists of a combination of several components) the contact angle is given by the Wenzel and Cassie equations. The Wenzel equation [16], which was derived using the surface force balance and empirical considerations, relates the contact angle of a water droplet upon a rough solid surface, θ, with that upon a smooth surface, θ0 (Figure 3a), through the non-dimensional surface roughness factor, Rf, equal to the ratio of the surface area to its flat projection
cos θ = R f cos θ 0
R f = A S L A F
Essentially, the Wenzel equation deals with the effective surface energy per unit area.
In a similar manner, for a surface composed of two fractions, one of the fractional area f1 and the contact angle θ1 and the other with f2 and θ2, respectively (so that f1 + f2 = 1), the contact angle is given by the Cassie equation:
cos θ = f 1 cos θ 1 + f 2 cos θ 2
For the case of a composite interface (Figure 3b) consisting of the solid to liquid fraction (f1 = fSL, θ1 = θ0) and liquid to air fraction (f2 = 1 − fSL, cosθ2 = −1), Equation (7) yields the Cassie–Baxter equation [17]:
cos θ = ( 1 f L A ) cos θ 0 f L A
Two situations in the wetting of a rough surface should be distinguished: the homogeneous interface without any air pockets (sometimes called the Wenzel wetting state, since the contact angle is given by the Wenzel equation or Equation (5)) and the composite interface with air pockets trapped between the rough details (sometimes called the Cassie or Cassie–Baxter state, since the contact angle is given by Equation (8)).
Both Wenzel and Cassie states can result in large contact angles, leading to the superhydrophobicity, also referred to as the “Lotus effect”, because it was at first documented on the leaves of lotus and other self-cleaning plants.

2.5. Contact Angle Hysteresis

When contact occurs with a rough or chemically-heterogeneous surface (and practically, all surfaces are rough or heterogeneous to a certain extent), the contact angle can attain a range of values, demonstrating hysteresis: θrecθθadv, where θrec and θadv denote the receding and advancing contact angles, respectively. The contact angle can be measured also on a tilted surface (Figure 3c), although it is recognized that the values measured in this way do not always provide true values of the advancing and receding angles [18]. Contact angle hysteresis is small when the solid to liquid adhesion is small, and it is large when the adhesion is large. This makes contact angle hysteresis an important parameter characterizing adhesion, wetting and energy dissipation during the droplet flow.
When the concept of contact angle hysteresis was originally introduced, the phenomenon was associated with surface contaminants. This phenomenon was described in 1891 in a letter from a German scientist, Agness Pockels, who had no formal education and made observations on dishes in a kitchen sink. She observed that water droplets behaved differently on clean and contaminated glass surfaces. She wrote a letter to Lord Rayleigh, who published it in the journal Nature:
“The surface tension of a strongly contaminated water surface is variable; that is, it varies with the size of the surface. The minimum of the separating weight attained by diminishing the surface is to the maximum, according to my balance, in the ratio of 52:100. If the surface is further extended, after the maximum tension is attained, the separating weight remains constant, as with oil, spirits of wine, and other normal liquids. It begins, however, to diminish again, directly the partition is pushed back to the point of the scale at which the increase of tension ceased. The water surface can thus exist in two sharply contrasted conditions; the normal condition, in which the displacement of the partition makes no impression on the tension, and the anomalous condition, in which every increase or decrease alters the tension.” [19]
This phenomenon was later investigated by Adam and Jessop (1925), who wrote: “In the extreme cases, the angle when the liquid is advancing over the solid may be 60° greater than when it is receding. It is not necessary that there should be actual motion, for a force on the liquid tending to move it has the same effect. The phenomenon is obvious on inspection of a drop of water on slightly dirty glass plate; it appears to have been first described in detail by Pockels. The cause of this dragging effect (often called “hysteresis” of the angle of contact) seems to us to lie, not in any absorption of the liquid by the solid, but in a simple friction of the liquid on the surface.” [20]
Adam and Jessop [20] related contact angle hysteresis to the “friction force” per unit length of the three-phase line, F, acting on the droplet in its motion as γ L V ( cos θ a d v c o s θ r e c ) = F. Using similar models, Good [21], and Shepard and Bartell [22] investigated later the effect of surface roughness on contact angle hysteresis, which is similar to the effect of surface contamination or chemical heterogeneity.
The contact angle hysteresis is related to the more general phenomenon known as adhesion hysteresis, which is observed also during solid to solid contact. When two solid surfaces come in contact, the energy required to separate them is always greater than the energy gained by bringing them together, and thus, the loading-unloading cycle is a thermodynamically irreversible dissipative process. The energy gained for surfaces coming into contact is greater than the energy required for their separation (or the work of adhesion) by the quantity ΔW, which constitutes the adhesion hysteresis. For a smooth surface, the difference between the two values of the interface energy (measured during loading and unloading) is given by ΔW0. These two values are related to the advancing and receding contact angles of the smooth surface, assuming that for a smooth surface, the adhesion hysteresis is the main contributor into the contact angle hysteresis, plus a surface roughness term Hr [23]:
cos θ a d v cos θ r e c = Δ W 0 γ L V + H r
A number of other quantitative theories of contact angle hysteresis have been developed by scientists, including an important thermodynamic theory by Tadmor [24] involving the concept of line tension and used by several scientists [2528].

3. Graphical Interpretation of the Surface Tension at Equilibrium

As we have discussed above, the surface tensions at the three-phase line in equilibrium are not forces in the strictly mechanical sense of the word, because they are applied to an imaginary line rather than to a physical body. Instead, we suggest treating tensions as generalized forces, i.e., the derivative of surface energy by a generalized coordinate, such as the position of a three-phase line. In that case, there is no need to perceive surface tensions as applied to a particular object, but as vector quantities in general. It is known that both Young, Wenzel and Cassie equations can be derived from variational principles [29].
In this section, we suggest a geometric interpretation of the surface tension balance extending the well-known Neumann’s triangle approach. Phases are represented by points, while tensions are vectors connecting these points. The Young, Wenzel, Cassie, Antonoff and Girifalco–Good equations receive simple interpretations in this approach.

3.1. Three-Phase Systems

When a three-phase line propagates (Figure 1c) for a short distance d r , the change of free energy is given by the interfacial area γ times the scalar product of d r by the normal to the three-phase line, n , in the plane of the interface: d E = γ d r n . The surface tension vector as a generalized force is a vector given by a derivative:
d ( γ d r n ) d r = γ n
The only difference of this presentation from the standard one is that it is a generalized force, which is not a mechanical force, and thus, it is not applied to a particular point or a body.
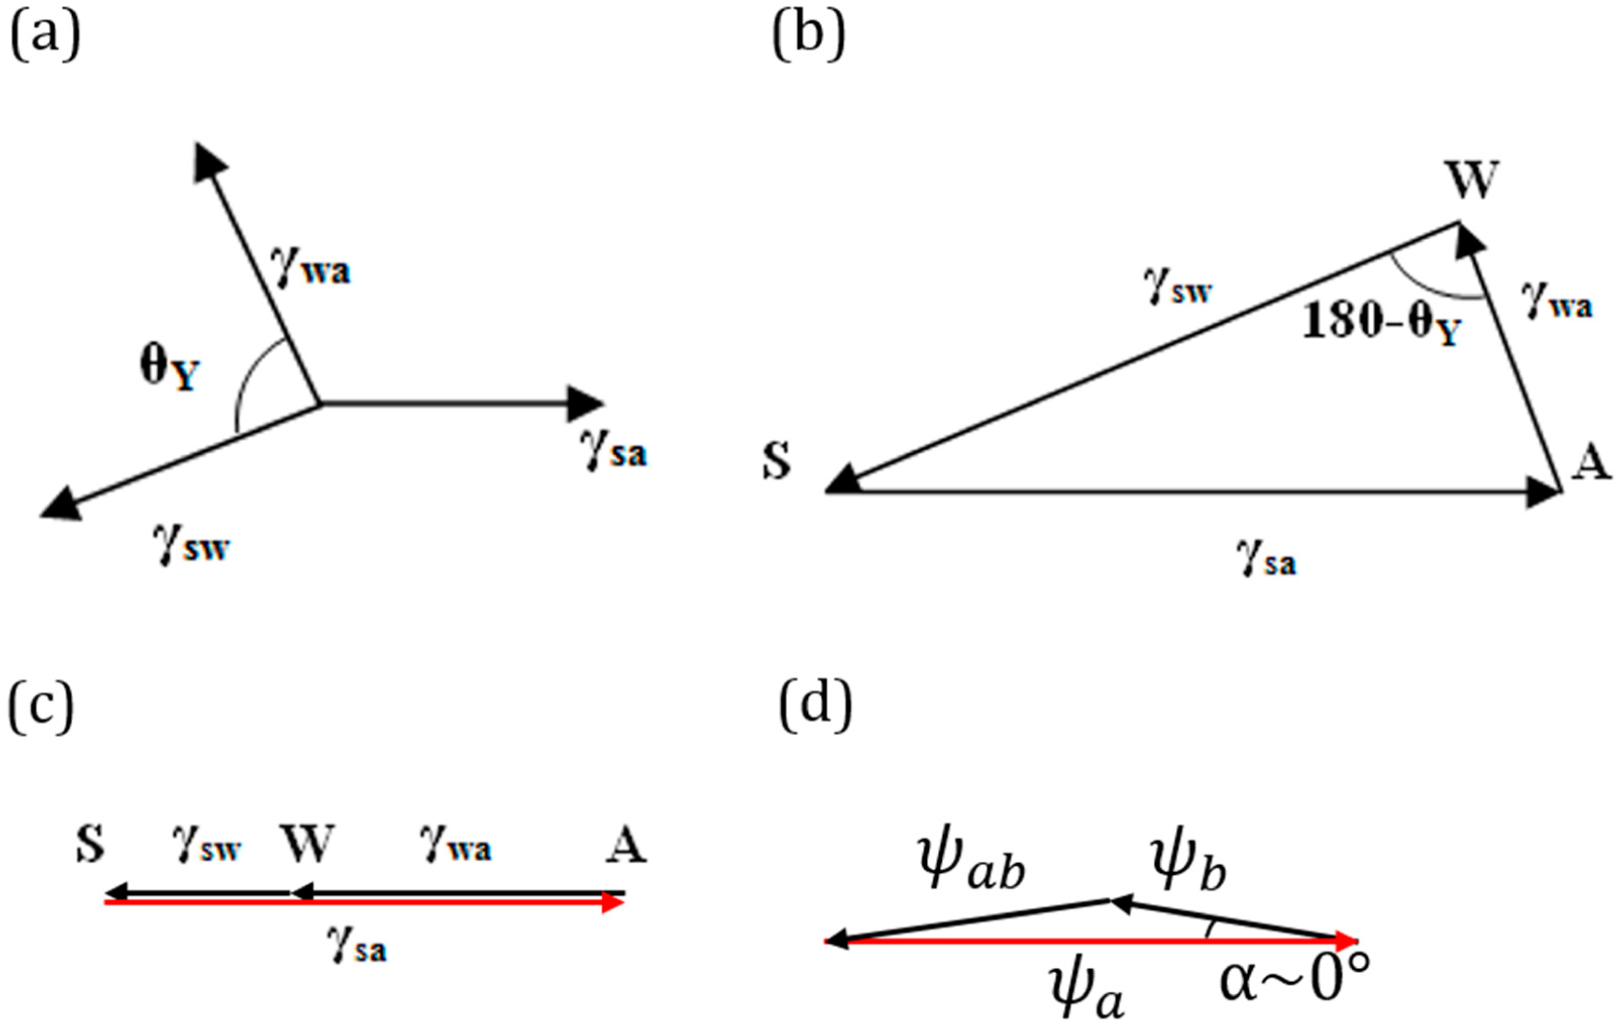
Consider a droplet of water placed on a solid surface in air. Let Points S, A and W denote the three phases solid, air and water, respectively. Let γsa, γwa and γsw denote the surface tensions for the solid to air, water to air and solid to water interfaces, respectively (Figure 4a.). The surface tensions can be represented as the sides of the triangle with Vertices S, A and W (Figure 4b). Mechanical equilibrium of the droplet requires that the vector sum of the surface tensions be zero, i.e., γ s a + γ w a + γ s w = 0.
If Antonoff’s rule (Equation (2)) were valid as an exact equality, γ a b = | γ a γ b |, then it would mean that the three vectors, γ a b , γ a and γ b , lie on the same line. Figure 4c shows such a case for the three-phase system SAW. Note that this corresponds to the case of complete wetting of the solid. However, if Antonoff’s rule constitutes an inequality, γmax < γmed + γmin, then the rule receives a clear geometric interpretation of the triangle inequality. The contact angle is a measure of the deviation from the equality of Equation (2).
Antonoff’s rule is intended for immiscible liquids; however, a similar approach can be used for estimates of the surface tension in solid to liquid to vapor systems in equilibrium. Thus, Lautrup [2] calculates the contact angle of water on ice at 0 °C using the above-mentioned estimate:
γ = h ρ l / 6
where h is the specific enthalpy of the phase transition, ρ is the density of the phase and l is the molecular separation length. For liquid water, the molar enthalpy of evaporation is hevap = 45.051 kJ/mol, whereas for ice, the molar enthalpy of melting is hmelt = 6.010 kJ/mol, and the molar enthalpy of sublimation hsubl = 51.059 kJ/mol. Notice that hsubl = hmelt + hevap as one would expect. Using the densities ρice = 916.72 kg m−3 and ρwater = 1000 kg m−3 at 0°C, Lautrup [2] finds γsa = 0.138 Jm−2, γsw = 0.016 Jm−2 and γwa = 0.129 Jm−2 yielding the value of the contact angle θ = 19° (while the experimentally measured value lies between 12° and 24°).
In accordance with our geometric interpretation, the above discussion by Lautrup means that the equality, hsubl = hmelt + hevap, when normalized by water and ice density, yields the triangle inequality, hsubl ρice < hmelt ρice + hevap ρwater, corresponding to the vector triangle γ s a + γ w a + γ s w = 0 in Figure 4b. This triangle inequality is satisfied only because the density of ice is lower than that of water at 0 °C, ρice < ρwater, which constitutes the famous “water anomaly.” Thus, the 19° contact angle of water on ice is a measure of the water anomaly. Without the water anomaly, a thin water film would completely cover the ice surface with zero contact angle. Additionally, this is indeed the case for most substances, whose liquid phase wets their solid phase with a thin film, rather than forming a droplet.
Interestingly, the effective interfacial energy between two liquids can also be negative, when a chemical reaction between two immiscible liquids creates surfactant molecules [30]. This means that the interfacial area would tend to increase spontaneously; thus, larger droplets would divide into smaller droplets. However, this corresponds to non-equilibrium situations.
As far as the geometric interpretation of the Girifalco and Good [7] equation (Equation (3)), γ a b = γ a + γ b 2 Φ γ a γ b, we note its striking similarity with the law of cosines, ( ψ a b ) 2 = ( ψ a ) 2 + ( ψ b ) 2 2 ψ a ψ b cos α, where ψ a b = γ a b , ψ a = γ a , ψ b = γ b and cos α = Φ. Thus, we interpret Equation (3) as the triangle inequality for ψ a, ψ b and ψ a b. Furthermore, in the important case of Φ =1 (or α = 0), which corresponds to only dispersion forces present (non-polar molecules), we obtain the equality ψ a b = ψ a + ψ b (Figure 4d). While the physical interpretation of this equality is beyond the scope of this paper, we note that for adhesion energy caused by an electrostatic field, the total energy is proportional to the squares of the electric field intensities, and thus, the equality γ a b = γ a + γ b could correspond to a simple summation of electric fields of different phases. The value of the angle α is a quantitative characteristic of the deviation from the pure dispersion force interaction.

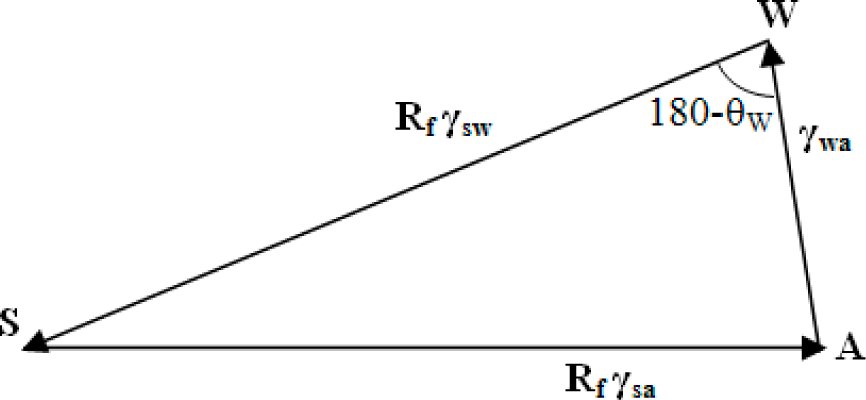
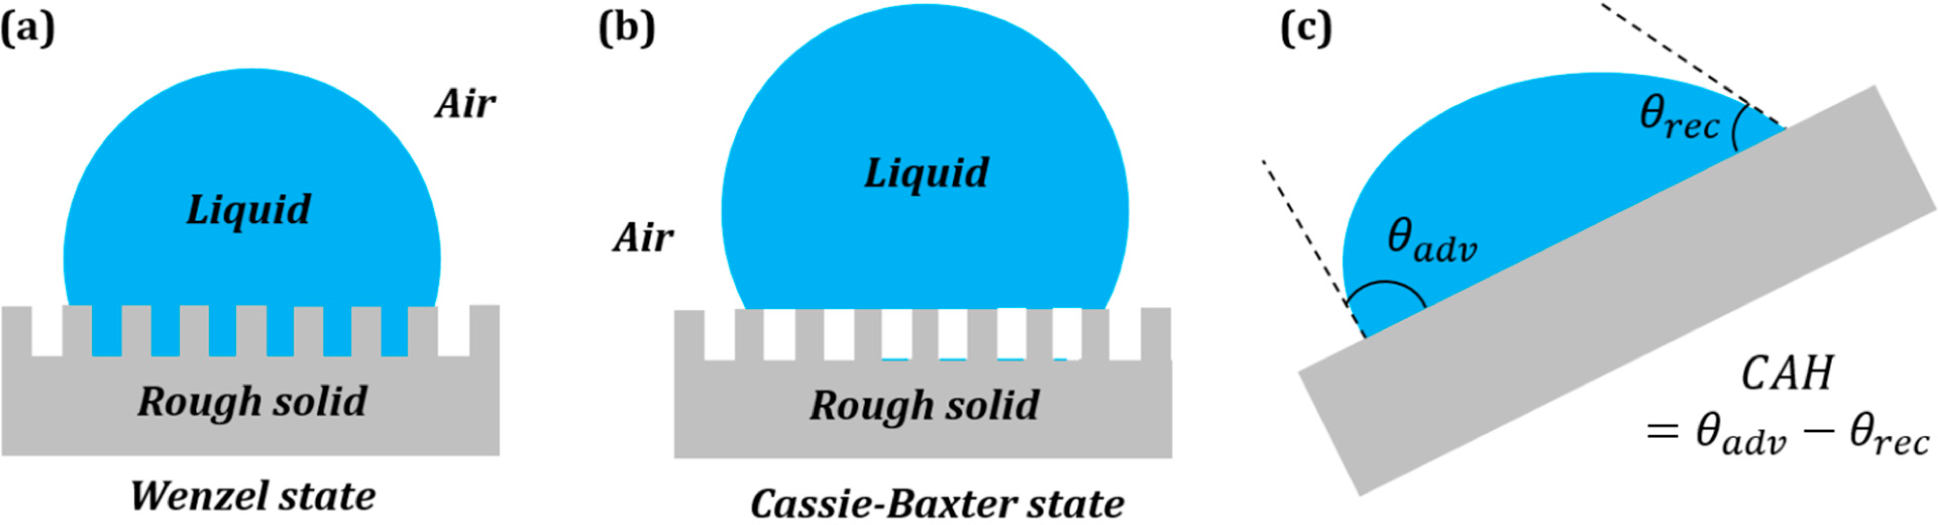
3.2. Wenzel and Cassie States in the Three-Phase System

Surface roughness is known to affect the measured value of the contact angle. The two extreme cases of a droplet on a rough surface are described by the Wenzel state and the Cassie–Baxter state. In the Wenzel state, a homogenous interface is formed between the droplet and the solid. The contact angle for the Wenzel state is given by Equation (5). Neumann’s vector triangle is shown in Figure 5. The water to air interface remains unaffected by the roughness, and hence, its surface tension remains the same. The roughness effectively changes the solid to water and solid to air surface tensions by a factor Rf.
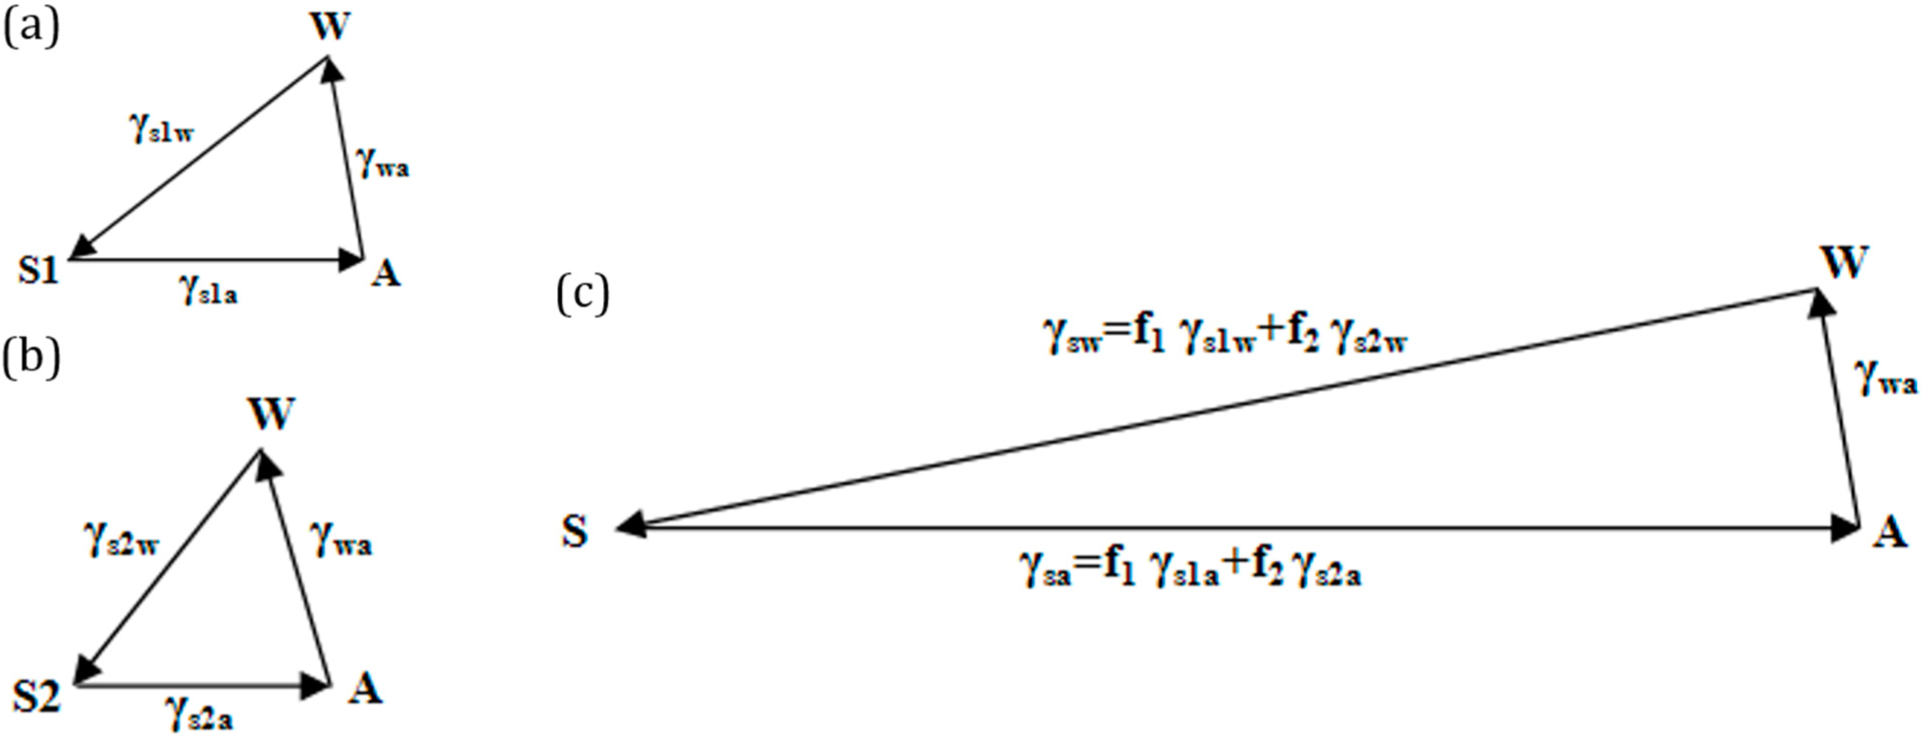
If the solid surface is non-homogenous, i.e., it consists of two different materials S1 and S2, with area fractions f1 and f2, then the apparent contact angle given by the Cassie–Baxter equation (Equation (7)) can be written as:
cos θ C B = f 1 ( γ s 1 a γ s 1 w ) γ w a + f 2 ( γ s 2 a γ s 2 w ) γ w a
This is equivalent to writing cos θ C B = γ s a γ s w γ w a, where γ s a = f 1 γ s 1 a + f 2 γ s 2 a and γ s w = f 1 γ s 1 w + f 2 γ s 2 w . The surface tensions can be once again represented by the sides of a vector triangle (Figure 6). If we consider S2 as air, then the equation reduces to cos θ C B = f 1 ( γ s 1 a γ s 1 w ) γ w a f 2.
We interpret the effect of surface roughness as stretching the vectors γ s w and γ s a in the Neumann’s triangle in Figure 5 by a factor equal to the Wenzel roughness factor. We interpret the effect of surface heterogeneity as a linear combination of vectors γ s 1 w , γ s 1 a and γ s 2 w , γ s 2 a , which correspond to two components of the interface, with the weight factors of f1 and f2.

3.3. Contact Angle Hysteresis

The contact angle hysteresis is due to the chemical and physical nature of the surface. The solid to water and solid to air interfacial tensions were seen to vary with the roughness of the solid surface. A similar approach to the contact angle hysteresis leads to the vector triangle, as shown in Figure 7a. The change in the solid to air interfacial tension can be obtained as Δ γ s a = γ s a r e c γ s a a d v . Similarly, the change in the solid to water interfacial tension is Δ γ s w = γ s w r e c γ s w a d v . It is visible from the triangle that a range of contact angles is possible under a constraint that γ w a remains constant in magnitude.
We interpret contact angle hysteresis Δ θ = θ a d v θ r e c as the rotation of the vector γ w a in Figure 7a. In addition, dealing with contact angle hysteresis, we have two different identities (Figure 7b,c): one is for cosines of the advancing and receding contact angles due to the force balance in the tangential plane:
cos θ a d v cos θ r e c = F / γ w a
where F is the “friction force” per unit length, as was discussed above [3133].
The other identity is for the sines due to the balance of the normal forces. This is because, besides the normal component of the surface tension at the triple line, γ w a sin θ, the droplet also generates Laplace pressure at the solid-liquid contact area, and the one should be balanced by the other [34]. Thus, for a droplet of radius R on a tilted surface with the hydrostatic pressure difference ΔP, one has:
sin θ a d v sin θ r e c = Δ P R 2 γ w a
Combining Equations (13) and (14) and using standard trigonometric identities sin x sin y = 2 cos x + y 2 sin x y 2 and cos x cos y = 2 sin x + y 2 sin x y 2 immediately yields for the average of the advancing and receding angles:
cot θ a d v + θ r e c 2 = Δ P R 2 F
Furthermore, assuming that Δ θ = θ a d v θ r e c is small, we obtain the relationship between the excess pressure and change in the contact angle as [34]:
Δ θ = Δ P R γ s a γ s l
The rotation of the vector γ w a in Figure 7a is then interpreted as a hydrostatic pressure change along the solid-liquid interface (since the interface is not horizontal).

3.4. Four Phase Systems

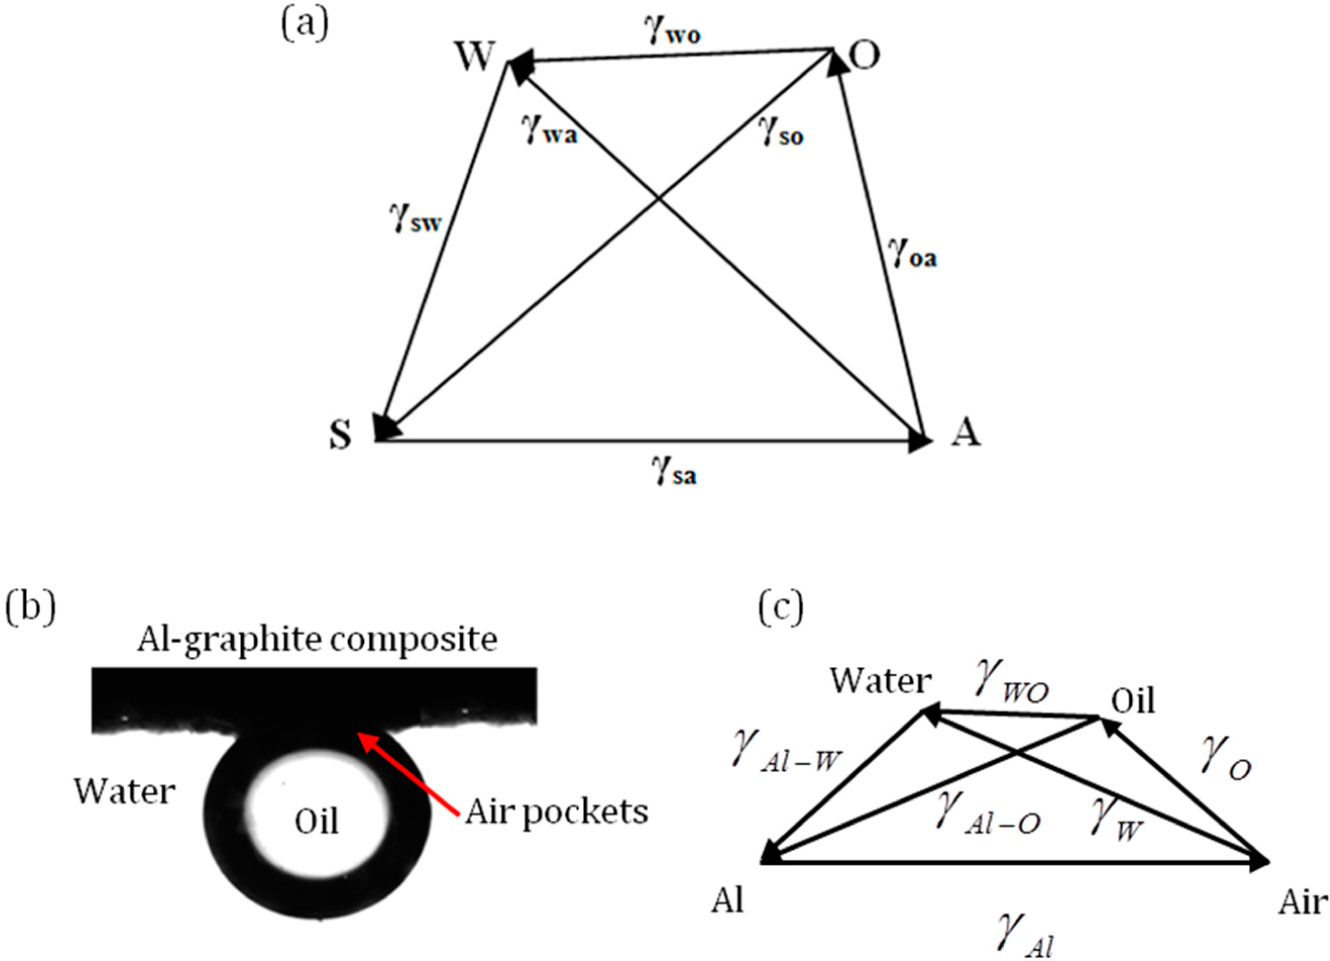
Consider four phases, namely solid (S), water (W), oil (O) and air (A). The three-phase systems SWO, WOA, SWA and SWA can be represented by four triangles, as discussed above. If the four phases exists in mechanical equilibrium, the pyramid (or tetrahedron) SAOW with the vectors representing the interfacial tensions can be drawn as in Figure 8a. If the vector triangles SWA and SWO are drawn, the surface tension of the water to oil interface can be inferred from the magnitude of γ o w .
For a four-phase system consisting of an oil droplet on aluminum-graphite composite under water with trapped air pockets is shown in Figure 8b [35]. The surface tensions of oil and water are 0.032 Jm−2, 0.072 Jm−2. A pyramid with surface tension forces can be drawn as shown in Figure 8c.
Note that in general, none of the three points among S, W, A and O would lie on the same line, with the exception of the limiting cases when the triangle inequality becomes a strict equality. As a result, the four points do not lie within the same plane. We need a 2D triangle to represent three phases and a 3D pyramid to represent four phases. The dimension will grow with a further increase of the number of phases.
The notion can easily be extended for the Wenzel and Cassie interfaces by stretching of corresponding vectors and for contact angle hysteresis by rotation of the corresponding vectors, as described in the preceding sections.

4. Conclusions

We discussed the concepts of the interfacial energy and surface tension. While it is often assumed that the origin of interfacial energy is in the broken molecular bonds in the surface layer, more sophisticated models imply the entropic effects of molecular reorientation at the surface. The entropic force is a result of molecular interactions in a system as a whole, and it is quite difficult to demonstrate how an entropic force is a result of a net sum of microscopic forces acting on particular molecules. The surface tension is not the same as the interfacial energy, and it can be viewed as a generalized force, i.e., a derivative of the internal energy of the system by a generalized coordinate. The difference between the generalized forces and the conventional mechanical forces is that the latter are applied to certain bodies or material points, whereas the former are vectors without any particular point of application. The traditional interpretation of wetting equilibrium as a balance of three surface tension forces applied to the three-phase line is therefore misleading.
By considering the surface tensions as vectors, which are not applied to a particular point, we developed a simple geometric interpretation of the Young, Wenzel, Cassie, Antonoff and Girifalco–Good equations for the equilibrium during wetting, as well as for contact angle hysteresis. This approach extends the traditional concept of Neumann’s triangle. Substances are presented as points, while tensions are vectors connecting the points, and the equations and inequalities of wetting equilibrium obtain simple geometric meaning. The effect of the surface roughness was interpreted as stretching of the corresponding vectors. The effect of the surface heterogeneity was interpreted as a linear combination of vectors corresponding to the two phases involved. The effect of contact angle hysteresis was interpreted as a rotation of a corresponding vector.

Author Contributions

Michael Nosonovsky conceived the idea and wrote most of the manuscript. Rahul Ramachandran wrote part of the text and prepared all the figures. Both authors have read and approved the final manuscript.

Conflicts of Interest

The authors declare no conflict of interest.

References

  1. Shuttleworth, R. The Surface Tension of Solids. Proc. Phys. Soc. 1950, 63, 444–457. [Google Scholar]
  2. Lautrup, B. Physics of Continuous Matter: Exotic and Everyday Phenomena in the Macroscopic World, 2nd ed; CRC Press: Boca Raton, FL, USA, 2011. [Google Scholar]
  3. Israelachvili, J.N. Intermolecular and Surface Forces with Applications to Colloidal and Biological Systems, 3rd ed; Academic Press: Waltham, MA, USA, 2011. [Google Scholar]
  4. Palit, S.R. Thermodynamic Interpretation of the Eotvos Constant. Nature 1956, 177, 1180–1180. [Google Scholar]
  5. Bormashenko, E. Why are the Values of the Surface Tension of most Organic Liquids Similar? Am. J. Phys. 2010, 78, 1309–1311. [Google Scholar]
  6. Antonoff, G.N. Sur La Tension Superficielle Des Solutions Dans La Zone Critique. J. Chim. Phys. 1907, 5, 364–371. [Google Scholar]
  7. Girifalco, L.A.; Good, R.J. A Theory for the Estimation of Surface and Interfacial Energies. I. Derivation and Application to Interfacial Tension. J. Phys. Chem. 1957, 61, 904–909. [Google Scholar]
  8. Young, T. An Essay on the Cohesion of Fluids. Philos. Trans. R. Soc. Lond. 1805, 95, 65–87. [Google Scholar]
  9. Straulino, S.; Gambi, C.M.C.; Righini, A. Experiments on Buoyancy and Surface Tension Following Galileo Galilei. Am. J. Phys. 2011, 79, 32–36. [Google Scholar]
  10. Ramachandran, R.; Nosonovsky, M. Surface Micro/Nanotopography, Wetting Properties and the Potential for Biomimetic Icephobicity of Skunk Cabbage Symplocarpus Foetidus. Soft Matter. 2014, 10, 7797–7803. [Google Scholar]
  11. Hardy, W.B. Historical Notes upon Surface Energy and Forces of Short Range. Nature 1922, 109, 375–378. [Google Scholar]
  12. De Gennes, P.G.; Brochard-Wyart, F.; Quéré, D. Capillarity and Wetting Phenomena: Drops, Bubbles, Pearls, Waves; Springer: New York, NY, USA, 2004. [Google Scholar]
  13. Widom, B. Antonoff’s Rule and the Structure of Interfaces Near Tricritical Points. Phys. Rev. Lett. 1975, 34, 999–1002. [Google Scholar]
  14. Antonoff, G. On the Validity of Antonoff’s Rule. J. Phys. Chem. 1942, 46, 497–499. [Google Scholar]
  15. Marmur, A. Soft Contact: Measurement and Interpretation of Contact Angles. Soft Matter. 2006, 2, 12–17. [Google Scholar]
  16. Wenzel, R.N. Resistance of Solid Surfaces to Wetting by Water. Ind. Eng. Chem. 1936, 28, 988–994. [Google Scholar]
  17. Cassie, A.B.D.; Baxter, S. Wettability of Porous Surfaces. Trans. Faraday Soc. 1944, 40, 546–551. [Google Scholar]
  18. Krasovitski, B.; Marmur, A. Drops Down the Hill: Theoretical Study of Limiting Contact Angles and the Hysteresis Range on a Tilted Plate. Langmuir 2005, 21, 3881–3885. [Google Scholar]
  19. Rayleigh. Surface Tension. Nature 1891, 43, 437–439.
  20. Adam, N.K.; Jessop, G. CCL.—Angles of Contact and Polarity of Solid Surfaces. J. Chem. Soc. Trans. 1925, 127, 1863–1868. [Google Scholar]
  21. Good, R.J. A Thermodynamic Derivation of Wenzel’s. Modification of Young’s Equation for Contact Angles; Together with a Theory of Hysteresis. J. Am. Chem. Soc. 1952, 74, 5041–5042. [Google Scholar]
  22. Bartell, F.E.; Shepard, J.W. Surface Roughness as Related to Hysteresis of Contact Angles. II. The Systems Paraffin—3 Molar Calcium Chloride Solution-Air and Paraffin-Glycerol-Air. J. Phys. Chem. 1953, 57, 455–458. [Google Scholar]
  23. Nosonovsky, M. Model for Solid-Liquid and Solid-Solid Friction of Rough Surfaces with Adhesion Hysteresis. J. Chem. Phys. 2007, 126, 224701. [Google Scholar]
  24. Tadmor, R. Line Energy and the Relation between Advancing, Receding, and Young Contact Angles. Langmuir 2004, 20, 7659–7664. [Google Scholar]
  25. Dirany, M.; Dies, L.; Restagno, F.; Léger, L.; Poulard, C.; Miquelard-Garnier, G. Chemical Modification of PDMS Surface without Impacting the Viscoelasticity: Model Systems for a Better Understanding of Elastomer/Elastomer Adhesion and Friction. Colloids Surfaces A 2015, 468, 174–183. [Google Scholar]
  26. Belman, N.; Jin, K.; Golan, Y.; Israelachvili, J.N.; Pesika, N.S. Origin of the Contact Angle Hysteresis of Water on Chemisorbed and Physisorbed Self-assembled Monolayers. Langmuir 2012, 28, 14609–14617. [Google Scholar]
  27. Cho, K.L.; Wu, A.H.F.; Liaw, I.I.; Cookson, D.; Lamb, R.N. Wetting Transitions on Hierarchical Surfaces. J. Phys. Chem. C 2012, 116, 26810–26815. [Google Scholar]
  28. Ramachandran, R.; Sobolev, K.; Nosonovsky, M. Dynamics of Droplet Impact on Hydrophobic/Icephobic Concrete with the Potential for Superhydrophobicity. Langmuir 2015, 31, 1437–1444. [Google Scholar]
  29. Bormashenko, E. General Equation Describing Wetting of Rough Surfaces. J. Colloid Interface Sci. 2011, 360, 317–319. [Google Scholar]
  30. Patashinski, A.Z.; Orlik, R.; Paclawski, K.; Ratner, M.A.; Grzybowski, B.A. The Unstable and Expanding Interface between Reacting Liquids: Theoretical Interpretation of Negative Surface Tension. Soft Matter. 2012, 8, 1601–1608. [Google Scholar]
  31. N’guessan, H.E.; Leh, A.; Cox, P.; Bahadur, P.; Tadmor, R.; Patra, P.; Vajtai, R.; Ajayan, P.M.; Wasnik, P. Water Tribology on Graphene. Nature Comm. 2012, 3, 1242. [Google Scholar]
  32. Leh, A.; N’guessan, H.E.; Fan, J.; Bahadur, P.; Tadmor, R.; Zhao, Y. On the Role of the Three-Phase Contact Line in Surface Deformation. Langmuir 2012, 28, 5795–5801. [Google Scholar]
  33. Tadmor, R.; Bahadur, P.; Leh, A.; N’guessan, H.E.; Jaini, R.; Dang, L. Measurement of Lateral Adhesion Forces at the Interface between a Liquid Drop and a Substrate. Phys. Rev. Lett. 2009, 103, 266101. [Google Scholar]
  34. Hejazi, V.; Nosonovsky, M. Contact Angle Hysteresis in Multiphase Systems. Colloid Polym. Sci. 2013, 291, 329–338. [Google Scholar]
  35. Hejazi, V.; Nosonovsky, M. Wetting Transitions in Two-, Three-, and Four-Phase Systems. Langmuir 2012, 28, 2173–2180. [Google Scholar]
Figure 1. (a) The popular, yet ambiguous description of the origin of surface tension; the imbalance of cohesive forces between molecules due to the lack of bonds at the surface results in surface tension. (b) The network of tetrahedral water molecules at the air-water interface is more ordered than that in the bulk. Consequently, the decrease of entropy TΔS due to the additional orderliness in the surface layer may be partially responsible for the surface tension. (c) When the interface between A and B is displaced along the vector d r , the surface tension force acts on the three-phase line l in the direction of the normal n .
Entropy 17 04684f1
Figure 2. (a) Surface tension forces at the three-phase line on a non-deformable solid surface. The vertical components of the forces remain unbalanced. (b) The equilibrium of surface tensions at the three-phase line of liquid Phases A, B and C. Note the deformation of the interface between A and C.
Entropy 17 04684f2
Figure 3. (a) A liquid droplet in the Wenzel state, with a homogenous solid to liquid interface below the droplet; (b) a liquid droplet in the Cassie–Baxter state, with a composite solid to liquid to vapor interface below the droplet; (c) contact angle hysteresis (CAH) measurement by tilting the droplet. The maximum or advancing (θadv) and minimum or receding (θrec) contact angles are measured at the front and rear of a moving droplet, respectively.
Entropy 17 04684f3
Figure 4. (a) Equilibrium of surface tension vectors at the three-phase line; (b) Neumann’s triangle for a three-phase system; (c) when Antonoff’s rule is an exact equality, the surface tension vectors lie on the same line; this corresponds to complete wetting; (d) geometric interpretation of the Girifalco and Good equation.
Entropy 17 04684f4
Figure 5. Neumann’s triangle for a three-phase system in the Wenzel state.
Entropy 17 04684f5
Figure 6. (a,b) Neumann’s triangles for three-phase systems S1AW and S2AW, respectively; (c) Neumann’s triangle for a three-phase Cassie–Baxter state.
Entropy 17 04684f6
Figure 7. (a) Contact angle hysteresis represented using Neumann’s triangle as a rotation of the vector γ w a . A range of contact angles are possible under the constraint that | γ w a | remains constant. (b) The forces involved in contact angle hysteresis. For a droplet on a tilted surface, the pressure inside acting normal to the surface is the sum of Laplace, as well as hydrostatic pressures. (c) The components of the surface tension vectors normal to the surface balance the pressure force, while the components of the surface tension vectors along the surface balance the friction force.
Entropy 17 04684f7
Figure 8. (a) Tetrahedron of surface tension vectors in 3D space for a four-phase system; (b) a four-phase system on aluminum-graphite composite, which consists of a vegetable oil (γo = 0.032 Jm−2) droplet (volume about 5 μL) on Al-C composite immersed in water (γw = 0.072 Jm−2) with pockets of air trapped on the Al-C surface forming the fourth phase; (c) the tetrahedron of surface tension vectors for the four-phase system.
Entropy 17 04684f8

