Article

Wavelet Fisher’s Information Measure of 1=f α Signals

by
Julio Ramírez-Pacheco
1,2,*,
Deni Torres-Román
1,
Luis Rizo-Dominguez
2,
Joel Trejo-Sanchez
2 and
Francisco Manzano-Pinzón
2
1
Department of Electrical Engineering, CINVESTAV-IPN Unidad Guadalajara, 45015 Av. Cienífica 1145, Col. El Bajío, Zapopán, Jalisco, México
2
Department of Basic Sciences and Engineering, University of Caribe, 77528, SM-78, Mza-1, Lote-1, Esquina Fracc. Tabachines, Cancún, Q.Roo, México
*
Author to whom correspondence should be addressed.
Entropy 2011, 13(9), 1648-1663; https://doi.org/10.3390/e13091648
Submission received: 6 July 2011 / Revised: 30 July 2011 / Accepted: 18 August 2011 / Published: 6 September 2011

Abstract

:
This article defines the concept of wavelet-based Fisher’s information measure (wavelet FIM) and develops a closed-form expression of this measure for 1 / f α signals. Wavelet Fisher’s information measure characterizes the complexities associated to 1 / f α signals and provides a powerful tool for their analysis. Theoretical and experimental studies demonstrate that this quantity is exponentially increasing for α > 1 (non-stationary signals) and almost constant for α < 1 (stationary signals). Potential applications of wavelet FIM are discussed in some detail and its power and robustness for the detection of structural breaks in the mean embedded in stationary fractional Gaussian noise signals studied.

1. Introduction

1 / f α signals, also known as scaling processes, model a large variety of phenomena occurring in diverse fields of science and engineering [1,2,3,4], from voltage fluctuations in resistors, semiconductors and vacuum tubes [5] to Internet traffic [6], laser propagation [7,8], turbulence, financial time series, among others. In recent years, considerably effort has been undertaken to the robust estimation of the parameters which describe their properties [2,9,10], the most important, by far, the scaling index α. In this context, an estimator is considered robust if it is capable of providing minimum-biased estimates of the scaling index α for 1 / f signals subject to trends, non-stationarities, missing values, etc., and independent of signal type. As a matter of fact, the presence of trends, non-stationarities, etc., impact significantly the estimation process leading to biased estimates of α [10,11]. On the other hand, recently, the use of information theory quantifiers is playing an increasing role in the analysis of 1 / f α signals [7,8,12]. Wavelet entropies and q-entropies characterize the complexities associated to 1 / f α signals and have recently been used for detecting structural breaks in the mean in stationary and non-stationary signal analysis frameworks [13]. Motivated by this, this work extends the concept of time-domain Fisher’s information measure (FIM) to the wavelet or time-scale domain and investigates its use in 1 / f α signal analysis. Wavelet Fisher’s information measure, tantamount to computing FIM in a wavelet spectrum representation of a signal, is shown to describe accurately the complexities associated to 1 / f α signals and to provide a robust tool for their analysis. Complexities in this article account for measuring the irregularities present in a random signal, i.e., a deviation from pure randomness. Therefore, wavelet FIM will be able to report different quantities for regular and irregular random signals. A closed form expression of wavelet FIM is derived for scaling signals and based on this, its values for anti-correlated and correlated stationary/non-stationary 1 / f α signals found. Potential applications of wavelet FIM are highlighted and an example application for the detection of structural breaks in the mean embedded in fractional Gaussian noise (fGn) signals studied. The remainder of this article is structured as follows. Section 2 briefly recalls the definition of 1 / f α signals, their properties and wavelet analysis. It also describes how probability densities can be constructed from the wavelet spectrum representation of signals. Section 3 introduces the concept of Fisher’s information measure and defines wavelet FIM based on the wavelet spectrum based probability mass function (pmf) of signals. The properties and applications of wavelet FIM for scaling signals are also pointed out in this section. Section 4 overviews the level-shift detection process and provides description of the methodology for detecting structural breaks in the mean in stationary 1 / f α signals with wavelet FIM. Section 5 presents results of the detection capabilities of wavelet FIM in synthesized fGn signals with level-shifts and finally, Section 6 concludes the paper.

2. 1 / f α Signals: Definition and Wavelet Analysis

2.1. 1 / f α Processes

Processes with 1 / f α spectral behaviour, also called power-law or scaling processes, are random signals for which their power spectral density (PSD) behaves as a power-law, i.e., as
S ( f ) c f | f | - α
in a range of frequencies f ( f a , f b ) [14,15], where c f is a constant and f a , f b are the lower and upper frequencies upon which the power-law scaling holds. Parameter α determines among other properties stationarity and/or long-range correlations in the signal. When α < 1 , the process is stationary and when α > 1 , the process is regarded as non-stationary. Many phenomena in nature exhibit power-law behaviour in certain features and thus can be efficiently described in terms of 1 / f α signals properties. Several stochastic processes have been proposed in the literature to model the observed 1 / f behaviour. In particular, fractional Brownian motion (fBm) and fractional Gaussian noise (fGn) have been extensively used to model phenomena with 1 / f power spectra and long-range correlations [16]. A Gaussian, zero-mean and self-similar with stationary increments process (Hsssi), B H ( t ) , is said to be a fBm. The covariance structure of fBm (and of all Hsssi processes) is given by
E B H ( t ) B H ( s ) = σ 2 2 | t | 2 H + | s | 2 H - | t - s | 2 H
where 0 < H < 1 is the Hurst parameter. Fractional Gaussian noise, G H , δ ( t ) , is obtained from a fBm process by sampling it at time instants t k , k = 0 , 1 , 2 , and computing increments of the form
G H , δ ( t ) = 1 δ B H ( t k + δ ) - B H ( t k )
for a fixed integer δ Z + . Fractional Brownian motion is non-stationary while fGn is stationary. Both processes are characterized by the Hurst index H and can alternatively be expressed in terms of the scaling index α. In this framework, fBm attains a value 1 < α < 3 and fGn of - 1 < α < 1 . Generalizations of fBm and fGn have been proposed in the literature under the names of extended fractional Brownian motions and extended fractional Gaussian noises, see for example [9] and [17] for further details on these signals. Extended fBm, obtained from a cumulative sum of a fBm signal, are non-stationary signals for which 3 < α < 5 and extended fGn, derived from a first-order difference of fGn, are stationary signals for which - 3 < α < - 1 . Signals with power-law spectra also possess self-similar characteristics and based on this property, several estimation methodologies have been proposed. Although there exists several methodologies in the literature to estimate α, none is robust to trends, non-stationarities, missing values and independent of signal class. Methodologies which combine several techniques to attempt to estimate α in these conditions are now preferred. For a complete understanding of scaling signals, self-similarity, long-range dependency and their relationships, analysis and estimation issues, the reader is referred to [1,4,14,15,18,19].

2.2. Wavelet Analysis of 1 / f α Signals

The analysis of signals by wavelet transforms is playing a significant role in many branches of science and engineering [20,21]. In the context of 1 / f α signals, wavelet transforms are currently being used with great success for their analysis, estimation and synthesis [16,22,23,24]. In [23,24], a powerful non-parametric estimator of the scaling index α was proposed. The so-called Abry–Veitch estimator provides unbiased estimates of α for scaling signals with embedded polynomial-type noise. The Abry–Veitch estimator, however, is subject to biases when estimating α for 1 / f α signals [10,11] resulting in estimates of H = ( α + 1 ) / 2 > 1 . Novel techniques which combine different methodologies to enhance the estimation process are now preferred [2,18,25]. This article proposes to use information theory quantifiers and wavelet-based methods to enhance the analysis and estimation process of 1 / f signals. Let X t be a random signal satisfying E | X ( u ) | 2 d u < , Equation (1) and let ψ ( t ) be an orthonormal analyzing wavelet satisfying the admissibility condition. The discrete wavelet transform (DWT) of X t is given by the inner product:
d X ( j , k ) = - + X t ψ j , k ( t ) d t
for some dyadically dilated (by a factor j Z ) and integer translated (by a factor k Z ) analyzing wavelet ψ j , k ( t ) = 2 - j / 2 ψ ( 2 - j t - k ) . DWT is related to the notion of multiresolution analysis (MRA) of signals in which functions of various resolutions are constructed by projections of the original signal X t on the related spaces V j . According to MRA, a signal X t can be represented by
X t = j = 1 L k = - d X ( j , k ) ψ j , k ( t )
i.e., by a sum of different signals representing different levels of detail. In the context of 1 / f α signal analysis, the wavelet spectrum, defined as the variance of wavelet coefficients, has shown to be very useful. Wavelet spectrum permits to define estimators of index α, probability densities, and consequently, information theory quantifiers. From its definition and Equation (1), it follows that the wavelet spectrum of stationary 1 / f α signals is given by [16,23,24]:
E d X 2 ( j , k ) = - S X ( 2 - j f ) | Ψ ( f ) | 2 d f
where Ψ ( . ) is the Fourier integral of ψ ( . ) , S X ( . ) the PSD of the process and f, the Fourier frequency. For scaling signals, the wavelet spectrum takes the form [11]
E d X 2 ( j , k ) 2 j α C ( ψ , α )
where C ( ψ , α ) = c γ | f | - α | Ψ ( f ) | 2 d f and c γ is a constant.

2.3. Wavelet-Based Probability Densities

Wavelet spectrum, as noted above, allows among other properties to construct probability mass functions of random signals and to detect the presence of non-stationarities embedded in stationary data [11]. Wavelet-based pmfs provide the ability to define time-scale information theoretic quantifiers which in turn allow to study the dynamics and complexities associated to random signals and systems. The dynamics are studied by the use of sliding windows and the complexities by the values reported by the Fisher information for regular and irregular signals. The pmf derived from the wavelet spectrum is computed as:
p j = 1 N j k E d X 2 ( j , k ) i = 1 log2 ( N ) 1 N i k E d X 2 ( i , k )
where N j (respectively N i ) represents the number of wavelet coefficients at scale j (respectively i) and N is the length of the data. For 1 / f α signals, the wavelet-based pmf is determined by direct application of Equation (7) into Equation (8) which results in
p j = 2 ( j - 1 ) α 1 - 2 α 1 - 2 α M
where M = log2 ( N ) and j = 1 , 2 , M represent the number of levels of detail. The density p j represents the probability that the energy of the fractal signal is located at scale j. Several information theoretic quantifiers have been defined using (9), examples include Shannon (called wavelet entropy) [8,26], Renyi and Tsallis q-entropies [12,13]. This article extends the Fisher’s information concept to the wavelet domain using the density given in (9). Recall that Fisher information provides a complementary characterization of a probability density. Unlike entropies that provide a global measure of the spreading of a density, Fisher information provides a local characterization and is therefore more sensitive to local re-arrangements of the pmf. This article shows that wavelet FIM characterizes (in the equivalent way wavelet entropies do) the complexities associated to scaling signals. Wavelet FIM is minimum for white noise while wavelet entropies are maximum. Accordingly, wavelet entropies are exponentially decreasing for smooth fractal signals while wavelet FIMs are exponentially increasing.

3. Wavelet-Based Fisher’s Information Measure
3.1. Time-Domain Fisher’s Information Measure

Fisher’s information measure (FIM) has recently been applied in the analysis and processing of complex signals [27,28,29]. In [27], FIM was applied to detect epileptic seizures in EEG signals recorded in human and turtles, later the work of Martin [28], reported that FIM can be used to detect dynamical changes in many non-linear models, such as the logistic map, Lorenz model, among others. The work of Telesca [29] reported on the application of FIM for the analysis of geoelectrical signals. Recently, Fisher information has been extensively applied in quantum mechanical systems for the study of single particle systems [30] and also in the context of atomic and molecular systems [31]. Fisher’s information measure has also been used in combination with Shannon entropy power to construct the so-called Fisher-Shannon information plane/product (FSIP) [32]. The Fisher-Shannon information plane was recognized in that work to be a plausible method for non-stationary signal analysis. In this work, the notion of Fishers’ information measure is extended to the wavelet domain and then a closed-form expression for this quantifier is derived for the case of 1 / f signals. Let X t be a signal with associated probability density f X ( x ) . Fisher’s information (in time-domain) of signal X t is defined as
I X = x f X ( x ) 2 d x f X ( x )
Fisher’s information, I X is a non-negative quantity that yields large (possibly infinite) values for smooth signals and small values for random disordered data. Accordingly, Fisher’s information is large for narrow probability densities and small for wide (flat) ones [5]. Fisher information is also a measure of the oscillatory degree of a waveform; highly-oscillatory functions have large Fisher information [30]. Fisher’s information has mostly been applied in the context of stationary signals using a discretized version of Equation (10)
I X = k = 1 L p k + 1 - p k 2 p k
for some pmf { p k } k = 0 L . Equation (11) can be computed in sliding windows resembling a real-time computation. In this case, Fisher’s information is often called FIM.

3.2. Wavelet-Based Fisher’s Information Measure

The wavelet spectrum-based probability density of Equation (9) allows to extend the Fisher’s information quantifier defined in Equation (11) to the wavelet domain. The novel information theory quantifier is named wavelet Fisher’s information (abbrev. wavelet FIM). Wavelet FIM, basically equivalent to computing a FIM quantifier on a time-scale representation of the data, allows among other applications to describe the complexities of 1 / f signals. With the Fisher’s information computed in this way, the information content of a signal is followed with optimal time-frequency resolution and independently of stationarity assumptions. Wavelet FIM inherits all the properties associated to wavelets and wavelet transforms. For instance, wavelet FIM is blind to polynomial trends of order K embedded in signals if the analyzing wavelet has K vanishing moments. Wavelet FIM for 1 / f α signals is thus given by
I 1 / f = 2 α - 1 2 1 - 2 α ( M - 1 ) 1 - 2 α M
= 2 α 2 + 2 sinh 2 ( α ln 2 / 2 ) . P n u m M 2 cosh ( α ln 2 / 2 ) P d e n M + 1 ( 2 cosh ( α ln 2 / 2 ) )
where P n u m M ( . ) and P d e n M + 1 ( . ) denote polynomials of argument 2 cosh ( α ln 2 / 2 ) that are given by
P n u m M ( . ) = ( 2 cosh u ) M - 2 ( M - 3 ) 2 ! ( 2 cosh u ) M - 2 + 3 ( M - 4 ) ( M - 5 ) 3 ! ( 2 cosh u ) M - 4 -
P d e n M + 1 ( . ) = ( 2 cosh u ) M + 1 - ( M - 2 ) 1 ! ( 2 cosh u ) M - 1 + ( M - 3 ) ( M - 4 ) 2 ! ( 2 cosh u ) M - 3 -
where u = α ln 2 / 2 . The relation P n u m M / P d e n M + 1 ( . ) is zero for | α | > 4 and non-zero for | α | < 4 . Wavelet FIM is thus a non-negative quantity nearly independent of length M = log2 ( N ) . Note that as M large and α 1 (the case of non-stationary signals), wavelet FIM behaves approximately as
I 1 / f 2 2 α - 1
Therefore for large α, wavelet FIM increases exponentially fast with increasing α. In the limit of α , wavelet FIM I 1 / f and as α < 0 and M large it is given by
I 1 / f 2 α + 3 cosh ( α ln 2 ) - 1
which gives rise as α - to I 1 / f 1 . Wavelet FIM achieves a minimum for α = 0 . The minimum corresponds to white noise and is given by
I 1 / f = 0
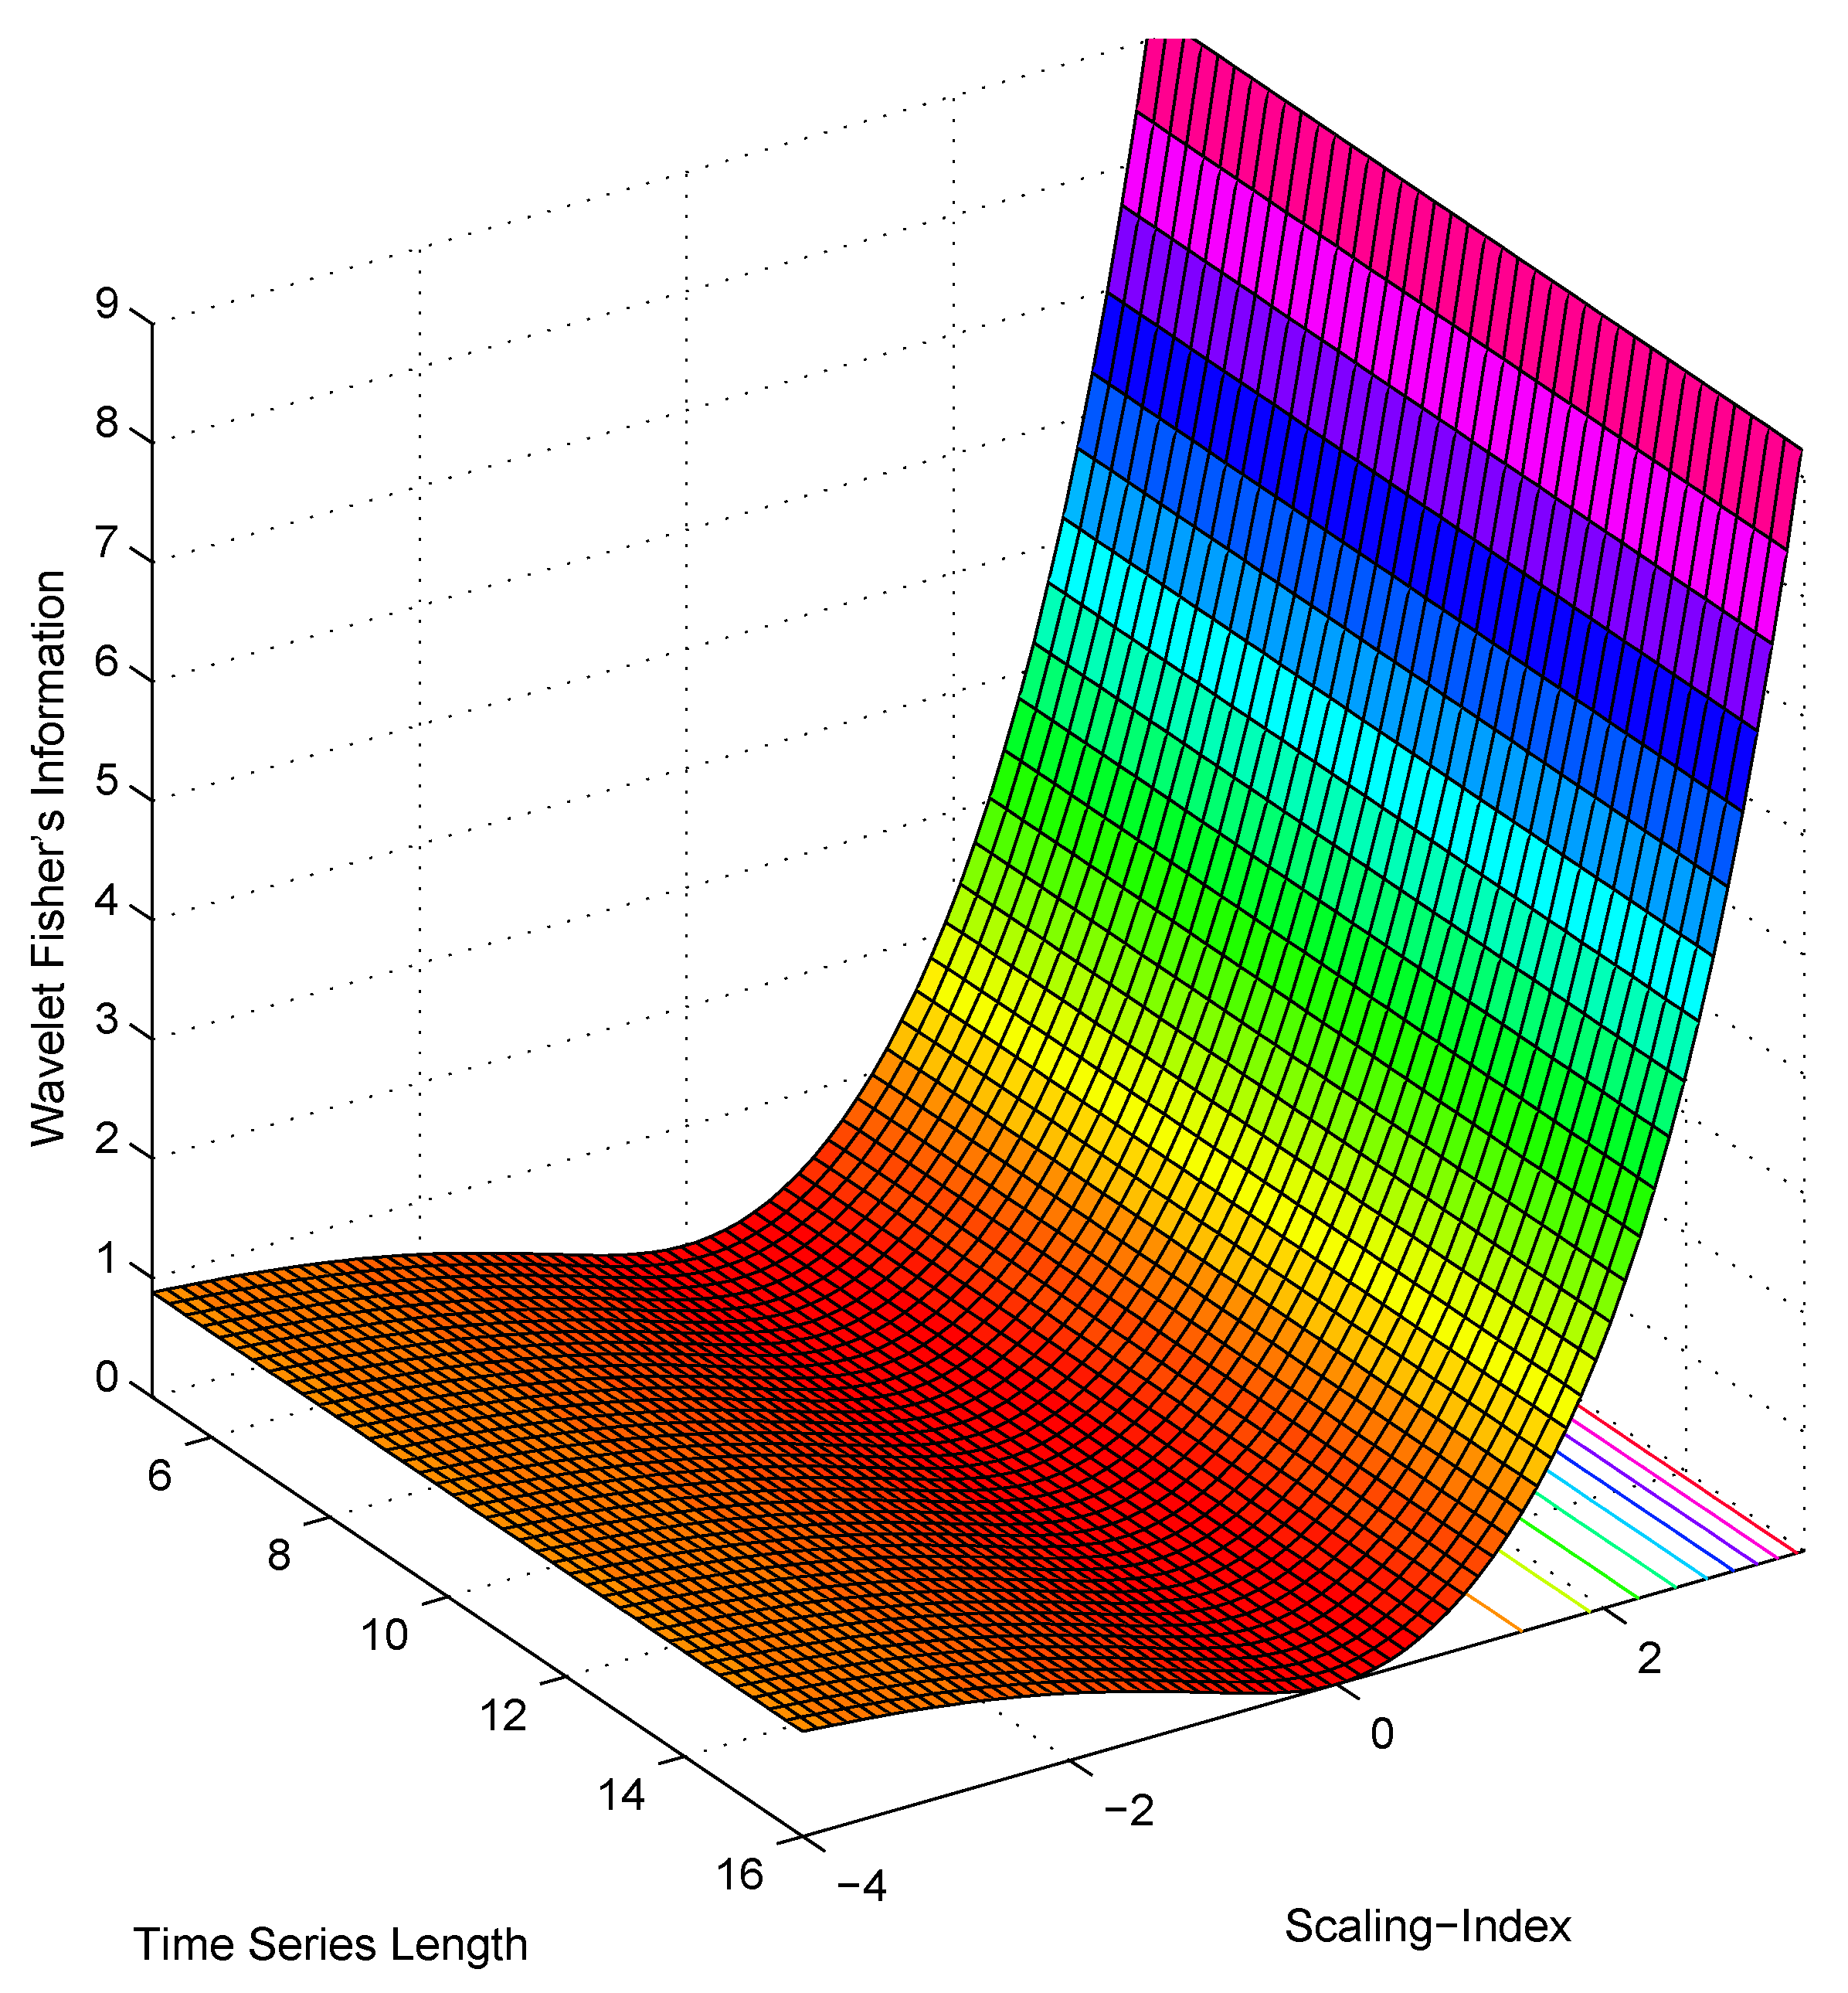
Based on these results, the complexities associated to 1 / f α signals are theoretically derived. For non-stationary signals ( α > 1 ), wavelet Fisher’s information achieves large values and as α increases I 1 / f increases exponentially (as 2 2 α - 1 ) fast. When α < 1 (the case of stationary signals), wavelet FIM increases either when scaling signals become more persistent or anti-persistent. Wavelet FIM achieves a minimum value when α = 0 , i.e., for completely random signals (white noise). For extended fractional Gaussian noises, wavelet FIM presents minimum variation and for increments of order M 1 of these processes, wavelet FIM is constant. Figure 1 depicts the theoretical behaviour of wavelet Fisher’s information for different scaling signals. The length axis in this figure should be understood in powers of two. Observe from figure that wavelet FIM describes efficiently the complexities associated to 1 / f signals. Wavelet FIM, therefore, provides an alternative for characterizing the information content of scaling signals.
Figure 1. Theoretical plane of wavelet Fisher’s information for 1 / f α signals. When α > 1 increases exponentially and when α < - 1 it converges to 1.
Entropy 13 01648 g001

3.3. Applications of Wavelet Fisher’s Information Measure

Because wavelet FIM describes properly the characteristics and complexities of fractal 1 / f α signals, many applications can be identified using this complexity-based framework. As a matter of fact, based on the fact that wavelet FIM achieves large values for non-stationary signals and small values for stationary ones, a potential application area of wavelet FIM is in the classification of fractal signals as fractional noises and motions. Classification of 1 / f α signals as motions or noises remains as an important, attractive and unresolved problem in scaling signal analysis [18,25,33] since the nature of the signal governs the selection of estimators, the shape of quantifiers such as q t h order moments, the nature of correlation functions, etc. [34]. Another important potential application of wavelet FIM, related to the classification of signals, is in the blind estimation of scaling parameters [35]. Blind estimation refers to estimating α, independently of signal type (stationary or non-stationary). Wavelet FIM can also be utilized for the detection of structural breaks in the mean embedded in 1 / f α signals. Structural breaks in the mean affect significantly the estimation of scaling parameters leading to biased estimates of α and consequently in misinterpretation of the phenomena. As a matter of fact in [11], it was demonstrated that the well-known Abry–Veitch estimator overestimates the scaling index α in the presence of a single level-shift leading to values of H = ( α + 1 ) / 2 > 1 , which in principle is not permissible in the theory. In the following, the paper concentrates on the detection of structural breaks in the mean embedded in synthesized stationary fGn signals by the use of wavelet Fisher’s information measure. The work studies anti-correlated and correlated versions of fractional Gaussian noises and the power of wavelet FIM in detecting simple structural breaks in the mean in these signals.

4. Detection of Structural Changes in the Mean

4.1. The Problem of Level-Shift Detection

Detection and location of structural breaks in the mean (level-shifts) has been an important research problem in many areas of science [36,37]. In the Internet traffic analysis framework, detection, location and mitigation of level-shifts significantly improves on the estimation process. As a matter of fact the presence of a single level-shift embedded in a stationary fGn results in an estimated H > 1 [11]. This is turn, results in misinterpretation of the phenomena under study and inadequate construction of q t h -order moments. Let B ( t ) , t R be a 1 / f signal with level-shifts at time instants { t 1 , t 1 + L , t j , t j + L } . B ( t ) can be represented as
B ( t ) = X ( t ) + j = 1 J μ j 1 [ t j , t j + L ] ( t )
where X ( t ) is a signal satisfying Equation (1) and μ j 1 [ a , b ] ( t ) represents the indicator function of amplitude μ j in the interval [ a , b ] . The problem of level-shift detection reduces to identifying the points { t j , t j + L } j J where a change in behaviour occurs. Often, the change is visually perceptible, but frequently this is not the case and alternative quantitative methods are preferred. In what follows, description of the procedure for detecting level-shifts in 1 / f signals by wavelet FIM is described.

4.2. Level-Shift Detection in 1 / f Signals with Wavelet FIM

To detect the presence of level-shifts in fractal 1 / f signals, wavelet Fisher’s information is computed in sliding windows. A window of length w, located in the interval m Δ t k < m Δ + w applied to signal { X ( t k ) , k = 1 , 2 , N } is
X ( m ; w , Δ ) = X ( t k ) Π t - m Δ w - 1 2
where m = 0 , 1 , 2 , m m a x , Δ is the sliding factor and Π ( . ) is the well-known rectangular function. Note that Equation (19) represents a subset of X ( t k ) and thus by varying m from 0 to m m a x and computing wavelet Fisher’s information on every window, the temporal evolution of wavelet FIM is followed. Suppose the wavelet FIM at time m (for sliding factor Δ) is denoted as I X ( m ) , then a plot of the points
w + m Δ , I X ( m ) m = 0 m m a x : = I X
represents such time-evolution. In [11], it was demonstrated that the presence of a sudden jump in a stationary fractal signal will cause the estimated H ^ > 1 . The level-shift, thus, causes the signal under observation become non-stationary. In the wavelet Fisher’s information framework, this sudden jump will cause its value to increase suddenly. Therefore a sudden jump increase in the plot of Equation (20) can be considered as an indicator of the occurrence of a single level-shift in the signal. These theoretical findings are experimentally tested by the use of synthesized scaling signal with level-shifts. The synthesized signals corresponds to fGn signals generated using the circular embedding algorithm [38,39] (also known as the Davies and Harte algorithm).

5. Results and Discussion

The previous section stated the methodology for detecting structural breaks in the mean embedded in fGn signals. A sudden increase (or peak) in the computed wavelet FIM is interpreted as a possible level-shift in the signal. Figure 2 displays the detection capabilities of wavelet FIM in an anticorrelated fractional Gaussian noise signal with Hurst-index H = 0 . 1 and length 2 15 . Top left plot shows the signal with a single level shift added to its structure at t b = 32768 . For illustrative purposes, the level-shift is also plotted in white. The amplitude of the level-shifts studied in this paper are one-half the standard deviation of the signal Var X t / 2 . The selection of this amplitude guarantees that the level-shift is not perceptible by eye and as a matter of fact is difficult to visualize with a standard level-shift detection tools [36,37]. Bottom left plot of Figure 2 displays the wavelet FIM of the single level-shift fGn signal computed in sliding windows of length w = 4096 and shifts of Δ = 700 . Note that the plot of wavelet FIM of this signal present a sudden peak at t p 35000 . This sudden peak (of high amplitude) corresponds to the level-shift added to the signal and thus can be interpreted as a result of a level-shift present in the studied signal. The above suggests that wavelet FIM is capable of detecting this weak level-shift with plausible results. Top right plot of Figure 2 displays a fractional Gaussian noise signal ( H = 0 . 1 ) with more elaborate level-shifts embedded on its structure. The level-shifts were placed at t 1 = 11384 , t 2 = 21384 , t 3 = 44152 and t 4 = 54152 . The amplitude, again, is Var X t / 2 . Wavelet FIM was computed in this case in windows of length w = 4096 and sliding factor of Δ = 625 . Note that the level-shifts are effectively detected with wavelet FIM method. Increasing the amplitude of the level-shifts in the form μ > Var X t / 2 increases the detection capabilities of wavelet Fisher’s information. Unlike traditional level-shift detection methodologies, wavelet FIM allows to detect level-shifts in anticorrelated and correlated fGn signals. The method proposed by Rea [36,37], known as atheoretical regression trees, detects level-shifts in white noise signals. To our knowledge, this article presents for the first time wavelet FIM and the application of wavelet FIM as a level-shift detection methodology.
Figure 2. Wavelet Fisher’s information of a fractional Gaussian noise with H = 0.1 and embedded jumps. Top left plot displays the fGn signal with a single level-shift and top right plot with a more elaborate combination of jumps. Bottom plots represent their corresponding wavelet Fisher’s information.
Entropy 13 01648 g002
Figure 3 depicts the wavelet Fisher’s information measure for anticorrelated fGn signals with a single level-shift at t b = 32768 . Recall that anticorrelated fGn signals share the property that if a signal displays a positive value it is likely to be followed by a negative value. Figure 3a displays the wavelet Fisher’s information for a fGn signal with Hurst-index H = 0 . 2 . Figure 3b the wavelet FIM of a fGn with H = 0 . 3 , Figure 3c for H = 0 . 4 and finally Figure 3d for a signal with Hurst-index H = 0 . 5 . The last case ( H = 0 . 5 ) corresponds to a completely disordered signal (white noise). The analyses were performed with w = 4096 and Δ = 700 . Note from these results that wavelet FIM allows to effectively detect the single level-shift embedded in the signal’s structure. Wavelet FIM, thus, provides for anticorrelated signals, the ability to effectively detect single weak level-shifts. Figure 4 presents the detection capabilities of wavelet FIM in correlated stationary fGn signals with a single jump located at t b = 32768 . Recall that correlated fGn signals share the property that positive values are likely to be followed by positive values and negative values by negative values, a property known as persistence. Fractional Gaussian noise signals with H > 1 / 2 are long-range dependent and thus standard statistical methodologies no longer hold [1,9,17]. Within Figure 4, plot (a) represents the wavelet FIM of a fGn with H = 0 . 6 , plot (b) for H = 0 . 7 , plot (c) for H = 0 . 8 and finally plot (d) for a fGn signal with Hurst-index H = 0 . 9 . From these plots it can noted that wavelet FIM provides appropriate detection of the jumps embedded in these correlated fGn signals. With these results, it is noted that wavelet FIM detect appropriately a single jump embedded in the structure of anticorrelated and correlated fractional Gaussian noise signals. For the case of correlated fractional Gaussian noises, small peaks are also generated for H > 0 . 7 , however, there exists a single high-amplitude peak which suggest the presence of a level-shift. The small peaks are the consequence of computing wavelet FIM in sliding windows and, in the results presented above, do not influence or affect the detection process. Detection of a single level-shift may be of interest in many areas of science [36,37]. Since in many fields of science, the time series representing a particular phenomena may be subject to multiple level-shifts, it is also of interest to study the detection capabilities of wavelet FIM in these frameworks. For this purpose, the simulation of anticorrelated and correlated fGn signals with multiple level-shifts were performed. The level-shifts are located at time-instants t 1 = 11384 , t 2 = 22384 , t 3 = 44152 and t 4 = 54152 .
Figure 3. Wavelet FIM of anticorrelated fractional Gaussian noises with a single level-shift. (a) fGn with H = 0.2 ; (b) fGn with H = 0.3 ; (c) fGn with H = 0.4 ; and (d) fGn with H = 0.5 .
Entropy 13 01648 g003
Figure 4. Wavelet FIM of correlated stationary fractional Gaussian noises with a single level-shift at t b = 32768 . (a) fGn with H = 0.6 ; (b) fGn with H = 0.7 ; (c) fGn with H = 0.8 and the wavelet FIM of a fGn with H = 0.9 is displayed in (d).
Entropy 13 01648 g004
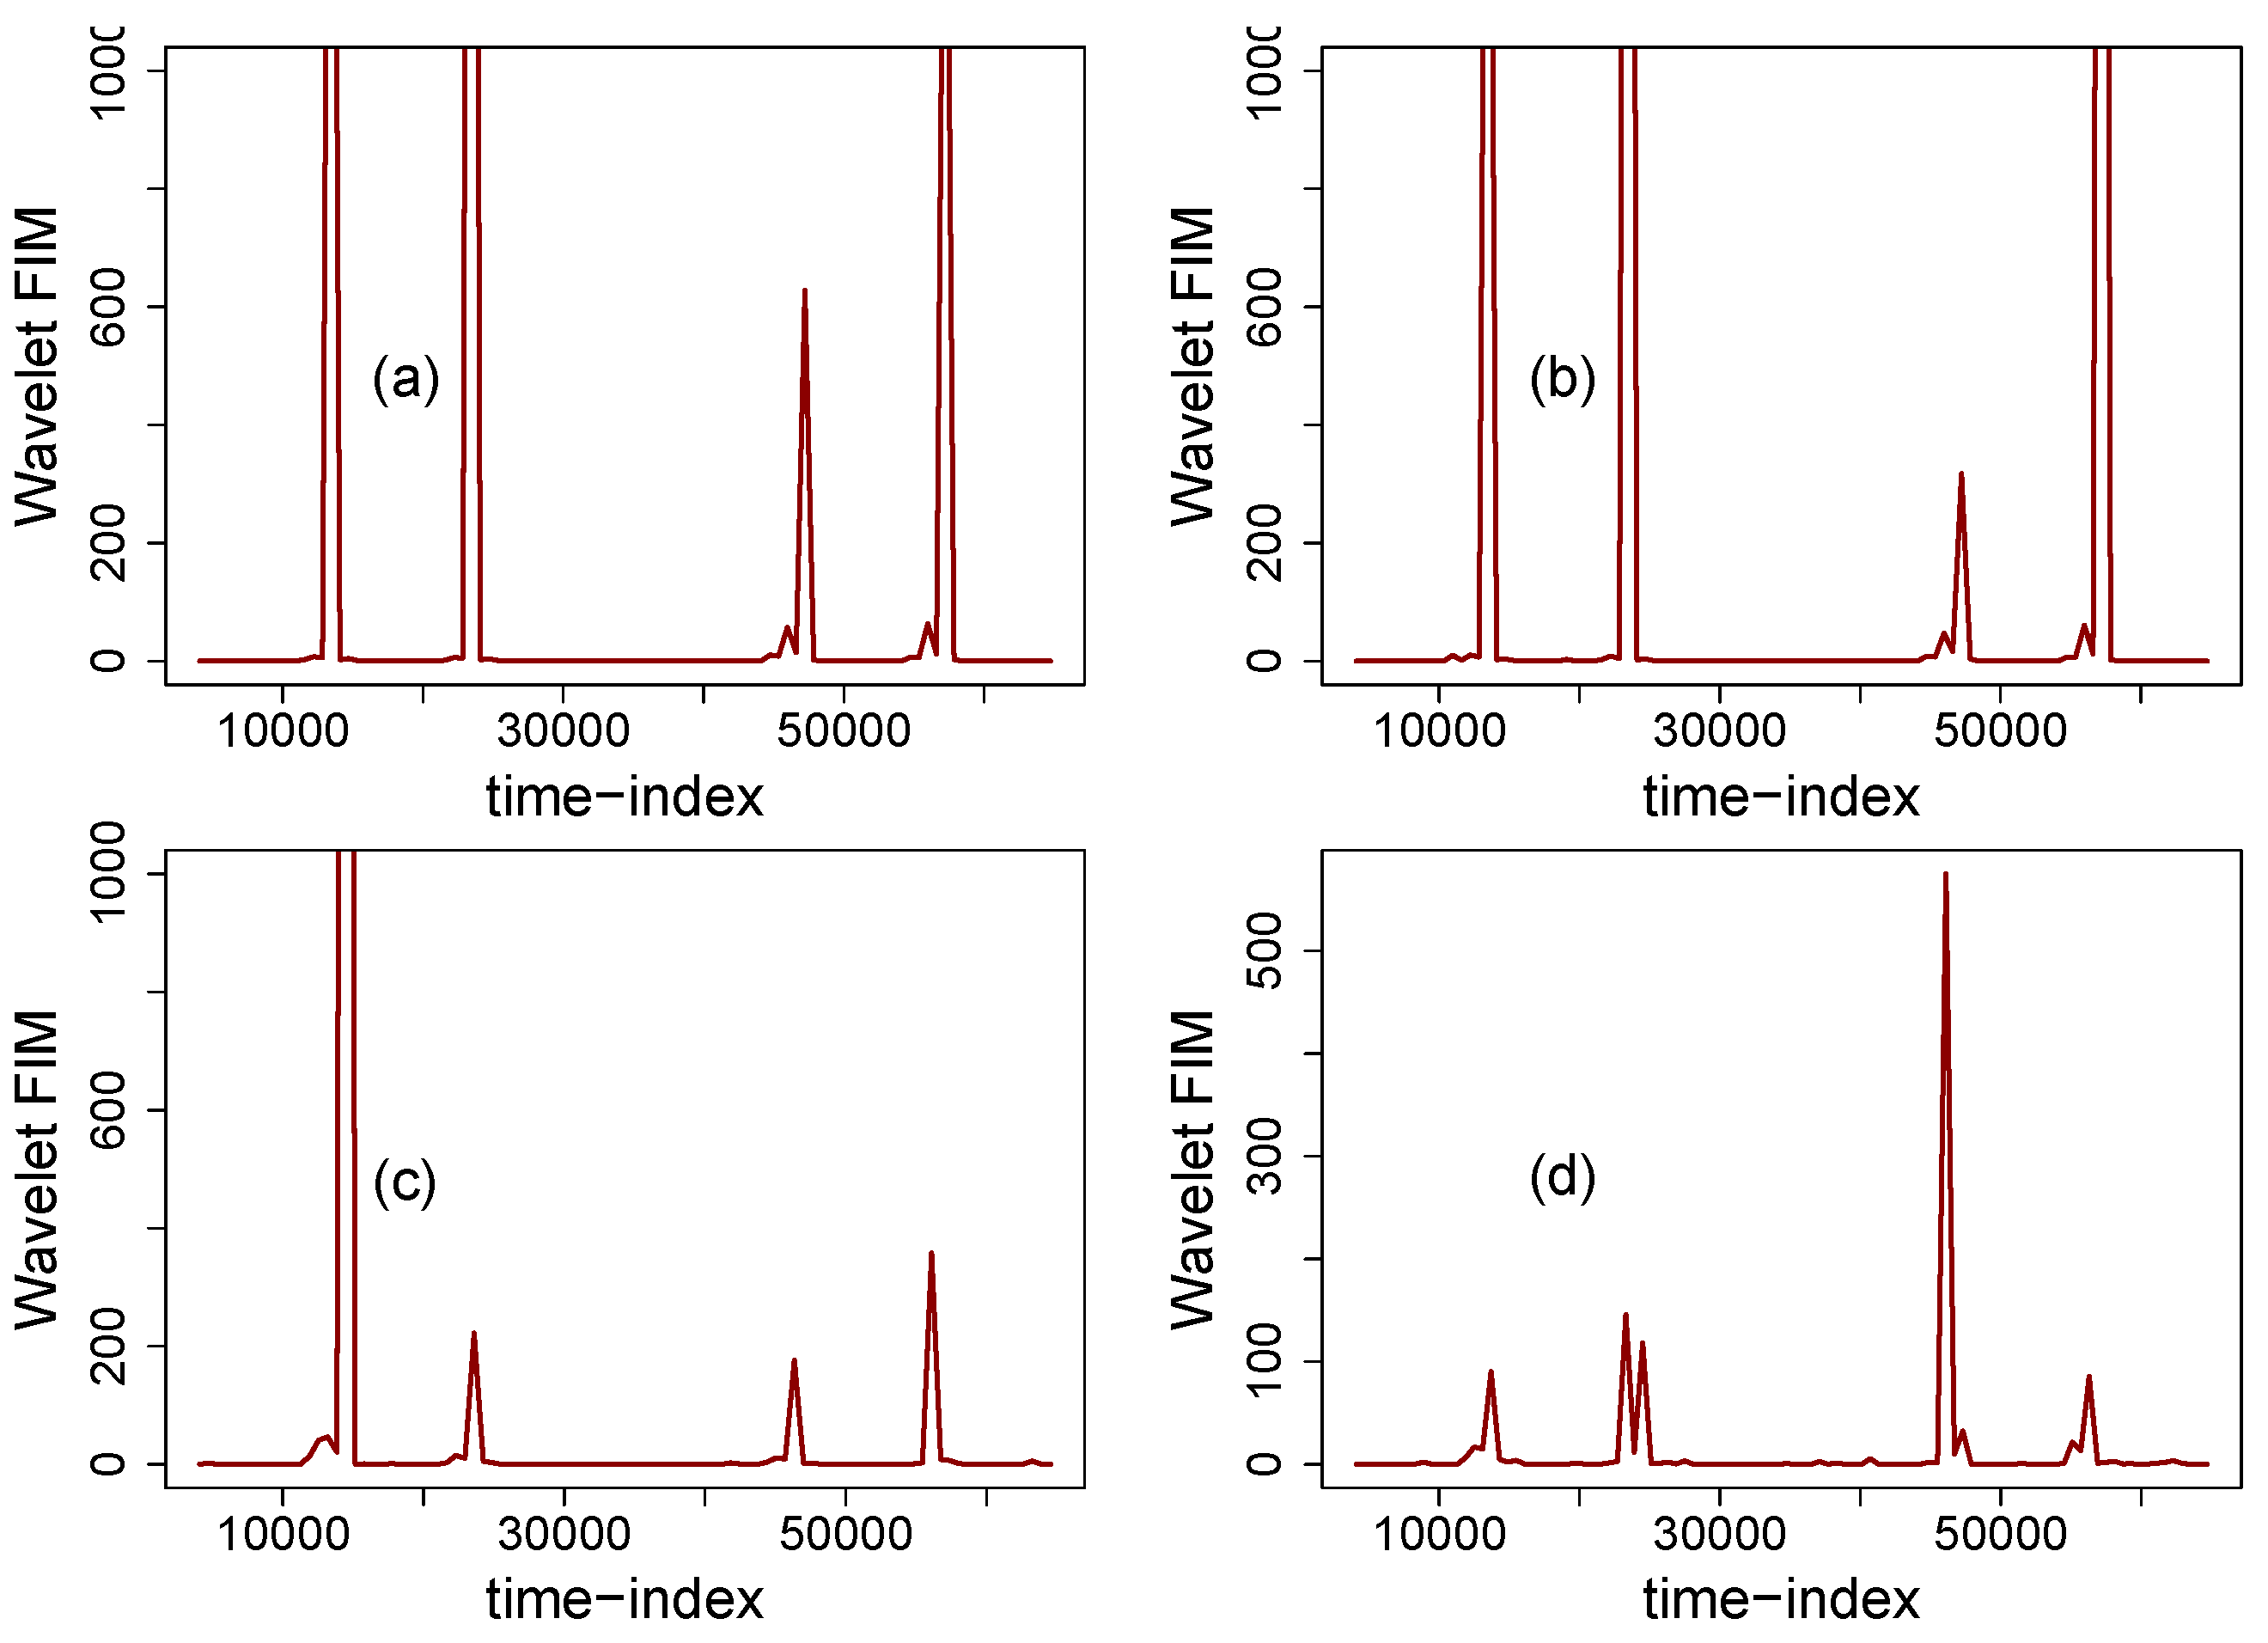
The selection of such level-shifts was motivated by experimental studies performed in [36,37]. Figure 5 depicts the wavelet Fisher’s information of anticorrelated fGn signals with multiple mean level-shifts. Figure 5a displays the information measure for a fGn signal with Hurst-index H = 0 . 2 . Note that in this case, the level-shifts are effectively detected as well as located in time, i.e., wavelet FIM allows not only to detect the presence of level-shifts in anticorrelated signals but also to provide a methodology for its location. Figure 5b,c presents the wavelet FIM of fGn signals (embedded with multiple mean breaks) with H = 0 . 3 and H = 0 . 4 respectively. It is straightforward to note that the wavelet FIM of these signals presents similar behaviour than the one observed in plot (a). The location of the level-shifts are also effectively indicated by the use of wavelet FIM. Therefore, based on these results the level-shifts embedded in anticorrelated fractional Gaussian noise signals ( H < 0 . 5 ) are effectively detected and located by the use of wavelet FIM. Figure 5 depicts the dynamics of wavelet FIM for a totally disordered signal, white Gaussian noise. White Gaussian noise’s (fGn with H = 0 . 5 ) wavelet FIM presents four peaks which can be associated to the presence of the level-shift embedded to their structure.
Figure 5. Wavelet FIM of anticorrelated stationary fractional Gaussian noises with multiple mean level-shifts. (a) fGn with H = 0.2 ; (b) fGn with H = 0.3 ; (c) fGn with H = 0.4 and the wavelet FIM of a fGn with H = 0.5 is displayed in (d).
Entropy 13 01648 g005
Note that the amplitudes are weaker than in the previous plots, however, they are sufficient to detect the presence and location of a level-shift. Figure 6 displays the wavelet Fisher’s information for correlated fractal noises with multiple mean breaks. Figure 6a displays the wavelet Fisher’s information for a fractional noise with H = 0 . 6 . Note that it is straightforward to detect and locate the presence of the level-shifts embedded in this signal. Note also that neighboring peaks are shown in the analysis, however they play a minor role in affecting the detection process. Similar dynamics in the Fisher’s information are obtained when analyzing a fractal noise with H = 0 . 7 (Figure 6b). For a fractional Gaussian noise with stronger persistence ( H = 0 . 8 ), wavelet FIM detects the first two level-shifts added to the fGn signal and then displays a peak which is not related to the presence of a level-shift in the signal. The third level-shift is effectively detected and the fourth is no longer detected. Note, however, that the level-shifts studied in this article are weak ( Var X t / 2 ) and thus can be deduced that the correlation structure of a fGn signal has an impact on detecting level-shifts. Incrementing the amplitude of the level-shifts increments the detection capabilities of wavelet FIM. For a fGn signal which is in the border of non-stationary behaviour ( H = 0 . 9 ), wavelet FIM (Figure 6d) fails to detect level-shifts. From the above, it is concluded that wavelet FIM allows to detect single weak level-shifts embedded in fGn signals and for the case of multiple mean breaks, wavelet FIM effectively detects weak level shifts provided that H 0 . 8 . For fGn signals with stronger correlation ( H > 0 . 8 ), wavelet FIM fails in detecting weak level-shifts but effectively detects stronger level-shifts ( μ = Var X t > 1 ).
Figure 6. Wavelet FIM of correlated stationary fractional Gaussian noises with multiple mean level-shifts. (a) fGn with H = 0.6 ; (b) fGn with H = 0.7 ; (c) fGn with H = 0.8 and the wavelet FIM of a fGn with H = 0.9 is displayed in (d).
Entropy 13 01648 g006

6. Conclusions

In this article, wavelet Fisher’s information measure (wavelet FIM) was defined and its properties for 1 / f α processes derived. It was shown that wavelet Fisher’s information measure describes the complexities associated to scaling signals and provides a powerful tool for their analysis. Based on a derivation of a closed form expression of Wavelet Fisher’s information, it was demonstrated that it is exponentially increasing for non-stationary signals and almost constant for differences of fractional Gaussian noises. Based on this behaviour, several potential application were highlighted and particular emphasis was put on detecting mean level-shifts embedded in anti-correlated as well as correlated fractional noises. Experimental studies demonstrate that wavelet FIM allows to effectively detect single weak level-shifts embedded in stationary fractal noises independently of the degree of persistence or anti-persistence. For the multiple mean level-shift case, wavelet FIM performs well for anti-correlated signals but for correlated ones ( H > 0 . 8 ) it is affected by the strong correlation of the signal and by the fact that the signal is approaching non-stationary behaviour. However, by increasing the amplitude of the level shift ( μ > Var X t / 2 ), the detection power of wavelet FIM is increased. Wavelet FIM therefore provides a novel, alternative and robust tool for the analysis and estimation of anti-correlated and correlated fractal noises.

Acknowledgements

The present article was jointly funded by the National Council of Science and Technology (CONACYT) under grant 47609, FOMIX-COQCYT grant No 126031 and University of Caribe internal funds for the support of research groups (CAs). J. Ramírez-Pacheco thanks the support from CINVESTAV-IPN Unidad Guadalajara.

References

  1. Beran, J. Statistics for Long-Memory Processes; Chapman & Hall/CRC Press: Boca Raton, FL, USA, 1994. [Google Scholar]
  2. Caccia, D.C.; Percival, D.B.; Cannon, M.; Raymond, G.; Bassingthwaighte, J.B. Analyzing exact fractal time series: Evaluating dispersional analysis and rescaled range methods. Phys. A 1997, 246, 609–632. [Google Scholar] [CrossRef]
  3. Thurner, S.; Lowen, S.B.; Feurstein, M.C.; Heneghan, C.; Feichtinger, H.G.; Teich, M.C. Analysis, synthesis and estimation of fractal-rate stochastic point processes. Fractals 1997, 5, 565–595. [Google Scholar] [CrossRef]
  4. Samorodnitsky, G.; Taqqu, M. Stable Non-Gaussian Random Processes: Stochastic Models with Infinite Variance; Chapman & Hall/CRC Press: Boca Raton, FL, USA, 1994. [Google Scholar]
  5. Frieden, B.R.; Hughes, R.J. Spectral 1/f noise derived from extremized physical information. Phys. Rev. E 1994, 49, 2644–2649. [Google Scholar] [CrossRef]
  6. Leland, W.E.; Taqqu, M.S.; Willinger, W.; Wilson, D. On the self-similar nature of ethernet traffic (extended version). IEEE/ACM Trans. Netw. 1994, 2, 1–15. [Google Scholar] [CrossRef]
  7. Perez, D.G.; Zunino, L.; Garavaglia, M.; Rosso, O.A. Wavelet entropy and fractional brownian motion time series. Phys. A 2006, 365, 282–288. [Google Scholar] [CrossRef]
  8. Zunino, L.; Perez, D.G.; Garavaglia, M.; Rosso, O.A. Wavelet entropy of stochastic processes. Phys. A 2007, 379, 503–512. [Google Scholar] [CrossRef]
  9. Serinaldi, F. Use and misuse of some Hurst parameter estimators applied to stationary and non-stationary financial time series. Phys. A 2010, 389, 2770–2781. [Google Scholar] [CrossRef]
  10. Shen, H.; Zhu, Z.; Lee, T. Robust estimation of the self-similarity parameter in network traffic using the wavelet transform. Signal Process. 2007, 87, 2111–2124. [Google Scholar] [CrossRef]
  11. Stoev, S; Taqqu, M.S.; Park, C.; Marron, J.S. On the wavelet spectrum diagnostic for hurst parameter estimation in the analysis of internet traffic. Comput. Netw. 2005, 48, 423–445. [Google Scholar] [CrossRef]
  12. Kowalski, A.M.; Plastino, A.; Casas, M. Generalized complexity and classical quantum transition. Entropy 2009, 11, 111–123. [Google Scholar] [CrossRef] [Green Version]
  13. Ramirez-Pacheco, J.; Torres-Roman, D. Cosh window behaviour of wavelet Tsallis q-entropies in 1/fα signals. Electron. Lett. 2011, 47, 186–187. [Google Scholar] [CrossRef]
  14. Percival, D.B. Stochastic models and statistical analysis for clock noise. Metrologia 2003, 40, S289–S304. [Google Scholar] [CrossRef]
  15. Lee, I.W.C.; Fapojuwo, A.O. Stochastic processes for computer network traffic modelling. Comput. Commun. 2005, 29, 1–23. [Google Scholar] [CrossRef]
  16. Flandrin, P. Wavelet analysis and synthesis of fractional brownian motion. IEEE Trans. Inf. Theory 1992, 38, 910–917. [Google Scholar] [CrossRef]
  17. Malamud, B.D.; Turcotte, D.L. Self-affine time series: Measures of weak and strong persistence. J. Stat. Plann. Inference 1999, 80, 173–196. [Google Scholar] [CrossRef]
  18. Eke, A.; Hermán, P.; Bassingthwaighte, J.B.; Raymond, G.; Percival, D.B.; Cannon, M.; Balla, I.; Ikrényi, C. Physiological time series: Distinguishing fractal noises and motions. Pflugers Arch. 2000, 439, 403–415. [Google Scholar] [CrossRef] [PubMed]
  19. Lowen, S.B.; Teich, M.C. Estimation and simulation of fractal stochastic point processes. Fractals 1995, 3, 183–210. [Google Scholar] [CrossRef]
  20. Hudgins, L.; Friehe, C.A.; Mayer, M.E. Wavelet transforms and atmospheric turbulence. Phys. Rev. Lett. 1993, 71, 3279–3283. [Google Scholar] [CrossRef] [PubMed]
  21. Cohen, A.; Kovacevic, J. Wavelets: The mathematical background. Proc. IEEE 1996, 84, 514–522. [Google Scholar] [CrossRef]
  22. Pesquet-Popescu, B. Statistical properties of the wavelet decomposition of certain non-gaussian self-similar processes. Signal Process. 1999, 75, 303–322. [Google Scholar] [CrossRef]
  23. Abry, P.; Veitch, D. Wavelet analysis of long-range dependent traffic. IEEE Trans. Inf. Theory 1998, 44, 2–15. [Google Scholar] [CrossRef]
  24. Veitch, D; Abry, P. A wavelet based joint estimator of the parameters of long-range dependence. IEEE Trans. Inf. Theory 1999, 45, 878–897. [Google Scholar] [CrossRef]
  25. Eke, A.; Hermán, P.; Kocsis, L; Kozak, L.R. Fractal characterization of complexity in temporal physiological signals. Physiol. Meas. 2002, 23, R1–R38. [Google Scholar] [CrossRef] [PubMed]
  26. Quiroga, R.Q.; Rosso, O.A.; Basar, E.; Schurmann, M. Wavelet entropy in event-related potentials: A new method shows ordering of EEG oscillations. Biol. Cybern. 2001, 84, 291–299. [Google Scholar] [CrossRef] [PubMed]
  27. Martin, M.T.; Penini, F.; Plastino, A. Fisher’s information and the analysis of complex signals. Phys. A 1999, 256, 173–180. [Google Scholar] [CrossRef]
  28. Martin, M.T.; Perez, J.; Plastino, A. Fisher information and non-linear dynamics. Phys. A 2001, 291, 523–532. [Google Scholar] [CrossRef]
  29. Telesca, L.; Lapenna, V.; Lovallo, M. Fisher information measure of geoelectrical signals. Phys. A 2005, 351, 637–644. [Google Scholar] [CrossRef]
  30. Romera, E.; Sánchez-Moreno, P.; Dehesa, J.S. The Fisher information of single-particle systems with a central potential. Chem. Phys. Lett. 2005, 414, 468–472. [Google Scholar] [CrossRef]
  31. Luo, S. Quantum fisher information and uncertainty relation. Lett. Math. Phys. 2000, 53, 243–251. [Google Scholar] [CrossRef]
  32. Vignat, C.; Bercher, J.-F. Analysis of signals in the fisher-shannon information plane. Phys. Lett. A 2003, 312, 27–33. [Google Scholar] [CrossRef]
  33. Deligneres, D.; Ramdani, S.; Lemoine, L.; Torre, K.; Fortes, M.; Ninot, G. Fractal analyses of short time series: A re-assessment of classical methods. J. Math. Psychol. 2006, 50, 525–544. [Google Scholar] [CrossRef]
  34. Castiglioni, P.; Parato, G.; Civijian, A; Quintin, L.; di Rienzo, M. Local scale exponents of blood pressure and heart rate variability by detrended fluctuation analysis: Effects of posture, exercise and aging. IEEE Trans. Biomed. Eng. 2009, 56, 675–684. [Google Scholar] [CrossRef] [PubMed]
  35. Esposti, F.; Ferrario, M.; Signorini, M.G. A blind method for the estimation of the hurst exponent in time series: Theory and methods. Chaos 2008, 18, 033126. [Google Scholar] [CrossRef] [PubMed]
  36. Rea, W.; Reale, M.; Brown, J.; Oxley, L. Long-memory or shifting means in geophysical time series? Math. Comput. Simul. 2011, 81, 1441–1453. [Google Scholar] [CrossRef]
  37. Capelli, C.; Penny, R.N.; Rea, W. Detecting multiple mean breaks at unknown points with atheoretical regression trees. Math. Comput. Simul. 2008, 78, 351–356. [Google Scholar] [CrossRef]
  38. Davies, R.B.; Harte, D.S. Tests for hurst effect. Biometrika 1987, 74, 95–101. [Google Scholar] [CrossRef]
  39. Cannon, M.J.; Percival, D.B.; Caccia, D.C.; Raymond, G.M.; Bassingthwaighte, J.B. Evaluating scaled windowed variance for estimating the hurst coefficient of time series. Phys. A 1996, 241, 606–626. [Google Scholar] [CrossRef]