Information Theory in Scientific Visualization

Abstract
:
1. Introduction
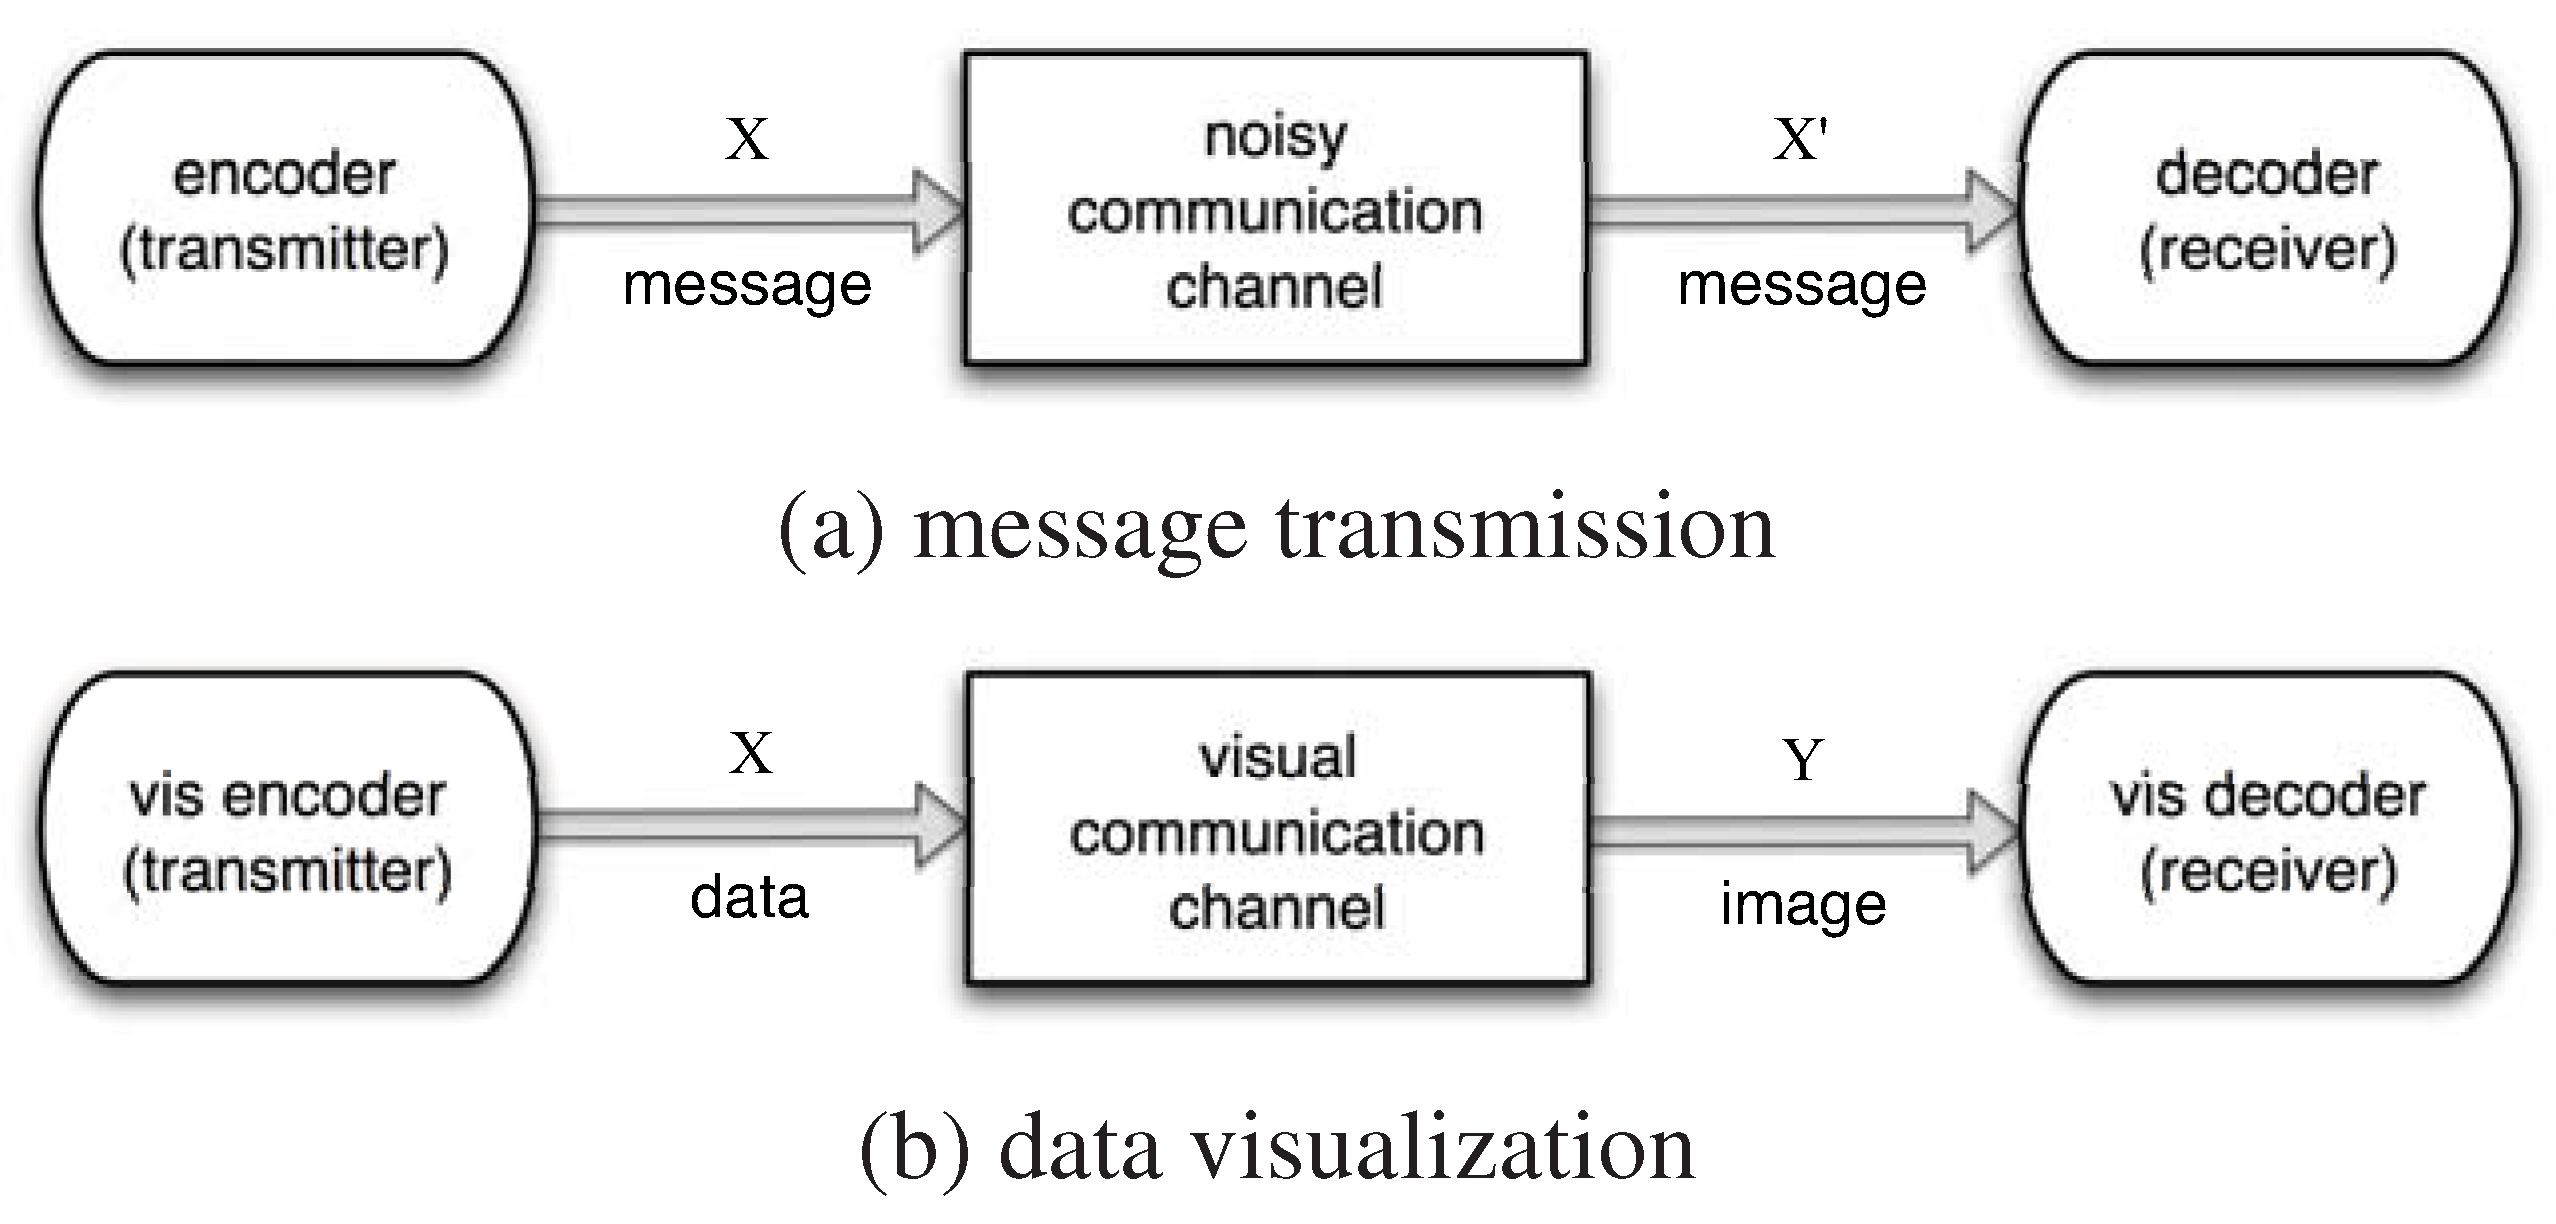
2. Visualization and Information Channel
3. Concepts of Information Theory
3.1. Entropy
3.2. Joint Entropy and Relative Entropy
3.3. Mutual Information and Conditional Entropy
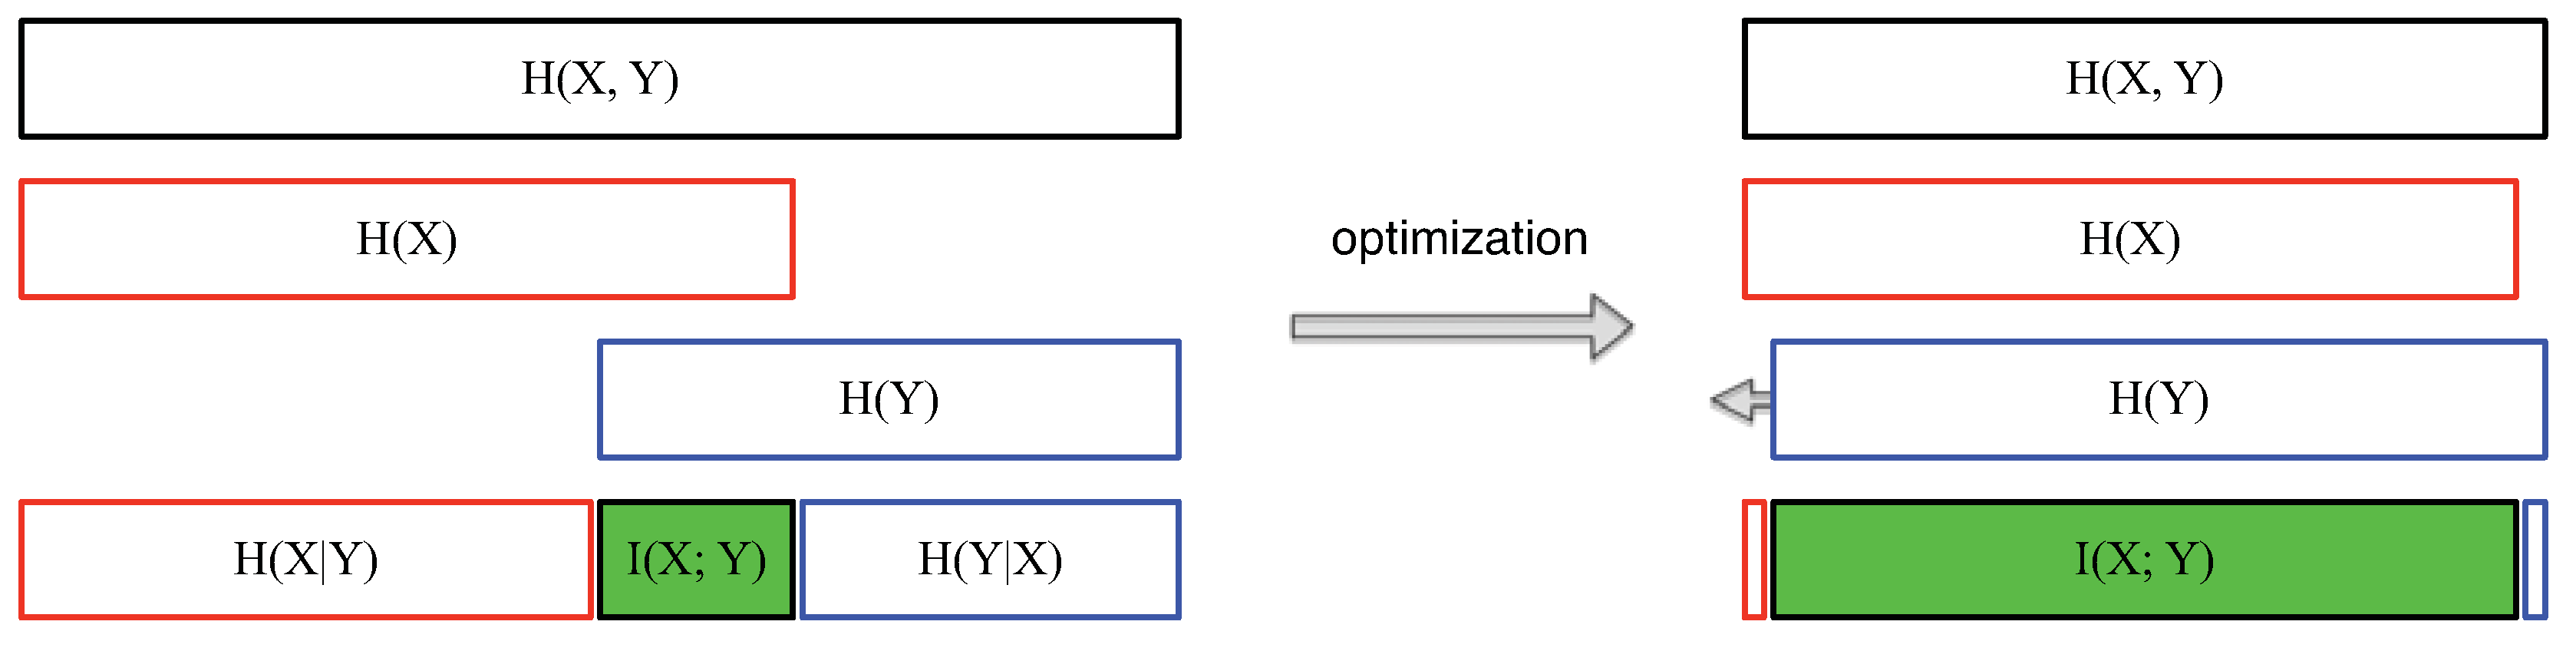
3.4. Relationships among Information Theory Concepts
4. Applications of Information Theory in Scientific Visualization
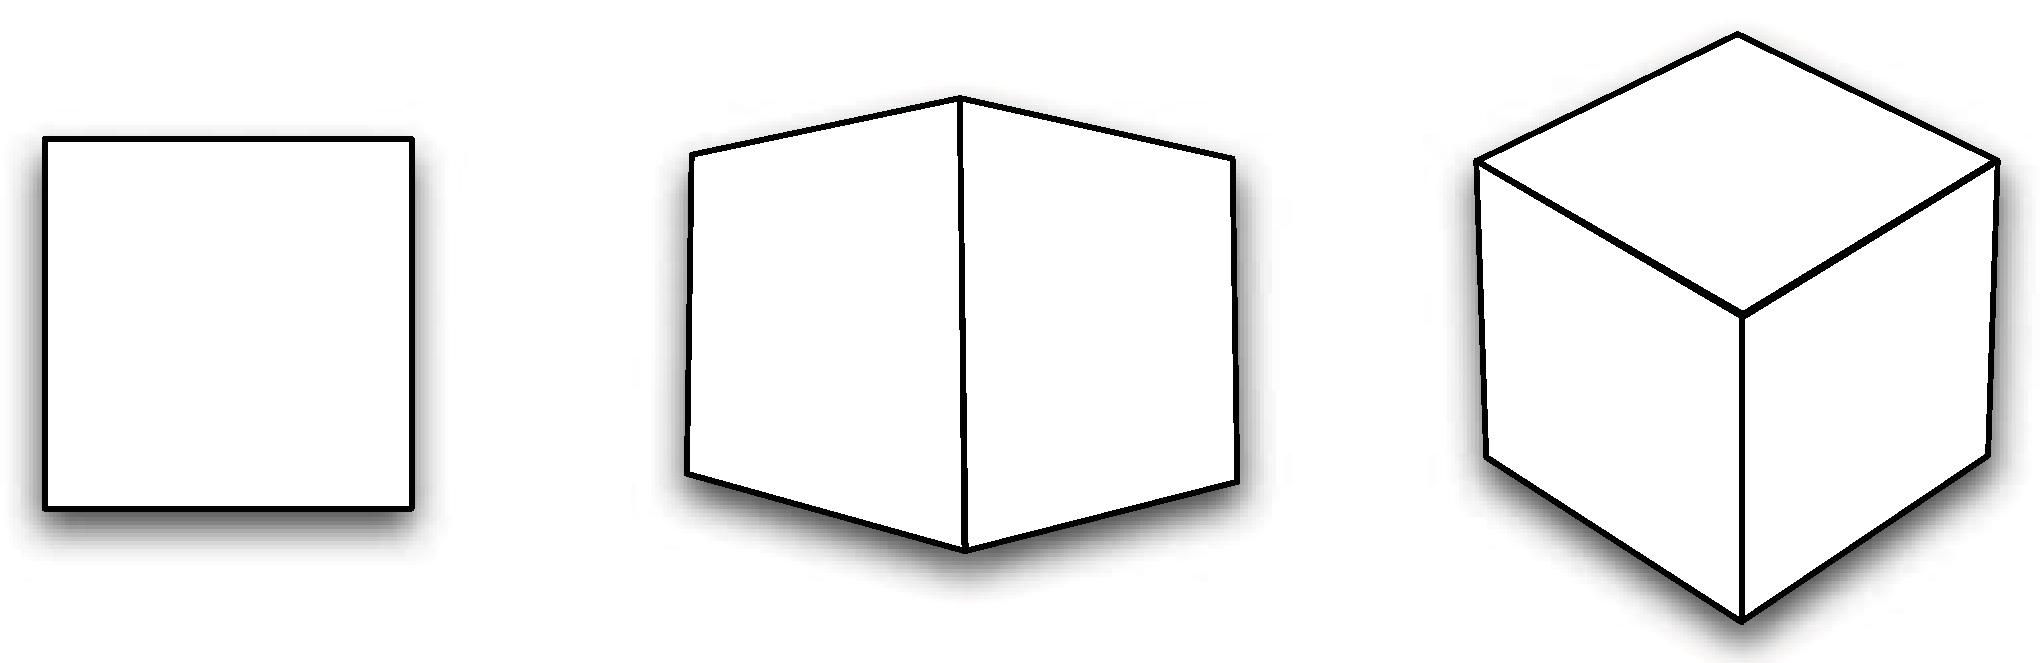
4.1. View Selection for Volumetric Data
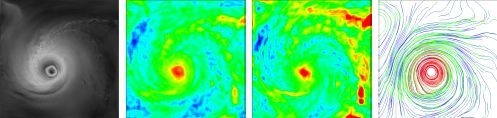
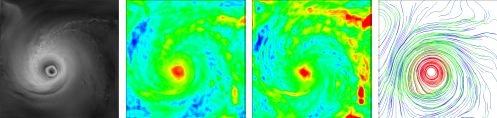
4.2. Streamline Seeding and Selection
4.3. Transfer Function for Multimodal Data
4.4. Selection of Representative Isosurfaces
4.5. LOD Selection for Multiresolution Volume Visualization
4.6. Time-varying and Multivariate Data Analysis
4.7. Information Channel between Objects and Viewpoints
5. Information Theory in Imaging and Graphics
6. Outlook for Future Research
Acknowledgements
References
- Cover, T.M.; Thomas, J.A. Elements of Information Theory, 2nd ed.; Wiley-Interscience: Hoboken, NJ, USA, 2006. [Google Scholar]
- Purchase, H.C.; Andrienko, N.; Jankun-Kelly, T.J.; Ward, M. Theoretical foundations of information visualization. In Information Visualization: Human-centered Issues and Perspectives; Kerren, A., Stasko, J.T., Fekete, J.D., North, C., Eds.; Springer-Verlag: Berlin/ Heidelberg, Germany, 2008; pp. 46–64. [Google Scholar]
- Chen, M.; Jänicke, H. An Information-theoretic framework for visualization. IEEE Trans. Vis. Comput. Graph. 2010, 16, 1206–1215. [Google Scholar] [CrossRef] [PubMed]
- Wang, C.; Yu, H.; Ma, K.L. Importance-driven time-varying data visualization. IEEE Trans. Vis. Comput. Graph. 2008, 14, 1547–1554. [Google Scholar] [CrossRef] [PubMed]
- Wang, C.; Ma, K.L. A statistical approach to volume data quality assessment. IEEE Trans. Vis. Comput. Graph. 2008, 14, 590–602. [Google Scholar] [CrossRef] [PubMed]
- Lin, J. Divergence measures based on the Shannon entropy. IEEE Trans. Inf. Theory 1991, 37, 145–151. [Google Scholar] [CrossRef]
- Bordoloi, U.D.; Shen, H.W. View selection for volume rendering. In Proceedings of IEEE Visualization Conference, Minneapolis, MN, USA, October 2005; pp. 487–494.
- Jänicke, H.; Böttinger, M.; Mikolajewicz, U.; Scheuermann, G. Visual exploration of climate variability changes using wavelet Analysis. IEEE Trans. Vis. Comput. Graph. 2009, 15, 1375–1382. [Google Scholar] [CrossRef] [PubMed]
- Bruckner, S.; Möller, T. Isosurface similarity maps. Comput. Graph. Forum 2010, 29, 773–782. [Google Scholar] [CrossRef]
- Takahashi, S.; Fujishiro, I.; Takeshima, Y.; Nishita, T. A feature-driven approach to locating optimal viewpoints for volume visualization. In Proceedings of IEEE Visualization Conference, Minneapolis, MN, USA, October 2005; pp. 495–502.
- Ji, G.; Shen, H.W. Dynamic view selection for time-varying volumes. IEEE Trans. Vis. Comput. Graph. 2006, 12, 1109–1116. [Google Scholar] [PubMed]
- Xu, L.; Lee, T.Y.; Shen, H.W. An information-theoretic framework for flow visualization. IEEE Trans. Vis. Comput. Graph. 2010, 16, 1216–1224. [Google Scholar] [PubMed]
- Furuya, S.; Itoh, T. A streamline selection technique for integrated scalar and vector visualization. In Proceedings of the IEEE Visualization Conference Poster Compendium, Columbus, OH, USA, October 2008.
- Marchesin, S.; Chen, C.K.; Ho, C.; Ma, K.L. View-dependent streamlines for 3D vector fields. IEEE Trans. Vis. Comput. Graph. 2010, 16, 1578–1586. [Google Scholar] [CrossRef] [PubMed]
- Haidacher, M.; Bruckner, S.; Kanitsar, A.; Gröller, M.E. Information-based transfer functions for multimodal visualization. In Proceedings of Eurographics Workshop on Visual Computing for Biomedicine, Delft, The Netherlands, October 2008; pp. 101–108.
- Wang, C.; Shen, H.W. LOD map—A visual interface for navigating multiresolution volume visualization. IEEE Trans. Vis. Comput. Graph. 2006, 12, 1029–1036. [Google Scholar] [CrossRef] [PubMed]
- Jänicke, H.; Wiebel, A.; Scheuermann, G.; Kollmann, W. Multifield visualization using local statistical complexity. IEEE Trans. Vis. Comput. Graph. 2007, 13, 1384–1391. [Google Scholar]
- Viola, I.; Feixas, M.; Sbert, M.; Gröller, M.E. Importance-driven focus of attention. IEEE Trans. Vis. Comput. Graph. 2006, 12, 933–940. [Google Scholar] [CrossRef] [PubMed]
- Sbert, M.; Plemenos, D.; Feixas, M.; González, F. Viewpoint quality: Measures and applications. In Proceedings of Eurographics Workshop on Computational Aesthetics in Graphics, Visualization and Imaging, Girona, Spain, May 2005; 2005; pp. 185–192. [Google Scholar]
- Vázquez, P.P.; Feixas, M.; Sbert, M.; Heidrich, W. Viewpoint selection using viewpoint entropy. In Proceedings of Vision, Modeling, and Visualization Conference, Stuttgart, Germany, November 2001; pp. 273–280.
- Ruiz, M.; Boada, I.; Feixas, M.; Sbert, M. Viewpoint information channel for illustrative volume rendering. Comput. Graph. 2010, 34, 351–360. [Google Scholar] [CrossRef]
- Cheng, H.D.; Chen, Y.H.; Sun, Y. A novel fuzzy entropy approach to image enhancement and thresholding. Signal Process. 1999, 75, 277–301. [Google Scholar] [CrossRef]
- Viola, P.A.; Wells, W.M., III. Alignment by maximization of mutual information. Int. J. Comput. Vision 1997, 24, 137–154. [Google Scholar] [CrossRef]
- Pluim, J.P.W.; Maintz, J.B.A.; Viergever, M.A. Mutual-information-based registration of medical images. IEEE Trans. Med. Imag. 2003, 22, 986–1004. [Google Scholar] [CrossRef] [PubMed]
- Maes, F.; Collignon, A.; Vandermeulen, D.; Marchal, G.; Suetens, P. Multimodality image registration by maximization of mutual information. IEEE Trans. Med. Imag. 1997, 16, 187–198. [Google Scholar] [CrossRef] [PubMed]
- Thévenaz, P.; Unser, M. Optimization of mutual information for multiresolution image registration. IEEE Trans. Image Process. 2000, 9, 2083–2099. [Google Scholar] [PubMed]
- Kim, J.; Fisher, J.W., III; Yezzi, A.; Cetin, M.; Willsky, A.S. A nonparametric statistical method for image segmentation using information theory and curve evolution. IEEE Trans. Image Process. 2005, 14, 1486–1502. [Google Scholar] [PubMed]
- Wang, Z.; Vemuri, B.C. DTI Segmentation using an information theoretic tensor dissimilarity measure. IEEE Trans. Med. Imag. 2005, 24, 1267–1277. [Google Scholar] [CrossRef] [PubMed]
- Sbert, M.; Feixas, M.; Rigau, J.; Chover, M.; Viola, I. Information Theory Tools for Computer Graphics; Morgan & Claypool Publishers: San Rafael, CA, USA, 2009. [Google Scholar]
- Feixas, M.; del Acebo, E.; Bekaert, P.; Sbert, M. An information theory framework for the analysis of scene complexity. Comput. Graph. Forum 1999, 18, 95–106. [Google Scholar] [CrossRef]
- Rigau, J.; Feixas, M.; Sbert, M. New contrast measures for pixel supersampling. In Proceedings of Computer Graphics International, Bradford, UK, July 2002; pp. 439–451.
- Wong, L.; Dumont, C.; Abidi, M. Next best view system in a 3-D modeling task. In Proceedings of International Symposium on Computational Intelligence in Robotics and Automation, Monterey, CA, USA, November 1999; pp. 306–311.
- Fleishman, S.; Cohen-Or, D.; Lischinski, D. Automatic camera placement for image-based modeling. Comput. Graph. Forum 2000, 19, 101–110. [Google Scholar] [CrossRef]
- Arbel, A.; Ferrie, F.P. Viewpoint selection by navigation through entropy maps. In Proceedings of International Conference on Computer Vision, Kerkyra, Corfu, Greece, September 1999; pp. 248–254.
- He, L.W.; Cohen, M.F.; Salesin, D.H. The virtual cinematographer: A paradigm for automatic real-time camera control and directing. In Proceedings of ACM SIGGRAPH Conference, New Orleans, LA, USA, August 1996; pp. 217–224.
- Vázquez, P.P.; Feixas, M.; Sbert, M.; Heidrich, W. Automatic view selection using viewpoint entropy and its applications to image-based modelling. Comput. Graph. Forum 2003, 22, 689–700. [Google Scholar] [CrossRef]
- Gumhold, S. Maximum entropy light source placement. In Proceedings of IEEE Visualization Conference, Boston, MA, USA, October 2002; pp. 275–282.
- González, F.; Sbert, M.; Feixas, M. Viewpoint-based ambient occlusion. IEEE Comput. Graph. Appl. 2008, 28, 44–51. [Google Scholar] [CrossRef] [PubMed]
- Castelló, P.; Sbert, M.; Chover, M.; Feixas, M. Viewpoint-driven simplification using mutual information. Comput. Graph. 2008, 32, 451–463. [Google Scholar] [CrossRef]
- Feixas, M.; Sbert, M.; González, F. A unified information-theoretic framework for viewpoint selection and mesh saliency. ACM Trans. Graph. 2009, 6, 1–23. [Google Scholar] [CrossRef]
- Rigau, J.; Feixas, M.; Sbert, M. Informational aesthetics measures. IEEE Comput. Graph. Appl. 2008, 28, 24–34. [Google Scholar] [CrossRef] [PubMed]
- Silverman, B.W. Density Estimation for Statistics and Data Analysis; Chapman & Hall/CRC: London, UK, 1986. [Google Scholar]
- Scott, D.W. Multivariate Density Estimation: Theory, Practice, and Visualization; Wiley-Interscience: New York, NY, USA, 1992. [Google Scholar]
© 2011 by the authors; licensee MDPI, Basel, Switzerland. This article is an open access article distributed under the terms and conditions of the Creative Commons Attribution license (http://creativecommons.org/licenses/by/3.0/).
Share and Cite
Wang, C.; Shen, H.-W. Information Theory in Scientific Visualization. Entropy 2011, 13, 254-273. https://doi.org/10.3390/e13010254
Wang C, Shen H-W. Information Theory in Scientific Visualization. Entropy. 2011; 13(1):254-273. https://doi.org/10.3390/e13010254
Chicago/Turabian StyleWang, Chaoli, and Han-Wei Shen. 2011. "Information Theory in Scientific Visualization" Entropy 13, no. 1: 254-273. https://doi.org/10.3390/e13010254
APA StyleWang, C., & Shen, H.-W. (2011). Information Theory in Scientific Visualization. Entropy, 13(1), 254-273. https://doi.org/10.3390/e13010254