by
Mike Chu 1,2,*, Junqiang Sun 1,3 and Menghua Wang 1
and Menghua Wang 1
1
NOAA/NESDIS Center for Satellite Applications and Research, E/RA3, 5830 University Research Ct., College Park, MD 20740, USA
2
Cooperative Institute for Research in the Atmosphere, Colorado State University, Fort Collins, CO 80523, USA
3
Global Science and Technology, 7855 Walker Drive, Suite 200, Greenbelt, MD 20770, USA
Remote Sens. 2018, 10(3), 413; https://doi.org/10.3390/rs10030413 - 8 Mar 2018
Cited by 3 | Viewed by 4771
Abstract
▼
Show Figures
A refined intersensor comparison study is carried out to evaluate the radiometric stability of the 2257 nm channel (M11) of the first Visible Infrared Imaging Radiometer Suite (VIIRS) aboard the Suomi National Polar-orbiting Partnership (SNPP) satellite. This study is initiated as part of
[...] Read more.
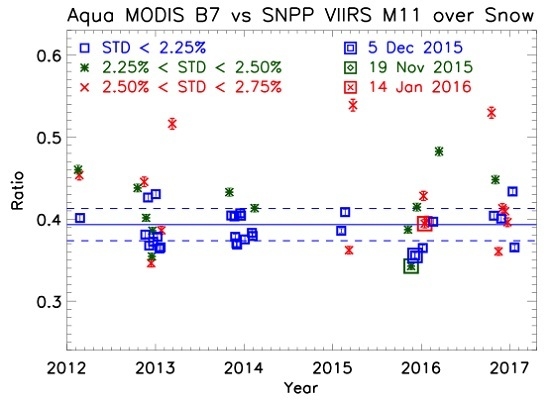
A refined intersensor comparison study is carried out to evaluate the radiometric stability of the 2257 nm channel (M11) of the first Visible Infrared Imaging Radiometer Suite (VIIRS) aboard the Suomi National Polar-orbiting Partnership (SNPP) satellite. This study is initiated as part of the examination into the performance of key shortwave infrared (SWIR) bands for SNPP VIIRS ocean color data processing and applications, with Band M11 playing key role over turbid and inland waters. The evaluation utilizes simultaneous nadir overpasses (SNOs) to compare SNPP VIIRS Band M11 against Band 7 of the MODerate-resolution Imaging Spectroradiometer (MODIS) in the Aqua satellite over concurrently observed scenes. The standard result of the radiance comparison is a seemingly uncontrolled and inconsistent time series unsuitable for further analyses, in great contrast to other matching band-pairs whose radiometric comparisons are typically stable around 1.0 within 1% variation. The mismatching relative spectral response (RSR) between the two respective bands, with SNPP VIIRS M11 at 2225 to 2275 nm and Aqua MODIS B7 at 2125 to 2175 nm, is demonstrated to be the cause of the large variation because of the different dependence of the spectral responses of the two bands over identical scenes. A consistent radiometric comparison time series, however, can be extracted from SNO events that occur over snowy surfaces. A customized selection and analysis procedure successfully identifies the snowy scenes within the SNO events and builds a stable comparison time series. Particularly instrumental for the success of the comparison is the use of the half-kilometer spatial resolution data of Aqua MODIS B7 that significantly enhances the statistics. The final refined time series of Aqua MODIS B7 radiance over the SNPP VIIRS M11 radiance is stable at around 0.39 within 2.5% showing no evidence of drift. The radiometric ratio near 0.39 suggests the strong presence of medium-grained snow of a mixed-snow condition in those SNO scenes leading to successful comparison. The multi-year stability indicates the correctness of the on-orbit RSB calibration of SNPP VIIRS M11 whose result does not suffer from long-term drift.
Full article
Graphical abstract
