Co-Administered Polymeric Nano-Antidotes for Improved Photo-Triggered Response in Glioblastoma


Abstract
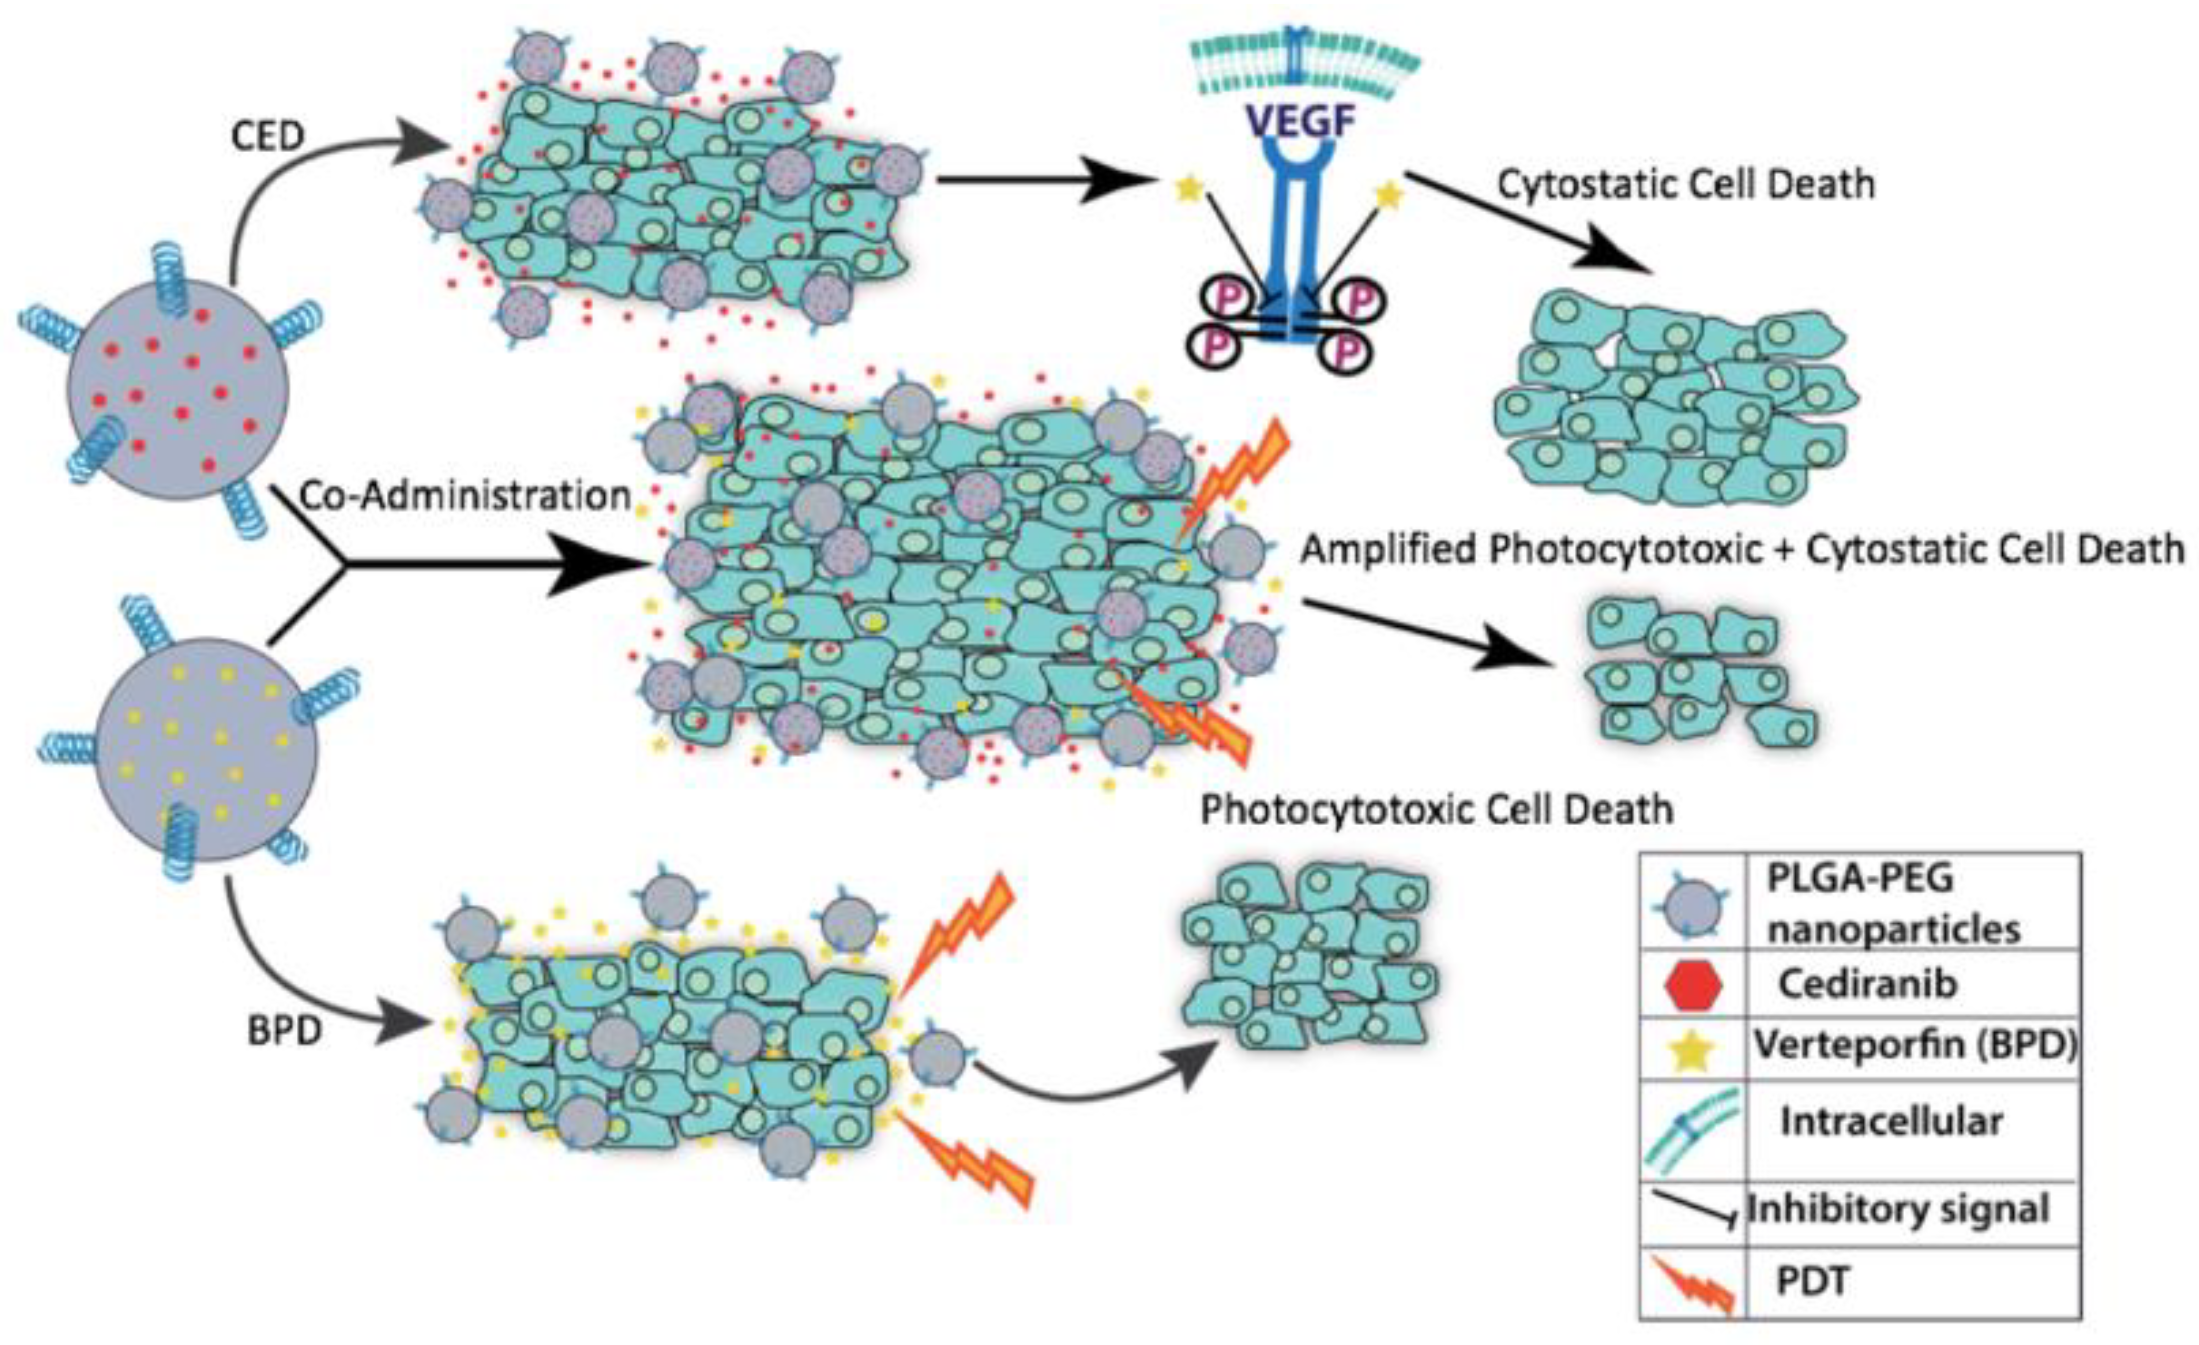
:1. Introduction
2. Materials and Methods
2.1. Materials
2.2. Methods
2.2.1. Nanoparticle Synthesis
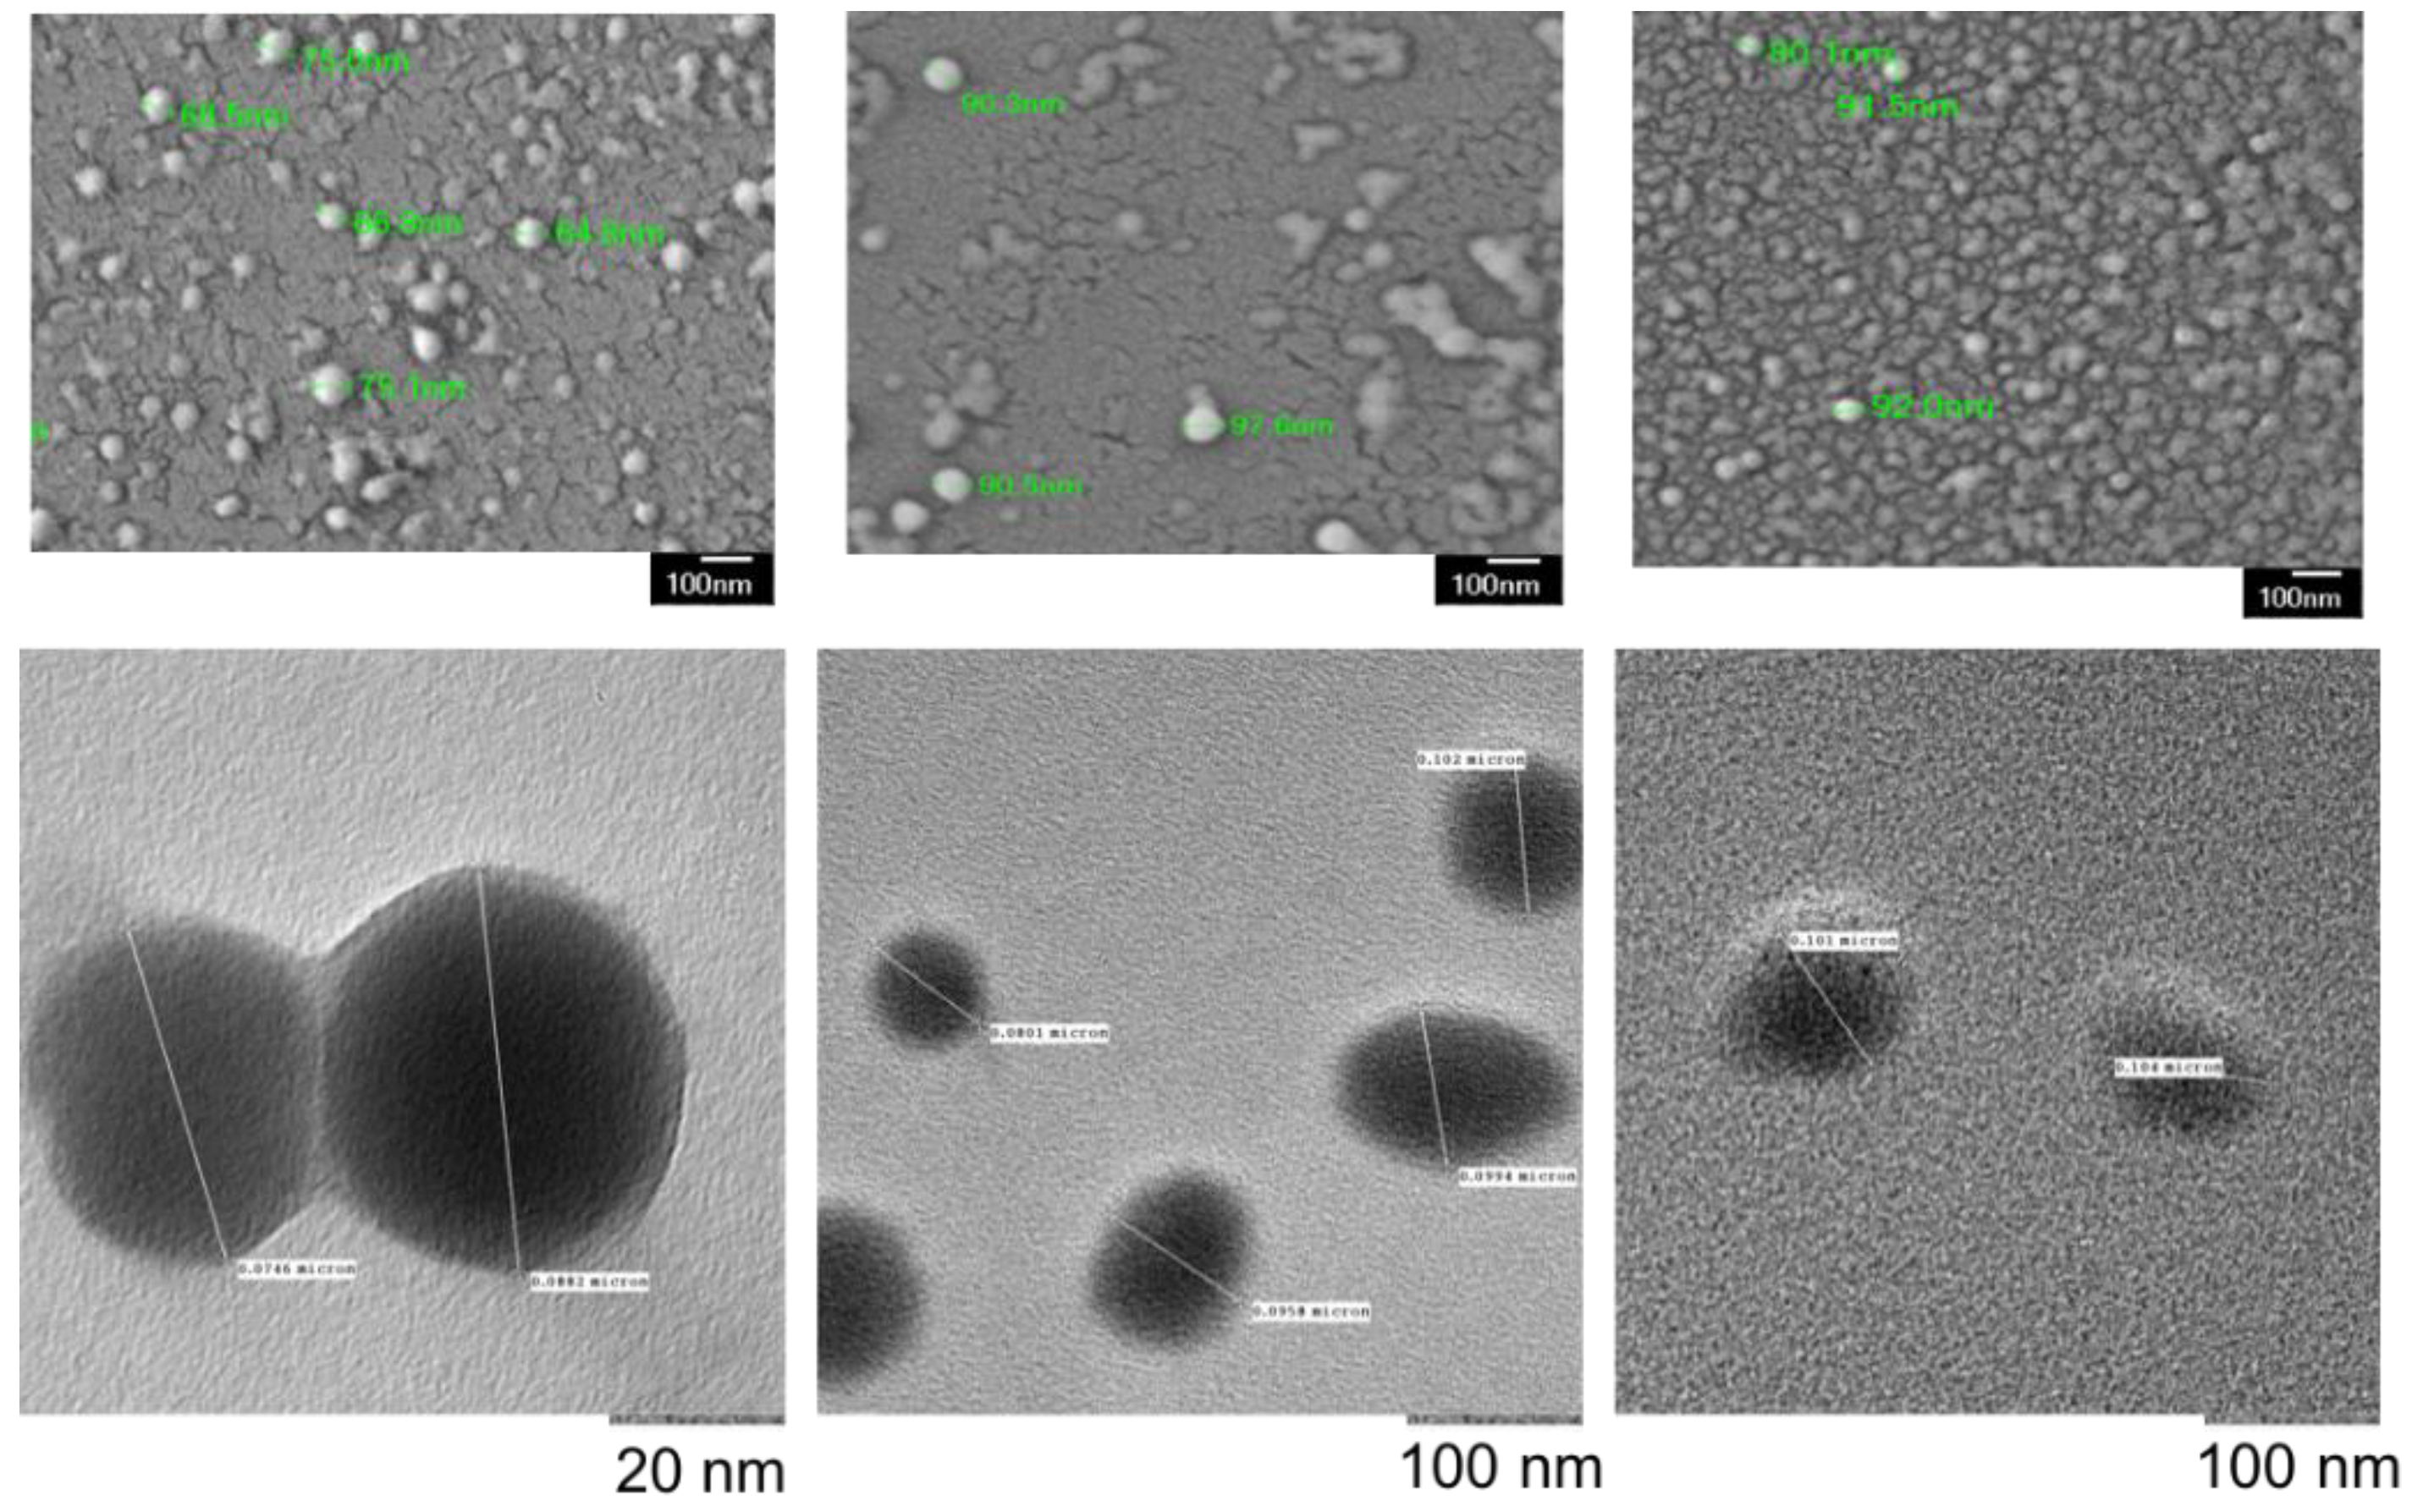
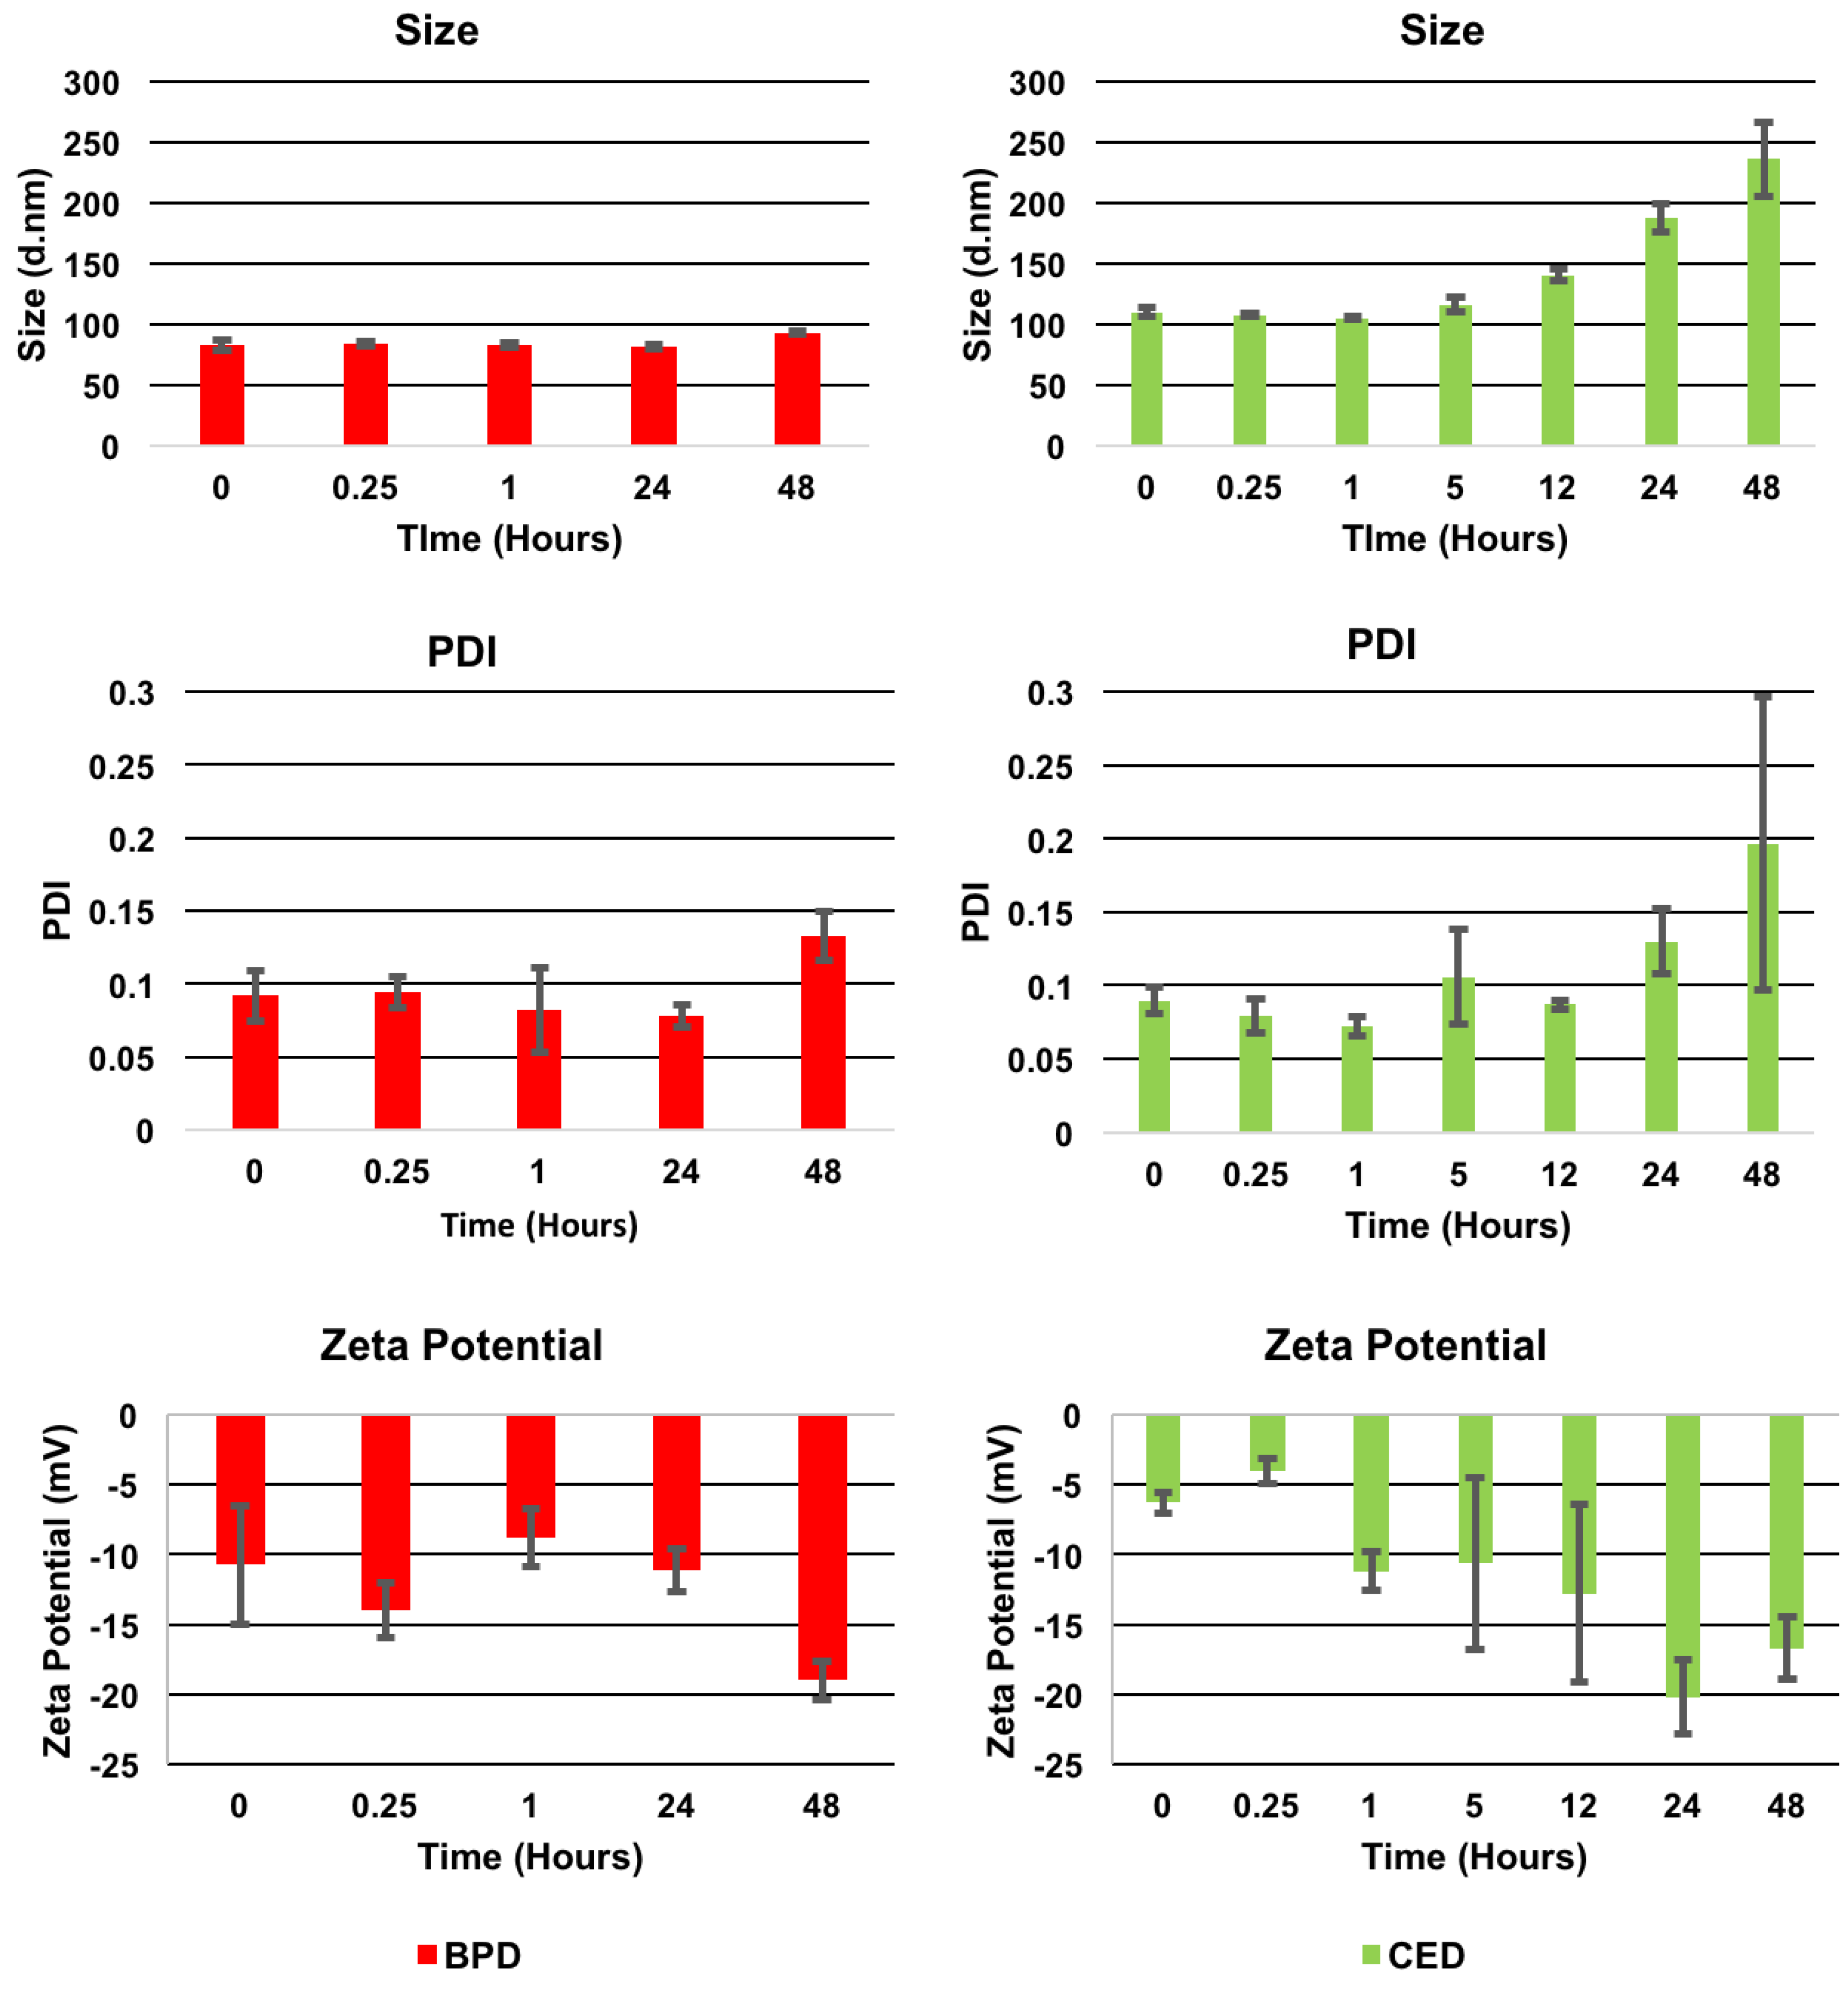
2.2.2. Characterization
2.2.3. In Vitro Studies
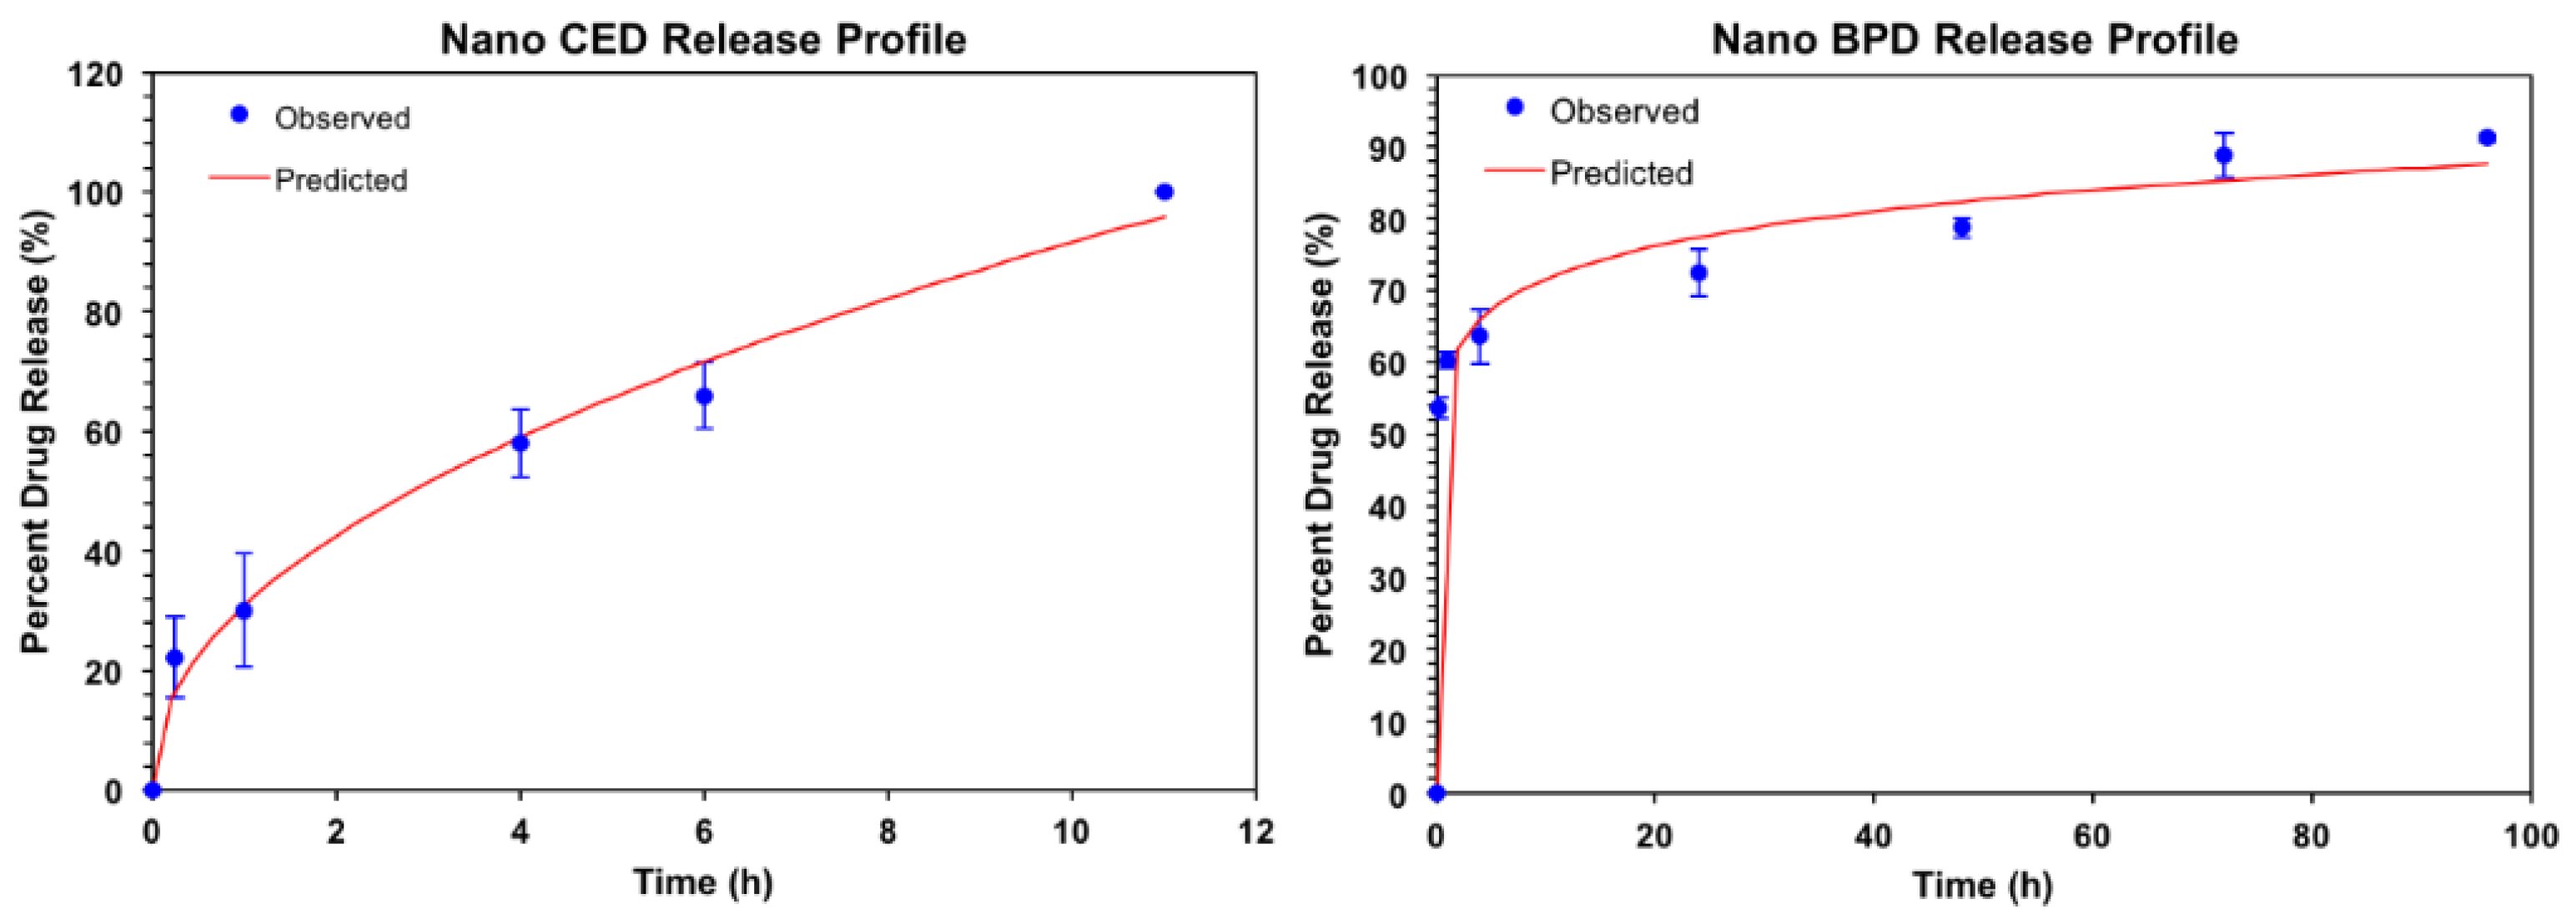
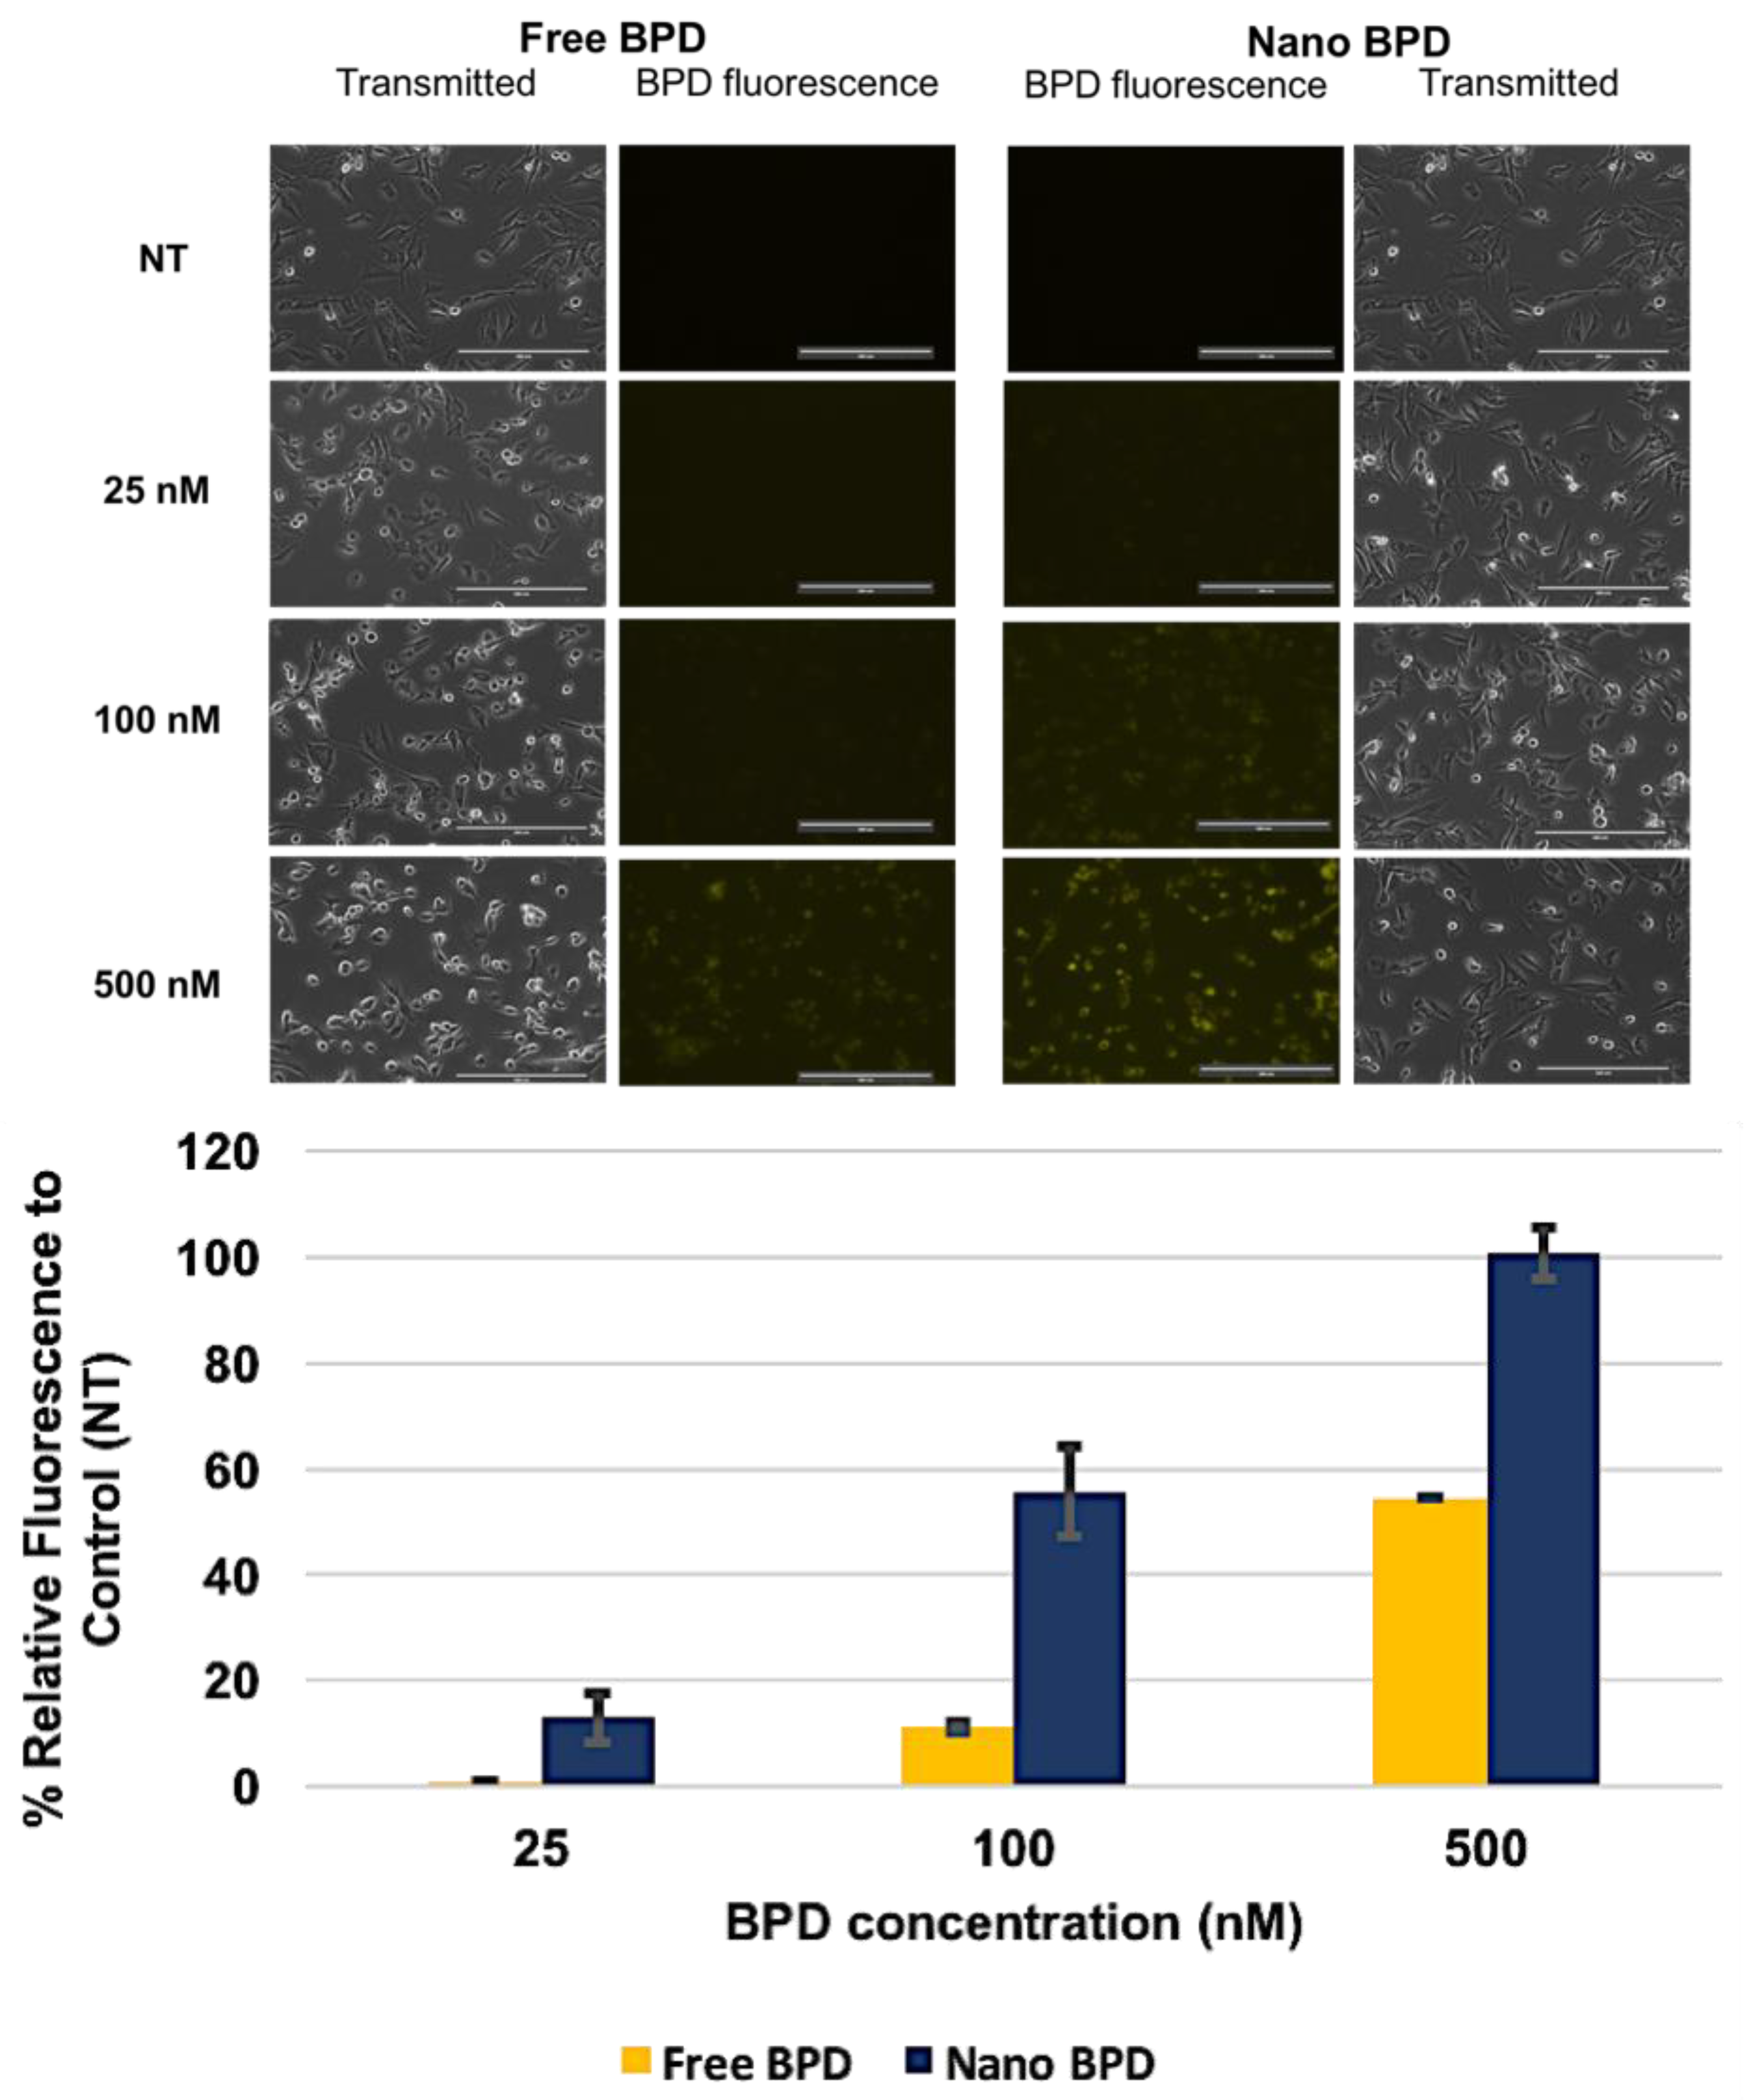
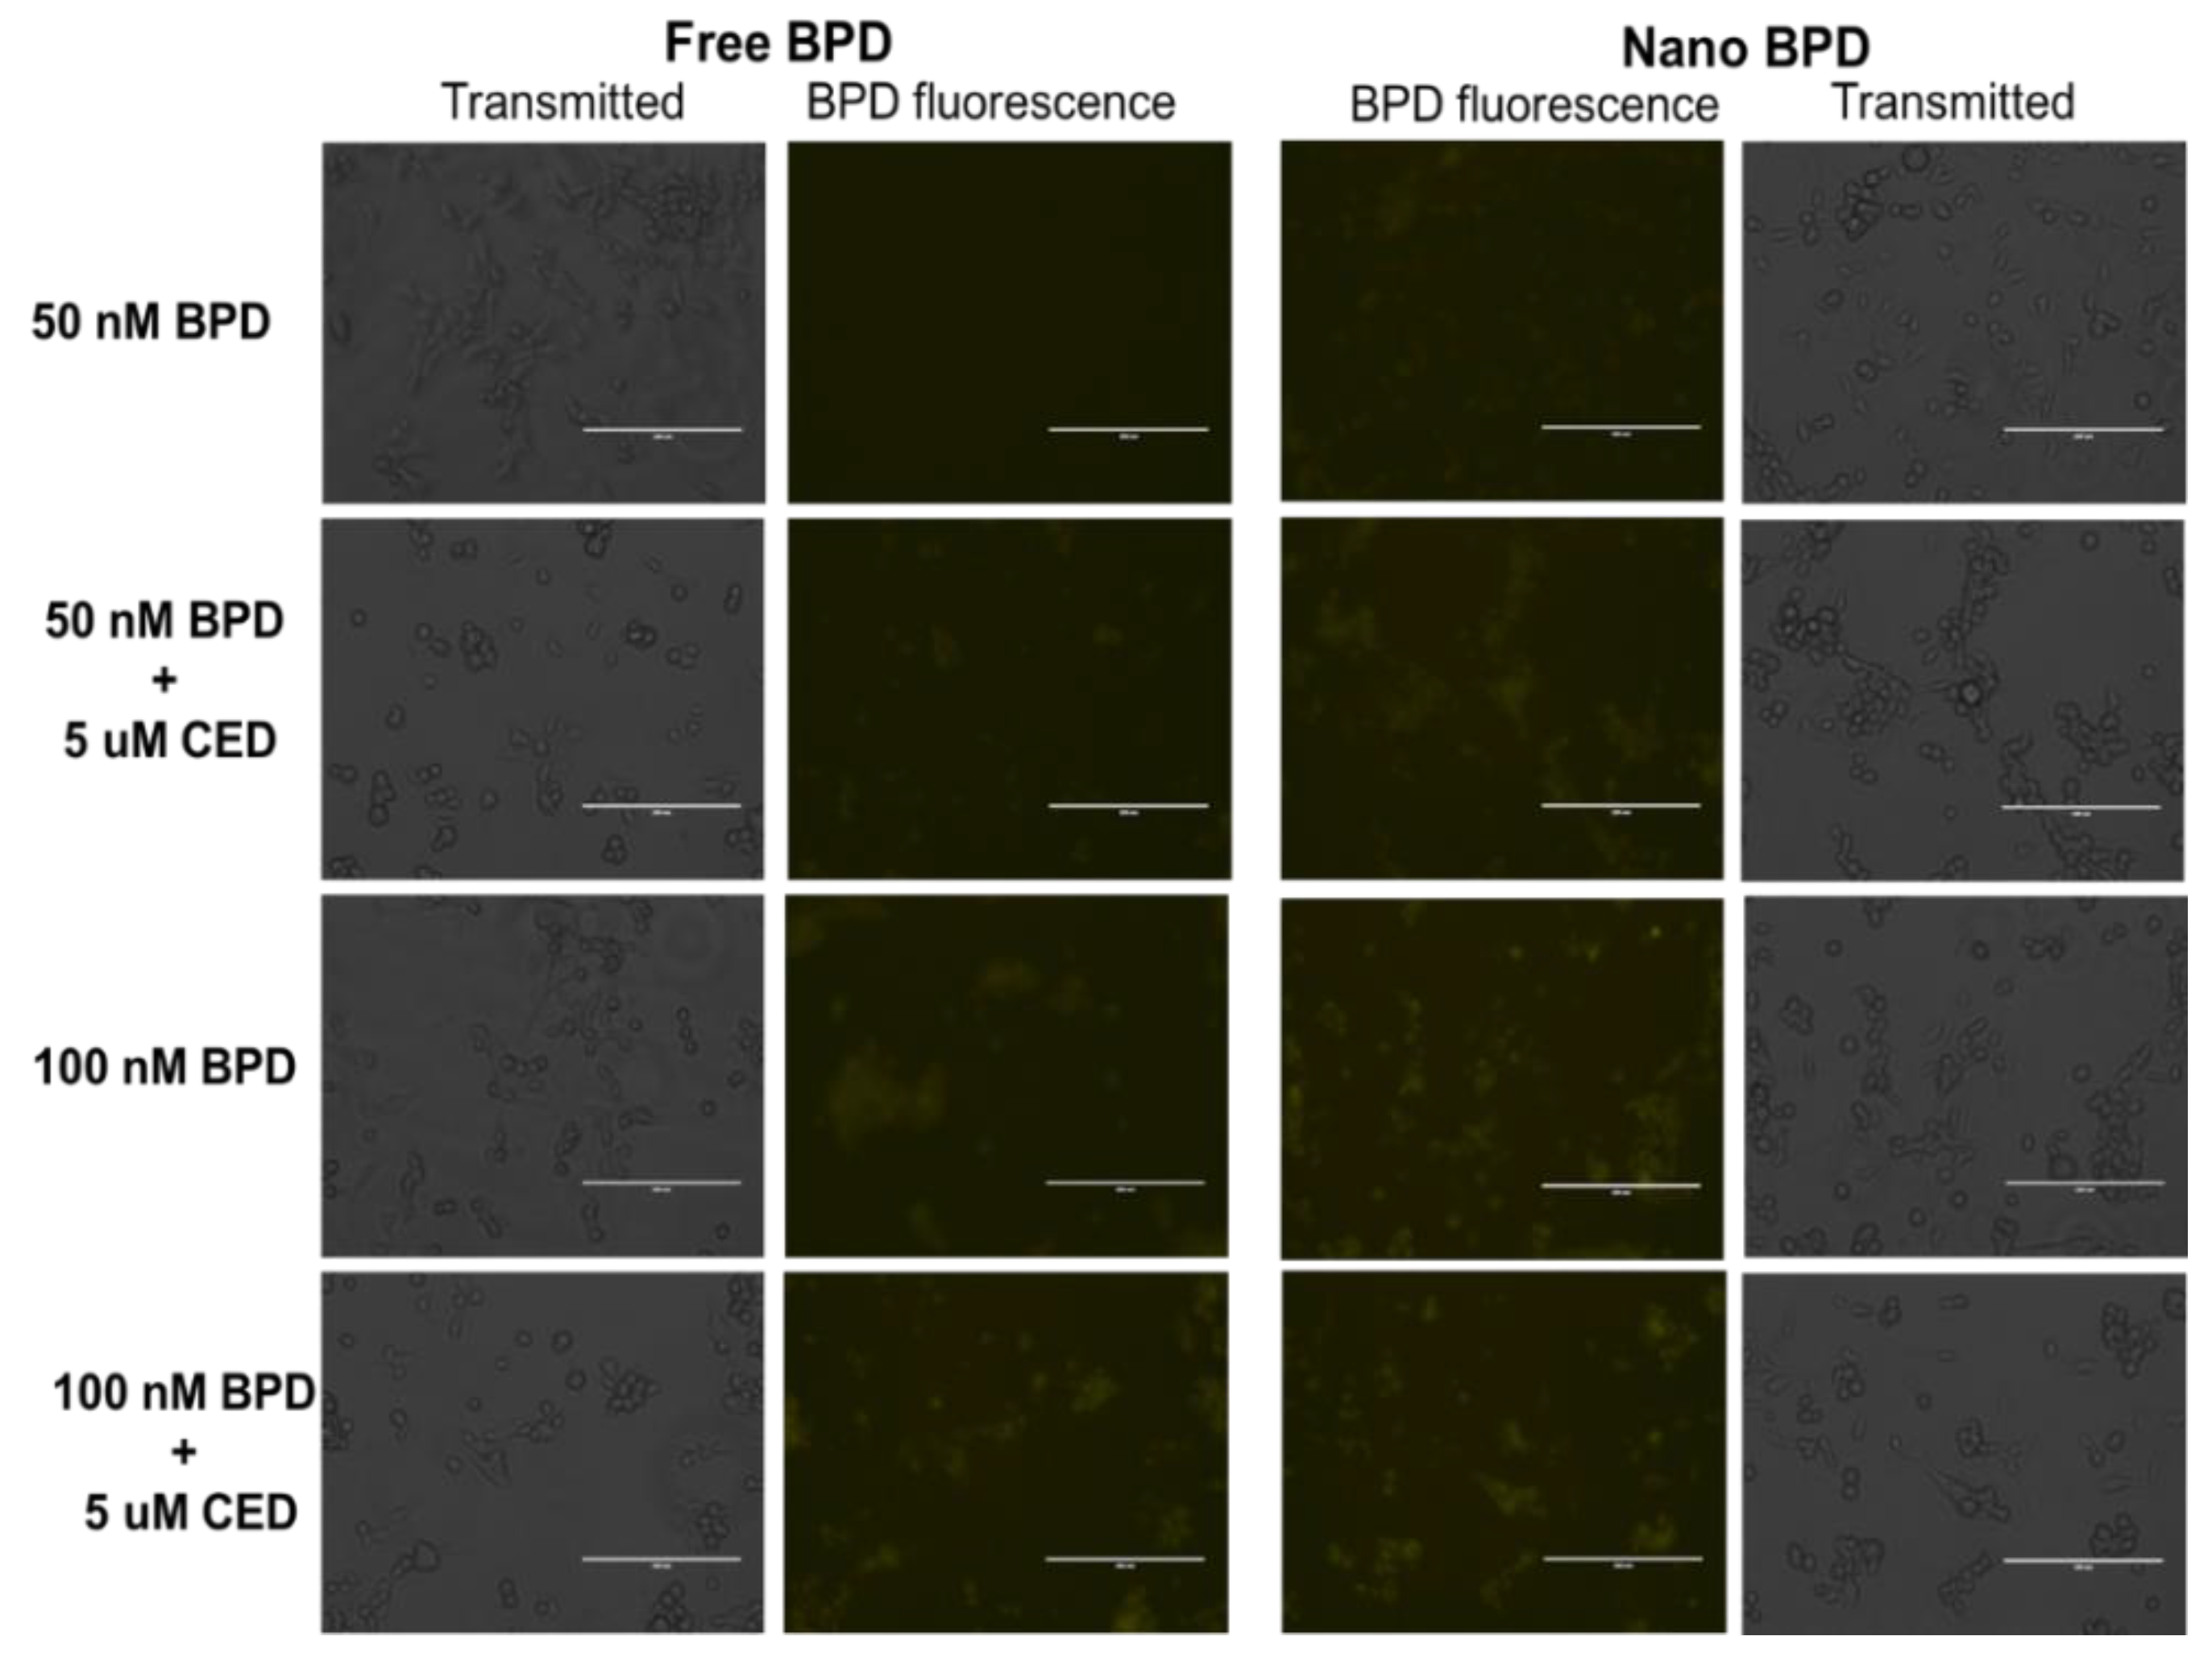
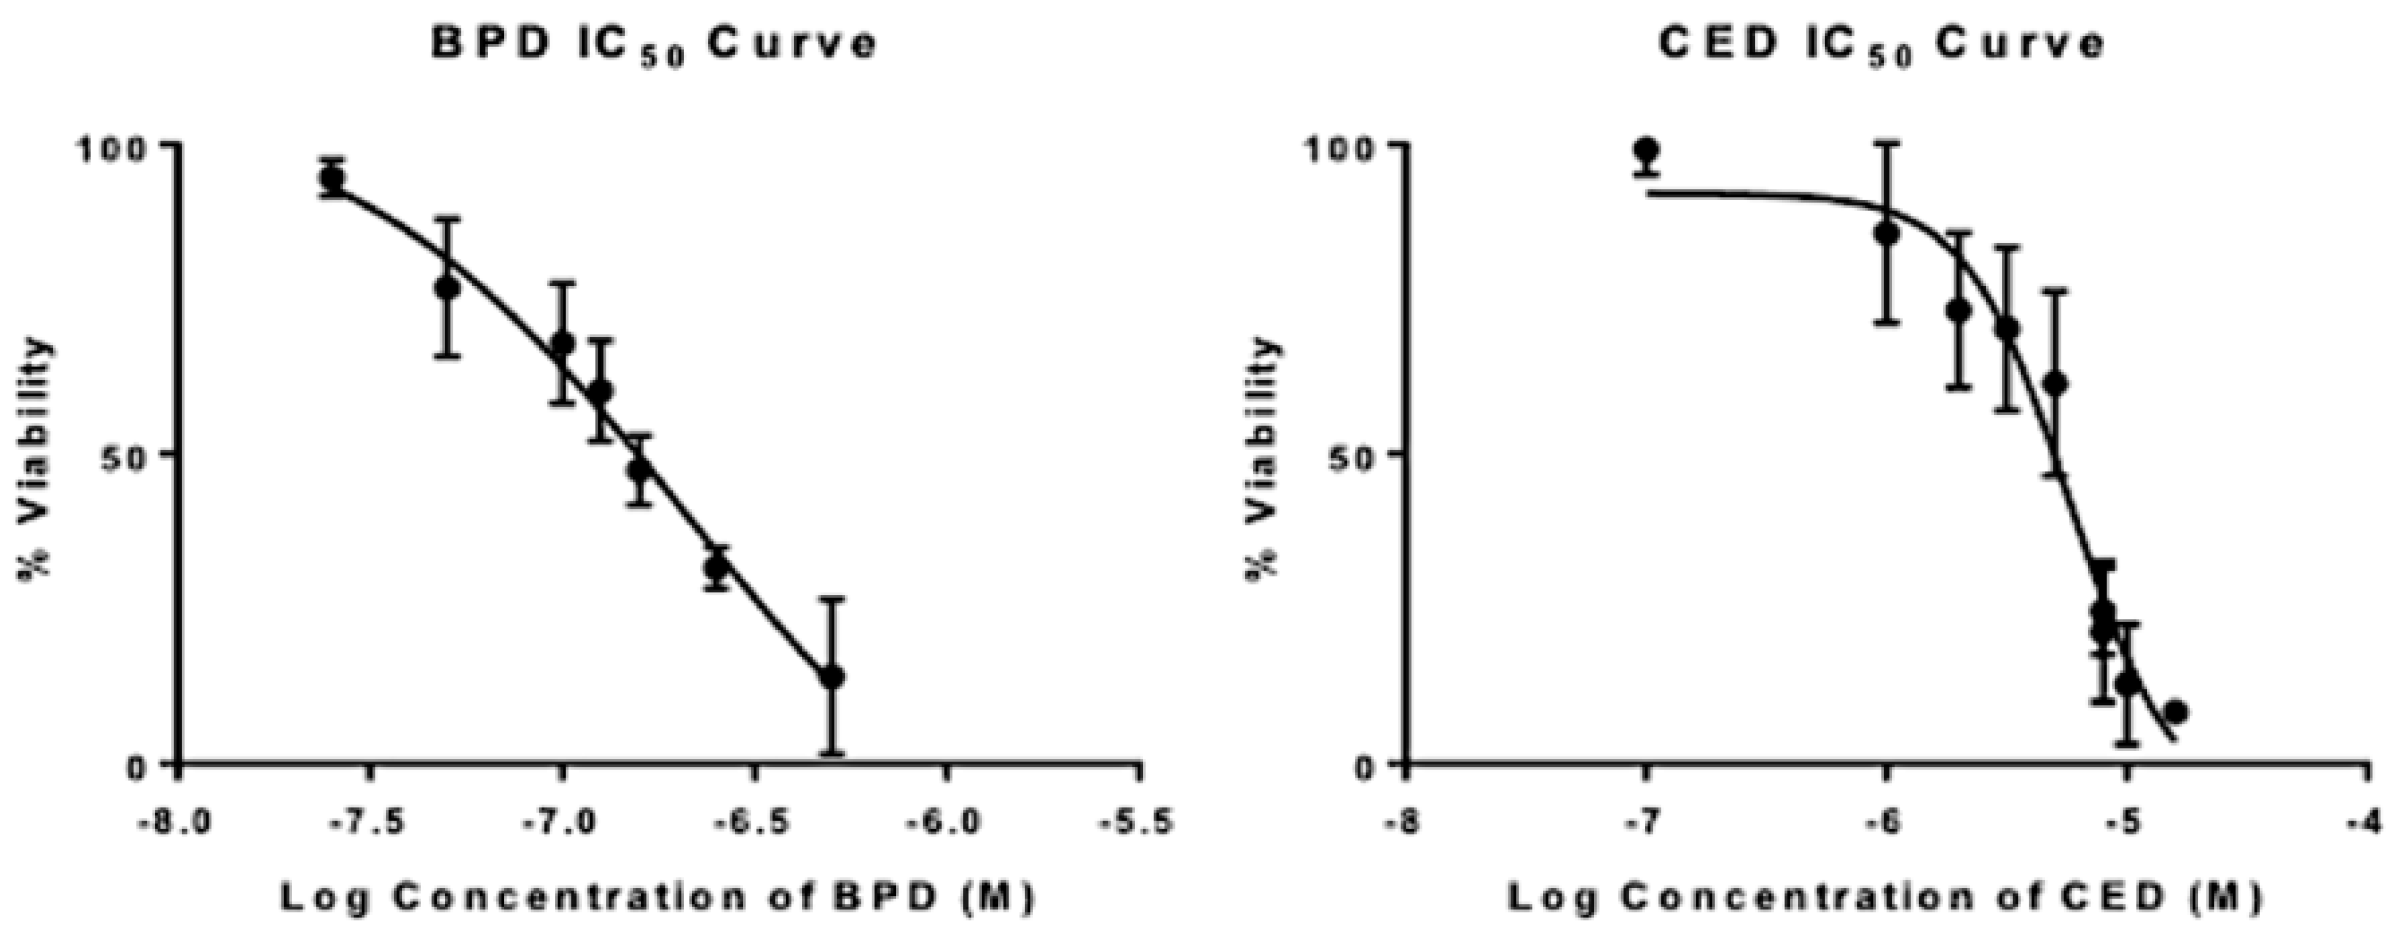
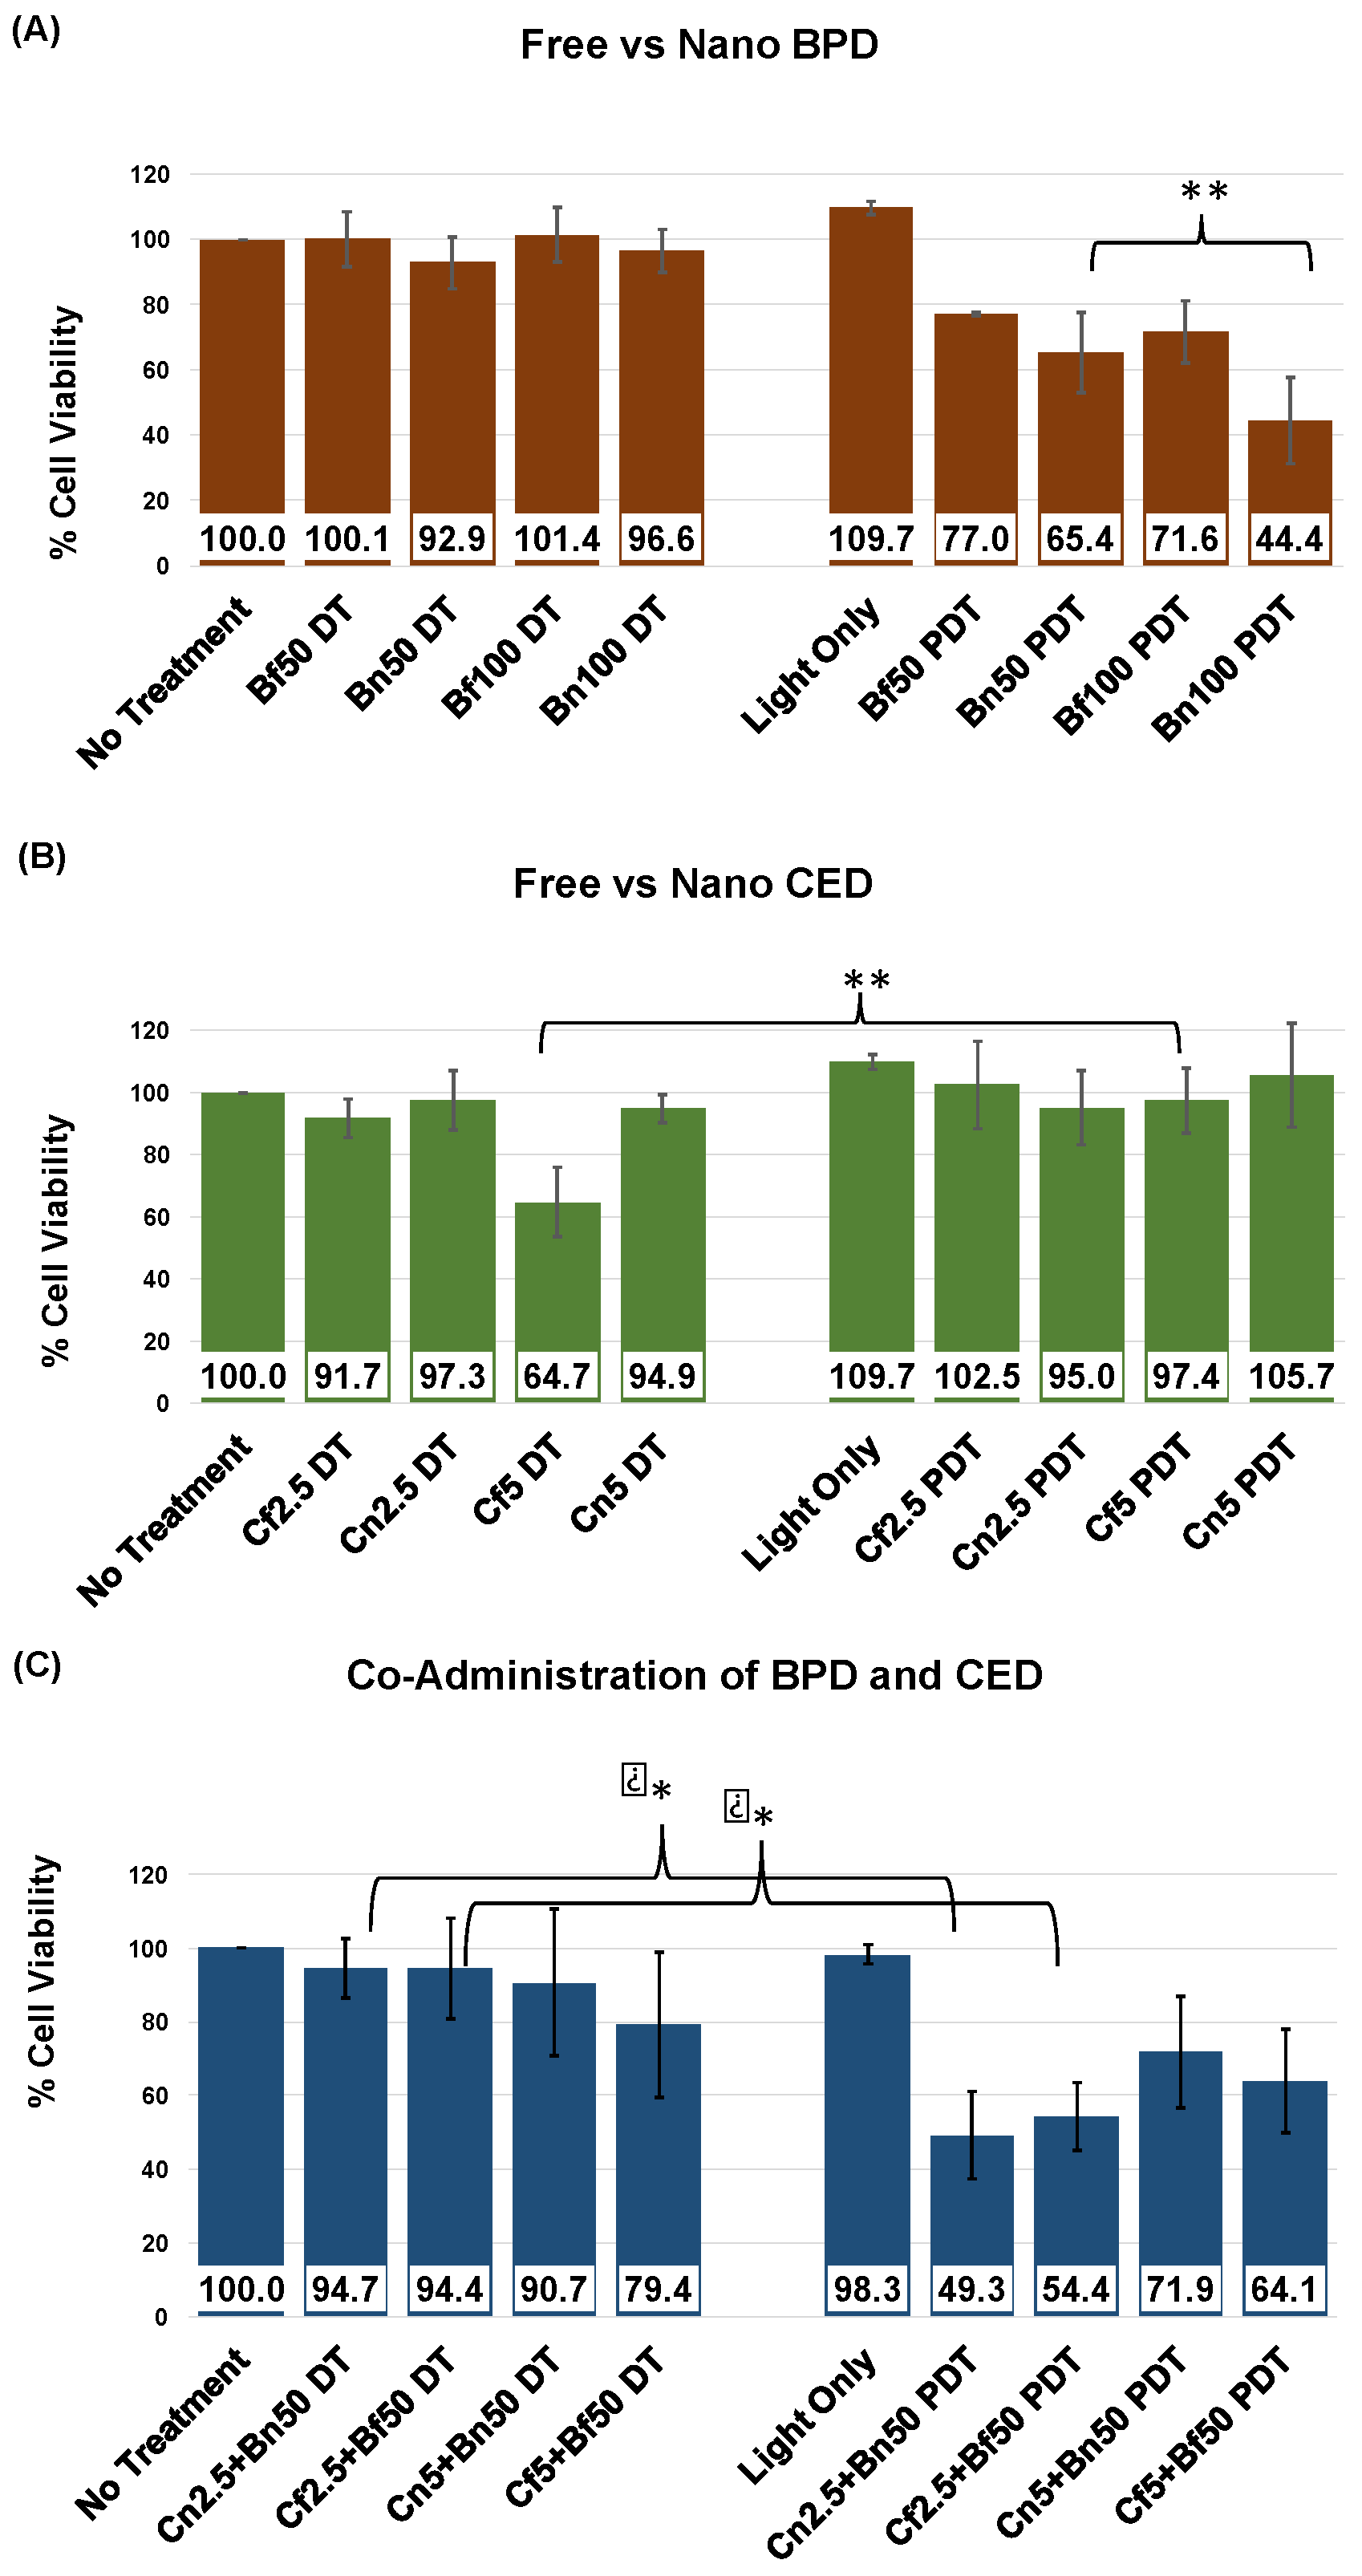
3. Results
4. Discussion
5. Conclusions
Supplementary Materials
Author Contributions
Funding
Acknowledgments
Conflicts of Interest
References
- Hambsch, P.; Istomin, Y.P.; Tzerkovsky, D.A.; Patties, I.; Neuhaus, J.; Kortmann, R.D.; Schastak, S.; Glasow, A. Efficient cell death induction in human glioblastoma cells by photodynamic treatment with tetrahydroporphyrin-tetratosylat (thpts) and ionizing irradiation. Oncotarget 2017, 8, 72411–72423. [Google Scholar] [CrossRef] [PubMed]
- Wang, Y.; Xing, D.; Zhao, M.; Wang, J.; Yang, Y. The role of a single angiogenesis inhibitor in the treatment of recurrent glioblastoma multiforme: A meta-analysis and systematic review. PLoS One 2016, 11, e0152170. [Google Scholar] [CrossRef] [PubMed]
- Lin, M.; Zhang, X.; Jia, B.; Guan, S. Suppression of glioblastoma growth and angiogenesis through molecular targeting of methionine aminopeptidase-2. J. Neurooncol. 2018, 136, 243–254. [Google Scholar] [CrossRef] [PubMed]
- Eljamel, M.S.; Goodman, C.; Moseley, H. Ala and photofrin fluorescence-guided resection and repetitive PDT in glioblastoma multiforme: A single centre phase iii randomised controlled trial. Lasers Med. Sci. 2008, 23, 361–367. [Google Scholar] [CrossRef] [PubMed]
- Kim, M.M.; Umemura, Y.; Leung, D. Bevacizumab and glioblastoma: Past, present, and future directions. Cancer J. 2018, 24, 180–186. [Google Scholar] [CrossRef] [PubMed]
- Ellingson, B.M.; Abrey, L.E.; Garcia, J.; Chinot, O.; Wick, W.; Saran, F.; Nishikawa, R.; Henriksson, R.; Mason, W.P.; Harris, R.J.; et al. Post-chemoradiation volumetric response predicts survival in newly diagnosed glioblastoma treated with radiation, temozolomide and bevacizumab or placebo. Neuro Oncol. 2018, 20, 1525–1535. [Google Scholar] [CrossRef] [PubMed]
- Ozdemir-Kaynak, E.; Qutub, A.A.; Yesil-Celiktas, O. Advances in glioblastoma multiforme treatment: New models for nanoparticle therapy. Front. Physiol. 2018, 9, 170. [Google Scholar] [CrossRef] [PubMed]
- Dilnawaz, F.; Sahoo, S.K. Enhanced accumulation of curcumin and temozolomide loaded magnetic nanoparticles executes profound cytotoxic effect in glioblastoma spheroid model. Eur. J. Pharm. Biopharm. 2013, 85, 452–462. [Google Scholar] [CrossRef] [PubMed]
- Cohen, M.H.; Shen, Y.L.; Keegan, P.; Pazdur, R. FDA drug approval summary: Bevacizumab (avastin) as treatment of recurrent glioblastoma multiforme. Oncologist 2009, 14, 1131–1138. [Google Scholar] [CrossRef] [PubMed]
- Tsai, Y.C.; Vijayaraghavan, P.; Chiang, W.H.; Chen, H.H.; Liu, T.I.; Shen, M.Y.; Omoto, A.; Kamimura, M.; Soga, K.; Chiu, H.C. Targeted delivery of functionalized upconversion nanoparticles for externally triggered photothermal/photodynamic therapies of brain glioblastoma. Theranostics 2018, 8, 1435–1448. [Google Scholar] [CrossRef] [PubMed]
- Abernathey, C.D.; Anderson, R.E.; Kooistra, K.L.; Laws, E.R., Jr. Activity of phthalocyanine photosensitizers against human glioblastoma in vitro. Neurosurgery 1987, 21, 468–473. [Google Scholar] [CrossRef] [PubMed]
- Zhang, W.; Lu, J.; Gao, X.; Li, P.; Zhang, W.; Ma, Y.; Wang, H.; Tang, B. Enhanced photodynamic therapy by reduced levels of intracellular glutathione obtained by employing a nano-MOF with CuII as the active center. Angew. Chem. Int. Ed. 2018, 130, 4985–4990. [Google Scholar] [CrossRef]
- Zhou, X.; Chen, B.; Hoopes, P.J.; Hasan, T.; Pogue, B.W. Tumor vascular area correlates with photosensitizer uptake: Analysis of verteporfin microvascular delivery in the dunning rat prostate tumor. Photochem. Photobiol. 2006, 82, 1348–1357. [Google Scholar] [CrossRef] [PubMed]
- Chwilkowska, A.; Saczko, J.; Modrzycka, T.; Marcinkowska, A.; Malarska, A.; Bielewicz, J.; Patalas, D.; Banas, T. Uptake of photofrin ii, a photosensitizer used in photodynamic therapy, by tumour cells in vitro. Acta Biochim. Pol. 2003, 50, 509–513. [Google Scholar] [PubMed]
- Leunig, A.; Staub, F.; Peters, J.; Heimann, A.; Kempski, O.; Goetz, A.E. An in vitro model to study cellular photosensitizer uptake and photodynamic dose-response relationships of tumor cells. Res. Exp. Med. 1993, 193, 361–370. [Google Scholar] [CrossRef]
- Yin, W.; Bao, T.; Zhang, X.; Gao, Q.; Yu, J.; Dong, X.; Yan, L.; Gu, Z.; Zhao, Y. Biodegradable MoOx nanoparticles with efficient near-infrared photothermal and photodynamic synergetic cancer therapy at the second biological window. Nanoscale 2018, 10, 1517–1531. [Google Scholar] [CrossRef] [PubMed]
- Qi, B.; Crawford, A.J.; Wojtynek, N.E.; Holmes, M.B.; Souchek, J.J.; Almeida-Porada, G.; Ly, Q.P.; Cohen, S.M.; Hollingsworth, M.A.; Mohs, A.M. Indocyanine green loaded hyaluronan-derived nanoparticles for fluorescence-enhanced surgical imaging of pancreatic cancer. Nanomedicine 2018, 14, 769–780. [Google Scholar] [CrossRef] [PubMed]
- Sahu, K.; Sharma, M.; Dube, A.; Gupta, P.K. Topical antimicrobial photodynamic therapy improves angiogenesis in wounds of diabetic mice. Lasers Med. Sci. 2015, 30, 1923–1929. [Google Scholar] [CrossRef] [PubMed]
- Jiang, F.; Zhang, X.; Kalkanis, S.N.; Zhang, Z.; Yang, H.; Katakowski, M.; Hong, X.; Zheng, X.; Zhu, Z.; Chopp, M. Combination therapy with antiangiogenic treatment and photodynamic therapy for the nude mouse bearing U87 glioblastoma. Photochem. Photobiol. 2008, 84, 128–137. [Google Scholar] [CrossRef] [PubMed]
- di Tomaso, E.; Snuderl, M.; Kamoun, W.S.; Duda, D.G.; Auluck, P.K.; Fazlollahi, L.; Andronesi, O.C.; Frosch, M.P.; Wen, P.Y.; Plotkin, S.R.; et al. Glioblastoma recurrence after cediranib therapy in patients: Lack of “rebound” revascularization as mode of escape. Cancer Res. 2011, 71, 19–28. [Google Scholar] [CrossRef] [PubMed]
- Batchelor, T.T.; Duda, D.G.; di Tomaso, E.; Ancukiewicz, M.; Plotkin, S.R.; Gerstner, E.; Eichler, A.F.; Drappatz, J.; Hochberg, F.H.; Benner, T.; et al. Phase II study of cediranib, an oral pan-vascular endothelial growth factor receptor tyrosine kinase inhibitor, in patients with recurrent glioblastoma. J. Clin. Oncol. 2010, 28, 2817–2823. [Google Scholar] [CrossRef] [PubMed]
- Sorensen, A.G.; Batchelor, T.T.; Zhang, W.T.; Chen, P.J.; Yeo, P.; Wang, M.; Jennings, D.; Wen, P.Y.; Lahdenranta, J.; Ancukiewicz, M.; et al. A “vascular normalization index” as potential mechanistic biomarker to predict survival after a single dose of cediranib in recurrent glioblastoma patients. Cancer Res. 2009, 69, 5296–5300. [Google Scholar] [CrossRef] [PubMed]
- Tatar, O.; Shinoda, K.; Adam, A.; Eckert, T.; Eckardt, C.; Lucke, K.; Deuter, C.; Bartz-Schmidt, K.U.; Grisanti, S. Effect of verteporfin photodynamic therapy on endostatin and angiogenesis in human choroidal neovascular membranes. Br. J. Ophthalmol. 2007, 91, 166–173. [Google Scholar] [CrossRef] [PubMed] [Green Version]
- Bhuvaneswari, R.; Yuen, G.Y.; Chee, S.K.; Olivo, M. Antiangiogenesis agents avastin and erbitux enhance the efficacy of photodynamic therapy in a murine bladder tumor model. Lasers Surg. Med. 2011, 43, 651–662. [Google Scholar] [CrossRef] [PubMed]
- Gomer, C.J.; Ferrario, A.; Luna, M.; Rucker, N.; Wong, S. Photodynamic therapy: Combined modality approaches targeting the tumor microenvironment. Lasers Surg. Med. 2006, 38, 516–521. [Google Scholar] [CrossRef] [PubMed]
- Ferrario, A.; von Tiehl, K.F.; Rucker, N.; Schwarz, M.A.; Gill, P.S.; Gomer, C.J. Antiangiogenic treatment enhances photodynamic therapy responsiveness in a mouse mammary carcinoma. Cancer Res. 2000, 60, 4066–4069. [Google Scholar] [PubMed]
- Spring, B.Q.; Bryan Sears, R.; Zheng, L.Z.; Mai, Z.; Watanabe, R.; Sherwood, M.E.; Schoenfeld, D.A.; Pogue, B.W.; Pereira, S.P.; Villa, E.; et al. A photoactivable multi-inhibitor nanoliposome for tumour control and simultaneous inhibition of treatment escape pathways. Nat. Nanotechnol. 2016, 11, 378–387. [Google Scholar] [CrossRef] [PubMed] [Green Version]
- Bhuvaneswari, R.; Thong, P.S.; Gan, Y.Y.; Soo, K.C.; Olivo, M. Evaluation of hypericin-mediated photodynamic therapy in combination with angiogenesis inhibitor bevacizumab using in vivo fluorescence confocal endomicroscopy. J. Biomed. Opt. 2010, 15, 011114. [Google Scholar] [CrossRef] [PubMed]
- Bota, D.A.; Chung, J.; Dandekar, M.; Carrillo, J.A.; Kong, X.T.; Fu, B.D.; Hsu, F.P.; Schonthal, A.H.; Hofman, F.M.; Chen, T.C.; et al. Phase II study of ERC1671 plus bevacizumab versus bevacizumab plus placebo in recurrent glioblastoma: Interim results and correlations with CD4(+) T-lymphocyte counts. CNS Oncol. 2018, 7, 3. [Google Scholar] [CrossRef] [PubMed]
- Navone, S.E.; Guarnaccia, L.; Cordiglieri, C.; Crisa, F.M.; Caroli, M.; Locatelli, M.; Schisano, L.; Rampini, P.; Miozzo, M.; La Verde, N.; et al. Aspirin affects tumor angiogenesis and sensitizes human glioblastoma endothelial cells to temozolomide, bevacizumab, and sunitinib impairing vegf-related signaling. World Neurosurg. 2018. In Press. [Google Scholar] [CrossRef] [PubMed]
- Chen, Z.; Xu, N.; Zhao, C.; Xue, T.; Wu, X.; Wang, Z. Bevacizumab combined with chemotherapy vs single-agent therapy in recurrent glioblastoma: Evidence from randomized controlled trials. Cancer Manag. Res. 2018, 10, 2193–2205. [Google Scholar] [CrossRef] [PubMed]
- Liao, K.L.; Huang, S.; Wu, Y.P. The prognosis for patients with newly diagnosed glioblastoma receiving bevacizumab combination therapy: A meta-analysis. Onco Targets Ther. 2018, 11, 3513–3520. [Google Scholar] [CrossRef] [PubMed]
- Chang, C.H.; Liu, W.T.; Hung, H.C.; Gean, C.Y.; Tsai, H.M.; Su, C.L.; Gean, P.W. Synergistic inhibition of tumor growth by combination treatment with drugs against different subpopulations of glioblastoma cells. BMC Cancer 2017, 17, 905. [Google Scholar] [CrossRef] [PubMed]
- Zhao, Y.; Ren, W.; Zhong, T.; Zhang, S.; Huang, D.; Guo, Y.; Yao, X.; Wang, C.; Zhang, W.Q.; Zhang, X.; et al. Tumor-specific PH-responsive peptide-modified PH-sensitive liposomes containing doxorubicin for enhancing glioma targeting and anti-tumor activity. J. Control. Release 2016, 222, 56–66. [Google Scholar] [CrossRef] [PubMed]
- Jahanban-Esfahlan, R.; Seidi, K.; Banimohamad-Shotorbani, B.; Jahanban-Esfahlan, A.; Yousefi, B. Combination of nanotechnology with vascular targeting agents for effective cancer therapy. J. Cell. Physiol. 2017, 233, 2982–2992. [Google Scholar] [CrossRef] [PubMed]
- Martinho, O.; Silva-Oliveira, R.; Miranda-Goncalves, V.; Clara, C.; Almeida, J.R.; Carvalho, A.L.; Barata, J.T.; Reis, R.M. In vitro and in vivo analysis of RTK inhibitor efficacy and identification of its novel targets in glioblastomas. Transl. Oncol. 2013, 6, 187–196. [Google Scholar] [CrossRef] [PubMed] [Green Version]
- Pasquier, E.; Carre, M.; Pourroy, B.; Camoin, L.; Rebai, O.; Briand, C.; Braguer, D. Antiangiogenic activity of paclitaxel is associated with its cytostatic effect, mediated by the initiation but not completion of a mitochondrial apoptotic signaling pathway. Mol. Cancer Ther. 2004, 3, 1301–1310. [Google Scholar] [PubMed]
- Lobo, M.R.; Kukino, A.; Tran, H.; Schabel, M.C.; Springer, C.S., Jr.; Gillespie, G.Y.; Grafe, M.R.; Woltjer, R.L.; Pike, M.M. Synergistic antivascular and antitumor efficacy with combined cediranib and SC6889 in intracranial mouse glioma. PLoS One 2015, 10, e0144488. [Google Scholar] [CrossRef] [PubMed]
- Morton, C.L.; Maris, J.M.; Keir, S.T.; Gorlick, R.; Kolb, E.A.; Billups, C.A.; Wu, J.; Smith, M.A.; Houghton, P.J. Combination testing of cediranib (AZD2171) against childhood cancer models by the pediatric preclinical testing program. Pediatr. Blood Cancer 2012, 58, 566–571. [Google Scholar] [CrossRef] [PubMed]
- Andronesi, O.C.; Esmaeili, M.; Borra, R.J.H.; Emblem, K.; Gerstner, E.R.; Pinho, M.C.; Plotkin, S.R.; Chi, A.S.; Eichler, A.F.; Dietrich, J.; et al. Early changes in glioblastoma metabolism measured by MR spectroscopic imaging during combination of anti-angiogenic cediranib and chemoradiation therapy are associated with survival. NPJ Precis. Oncol. 2017, 1, 20. [Google Scholar] [CrossRef] [PubMed]
- Brown, N.; McBain, C.; Nash, S.; Hopkins, K.; Sanghera, P.; Saran, F.; Phillips, M.; Dungey, F.; Clifton-Hadley, L.; Wanek, K.; et al. Multi-center randomized phase II study comparing cediranib plus gefitinib with cediranib plus placebo in subjects with recurrent/progressive glioblastoma. PLoS One 2016, 11, e0156369. [Google Scholar] [CrossRef] [PubMed]
- Gerstner, E.R.; Ye, X.; Duda, D.G.; Levine, M.A.; Mikkelsen, T.; Kaley, T.J.; Olson, J.J.; Nabors, B.L.; Ahluwalia, M.S.; Wen, P.Y.; et al. A phase I study of cediranib in combination with cilengitide in patients with recurrent glioblastoma. Neuro Oncol. 2015, 17, 1386–1392. [Google Scholar] [CrossRef] [PubMed] [Green Version]
- Batchelor, T.T.; Mulholland, P.; Neyns, B.; Nabors, L.B.; Campone, M.; Wick, A.; Mason, W.; Mikkelsen, T.; Phuphanich, S.; Ashby, L.S.; et al. Phase III randomized trial comparing the efficacy of cediranib as monotherapy, and in combination with lomustine, versus lomustine alone in patients with recurrent glioblastoma. J. Clin. Oncol. 2013, 31, 3212–3218. [Google Scholar] [CrossRef] [PubMed]
- Jadia, R.; Kydd, J.; Rai, P. Remotely phototriggered, transferrin-targeted polymeric nanoparticles for the treatment of breast cancer. Photochem. Photobiol. 2018, 94, 765–774. [Google Scholar] [CrossRef] [PubMed]
- Al-Moujahed, A.; Brodowska, K.; Stryjewski, T.P.; Efstathiou, N.E.; Vasilikos, I.; Cichy, J.; Miller, J.W.; Gragoudas, E.; Vavvas, D.G. Verteporfin inhibits growth of human glioma in vitro without light activation. Sci. Rep. 2017, 7, 7602. [Google Scholar] [CrossRef] [PubMed]
- Hu, Z.; Rao, B.; Chen, S.; Duanmu, J. Targeting tissue factor on tumour cells and angiogenic vascular endothelial cells by factor VII-targeted verteporfin photodynamic therapy for breast cancer in vitro and in vivo in mice. BMC Cancer 2010, 10, 235. [Google Scholar] [CrossRef] [PubMed]
- Kundu, P.; Mohanty, C.; Sahoo, S.K. Antiglioma activity of curcumin-loaded lipid nanoparticles and its enhanced bioavailability in brain tissue for effective glioblastoma therapy. Acta Biomater. 2012, 8, 2670–2687. [Google Scholar] [CrossRef] [PubMed]
- Yuan, J.D.; ZhuGe, D.L.; Tong, M.Q.; Lin, M.T.; Xu, X.F.; Tang, X.; Zhao, Y.Z.; Xu, H.L. PH-sensitive polymeric nanoparticles of mPEG-PLGA-PGlu with hybrid core for simultaneous encapsulation of curcumin and doxorubicin to kill the heterogeneous tumour cells in breast cancer. Artif. Cells Nanomed. Biotechnol. 2018, 1–12. [Google Scholar] [CrossRef] [PubMed]
- Kydd, J.; Jadia, R.; Velpurisiva, P.; Gad, A.; Paliwal, S.; Rai, P. Targeting strategies for the combination treatment of cancer using drug delivery systems. Pharmaceutics 2017, 9, 46. [Google Scholar] [CrossRef] [PubMed]
- Liu, Y.; An, S.; Li, J.; Kuang, Y.; He, X.; Guo, Y.; Ma, H.; Zhang, Y.; Ji, B.; Jiang, C. Brain-targeted co-delivery of therapeutic gene and peptide by multifunctional nanoparticles in Alzheimer’s disease mice. Biomaterials 2016, 80, 33–45. [Google Scholar] [CrossRef] [PubMed]
- Nava-Arzaluz, M.G.; Pinon-Segundo, E.; Ganem-Rondero, A.; Lechuga-Ballesteros, D. Single emulsion-solvent evaporation technique and modifications for the preparation of pharmaceutical polymeric nanoparticles. Recent Pat. Drug Deliv. Formul. 2012, 6, 209–223. [Google Scholar] [CrossRef] [PubMed]
- Beck-Broichsitter, M.; Rytting, E.; Lebhardt, T.; Wang, X.; Kissel, T. Preparation of nanoparticles by solvent displacement for drug delivery: A shift in the “ouzo region” upon drug loading. Eur. J. Pharm. Sci. 2010, 41, 244–253. [Google Scholar] [CrossRef] [PubMed]
- Xu, X.; Khan, M.A.; Burgess, D.J. A two-stage reverse dialysis in vitro dissolution testing method for passive targeted liposomes. Int. J. Pharm. 2012, 426, 211–218. [Google Scholar] [CrossRef] [PubMed]
- Soica, C.; Oprean, C.; Borcan, F.; Danciu, C.; Trandafirescu, C.; Coricovac, D.; Crainiceanu, Z.; Dehelean, C.A.; Munteanu, M. The synergistic biologic activity of oleanolic and ursolic acids in complex with hydroxypropyl-γ-cyclodextrin. Molecules 2014, 19, 4924–4940. [Google Scholar] [CrossRef] [PubMed]
- Walsh, S.; Diamond, D. Non-linear curve fitting using microsoft excel solver. Talanta 1995, 42, 561–572. [Google Scholar] [CrossRef] [Green Version]
- Dash, S.; Murthy, P.N.; Nath, L.; Chowdhury, P. Kinetic modeling on drug release from controlled drug delivery systems. Acta Pol. Pharm. 2010, 67, 217–223. [Google Scholar] [PubMed]
- Batchelor, T.T.; Gerstner, E.R.; Emblem, K.E.; Duda, D.G.; Kalpathy-Cramer, J.; Snuderl, M.; Ancukiewicz, M.; Polaskova, P.; Pinho, M.C.; Jennings, D.; et al. Improved tumor oxygenation and survival in glioblastoma patients who show increased blood perfusion after cediranib and chemoradiation. PNAS 2013, 110, 19059–19064. [Google Scholar] [CrossRef] [PubMed] [Green Version]
- Orbegoso, C.; Marquina, G.; George, A.; Banerjee, S. The role of cediranib in ovarian cancer. Expert Opin. Pharmacother. 2017, 18, 1637–1648. [Google Scholar] [CrossRef] [PubMed]
- Ivy, S.P.; Liu, J.F.; Lee, J.M.; Matulonis, U.A.; Kohn, E.C. Cediranib, a pan-VEGFR inhibitor, and olaparib, a PARP inhibitor, in combination therapy for high grade serous ovarian cancer. Expert Opin. Investig. Drugs 2016, 25, 597–611. [Google Scholar] [CrossRef] [PubMed] [Green Version]
- Lee, J.M.; Trepel, J.B.; Choyke, P.; Cao, L.; Sissung, T.; Houston, N.; Yu, M.; Figg, W.D.; Turkbey, I.B.; Steinberg, S.M.; et al. CECs and IL-8 have prognostic and predictive utility in patients with recurrent platinum-sensitive ovarian cancer: Biomarker correlates from the randomized phase-2 trial of olaparib and cediranib compared with olaparib in recurrent platinum-sensitive ovarian cancer. Front. Oncol. 2015, 5, 123. [Google Scholar] [PubMed]
- Pelaz, B.; del Pino, P.; Maffre, P.; Hartmann, R.; Gallego, M.; Rivera-Fernandez, S.; de la Fuente, J.M.; Nienhaus, G.U.; Parak, W.J. Surface functionalization of nanoparticles with polyethylene glycol: Effects on protein adsorption and cellular uptake. ACS Nano 2015, 9, 6996–7008. [Google Scholar] [CrossRef] [PubMed]
- Hossain, M.; Banik, N.L.; Ray, S.K. Synergistic anti-cancer mechanisms of curcumin and paclitaxel for growth inhibition of human brain tumor stem cells and LN18 and U138MG cells. Neurochem. Int. 2012, 61, 1102–1113. [Google Scholar] [CrossRef] [PubMed] [Green Version]
- Gao, K.; Jiang, X. Influence of particle size on transport of methotrexate across blood brain barrier by polysorbate 80-coated polybutylcyanoacrylate nanoparticles. Int. J. Pharm. 2006, 310, 213–219. [Google Scholar] [CrossRef] [PubMed]
- Dong, X. Current strategies for brain drug delivery. Theranostics 2018, 8, 1481–1493. [Google Scholar] [CrossRef] [PubMed]
- Oliveira, C.L.; Veiga, F.; Varela, C.; Roleira, F.; Tavares, E.; Silveira, I.; Ribeiro, A.J. Characterization of polymeric nanoparticles for intravenous delivery: Focus on stability. Colloids Surf. B Biointerfaces 2017, 150, 326–333. [Google Scholar] [CrossRef] [PubMed]
- Clogston, J.D.; Patri, A.K. Zeta potential measurement. Methods Mol. Biol. 2011, 697, 63–70. [Google Scholar] [PubMed]
- Monopoli, M.P.; Walczyk, D.; Campbell, A.; Elia, G.; Lynch, I.; Bombelli, F.B.; Dawson, K.A. Physical-chemical aspects of protein corona: Relevance to in vitro and in vivo biological impacts of nanoparticles. J. Am. Chem. Soc. 2011, 133, 2525–2534. [Google Scholar] [CrossRef] [PubMed]
- Akens, M.K.; Yee, A.J.; Wilson, B.C.; Burch, S.; Johnson, C.L.; Lilge, L.; Bisland, S.K. Photodynamic therapy of vertebral metastases: Evaluating tumor-to-neural tissue uptake of BPD-MA and ALA-PpIX in a murine model of metastatic human breast carcinoma. Photochem. Photobiol. 2007, 83, 1034–1039. [Google Scholar] [CrossRef] [PubMed]
- Elliott, J.T.; Samkoe, K.S.; Gunn, J.R.; Stewart, E.E.; Gardner, T.B.; Tichauer, K.M.; Lee, T.Y.; Hoopes, P.J.; Pereira, S.P.; Hasan, T.; et al. Perfusion CT estimates photosensitizer uptake and biodistribution in a rabbit orthotopic pancreatic cancer model: A pilot study. Acad. Radiol. 2015, 22, 572–579. [Google Scholar] [CrossRef] [PubMed]
- Mallidi, S.; Watanabe, K.; Timerman, D.; Schoenfeld, D.; Hasan, T. Prediction of tumor recurrence and therapy monitoring using ultrasound-guided photoacoustic imaging. Theranostics 2015, 5, 289–301. [Google Scholar] [CrossRef] [PubMed]
- de Paula, L.B.; Primo, F.L.; Tedesco, A.C. Nanomedicine associated with photodynamic therapy for glioblastoma treatment. Biophys. Rev. 2017, 9, 761–773. [Google Scholar] [CrossRef] [PubMed] [Green Version]
- Chen, Q.; Wang, X.; Wang, C.; Feng, L.; Li, Y.; Liu, Z. Drug-induced self-assembly of modified albumins as nano-theranostics for tumor-targeted combination therapy. ACS Nano 2015, 9, 5223–5233. [Google Scholar] [CrossRef] [PubMed]
- Das, K.C.; Misra, H.P. Hydroxyl radical scavenging and singlet oxygen quenching properties of polyamines. Mol. Cell. Biochem. 2004, 262, 127–133. [Google Scholar] [CrossRef] [PubMed]
- Itoh, S.; Nagaoka, S.; Mukai, K.; Ikesu, S.; Kaneko, Y. Kinetic study of quenching reactions of singlet oxygen and scavenging reactions of free radicals by α-, β-, λ- and σ- tocopheramines in ethanol solution and micellar dispersion. Lipids 1994, 29, 799–802. [Google Scholar] [CrossRef] [PubMed]
- Sneider, A.; VanDyke, D.; Paliwal, S.; Rai, P. Remotely triggered nano-theranostics for cancer applications. Nanotheranostics 2017, 1, 1–22. [Google Scholar] [CrossRef] [PubMed]
- Cui, X.; Morales, R.T.; Qian, W.; Wang, H.; Gagner, J.P.; Dolgalev, I.; Placantonakis, D.; Zagzag, D.; Cimmino, L.; Snuderl, M.; et al. Hacking macrophage-associated immunosuppression for regulating glioblastoma angiogenesis. Biomaterials 2018, 161, 164–178. [Google Scholar] [CrossRef] [PubMed]
- He, H.; Zhu, R.; Sun, W.; Cai, K.; Chen, Y.; Yin, L. Selective cancer treatment via photodynamic sensitization of hypoxia-responsive drug delivery. Nanoscale 2018, 10, 2856–2865. [Google Scholar] [CrossRef] [PubMed]
- Roschger, C.; Verwanger, T.; Krammer, B.; Cabrele, C. Reduction of cancer cell viability by synergistic combination of photodynamic treatment with the inhibition of the Id protein family. J. Photochem. Photobiol. B 2018, 178, 521–529. [Google Scholar] [CrossRef] [PubMed]
- Kim, S.; Thiessen, P.A.; Bolton, E.E.; Chen, J.; Fu, G.; Gindulyte, A.; Han, L.; He, J.; He, S.; Shoemaker, B.A.; et al. Pubchem substance and compound databases. Nucleic Acids Res. 2016, 44, D1202–D1213. [Google Scholar] [CrossRef] [PubMed]

| Characterization Parameter | Empty NPs | BPD NPs | CED NPs |
|---|---|---|---|
| Size (nm) | 73.0 ± 7.2 | 88.5 ± 6.7 | 102.3 ± 7.6 |
| PDI | 0.13 ± 0.03 | 0.11 ± 0.01 | 0.09 ± 0.03 |
| Zeta Potential (mV) | −29.1 ± 6.4 | −24.1 ± 6.1 | −16.3 ± 5.5 |
| Encapsulation Efficiency (%) | No Drug | 87.7 ± 7.4 | 78.2 ± 12.7 |
| kKP | n | Time to 50% Drug Release (Hours) | Time to 80% Drug Release (Hours) | |
|---|---|---|---|---|
| BPD | 58.355 | 0.089 | 0.25 | 36 |
| CED | 31.592 | 0.462 | 2.6 | 7.5 |
| IC50 | HillSlope Value | Equation of the Line | R2 | |
|---|---|---|---|---|
| BPD | 172 nM | −1.2 | Y = −9.875 + (101.6 + 9.875)/(1 + 10^((2.236 − x) * −1.2) | 0.98 |
| CED | 6 uM | −2 | Y = −5 + (91 + 5)/(1 + 10^((1 − x) * −2) | 0.96 |
| Co-Administration Combination | CDI (DT) | CDI (PDT) |
|---|---|---|
| Cf2.5 + Bf50 | 1.028 | 0.689 |
| Cn2.5 + Bn50 | 1.048 | 0.793 |
| Cf5 + Bf50 | 1.226 | 0.855 |
| Cn5 + Bn50 | 1.029 | 1.040 |
© 2018 by the authors. Licensee MDPI, Basel, Switzerland. This article is an open access article distributed under the terms and conditions of the Creative Commons Attribution (CC BY) license (http://creativecommons.org/licenses/by/4.0/).
Share and Cite
Kydd, J.; Jadia, R.; Rai, P. Co-Administered Polymeric Nano-Antidotes for Improved Photo-Triggered Response in Glioblastoma. Pharmaceutics 2018, 10, 226. https://doi.org/10.3390/pharmaceutics10040226
Kydd J, Jadia R, Rai P. Co-Administered Polymeric Nano-Antidotes for Improved Photo-Triggered Response in Glioblastoma. Pharmaceutics. 2018; 10(4):226. https://doi.org/10.3390/pharmaceutics10040226
Chicago/Turabian StyleKydd, Janel, Rahul Jadia, and Prakash Rai. 2018. "Co-Administered Polymeric Nano-Antidotes for Improved Photo-Triggered Response in Glioblastoma" Pharmaceutics 10, no. 4: 226. https://doi.org/10.3390/pharmaceutics10040226