
Structural Transitions in Nanosized Zn0.97Al0.03O Powders under High Pressure Analyzed by in Situ Angle-Dispersive X-ray Diffraction

 , and
, and
Abstract
:1. Introduction
2. Experimental Details
3. Results and Discussion
4. Conclusions
Acknowledgments
Author Contributions
Conflicts of Interest
References
- Mang, A.; Reimann, K.; Rubenacke, S. Band gaps, crystal-field splitting, spin-orbit coupling, and exciton binding energies in ZnO under hydrostatic pressure. Solid State Commun. 1995, 94, 251–254. [Google Scholar] [CrossRef]
- Mohanta, A.; Thareja, R.K. Rayleigh scattering from gaseous phase nanoparticles synthesized by pulsed laser ablation of ZnO. J. Appl. Phys. 2009, 106, 124909. [Google Scholar] [CrossRef]
- Mohanta, A.; Singh, V.; Thareja, R.K. Photoluminescence from ZnO nanoparticles in vapor phase. J. Appl. Phys. 2008, 104, 064903. [Google Scholar] [CrossRef]
- Mohanta, A.; Simmons, J.G., Jr.; Everitt, H.O.; Shen, G.; Kim, S.M.; Kung, P. Effect of pressure and Al doping on structural and optical properties of ZnO nanowires synthesized by chemical vapor deposition. J. Luminescence 2014, 146, 470–474. [Google Scholar] [CrossRef]
- Mohanta, A.; Thareja, R.K. Photoluminescence characteristics of catalyst free ZnO nanowires. Mater. Res. Express 2014, 1, 015023. [Google Scholar] [CrossRef]
- Mohanta, A.; Thareja, R.K. Photoluminescence study of ZnO nanowires grown by thermal evaporation on pulsed laser deposited ZnO buffer layer. J. Appl. Phys. 2008, 104, 044906. [Google Scholar] [CrossRef]
- Huang, J.M.; Tsai, S.Y.; Ku, C.S.; Lin, C.M.; Chen, S.Y.; Lee, H.Y. Enhanced electrical properties and field emission characteristics of AZO/ZnO-nanowire core–shell structures. Phys. Chem. Chem. Phys. 2016, 18, 15251–15259. [Google Scholar] [CrossRef] [PubMed]
- Thareja, R.K.; Saxena, H.; Narayanan, V. Laser-ablated ZnO for thin films of ZnO and MgxZn(1−x)O. J. Appl. Phys. 2005, 98, 034908. [Google Scholar] [CrossRef]
- Mohanta, A.; Thareja, R.K. Photoluminescence study of ZnCdO alloy. J. Appl. Phys. 2008, 103, 024901. [Google Scholar] [CrossRef]
- Mohanta, A.; Thareja, R.K. Temperature-dependent S-Shaped photoluminescence in ZnCdO alloy. J. Appl. Phys. 2010, 107, 084904. [Google Scholar] [CrossRef]
- Fathollahi, V.; Amini, M.M. Sol–Gel Preparation of Highly Oriented Gallium-Doped Zinc Oxide Thin Films. Mater. Lett. 2001, 50, 235–239. [Google Scholar] [CrossRef]
- Arredondo, E.J.L.; Maldonado, A.; Asomoza, R.; Acosta, D.R.; Lira, M.A.M.; Olvera, M.; de la, L. Indium-Doped ZnO Thin Films Deposited by the Sol-Gel Technique. Thin Solid Films 2005, 490, 132–136. [Google Scholar] [CrossRef]
- Srinivasan, G.; Rajendra Kumar, R.T.; Kumar, J. Influence of Al dopant on microstructure and optical properties of ZnO thin films prepared by sol–gel spin coating method. Opt. Mater. 2007, 30, 314–317. [Google Scholar] [CrossRef]
- Shirouzu, K.; Ohkusa, T.; Hotta, M.; Enomoto, N.; Hojo, J. Distribution and Solubility Limit of Al in Al2O3-Doped ZnO Sintered Body. J. Ceram. Soc. Jpn. 2007, 115, 254–258. [Google Scholar] [CrossRef]
- Kadam, P.; Agashe, C.; Mahamuni, S. Al-doped ZnO nanocrystals. J. Appl. Phys. 2008, 104, 103501. [Google Scholar] [CrossRef]
- Chen, K.J.; Fang, T.H.; Hung, F.Y. The crystallization and physical properties of Al-doped ZnO nanoparticles. J. Appl. Surf. Sci. 2008, 254, 5791–5795. [Google Scholar] [CrossRef]
- Serier, H.; Gaudon, M.; Ménétrier, M. Al-doped ZnO powdered materials: Al solubility limit and IR absorption properties. Solid State Sci. 2009, 11, 1192–1197. [Google Scholar] [CrossRef]
- Bazer-Bachi, D.; Coupard, V.; Maury, S.; Rebours, B. Method of Preparing Alcohol Esters from Triglycerides and Alcohols Using Heterogeneous Catalysts Combining at Least a ZnxAl2O3+x Type Solid Solution and ZnO. U.S. Patent 8383846B2, 26 February 2013. [Google Scholar]
- Chen, Z.; Zhan, G.; Lu, Z. Solvothermal synthesis and conductive properties of nanorod-constructed Al-doped ZnO microflowers. J. Mater. Sci.: Mater. Electron 2014, 25, 1724–1730. [Google Scholar] [CrossRef]
- Suwanboon, S.; Amornpitoksuk, P.; Haidoux, A.; Tedenac, J.C. Structural and optical properties of undoped and aluminium doped zinc oxide nanoparticles via precipitation method at low temperature. J. Alloys Compd. 2008, 462, 335–339. [Google Scholar] [CrossRef]
- Kim, H.; Gilmore, C.M.; Piqué, A.; Horwitz, J.S.; Mattoussi, H.; Murata, H.; Kafafi, Z.H.; Chrisey, D.B. Electrical, optical, and structural properties of indium-tin-oxide thin films for organic light-emitting devices. J. Appl. Phys. 1999, 86, 6451–6461. [Google Scholar] [CrossRef]
- Minami, T. Transparent conducting oxide semiconductors for transparent electrodes. Semicond. Sci. Tech. 2005, 20, 35–44. [Google Scholar] [CrossRef]
- Meyer, J.; Gorrn, P.; Hamwi, S.; Johannes, H.H.; Riedl, T.; Kowalsky, W. Indium-free transparent organic light emitting diodes with Al doped ZnO electrodes grown by atomic layer and pulsed laser deposition. Appl. Phys. Lett. 2008, 93, 073308. [Google Scholar] [CrossRef]
- Bayarjargal, L.; Wiehl, L.; Winkler, B. Influence of grain size, surface energy, and deviatoric stress on the pressure induced phase transition of ZnO and AlN. High Press. Res. 2013, 33, 642–651. [Google Scholar] [CrossRef]
- Jiang, J.Z.; Olsen, J.S.; Gerward, L.; Frost, D.; Rubie, D.; Peyronneau, J. Structural stability in nanocrystalline ZnO. Europhys. Lett. 2000. [Google Scholar] [CrossRef]
- Grzanka, E.; Gierlotka, S.; Stelmakh, S.; Palosz, B.; Strachowski, R.; Swiderska, S.A.; Kalisz, G.; Lojkowski, W.; Porsch, F. Phase transition in nanocrystalline ZnO. Z. Kristallogr. Suppl. 2006. [Google Scholar] [CrossRef]
- Duzynska, A.; Hrubiak, R.; Drozd, V.; Teisseyre, H.; Paszkowicz, W.; Reszka, A.; Kaminska, A.; Saxena, S.; Fidelus, J.D.; Grabis, J.C.; et al. The structural and optical properties of ZnO bulk and nanocrystals under high pressure. High Pressure Res. 2012, 32, 354–363. [Google Scholar] [CrossRef]
- Wang, Y.; Zhang, Y.; Chang, W.J.; Lu, G.L.; Jiang, J.Z.; Li, Y.C.; Liu, J.; Hu, T.D. Mn effect on wurtzite-to-cubic phase transformation in ZnO. J. Phys. Chem. Solids 2005, 66, 1775–1778. [Google Scholar] [CrossRef]
- Lin, C.M.; Lin, K.L.; Chern, Y.K.; Hsua, C.H.; Sheu, H.S.; Liao, Y.F.; Suen, Y.W.; Jian, S.R.; Juang, J.Y. Pressure-induced structural phase transition in bulk Zn0.98Mn0.02O by angular dispersive X-ray diffraction. J. Alloys Compd. 2014, 604, 1775–1778. [Google Scholar] [CrossRef]
- Niesz, D.E.; Bennett, R.B.; Snyder, M.J. America Ceramic society. Am. Ceram. Soc. Bull. 1972, 51, 677. [Google Scholar]
- Mao, H.K.; Xu, J.; Bell, P.M. Calibration of the Ruby Pressure Gauge to 800 kbar Under Quasi. J. Geophys. Res. 1986, 91, 4673. [Google Scholar] [CrossRef]
- Angel, R.J.; Bujak, M.; Zhao, J.; Gatta, G.D.; Jacobsen, S.D. Effective hydrostatic limits of pressure media for high-pressure crystallographic studies. J. Appl. Crystallogr. 2007, 40, 26–32. [Google Scholar] [CrossRef]
- Klotz, S.; Chervin, J.C.; Munsch, P.; Marchand, G.L. Hydrostatic limits of 11 pressure transmitting media. J. Phys. D Appl. Phys. 2009, 42, 075413. [Google Scholar] [CrossRef]
- Larson, A.C.; von Dreele, R.B. General Structure Analysis System (GSAS); Los Alamos National Laboratory: Los Alamos, NM, USA, 2000. [Google Scholar]
- Mote, V.D.; Purushotham, Y.; Dole, B.N. Williamson-Hall analysis in estimation of lattice strain in nanometer-sized ZnO particles. J. Theor. Appl. Phys. 2012. [Google Scholar] [CrossRef]
- Brehm, J.U.; Winterer, M.; Hahn, H. Synthesis and local structure of doped nanocrystalline zinc oxides. J. Appl. Phys. 2006, 100, 064311. [Google Scholar] [CrossRef]
- Ku, C.S.; Huang, J.M.; Cheng, C.Y.; Lin, C.M.; Lee, H.Y. Annealing effect on the optical response and interdiffusion of n-ZnO/p-Si (111) heterojunction grown by atomic layer deposition. Appl. Phys. Lett. 2010, 97, 181915. [Google Scholar] [CrossRef]
- Farbod, M.; Shoushtari, M.Z.; Parhoodeh, S. Fabrication and characterization of Zn1−xAlxO nanoparticles by DC arc plasma. Phys. B Condens. Matter. 2011, 406, 205–210. [Google Scholar] [CrossRef]
- Noh, J.H.; Han, H.S.; Lee, S.; Kim, D.H.; Park, J.H.; Park, S.; Kim, J.Y.; Jung, H.S.; Hong, K.S. A newly designed Nb-doped TiO2/Al-doped ZnO transparent conducting oxide multilayer for electrochemical photoenergy conversion devices. J. Phys. Chem. C 2010, 114, 13867–13871. [Google Scholar] [CrossRef]
- Choi, Y.J.; Gong, S.C.; Park, C.S.; Lee, H.S.; Jang, J.G.; Chang, H.J.; Yeom, G.Y.; Park, H.H. Improved performance of organic light-emitting diodes fabricated on Al-doped ZnO anodes incorporating a homogeneous Al-doped ZnO buffer layer grown by atomic layer deposition. ACS Appl. Mater. Interfaces 2013, 5, 3650–3655. [Google Scholar] [CrossRef] [PubMed]
- Alberti, A.; Marco, L.D.; Pellegrino, G.; Condorelli, G.G.; Giannuzzi, R.; Scarfiello, R.; Manca, M.; Spinella, C.; Gigli, G.; Magna, A.L. Combined strategy to realize efficient photoelectrodes for low temperature fabrication of dye solar cells. ACS Appl. Mater. Interfaces 2014, 6, 6425–6433. [Google Scholar] [CrossRef] [PubMed]
- Yu, S.C.; Spain, I.L.; Skelton, E.F. Lattice dynamics and hyperfine interactions in ZnO and ZnSe at high external pressures. Solid State Commun. 1978. [Google Scholar] [CrossRef]
- Karzel, H.; Potzel, W.; Köfferlein, M.; Schiessel, W.; Sreiner, M.; Hiller, U.; Kalvius, G.M.; Mitchell, D.W.; Das, T.P.; Blaha, P.; et al. High pressure phase transitions in tetrahedrally coordinated semiconducting compounds. Phys. Rev. B 1996, 53, 49–52. [Google Scholar]
- Gerward, L.; Staun Olsen, J. The High-Pressure Phase of Zincite. J. Synchrotron Radiat. 1995, 2, 233–235. [Google Scholar] [CrossRef] [PubMed]
- Desgreniers, S. High-density phases of ZnO: Structural and compressive parameters. Phys. Rev. B 1998. [Google Scholar] [CrossRef]
- Liu, H.; Ding, Y.; Somayazulu, M.; Qian, J.; Shu, J.; Häusermann, D.; Mao, H.K. Rietveld refinement study of the pressure dependence of the internal structural parameter u in the wurtzite phase of ZnO. Phys. Rev. B 2005, 71, 212103. [Google Scholar] [CrossRef]
- Sowa, H.; Ahsbahs, H. High-pressure X-ray investigation of zincite ZnO single crystals using diamond anvils with an improved shape. J. Appl. Crystallogr. 2006, 39, 169–175. [Google Scholar] [CrossRef]
- Cai, J. First-principles study of the wurtzite-to-rocksalt phase transition in zinc oxide. J. Phys. Condens. Matter 2007, 19, 266207. [Google Scholar] [CrossRef] [PubMed]
- Hemley, R.J. Ultrahigh-Pressure Mineralogy: Physics and Chemistry of the Earth’s Deep Interior; Mineralogical Society of America: Washington, DC, USA, 1998. [Google Scholar]
- Decremps, F.; Datchi, F.; Saitta, A.M.; Polian, A.; Pascarelli, S.; Cicco, A.D.; Itie, J.P.; Baudelet, F. Local structure of condensed zinc oxide. Phys. Rev. B 2003. [Google Scholar] [CrossRef]
- Dong, Z.; Zhuravlev, K.K.; Morin, S.A.; Li, L.; Jin, S.; Song, Y. Pressure-Induced Structural Transformations of ZnO Nanowires Probed by X-ray Diffraction. J. Phys. Chem. C 2012, 116, 2102–2107. [Google Scholar] [CrossRef]
- Wang, L.; Liu, H.; Qian, J.; Yang, W.; Zhao, Y. Structural Stability and Compressibility Study for ZnO Nanobelts under High Pressure. J. Phys. Chem. C 2012, 116, 2074–2079. [Google Scholar] [CrossRef]
- Lin, C.M.; Lin, K.L.; Chern, Y.K.; Lin, Y.K.; Chuang, Y.C.; Liao, Y.F.; Suen, Y.W.; Jian, S.R.; Juang, J.Y. Pressure-Induced Phase Transitions in InAs Studied by Angular-Dispersive X-ray Diffraction and Raman Spectroscopy. Sci. Adv. Mater. 2015, 7, 1039–1044. [Google Scholar] [CrossRef]
- Saitta, A.M.; Decremps, F. Unifying description of the wurtzite-to-rocksalt phase transition in wide-gap semiconductors: The effect of d electrons on the elastic constants. Phys. Rev. B 2004, 70, 035214. [Google Scholar] [CrossRef]
- Limpijumnong, S.; Jungthawan, S. First-principles study of the wurtzite-to-rocksalt homogeneous transformation in ZnO: A case of a low-transformation barrier. Phys. Rev. B 2004, 70, 054104. [Google Scholar] [CrossRef]
- Kisi, E.; Elcombe, M.M. Parameters for the Wurtzite Structure of ZnS and ZnO using Powder Neutron Diffraction. Acta Crystallogr. Sect. C Cryst. Struct. Commun. 1989, 45, 1867–1870. [Google Scholar] [CrossRef]
- Pauling, L. The nature of the chemical bond. iv. The energy of single bonds and the relative electronegativity of atoms. J. Am. Chem. Soc. 1932, 54, 3570–3582. [Google Scholar] [CrossRef]
- Kumar, R.S.; Cornelius, A.L.; Nicol, M.F. Structure of nanocrystalline ZnO up to 85 GPa. Curr. Appl. Phys. 2007, 7, 135–138. [Google Scholar] [CrossRef]
- Hou, D.B.; Ma, Y.Z.; Gao, C.X.; Chaudhuri, J.R.; Lee, G.; Yang, H.B. Compression of a crystalline ZnO nanotube: An experimental exploration of the B4 to B1 transition mechanism. J. Appl. Phys. 2009. [Google Scholar] [CrossRef]
- Özgür, Ü.; Alivov, Y.I.; Liu, C.; Teke, A.; Reshchikov, M.A.; Doğan, S.; Avrutin, V.; Cho, S.J.; Morkoç, H. A comprehensive review of ZnO materials and devices. J. Appl. Phys. 2005, 98, 041301. [Google Scholar] [CrossRef]
- Apai, G.; Hamilton, J.; Stohr, J.; Thompson, A. Extended X-ray—Absorption Fine Structure of Small Cu and Ni Clusters: Binding-Energy and Bond-Length Changes with Cluster Size. Phys. Rev. Lett. 1979. [Google Scholar] [CrossRef]
- Balerna, A.; Bernieri, E.; Picozzi, P.; Reale, A.; Santucci, S.; Burattini, E.; Mobilio, S. Extended X-ray-absorption fine-structure and near-edge-structure studies on evaporated small clusters of Au. Phys. Rev. B 1985. [Google Scholar] [CrossRef]
- Cammarata, R.C. Surface and Interface Stress Effects in Thin Films. Prog. Surf. Sci. 1994, 46, 1–38. [Google Scholar] [CrossRef]
- Jaffe, H.W. Introduction to Crystal Chemistry, 2nd ed.; Cambridge University Press: Cambridge, UK, 1988. [Google Scholar]


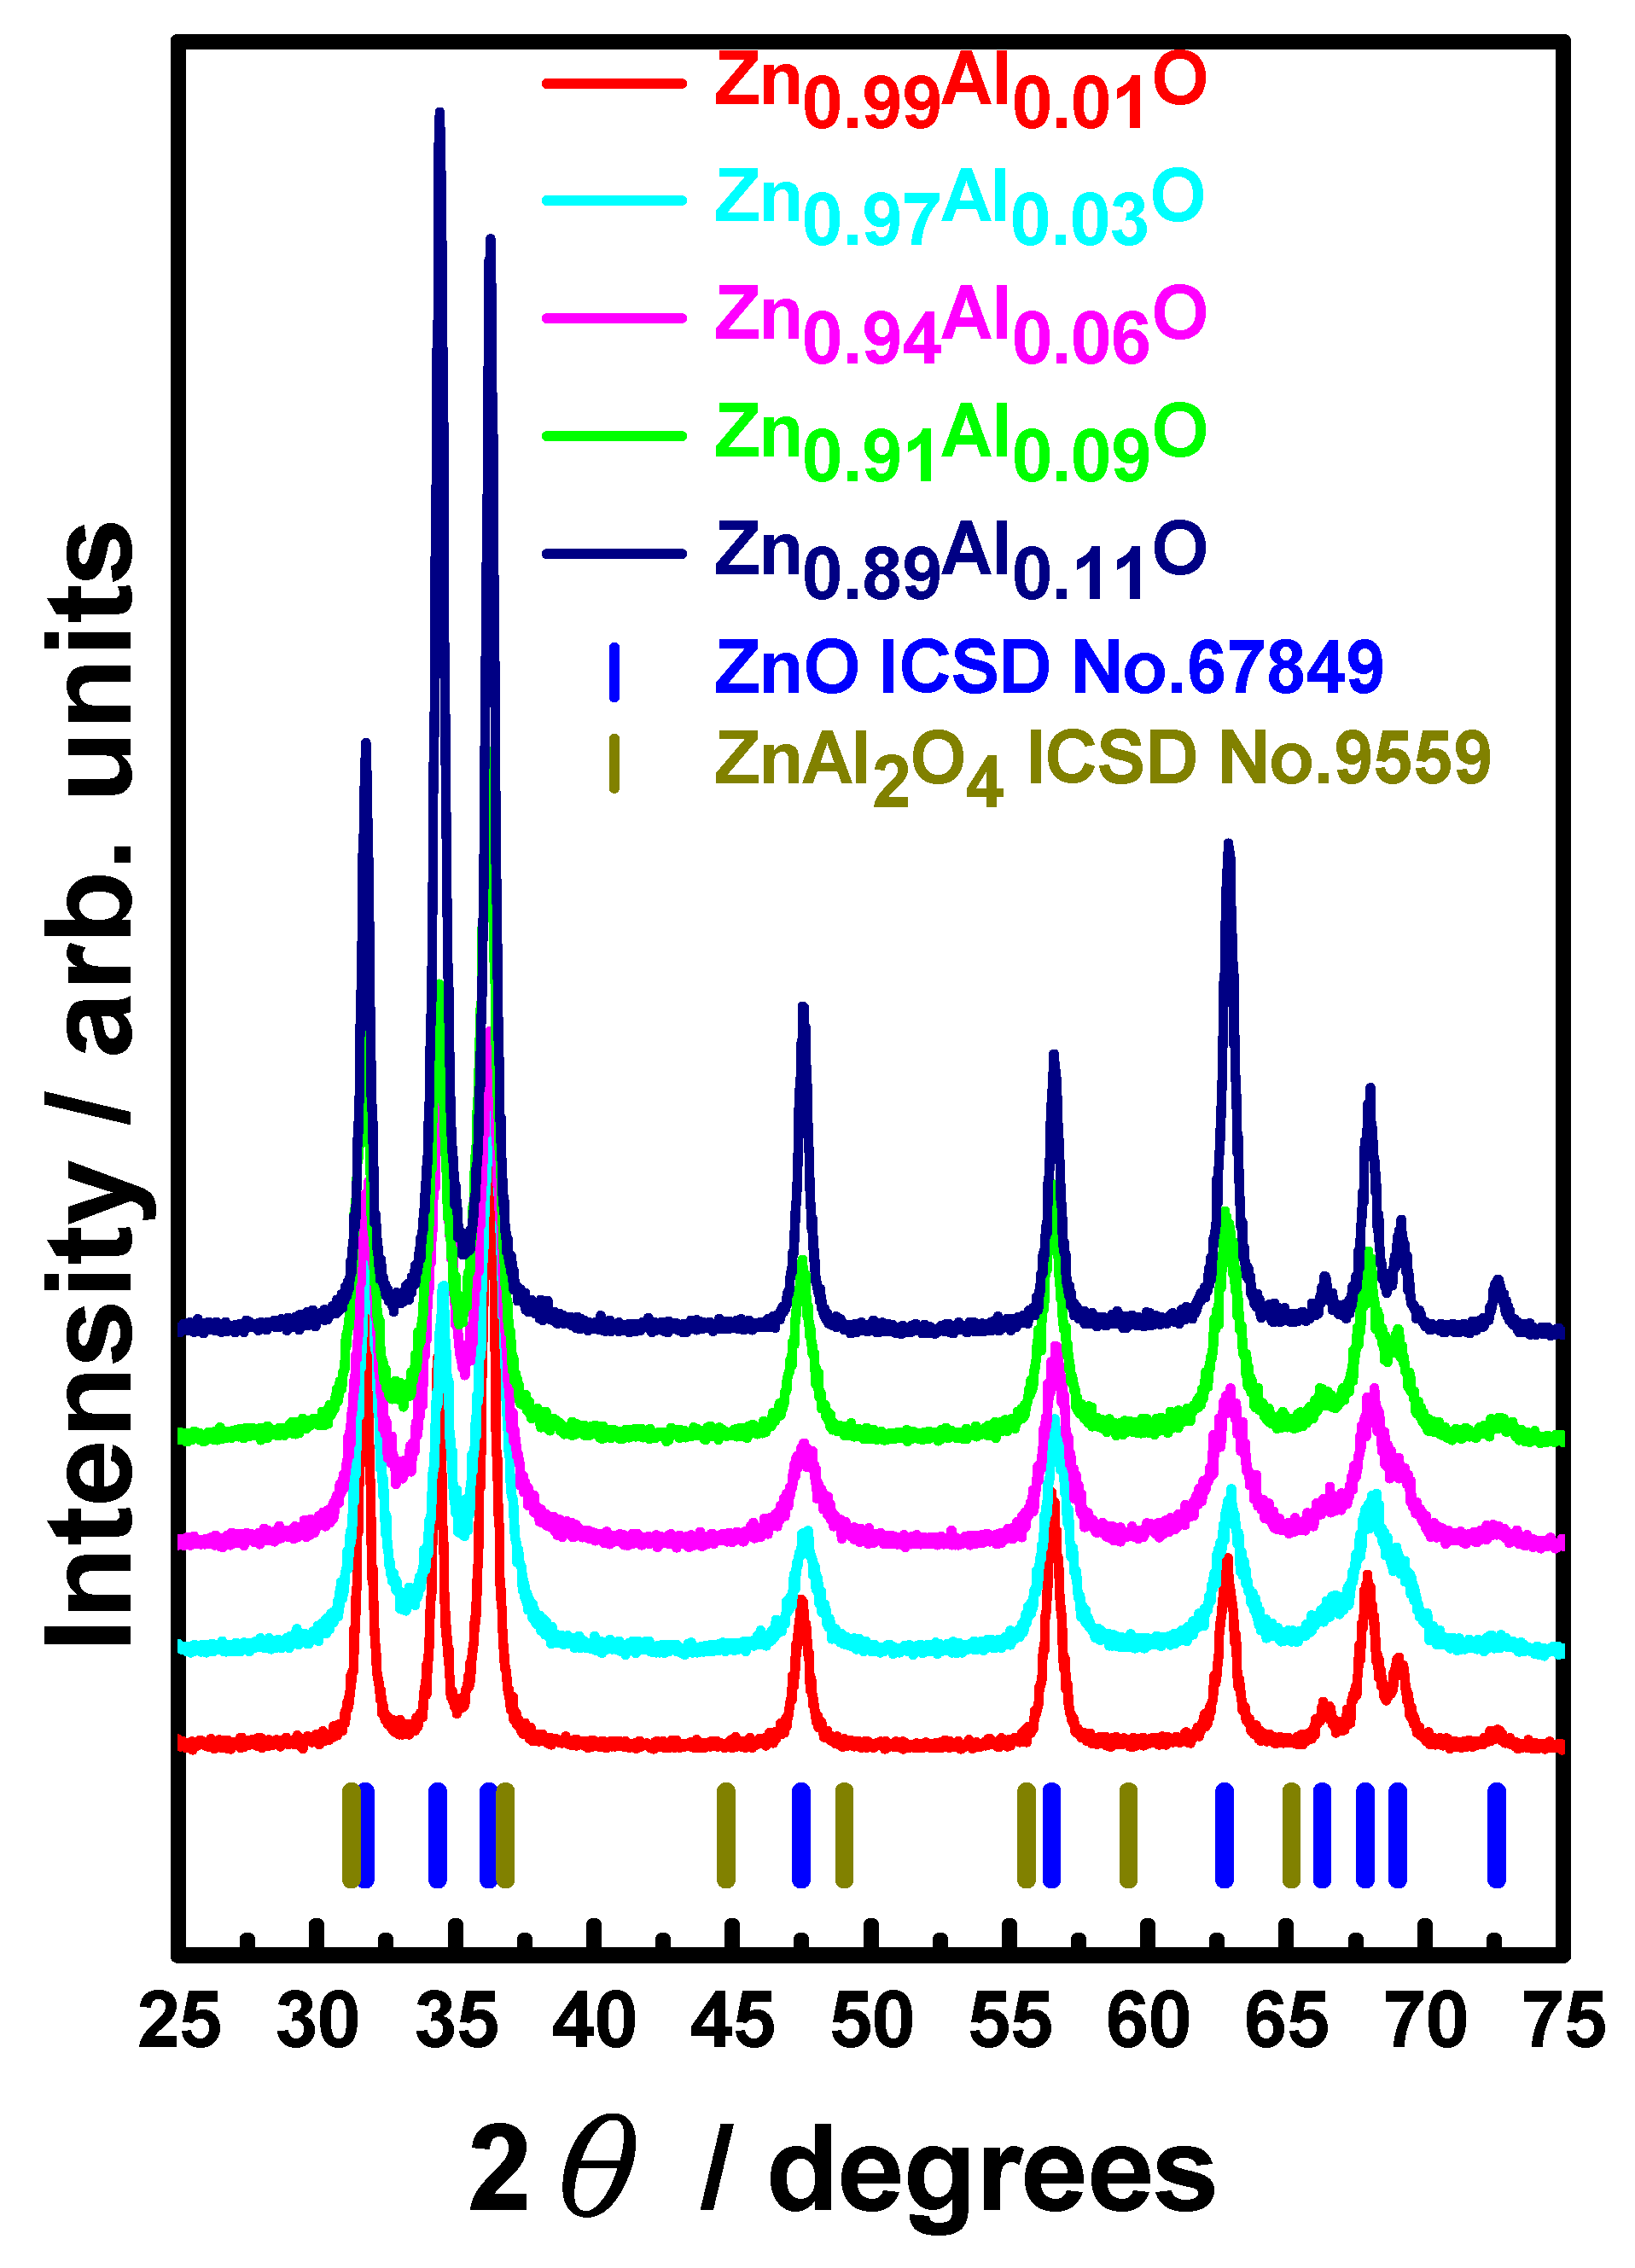
| AZO-NPs | A (Å) | C (Å) | Atomic Volume (Å3) |
|---|---|---|---|
| Zn0.99Al0.01O | 3.248(3) | 5.202(1) | 23.788(2) |
| Zn0.97Al0.03O | 3.247(1) | 5.199(1) | 23.737(2) |
| Zn0.94Al0.06O | 3.246(3) | 5.197(2) | 23.783(2) |
| Zn0.91Al0.09O | 3.245(4) | 5.195(1) | 23.779(2) |
| Zn0.89Al0.11O | 3.244(3) | 5.190(2) | 23.776(1) |
| AZO-NPs | Zn0.99Al0.01O | Zn0.97Al0.03O | Zn0.94Al0.06O | Zn0.91Al0.09O | Zn0.89Al0.11O | |
|---|---|---|---|---|---|---|
| ICP-AES | ||||||
| measured concentration of Zn/mg L−1 | 17.05 | 32.61 | 25.91 | 27.63 | 30.80 | |
| measured concentration of Al/mg L−1 | 0.15 | 0.49 | 0.73 | 1.02 | 1.55 | |
| measured mole of Zn/μmole | 13.04 | 24.94 | 19.81 | 21.13 | 23.55 | |
| measured mole of Al/μmole | 0.27 | 0.90 | 1.36 | 1.89 | 2.87 | |
| atomic concentration/at % | 2.03 | 3.48 | 6.42 | 8.21 | 10.86 | |
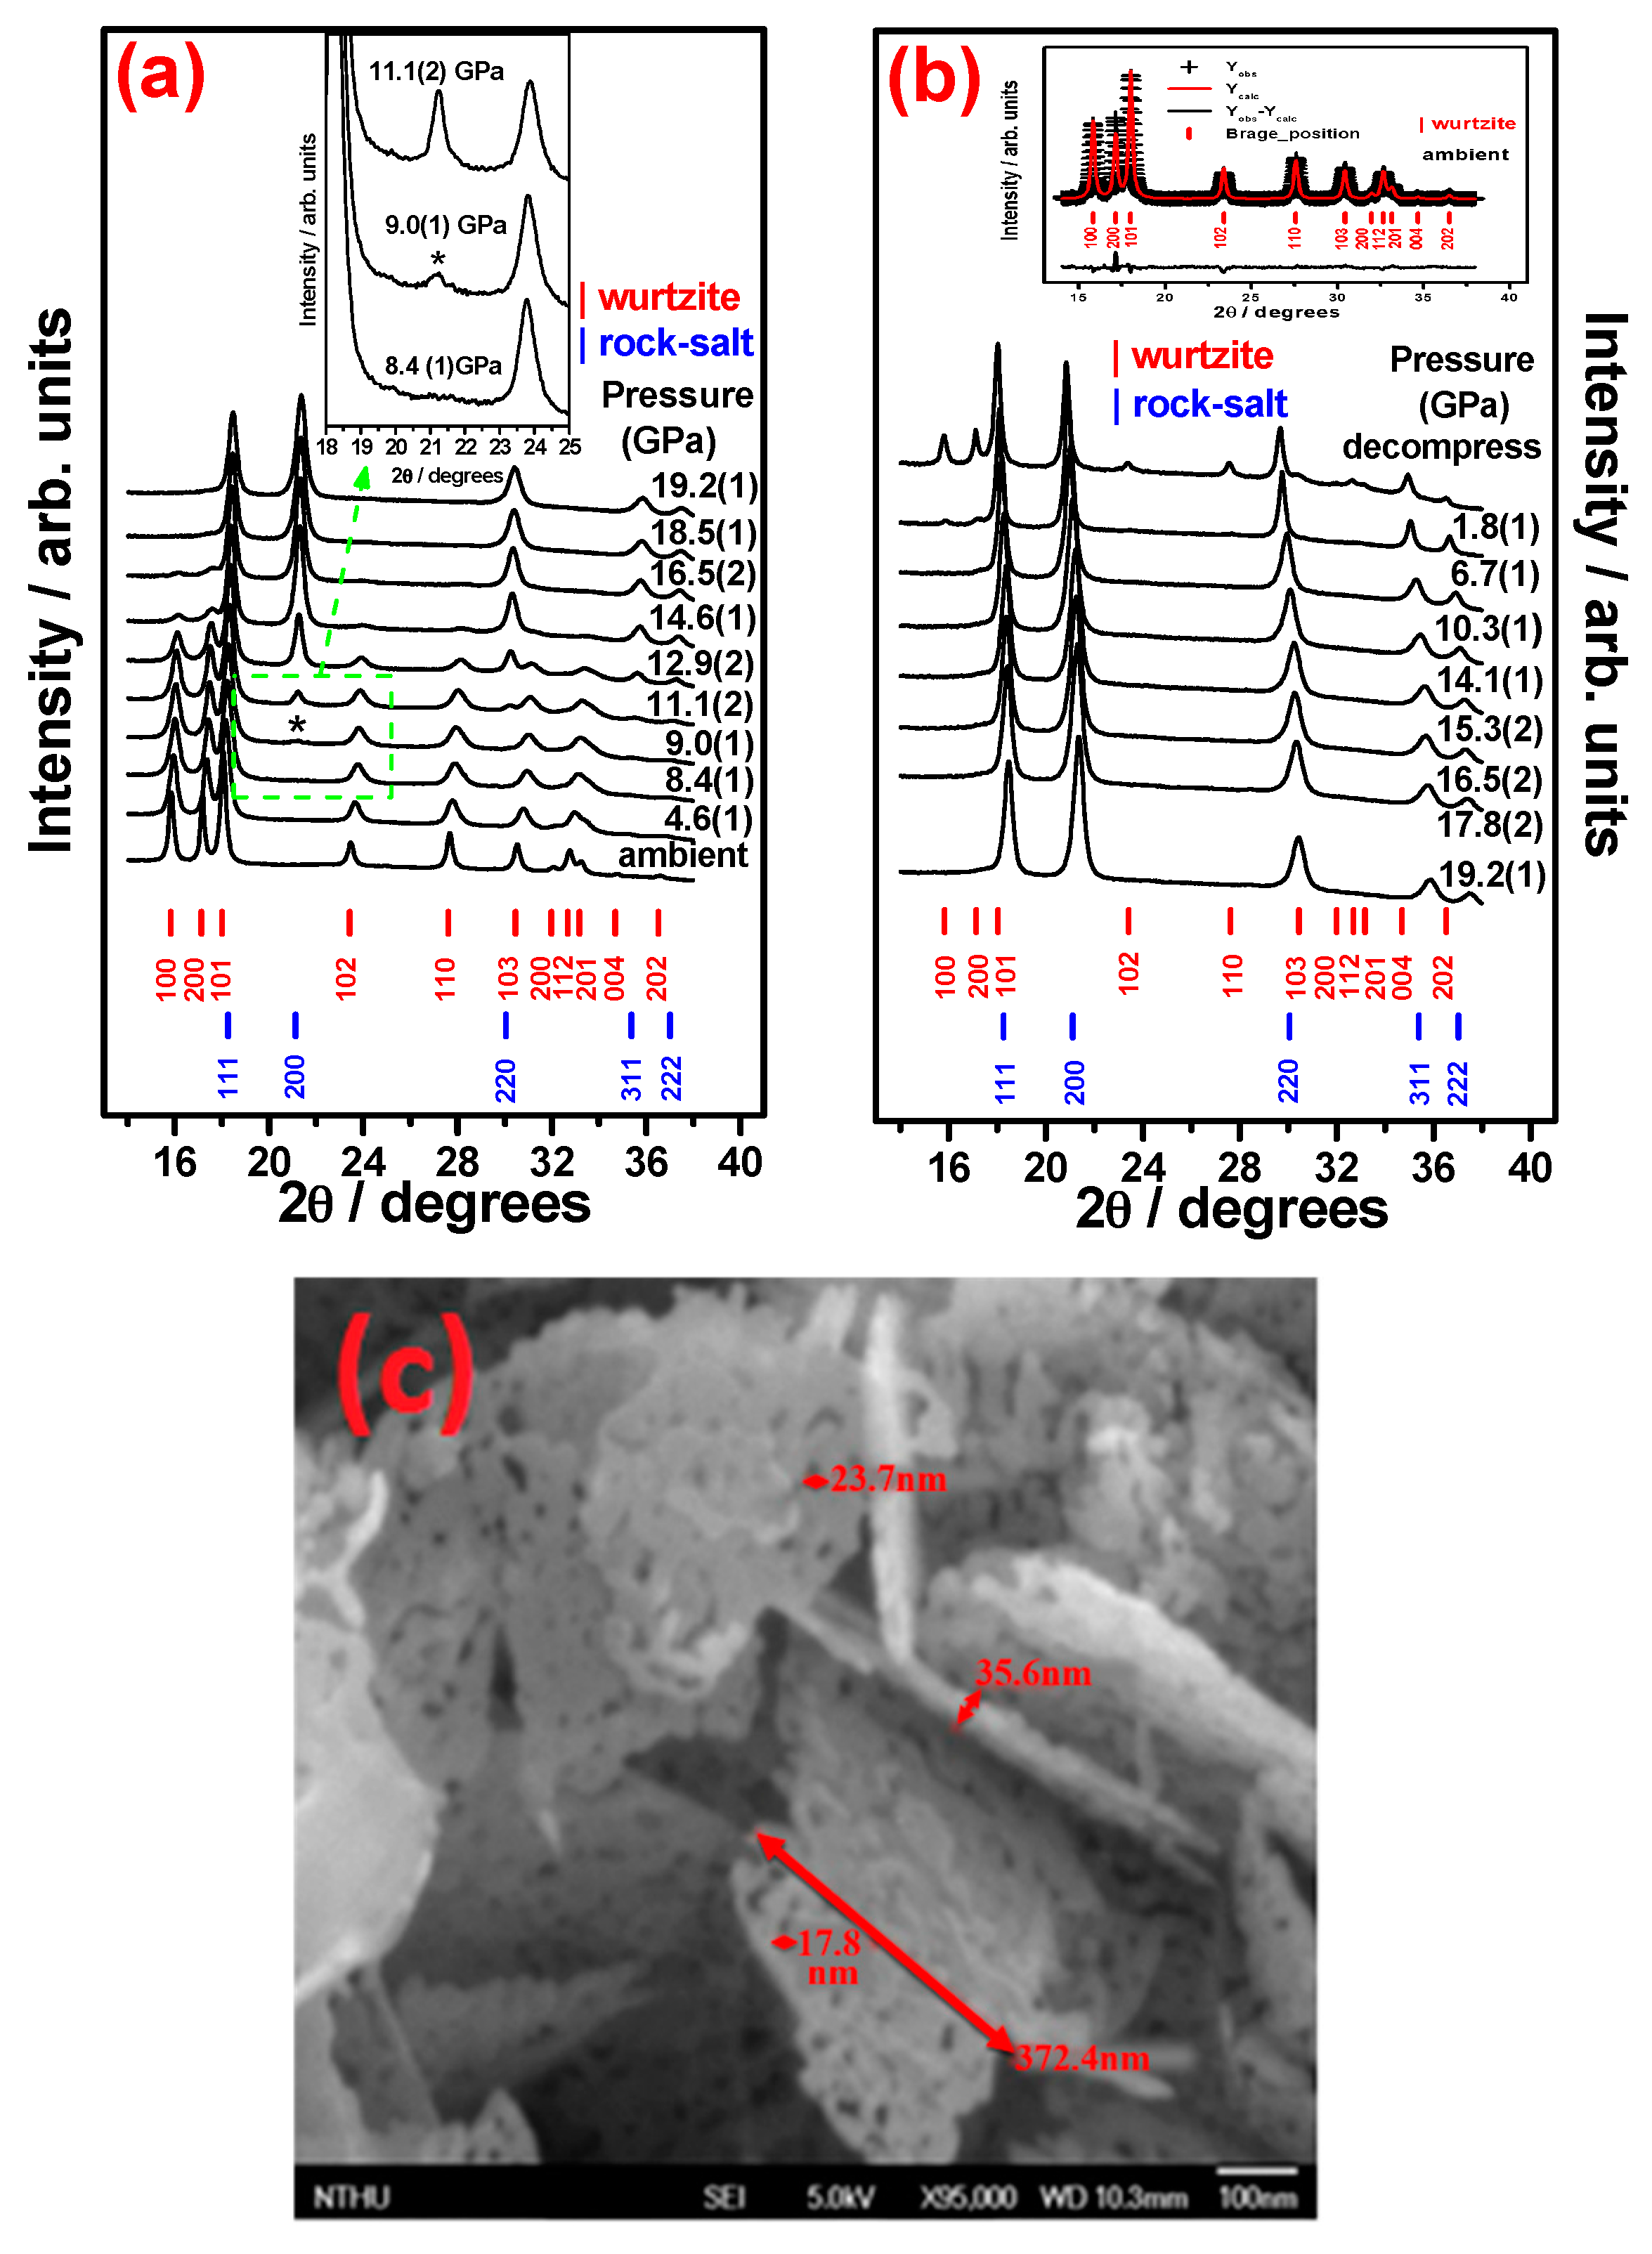
| Pressure (GPa) | A (Å) | C (Å) | c/a | u | dnn-c (Å) | dnn-et (Å) |
|---|---|---|---|---|---|---|
| ambient | 3.247(1) | 5.199(1) | 1.601(1) | 0.400(1) | 2.067(1) | 1.940(1) |
| 2.0(1) | 3.238(1) | 5.178(1) | 1.599(1) | 0.402(1) | 2.049(1) | 1.946(1) |
| 2.5(1) | 3.236(1) | 5.169(1) | 1.597(1) | 0.401(1) | 2.047(1) | 1.944(1) |
| 2.9(1) | 3.234(1) | 5.159(1) | 1.596(1) | 0.403(1) | 2.050(1) | 1.941(1) |
| 3.4(1) | 3.233(1) | 5.156(1) | 1.595(1) | 0.404(1) | 2.054(1) | 1.938(1) |
| 4.6(1) | 3.228(2) | 5.132(1) | 1.591(1) | 0.406(1) | 2.059(1) | 1.930(1) |
| 5.3(1) | 3.225(2) | 5.130(1) | 1.591(2) | 0.405(1) | 2.047(1) | 1.932(1) |
| 6.5(1) | 3.219(1) | 5.117(1) | 1.589(1) | 0.407(1) | 2.055(1) | 1.926(1) |
| 7.5(1) | 3.216(1) | 5.109(1) | 1.588(1) | 0.404(1) | 2.068(1) | 1.919(1) |
| 8.4(1) | 3.212(1) | 5.102(1) | 1.588(2) | 0.405(1) | 2.058(1) | 1.918(2) |
| 9.0(1) | 3.207(1) | 5.094(1) | 1.588(1) | 0.407(1) | 2.067(1) | 1.913(1) |
| 10.2(1) | 3.204(1) | 5.092(1) | 1.589(1) | 0.408(1) | 2.102(1) | 1.901(1) |
| 10.4(1) | 3.203(2) | 5.091(2) | 1.590(1) | 0.409(1) | 2.121(2) | 1.898(1) |
| 11.1(2) | 3.201(2) | 5.087(2) | 1.590(1) | 0.414(1) | 2.176(1) | 1.884(1) |
| 12.1(1) | 3.194(1) | 5.082(1) | 1.591(1) | 0.428(1) | 2.297(1) | 1.860(1) |
| 12.9(2) | 3.193(1) | 5.082(2) | 1.592(1) | 0.433(1) | 2.393(1) | 1.846(1) |
| 14.6(1) | 3.192(1) | 5.081(1) | 1.591(1) | 0.443(1) | 2.521(1) | 1.835(1) |
| 16.0(1) | 3.188(1) | 5.080(1) | 1.594(1) | 0.470(1) | 2.536(1) | 1.832(2) |
| 16.5(2) | 3.190(1) | 5.079(1) | 1.592(1) | 0.498(1) | 2.590(1) | 1.831(1) |
© 2016 by the authors; licensee MDPI, Basel, Switzerland. This article is an open access article distributed under the terms and conditions of the Creative Commons Attribution (CC-BY) license (http://creativecommons.org/licenses/by/4.0/).
Share and Cite
Lin, C.-M.; Liu, H.-T.; Zhong, S.-Y.; Hsu, C.-H.; Chiu, Y.-T.; Tai, M.-F.; Juang, J.-Y.; Chuang, Y.-C.; Liao, Y.-F. Structural Transitions in Nanosized Zn0.97Al0.03O Powders under High Pressure Analyzed by in Situ Angle-Dispersive X-ray Diffraction. Materials 2016, 9, 561. https://doi.org/10.3390/ma9070561
Lin C-M, Liu H-T, Zhong S-Y, Hsu C-H, Chiu Y-T, Tai M-F, Juang J-Y, Chuang Y-C, Liao Y-F. Structural Transitions in Nanosized Zn0.97Al0.03O Powders under High Pressure Analyzed by in Situ Angle-Dispersive X-ray Diffraction. Materials. 2016; 9(7):561. https://doi.org/10.3390/ma9070561
Chicago/Turabian StyleLin, Chih-Ming, Hsin-Tzu Liu, Shi-Yao Zhong, Chia-Hung Hsu, Yi-Te Chiu, Ming-Fong Tai, Jenh-Yih Juang, Yu-Chun Chuang, and Yen-Fa Liao. 2016. "Structural Transitions in Nanosized Zn0.97Al0.03O Powders under High Pressure Analyzed by in Situ Angle-Dispersive X-ray Diffraction" Materials 9, no. 7: 561. https://doi.org/10.3390/ma9070561