3.1. Effect of Austenite Grain Size on the Formation of Induced Acicular Ferrite
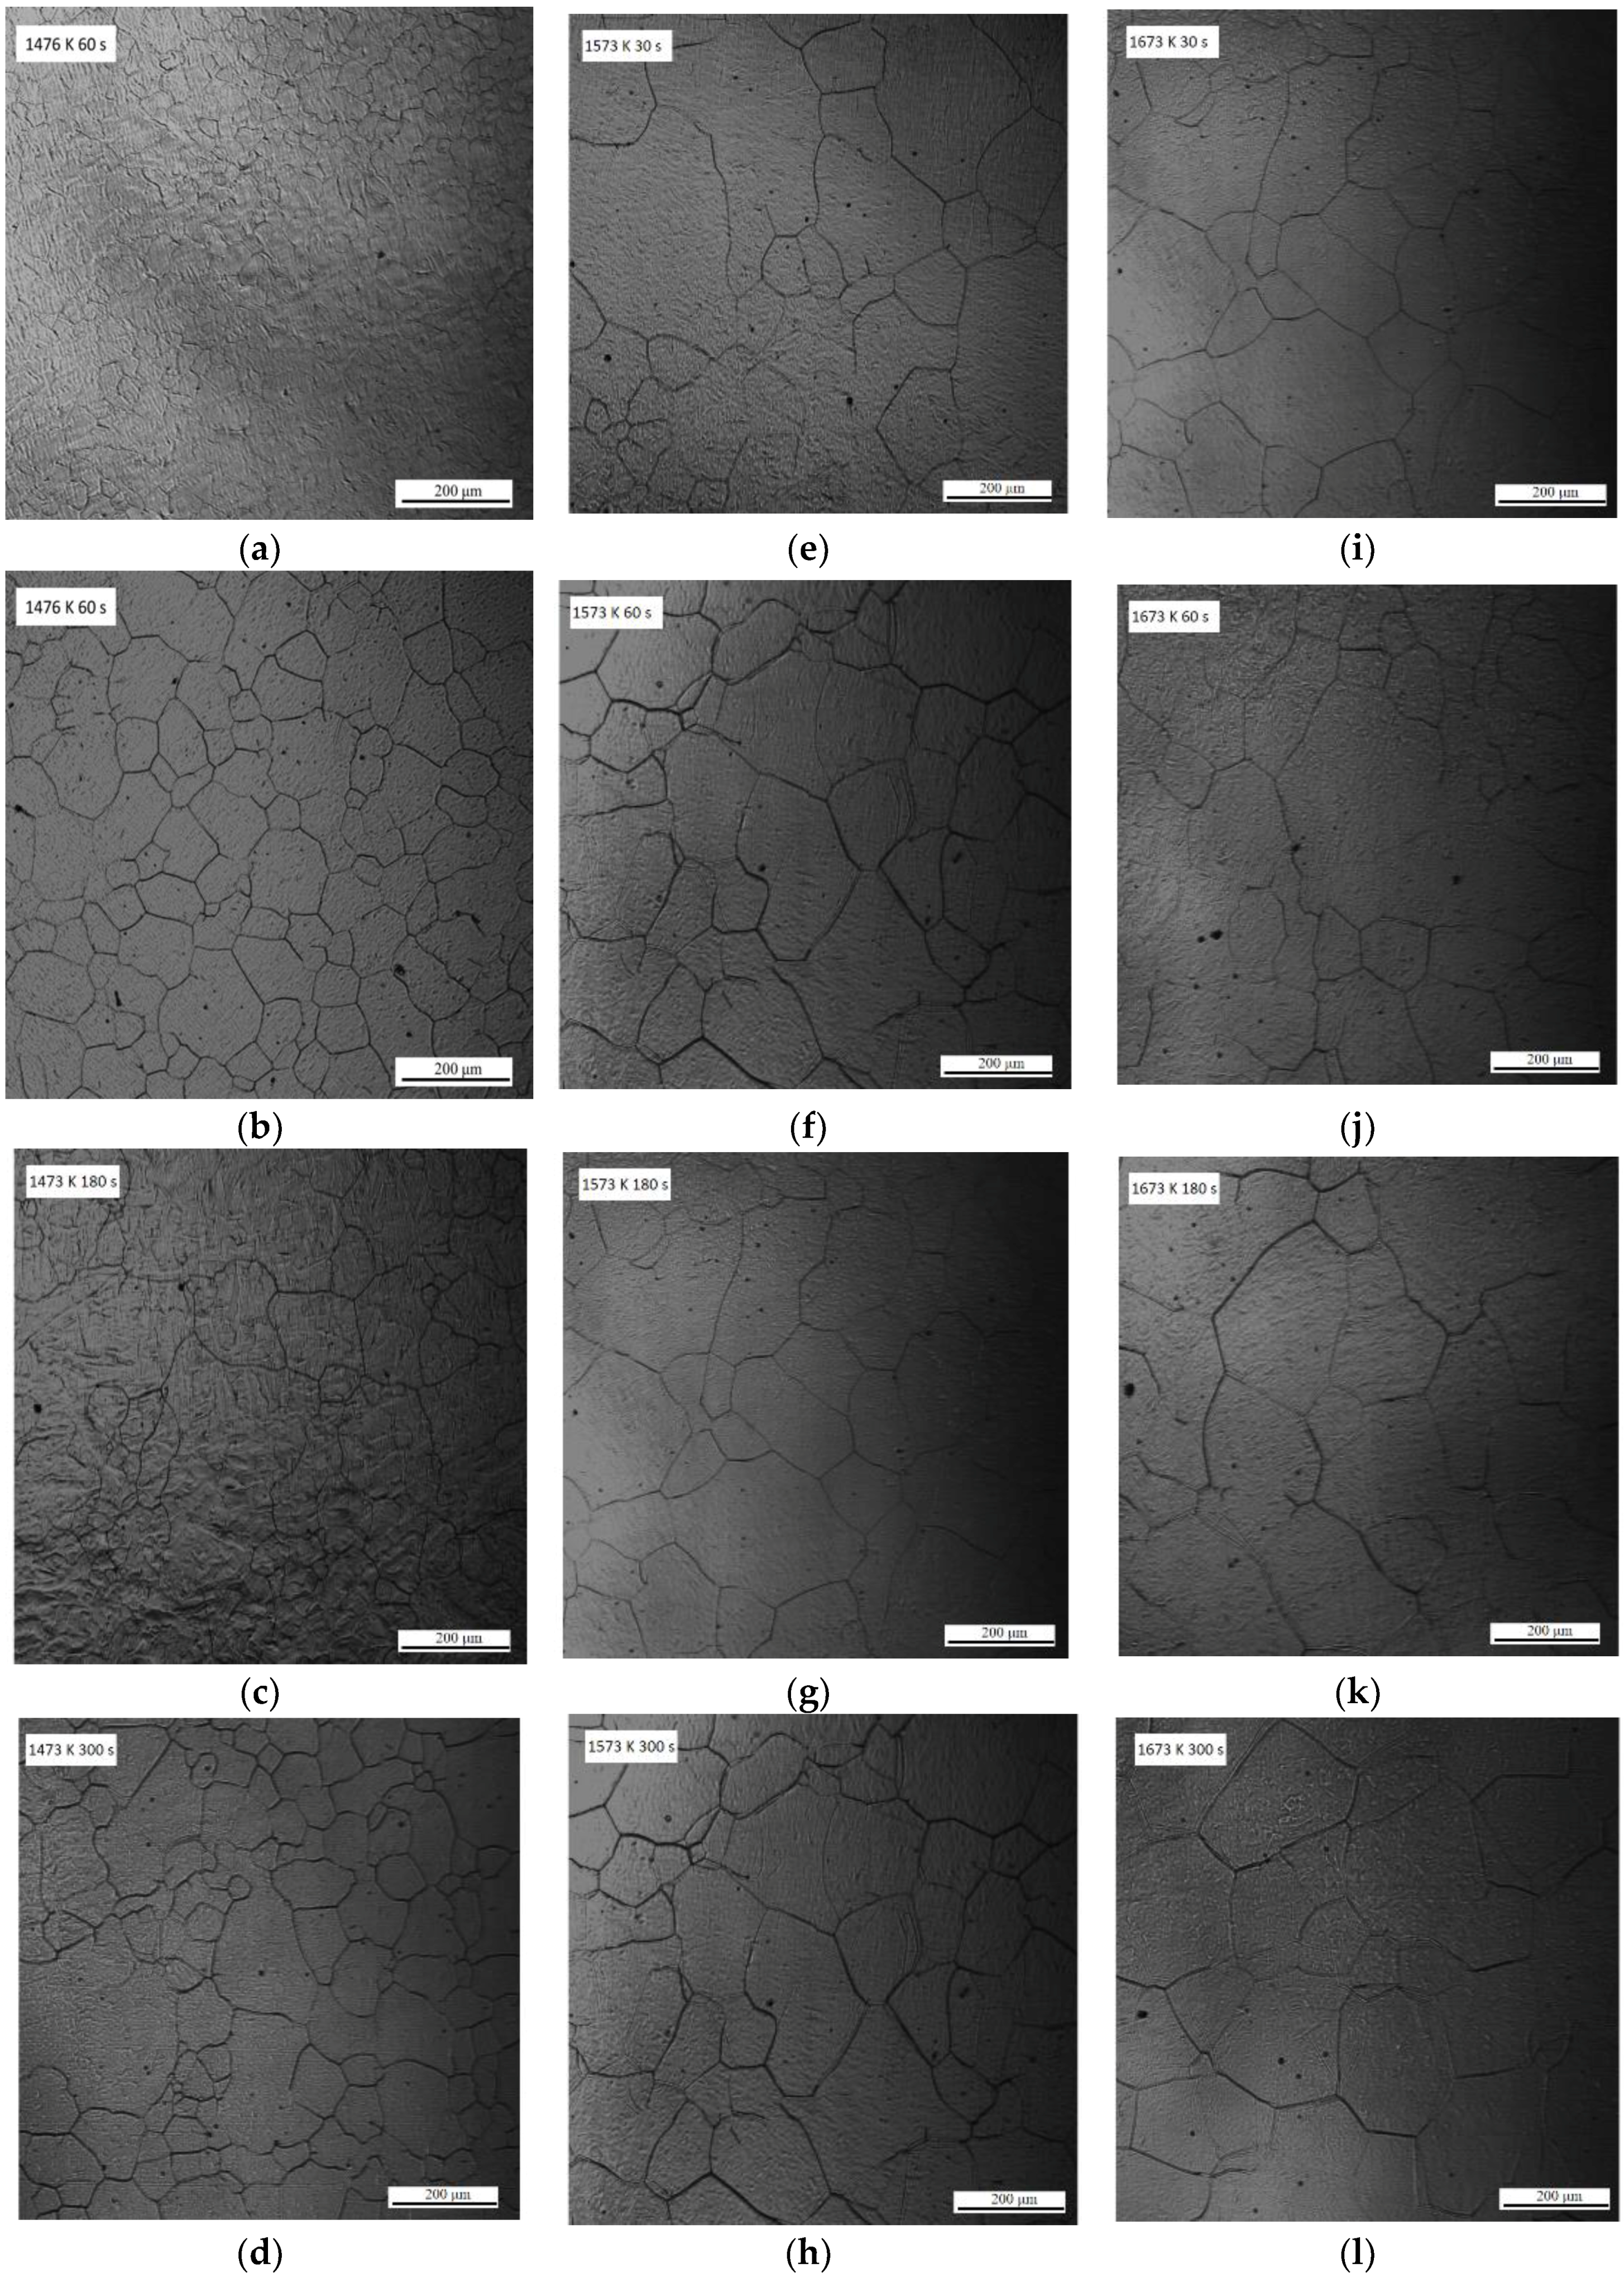
Figure 1 shows the CSLM images of austenite grain microstructures in steel with 13 ppm Mg when heated at 1673, 1573, or 1473 K for 30, 60, 180, or 300 s. The austenite grain boundaries are clearly visible (black lines) in the CSLM images. The austenite grains were analyzed using OM Leica software (Grain Expert), and the average austenite grain sizes were calculated.
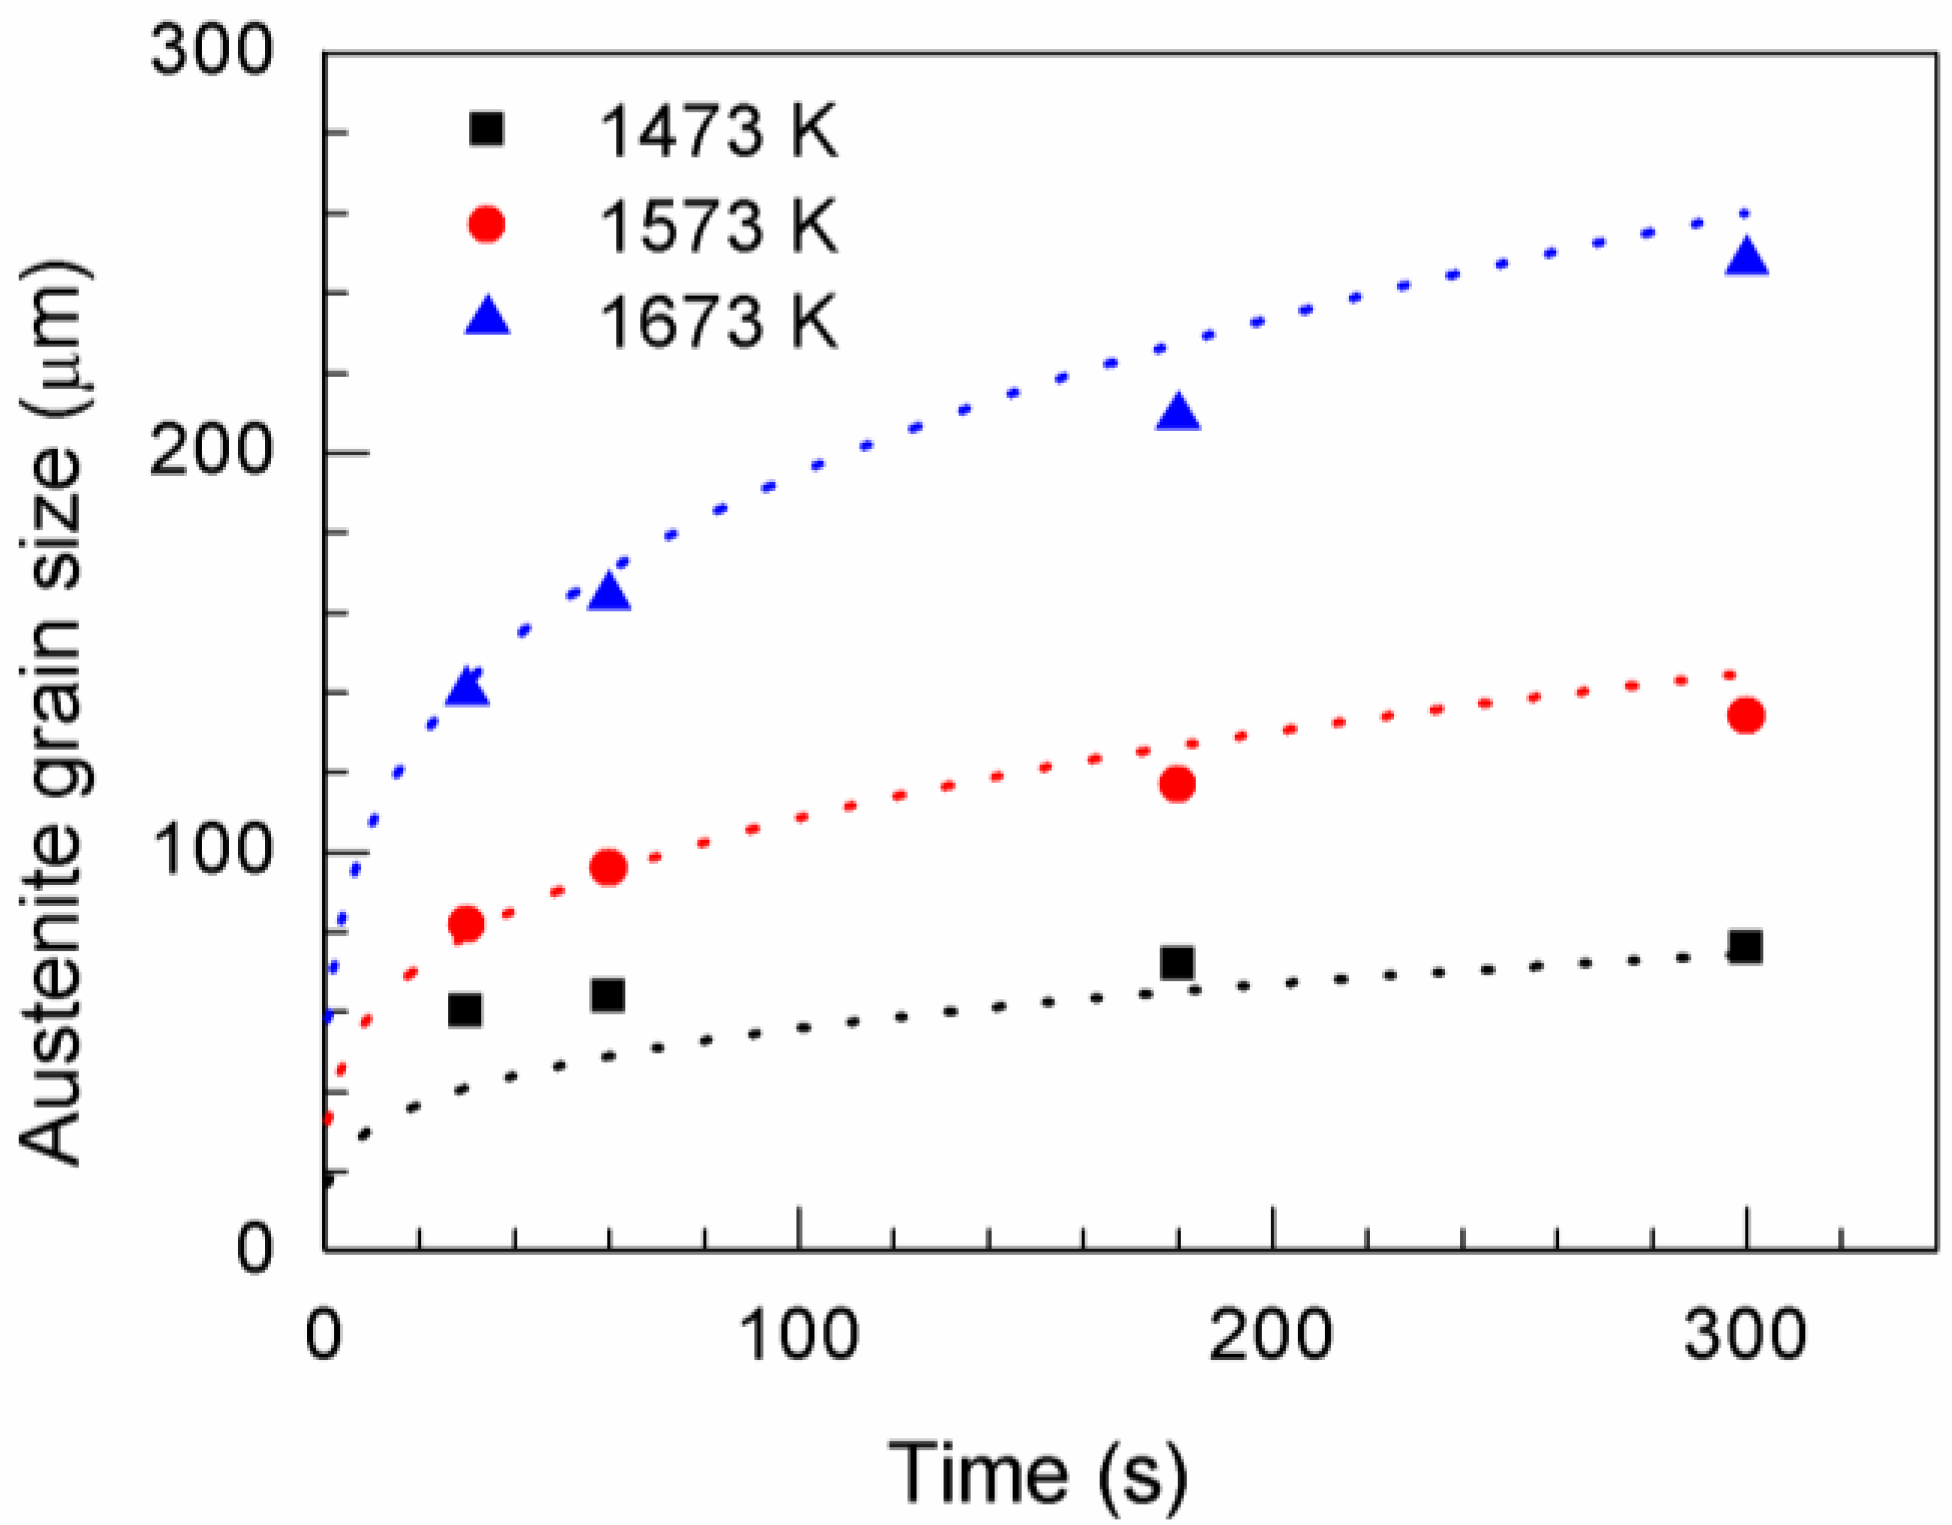
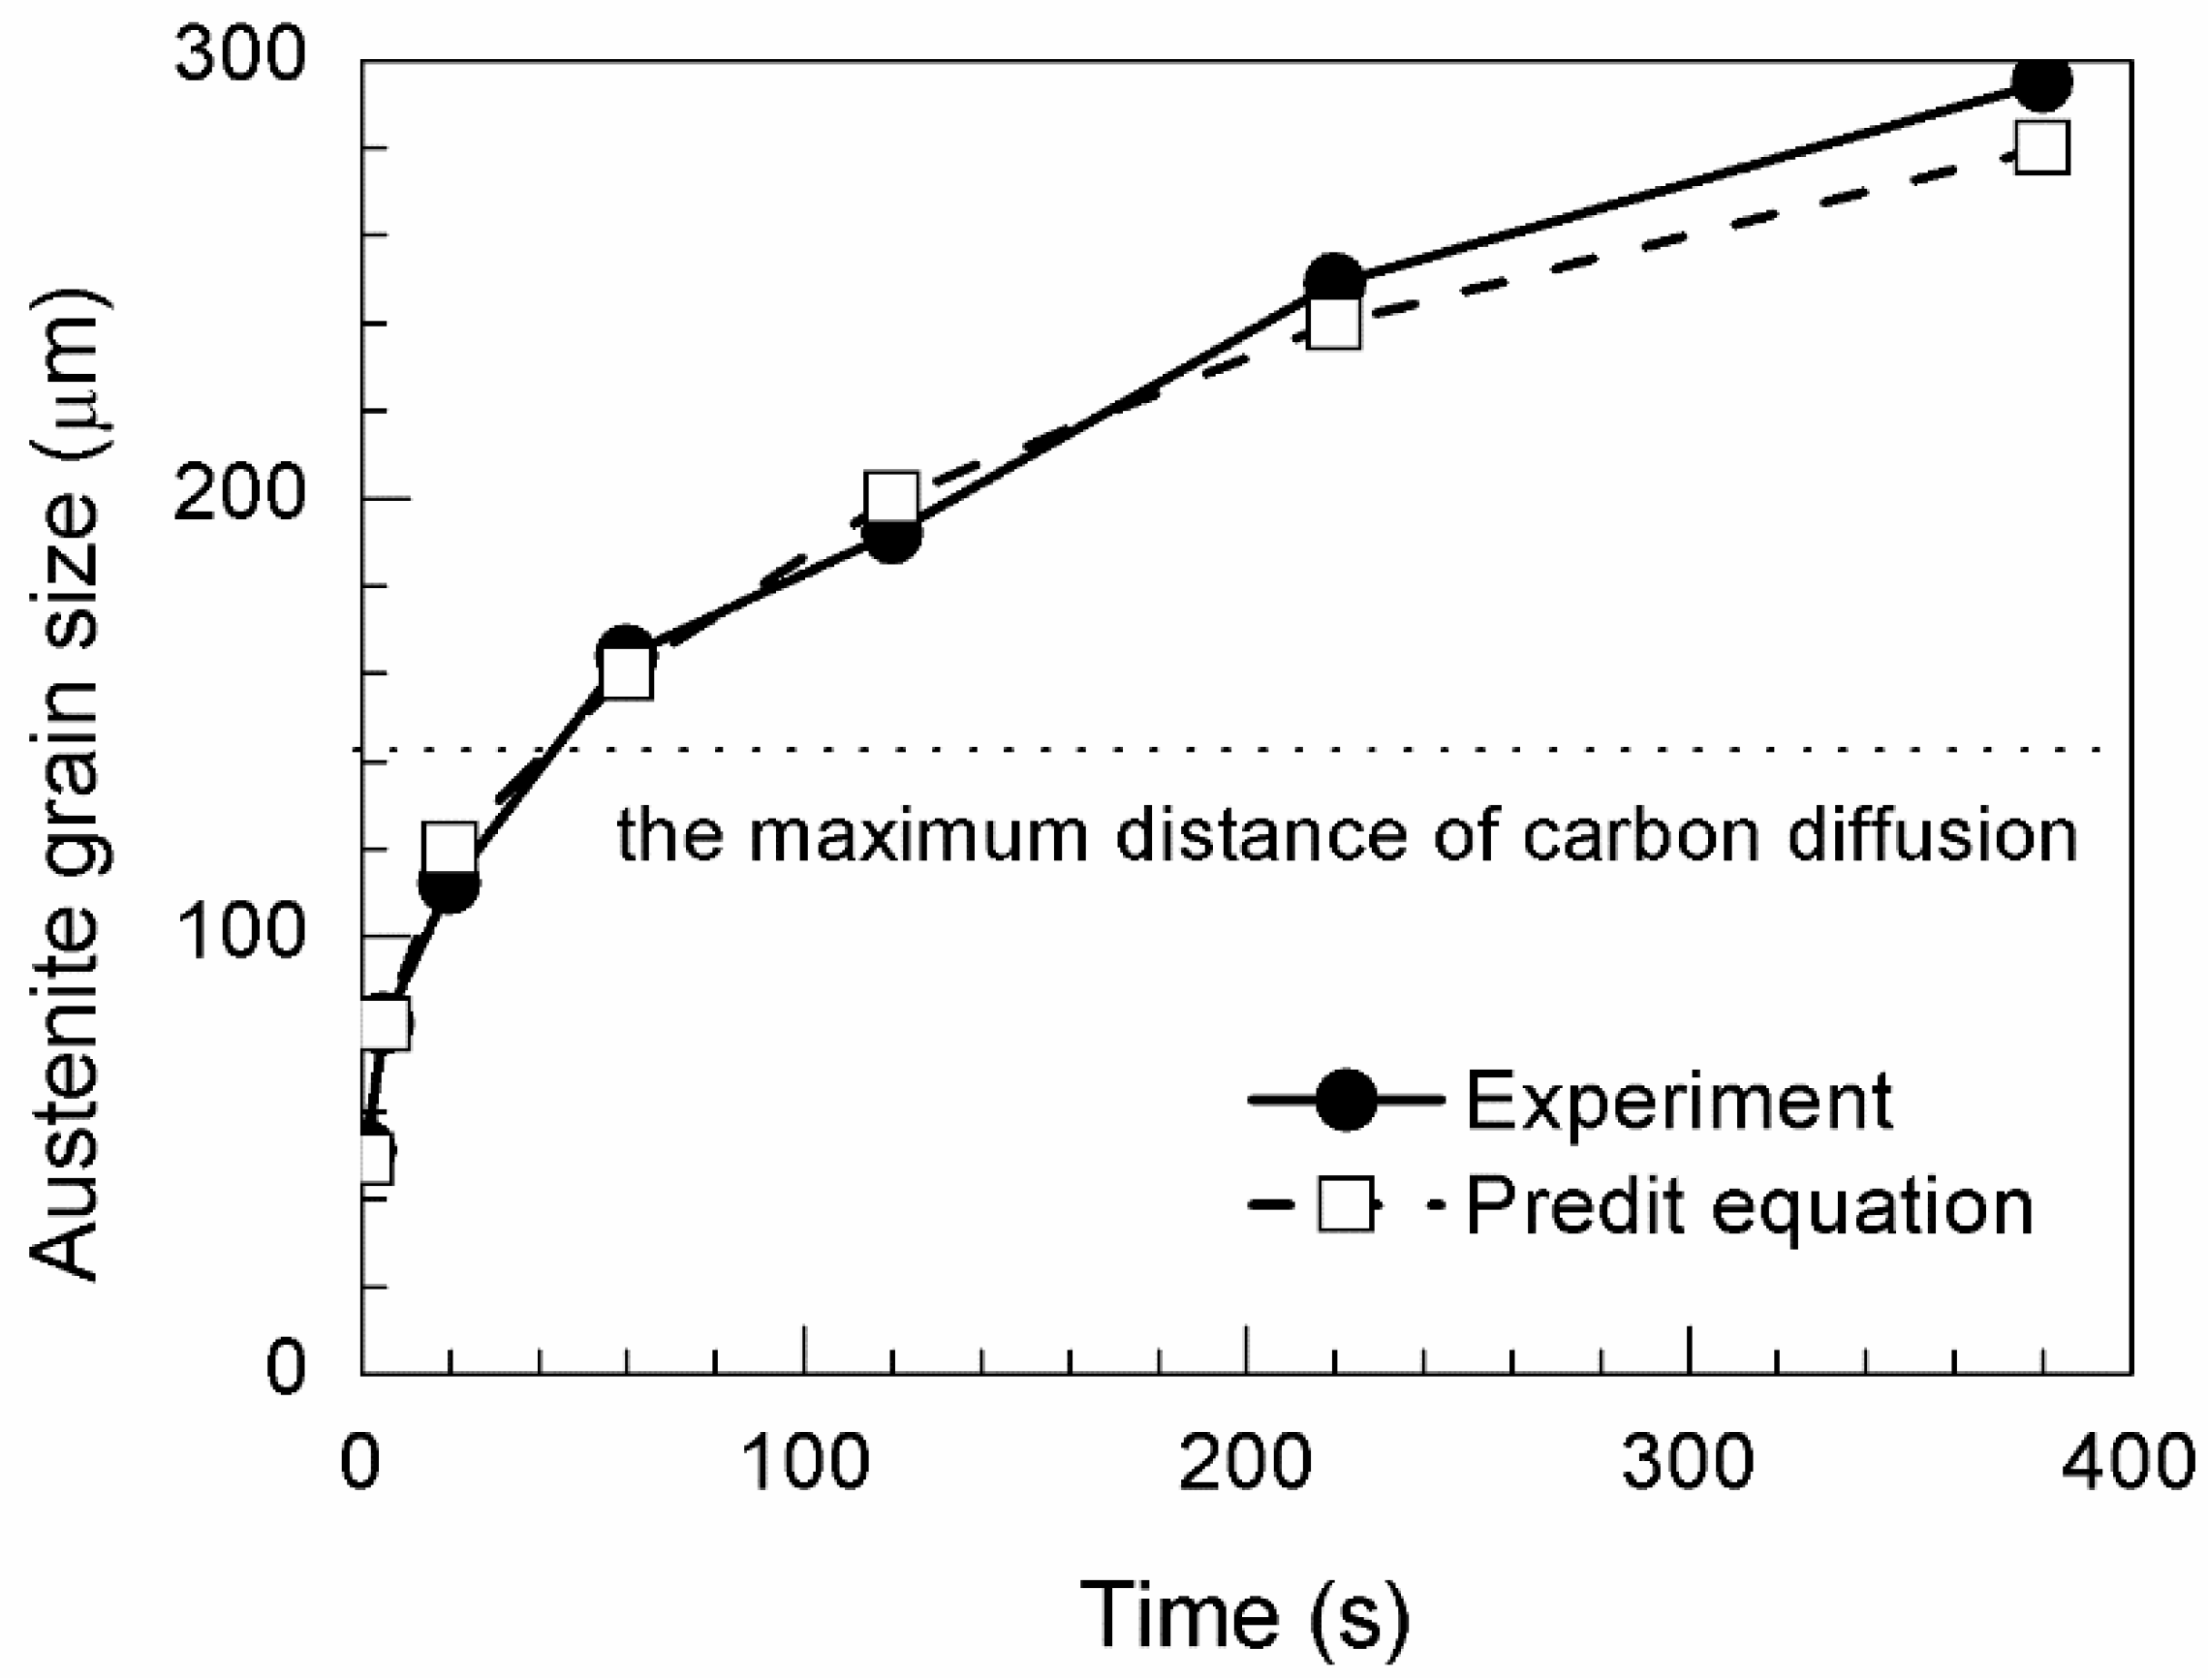
Figure 2 shows the average austenite grain size obtained at different temperatures. The dashed line represents the fitting curves calculated using the grain growth equation
, where
t represents the time,
D is the austenite grain size,
T is the absolute temperature,
k0 is a constant,
R is the universal gas constant, and
Q is the activation energy.
Table 2 shows the parameters of the grain growth equation.
The austenite grain size was predicted from the grain growth equation. Heat treatment should be controlled to obtain the optimal austenite grain size. According to the calculation results, the austenite grain size was 57 µm when annealing was performed at 1673 K for 1 s. Thereafter, the time was calculated using the grain growth equation for 40 µm grain growth increments. Grain sizes of 88, 127, 169, 203, 239, and 276 µm were obtained by holding at 1673 K for 5, 20, 60, 120, 220, and 380 s, respectively.
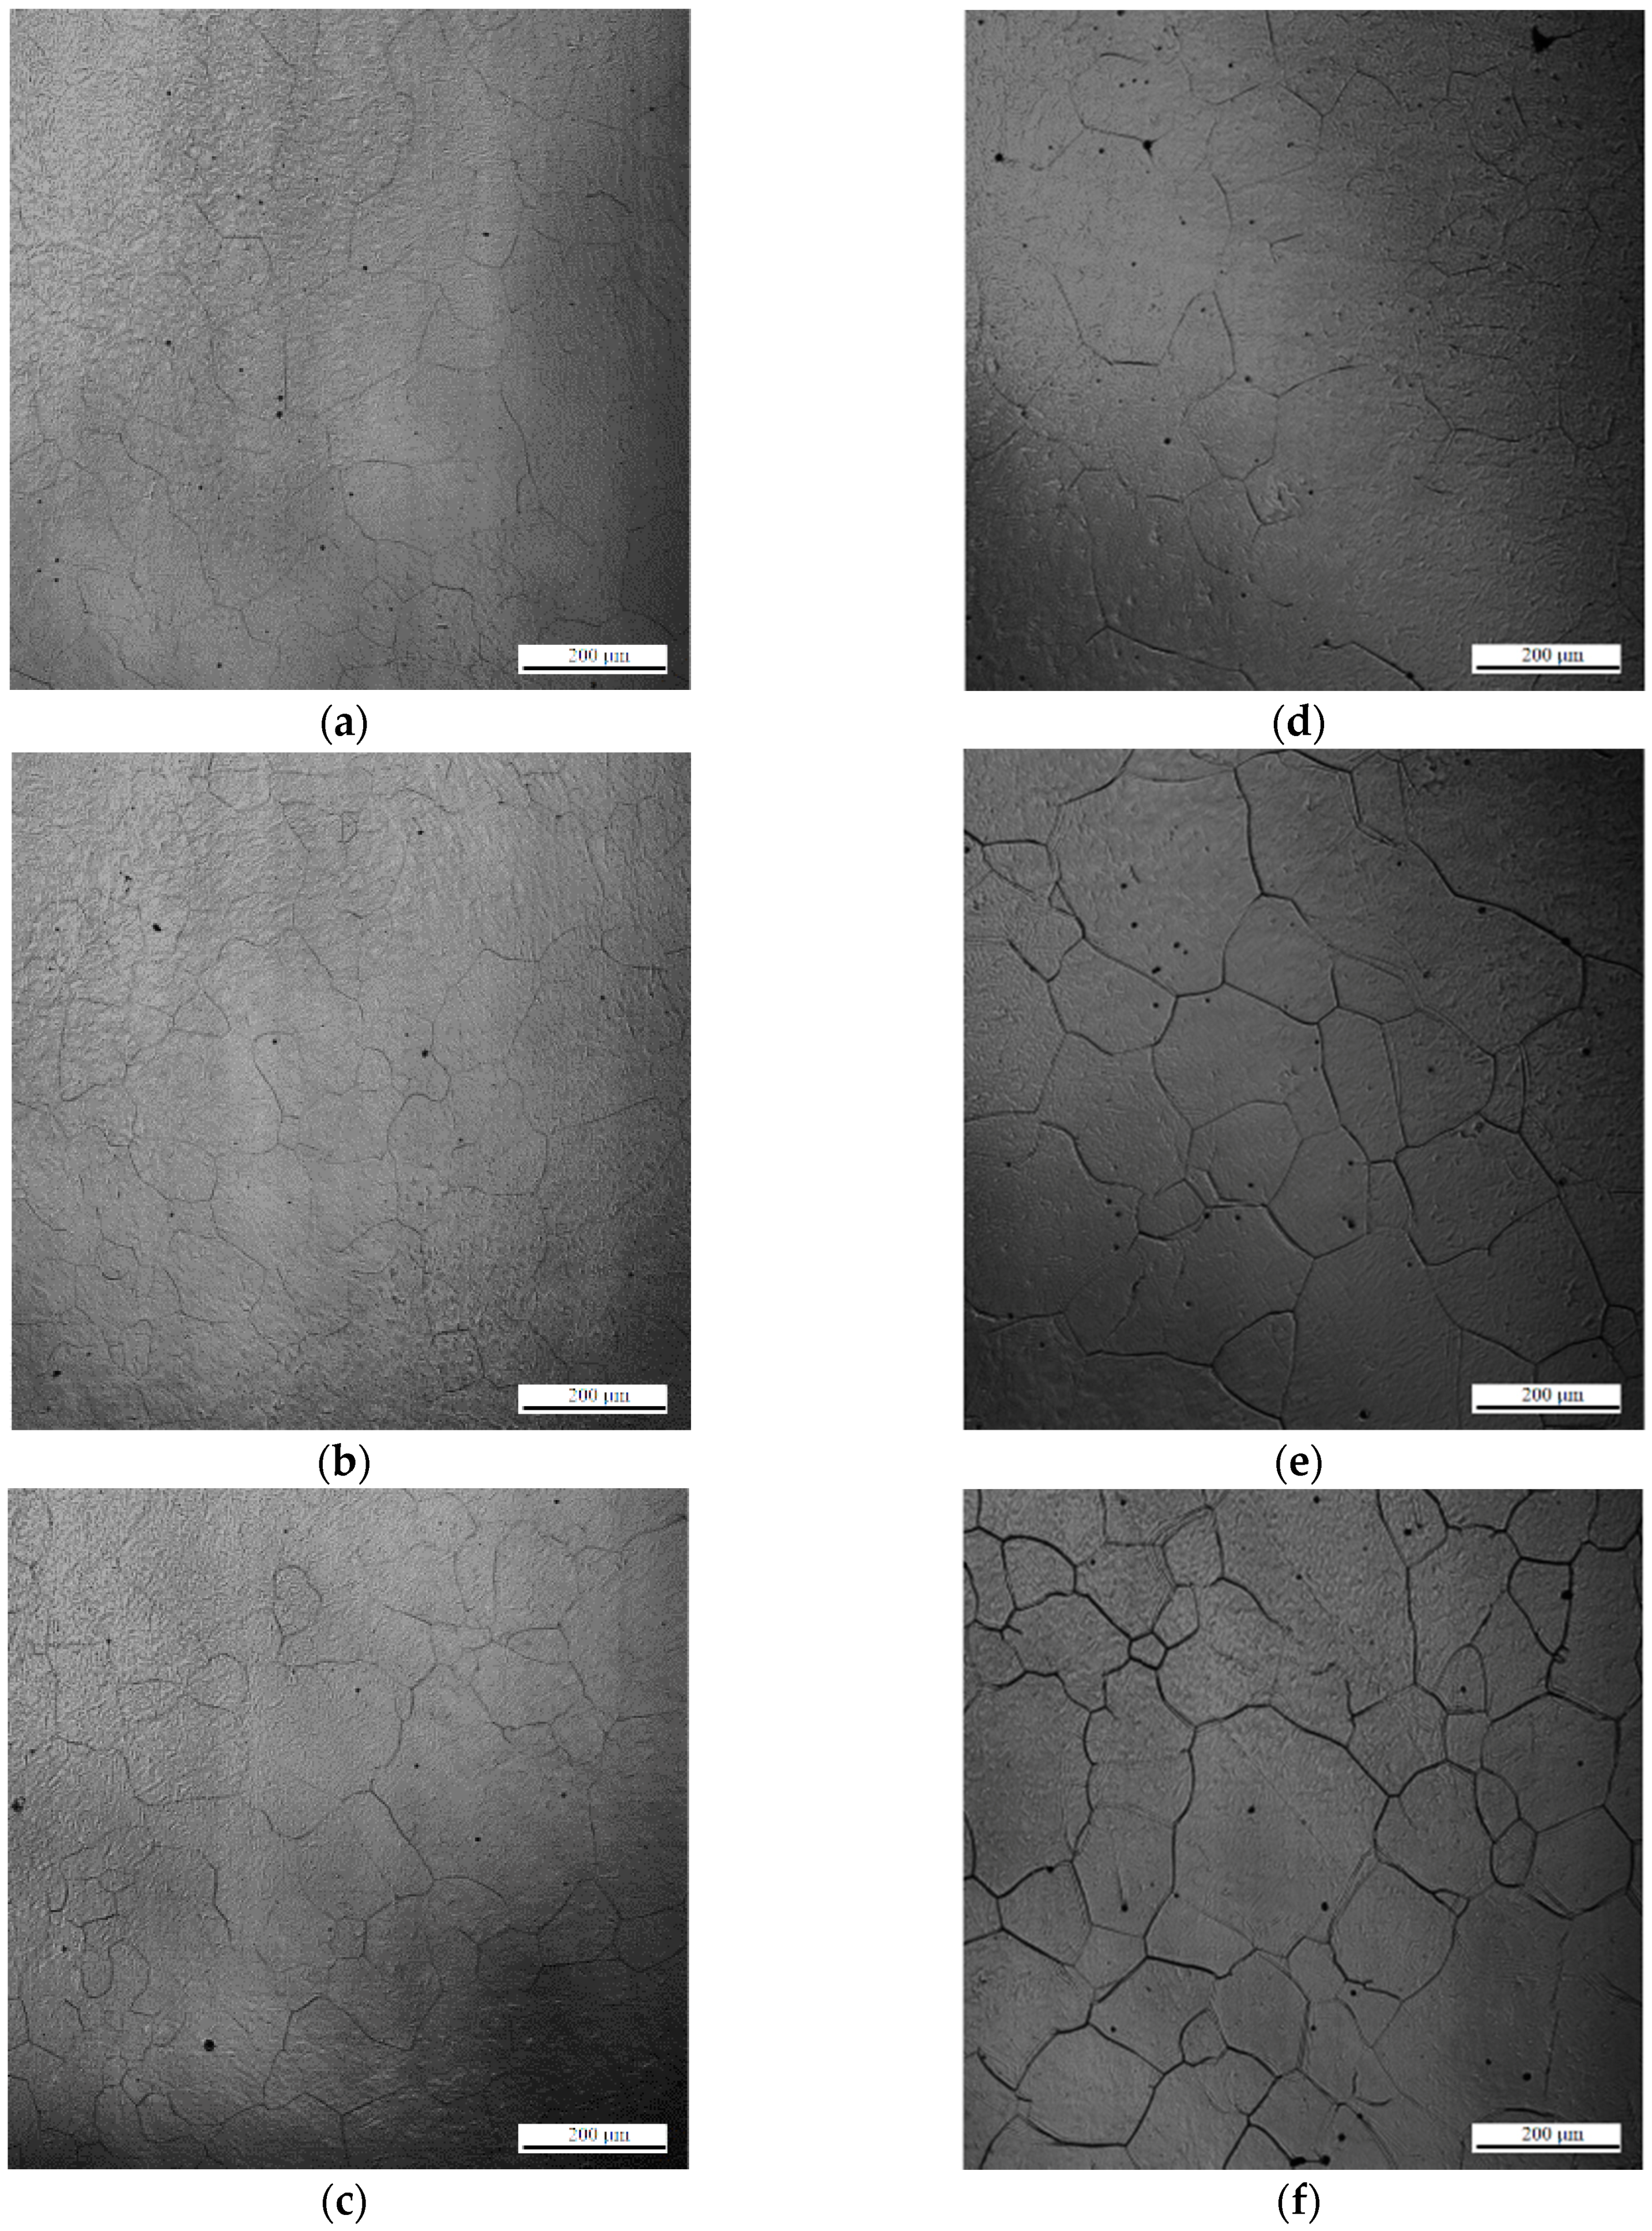
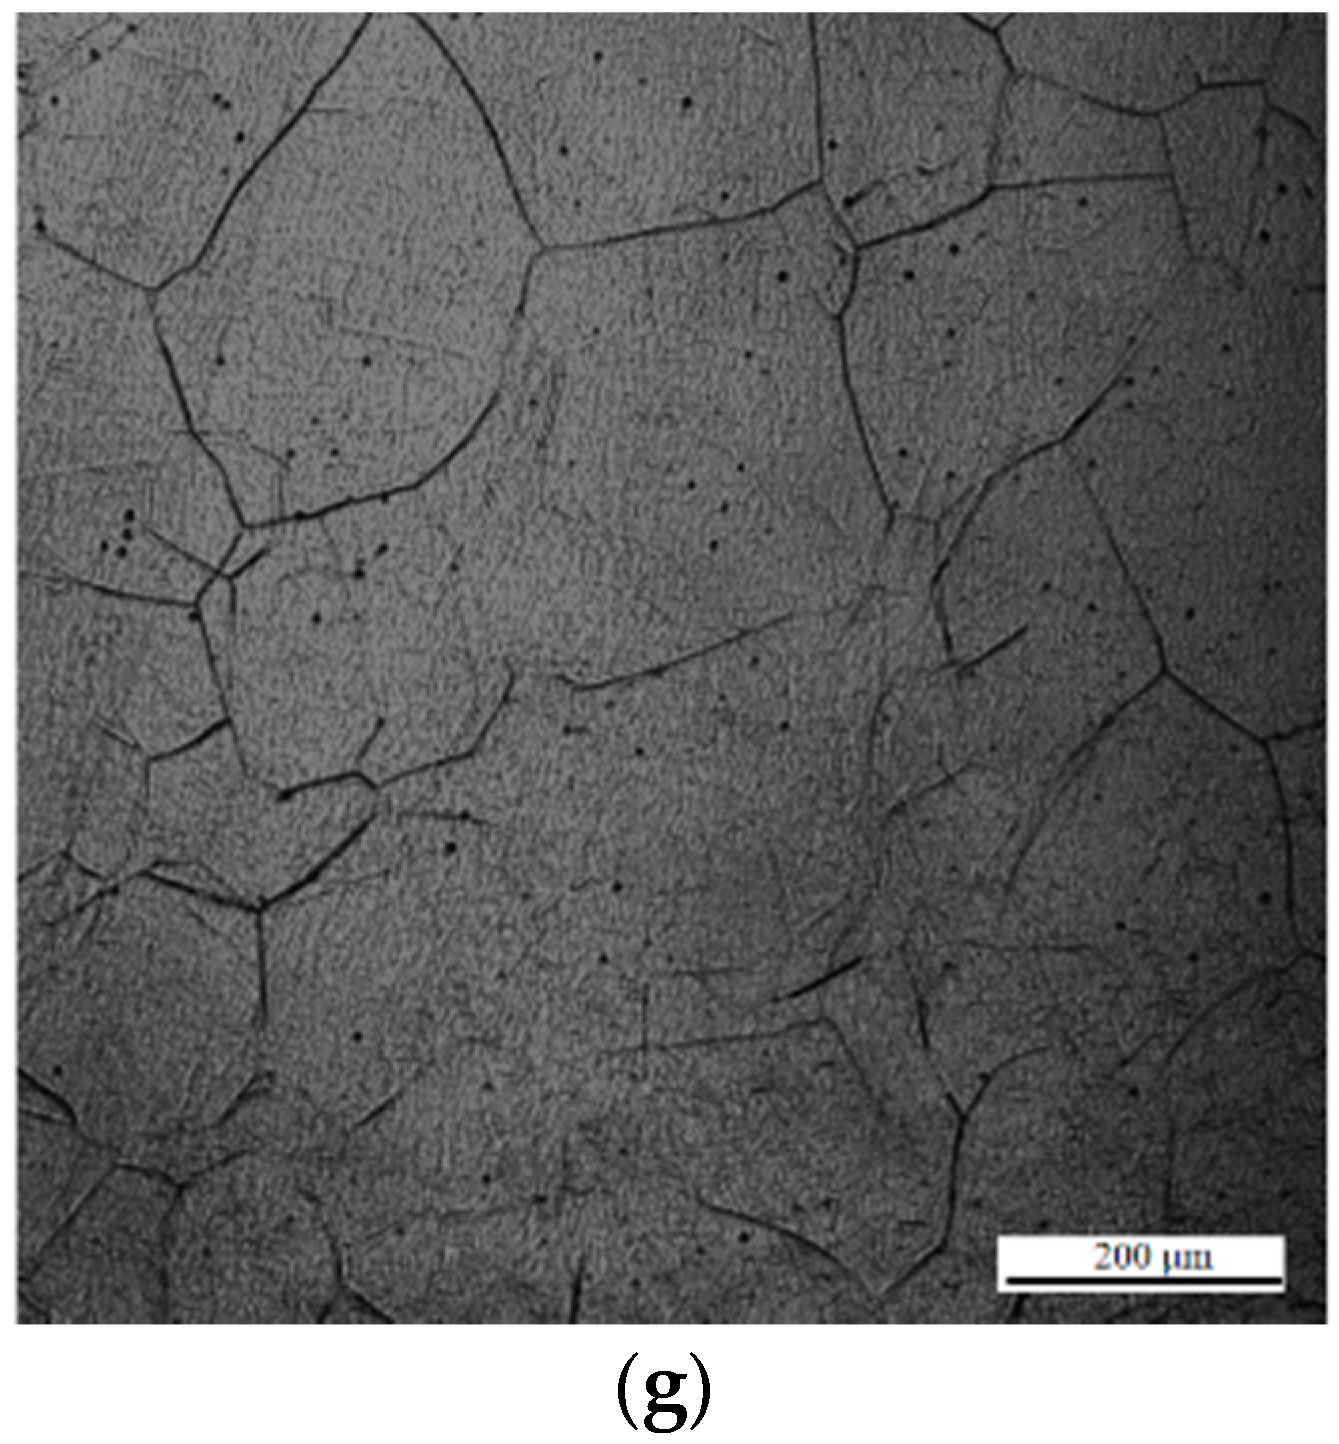
In situ observations of austenite grains annealed at 1673 K for 1, 5, 20, 60, 120, 220, and 380 s are shown in
Figure 3a–g. Austenite grain sizes of 51, 80, 112, 164, 192, 249, and 295 µm were obtained after holding for 1, 5, 20, 60, 120, 220, and 380 s, respectively. The typical OMs of the specimens during heat treatment at 1673 K for 1, 5, 20, 60, 120, 220, and 380 s are shown in
Figure 4a–g. The microstructure of the sample grains consists of Widmanstatten ferrite, AF, bainite, and granular ferrite.
Figure 5 shows the difference between the calculated and predicted values of austenite grain size. The error of austenite grain size is mainly below 15 µm, and the maximum error is only 19 µm, which is obtained from austenitization for 380 s. In general, increasing austenite grain sizes lead to reductions in the overall surface area of grain boundaries and increases in the volume fraction of the AF microstructure [
1]. AF formation refines a coarse microstructure into a fine one and enhances the effect of grain refinement. Large austenite grains result in decreases in AF fraction. As seen in the OMs, additional inclusions induce AF with an appropriate austenite grain size. However, the volume fraction of AF is difficult to quantify precisely. The AF volume fractions of each sample under different austenitization conditions are difficult to distinguish and quantify from the micrographs. Thus, the probability of AF nucleation is used to quantify the ability of inclusions to induce AF at different austenitization holding times. The probability of pinning inclusions is defined by the following equation:
where
Ntotal and
NAF are the total numbers of inclusions and inclusions with AF nucleation, respectively. After heat treatment, we used OM micrographs to find the microstructure of acicular ferrite around every inclusion, and separate the conclusions into two parts, one is inclusions without acicular ferrite formation, and the other is the inclusions with acicular ferrite formation. We used approximately 90–100 inclusions for statistical measurement of each sample for different austenitization holding times. The probabilities of AF nucleation from inclusions were 8%, 11%, 19%, 29%, 21%, 15%, and 5% for austenitization holding times of 1, 5, 20, 60, 120, 220, and 380 s, respectively.
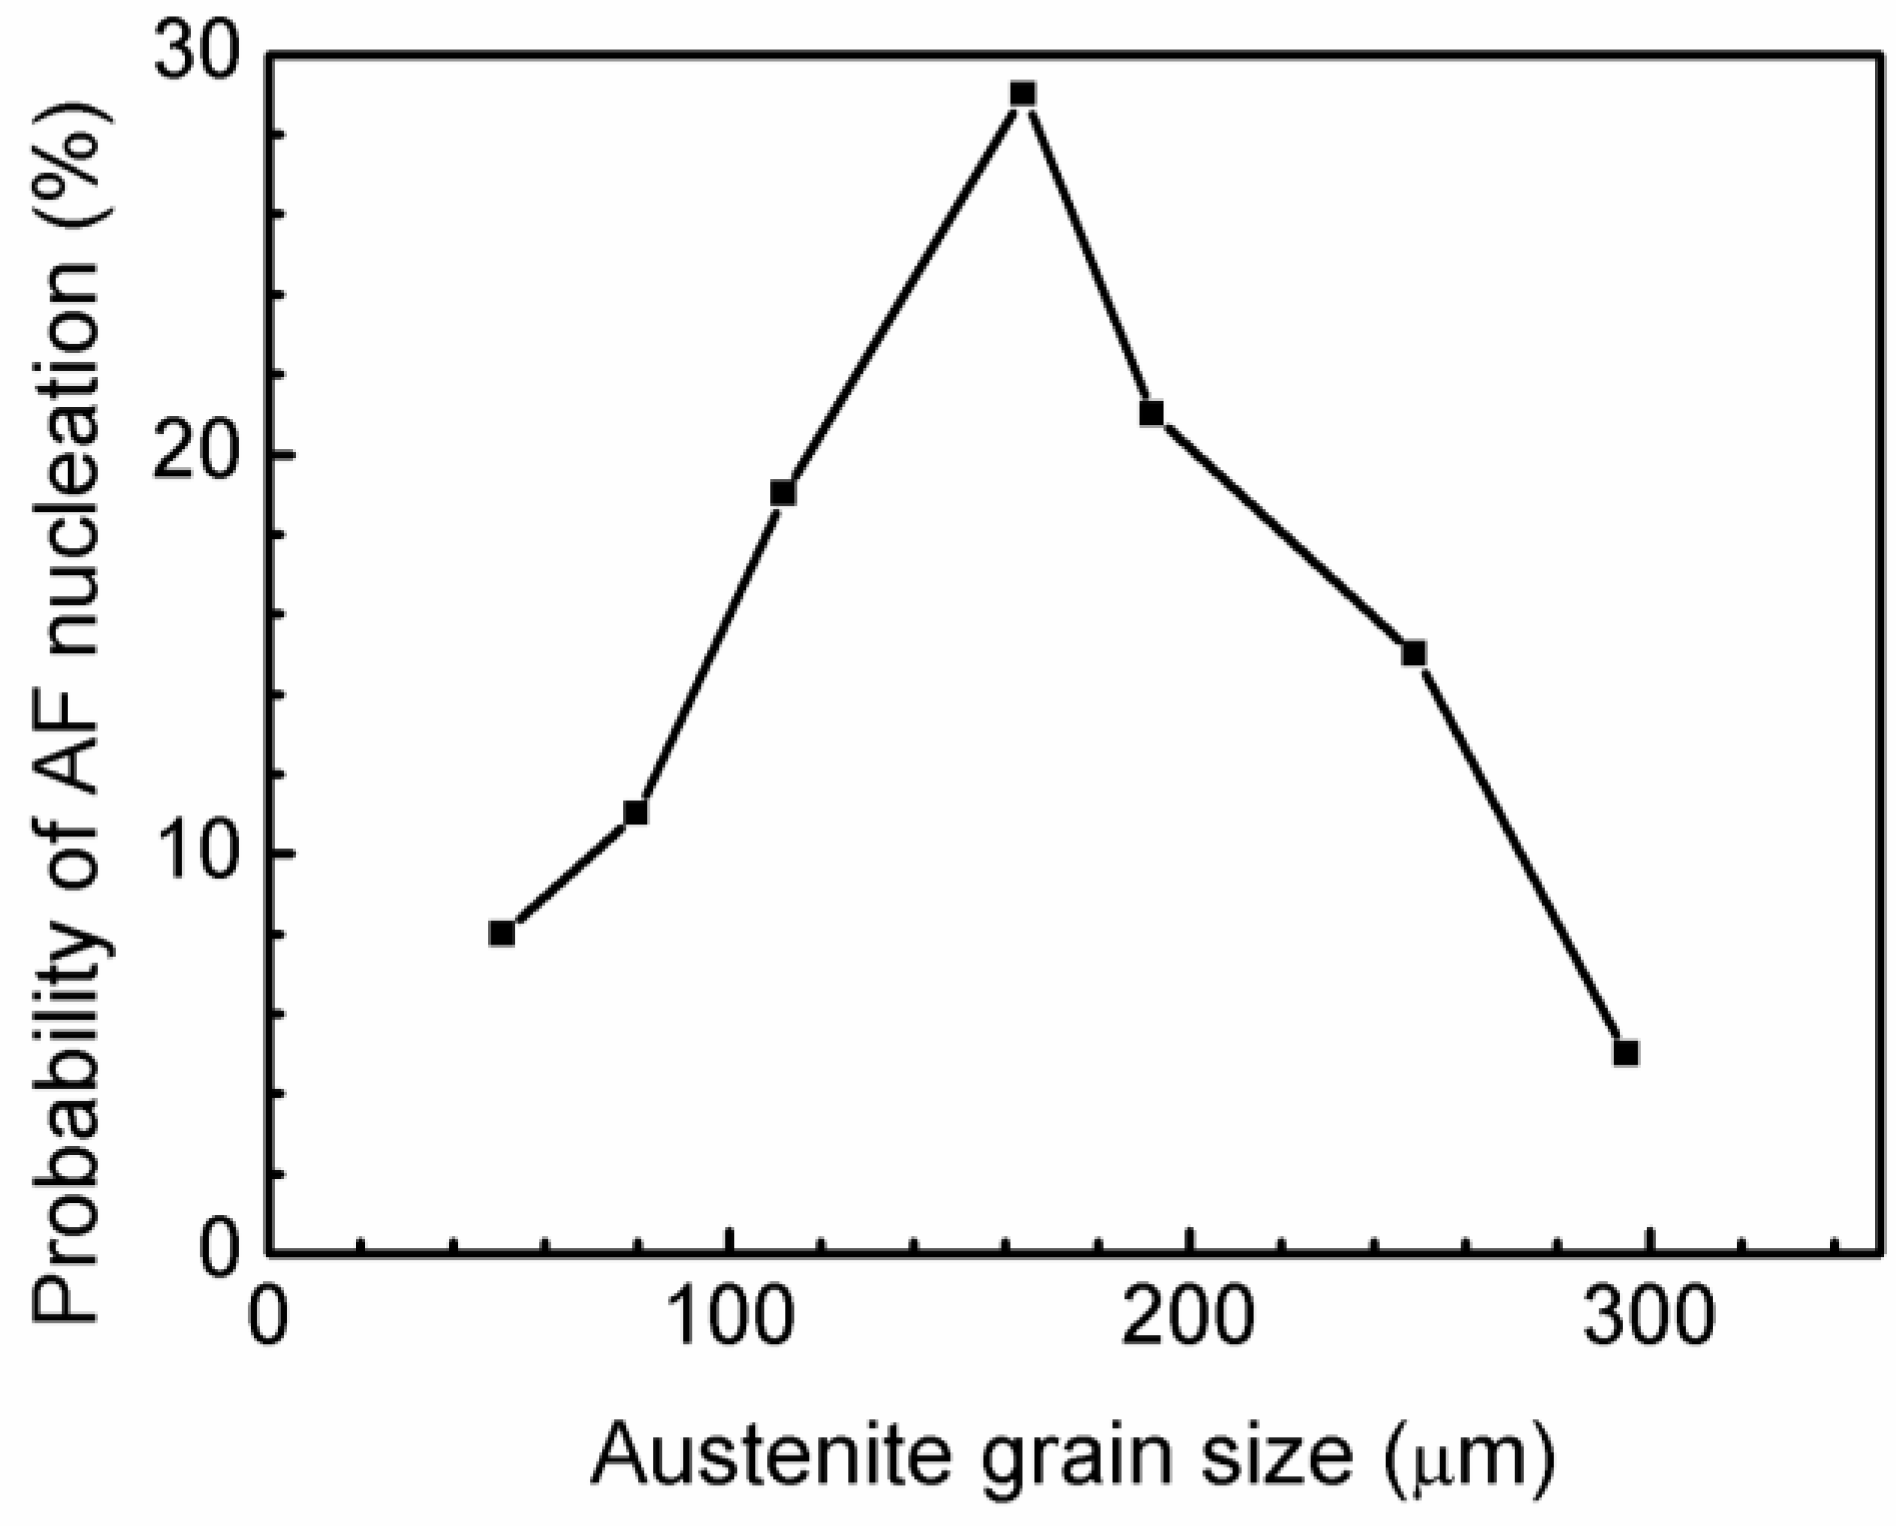
Figure 6 shows the calculation results as a function of austenite grain size. The probabilities of AF nucleation for austenite grain sizes of 51, 80, 112, 164, 192, 249, and 295 µm were 8%, 11%, 19%, 29%, 21%, 15%, and 5%, respectively. This finding shows that the austenite grain size of 164 µm has the highest ability to induce AF nucleation, which means that the appropriate austenite grain size promotes AF formation. The austenite grain size changes the microstructure of steel [
21]. Samples with small austenite grain sizes mainly consist of Widmanstatten ferrite, and small fractions of AF (
Figure 4a–c). With increasing austenitizing holding time, the austenite grain size increases, and the main composition of the grains becomes Widmanstatten ferrite, and small fractions of AF.
3.2. Relationship between Diffusion Distance of Carbon and Austenite Grain Size
Previous research has verified that carbon concentration affects the nucleation potency of ferrite [
1,
22]. In general, low-carbon concentration areas allow the formation of considerably more ferrite than that formed in high-carbon concentration areas. The distribution of carbon over intragranular austenite grains may result in a low probability of ferrite formation inside the grain and easy formation of ferrite at the grain boundaries. By contrast, if carbon is distributed on the austenite grain boundary, ferrite easily forms inside the grain instead of at the grain boundaries. Widmanstatten ferrite formation affects the carbon distribution within the intragranular austenite, causing the carbon concentration to be non-uniform within intragranular austenite grains, which form before AF formation. However, carbon distribution cannot be determined by any analytical instrument. In the present study, we provide a theoretical calculation to explain the relationship between carbon distribution and probability of AF nucleation. The diffusion equation C is given as follows [
23]:
where
D is the diffusion coefficient,
t is the time,
x is the diffusion distance, and
M is a known quantity.
D is influenced by temperature. The diffusion coefficient equation is expressed as follows [
23]:
where
D0 is the maximal diffusion coefficient,
Q is the activation energy,
T is the absolute temperature, and
R is the universal gas constant. Considering that Widmanstatten ferrite affects the carbon distribution in intragranular austenite grains is difficult. Thus, we simply consider the carbon distribution in intragranular austenite grains and calculate the value that can attain the maximum diffusion distance. When the austenite transforms to ferrite, the driving force causes carbon diffusion from the inner region of the austenite grains to the austenite grain boundary. In our hypothesis, the carbon concentration of intragranular austenite grains is 0 wt.%, at which point carbon diffuses to the austenite grain boundary. Therefore, the value of
M is 0.13 wt.%.
Figure 5 also shows the relationship between the maximum carbon diffusion distance and annealing time. The calculated result shows that, despite increases in time, the maximum distance of carbon diffusion remains the same. Lin et al. [
24] observed the AF formation time at high temperatures. The time from the start of AF formation to completion was 10 s. This finding means the carbon diffusion time is limited by the AF formation time. Based on Equation (2), the calculated maximum distance of carbon diffusion is 71 µm. Over this distance, a carbon-free zone with a diameter of 142 µm will be formed.
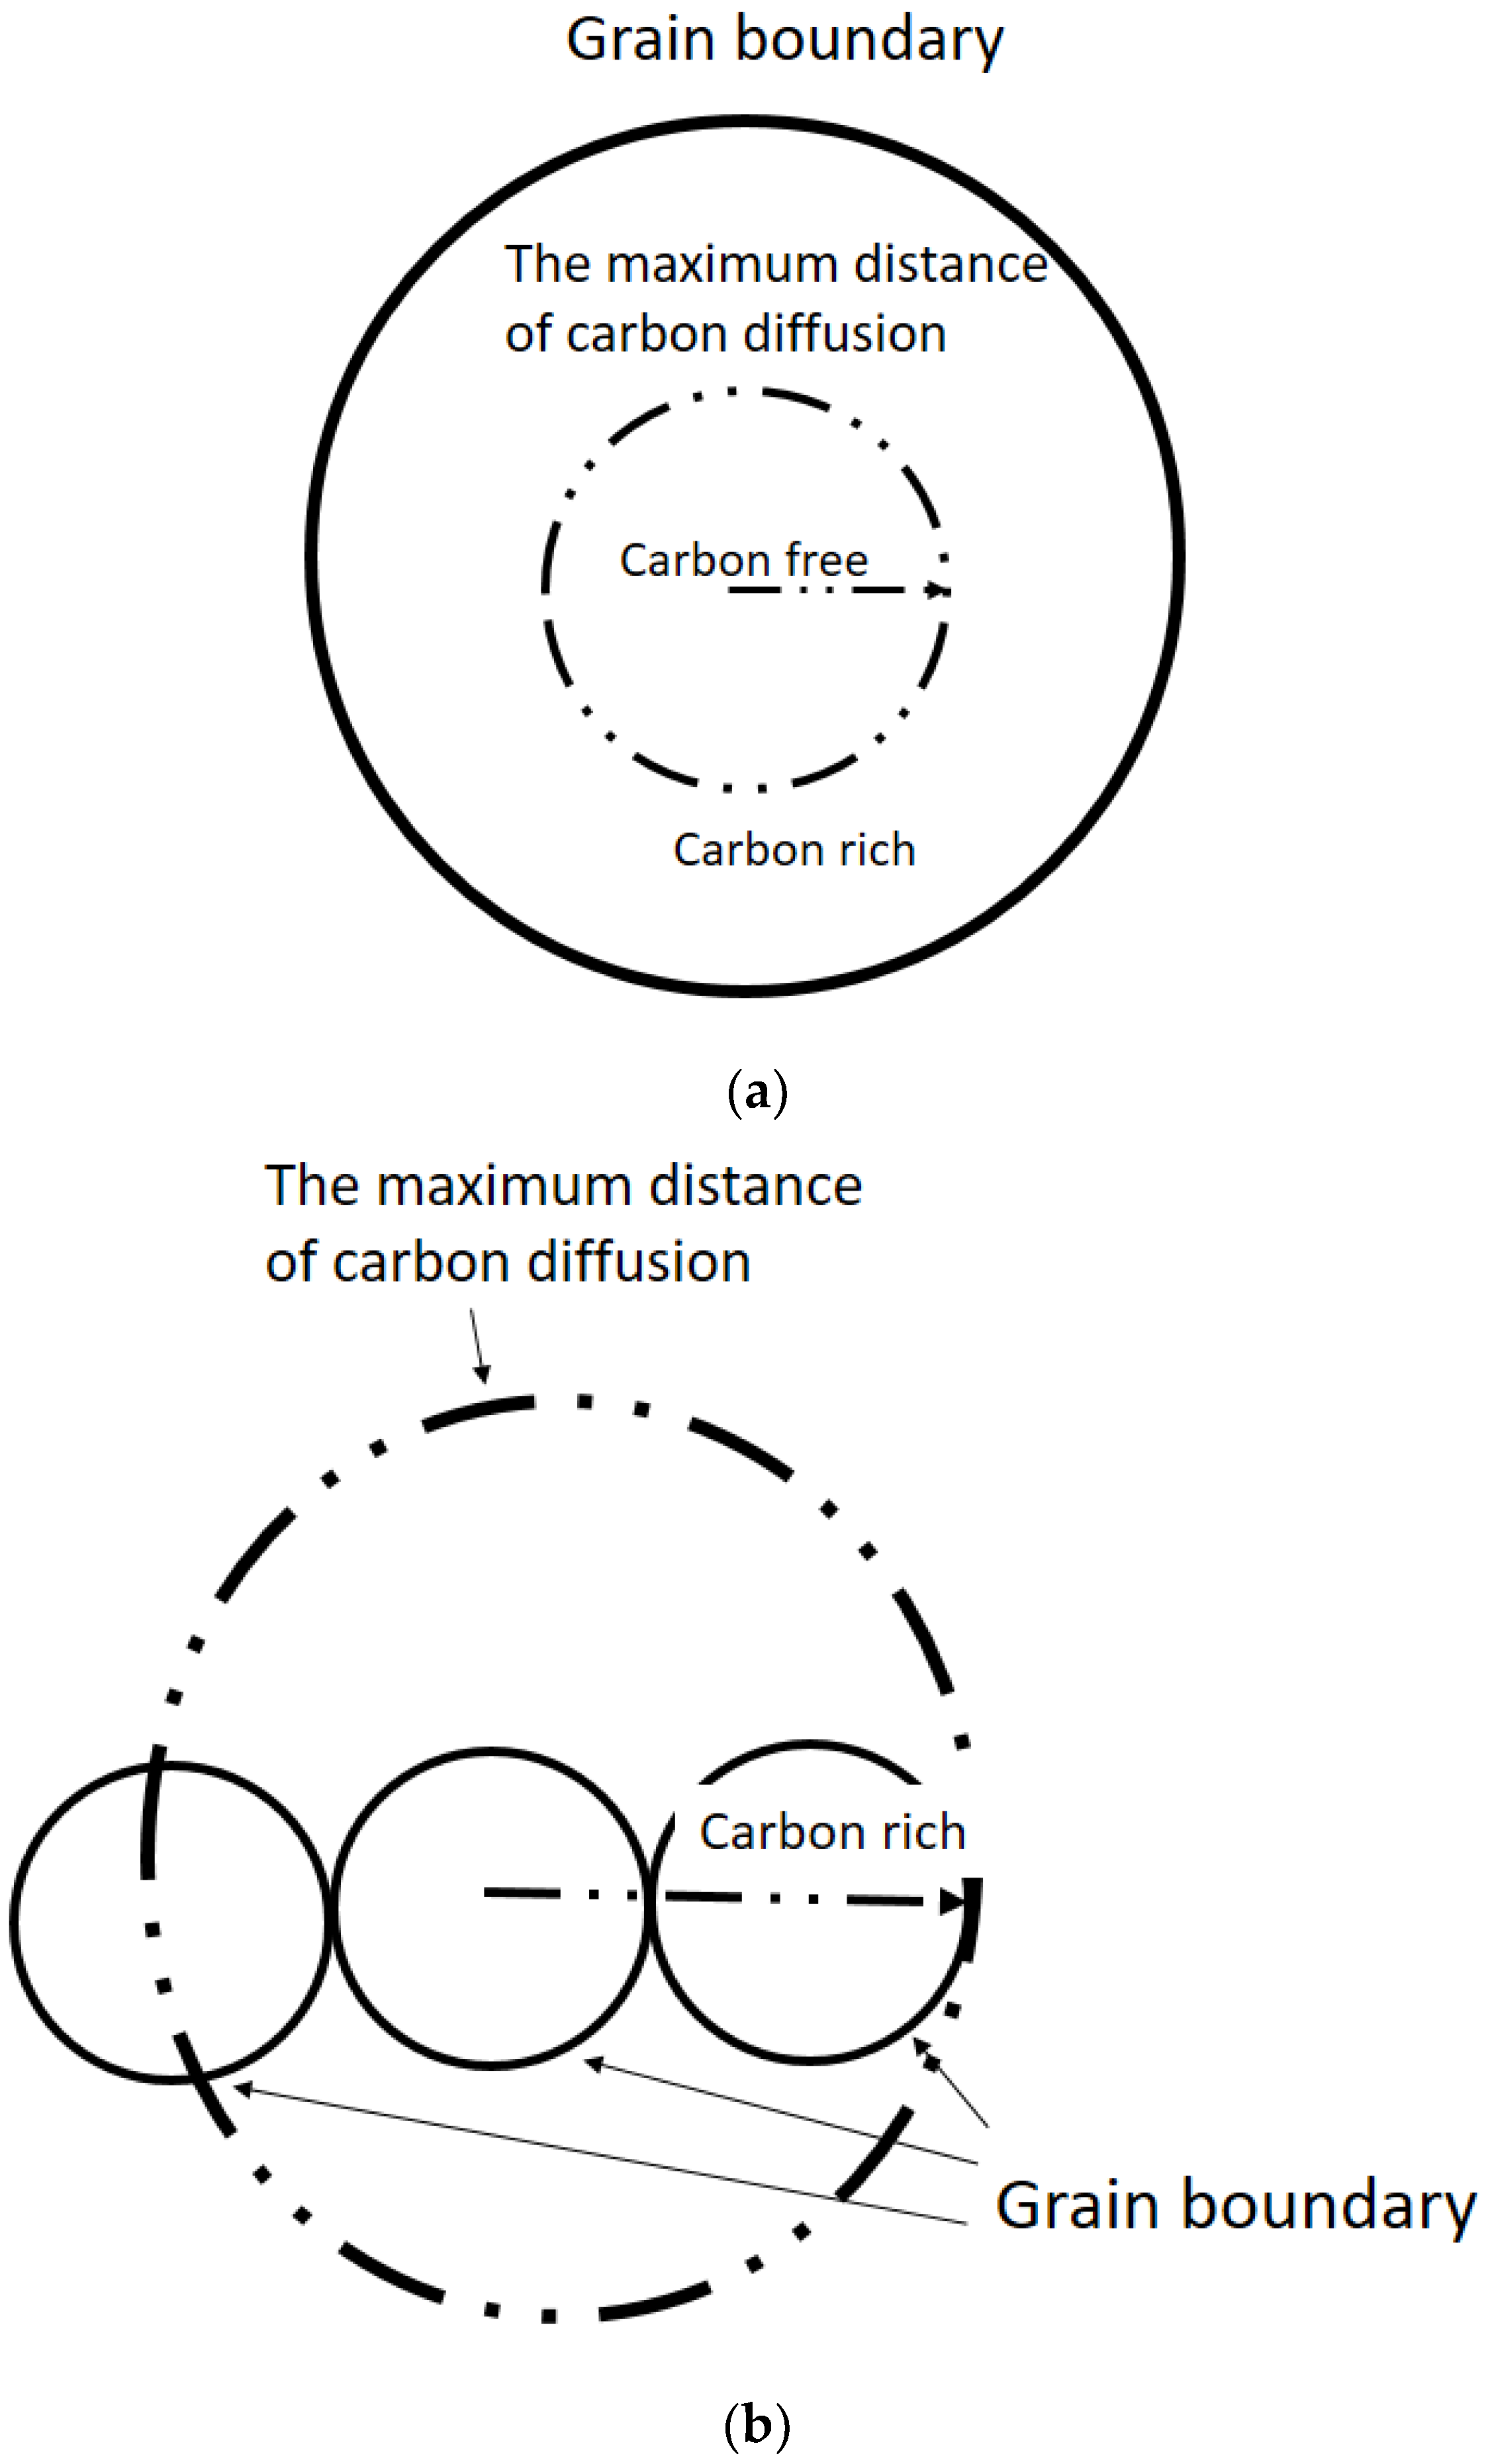
The grain is separated into carbon-rich and carbon-free areas via the boundary line of maximum distance of carbon (
Figure 7a). Ferrite formation is easily induced in the carbon-free area.
Figure 7b shows that when the grain size is smaller than the maximum distance of carbon diffusion, carbon diffuses to other grains. Thus, adjacent grains retain their carbon-rich condition. As such, AF formation is difficult to induce in extremely small austenite grains. If the austenite grain size is similar to the maximum carbon diffusion distance, intragranular austenite grains become carbon-free and can easily induce AF formation.
When the austenite grain size is larger than the maximum distance of carbon diffusion, the carbon concentration of intragranular austenite grains is higher than that at the austenite grain boundary. Ferrite consequently exhibits increased nucleation potency at the grain boundary rather than inside austenite grains. Thus, an excessively large austenite grain results in a low probability of AF nucleation because of the carbon-rich area distribution in grains. According to the discussion above, AF nucleation can be promoted by the appropriate austenite grain size. An excessively small or large austenite grain size may not be the optimal grain size for AF nucleation. The calculation results of carbon diffusion distance and its effect on AF formation are shown in
Figure 6.
If the distance from the center of the grain to grain boundary is similar to the maximum carbon diffusion distance, AF is easily induced owing to the carbon-free grains. The calculated maximum distance of carbon diffusion is 71 µm, and the corresponding austenite grain size, considering a spherical austenite grain, is 142 µm. In
Figure 6, the probability of AF nucleation increases with increasing austenite grain size, but an excessively large austenite grain reduces the probability of AF formation. The optimized austenite grain size with the highest probability of AF nucleation is 164 µm, which is relatively similar to the calculation results of grain size with the corresponding maximum carbon diffusion distance.
3.3. Inclusion Behavior
Zener et al. reported that grain growth can be retarded by inclusions [
25]. Our previous discussion revealed that AF formation is affected by the grain size of austenite. Thus, understanding the anisotropic pinning effect of inclusions on austenite grain growth is important.
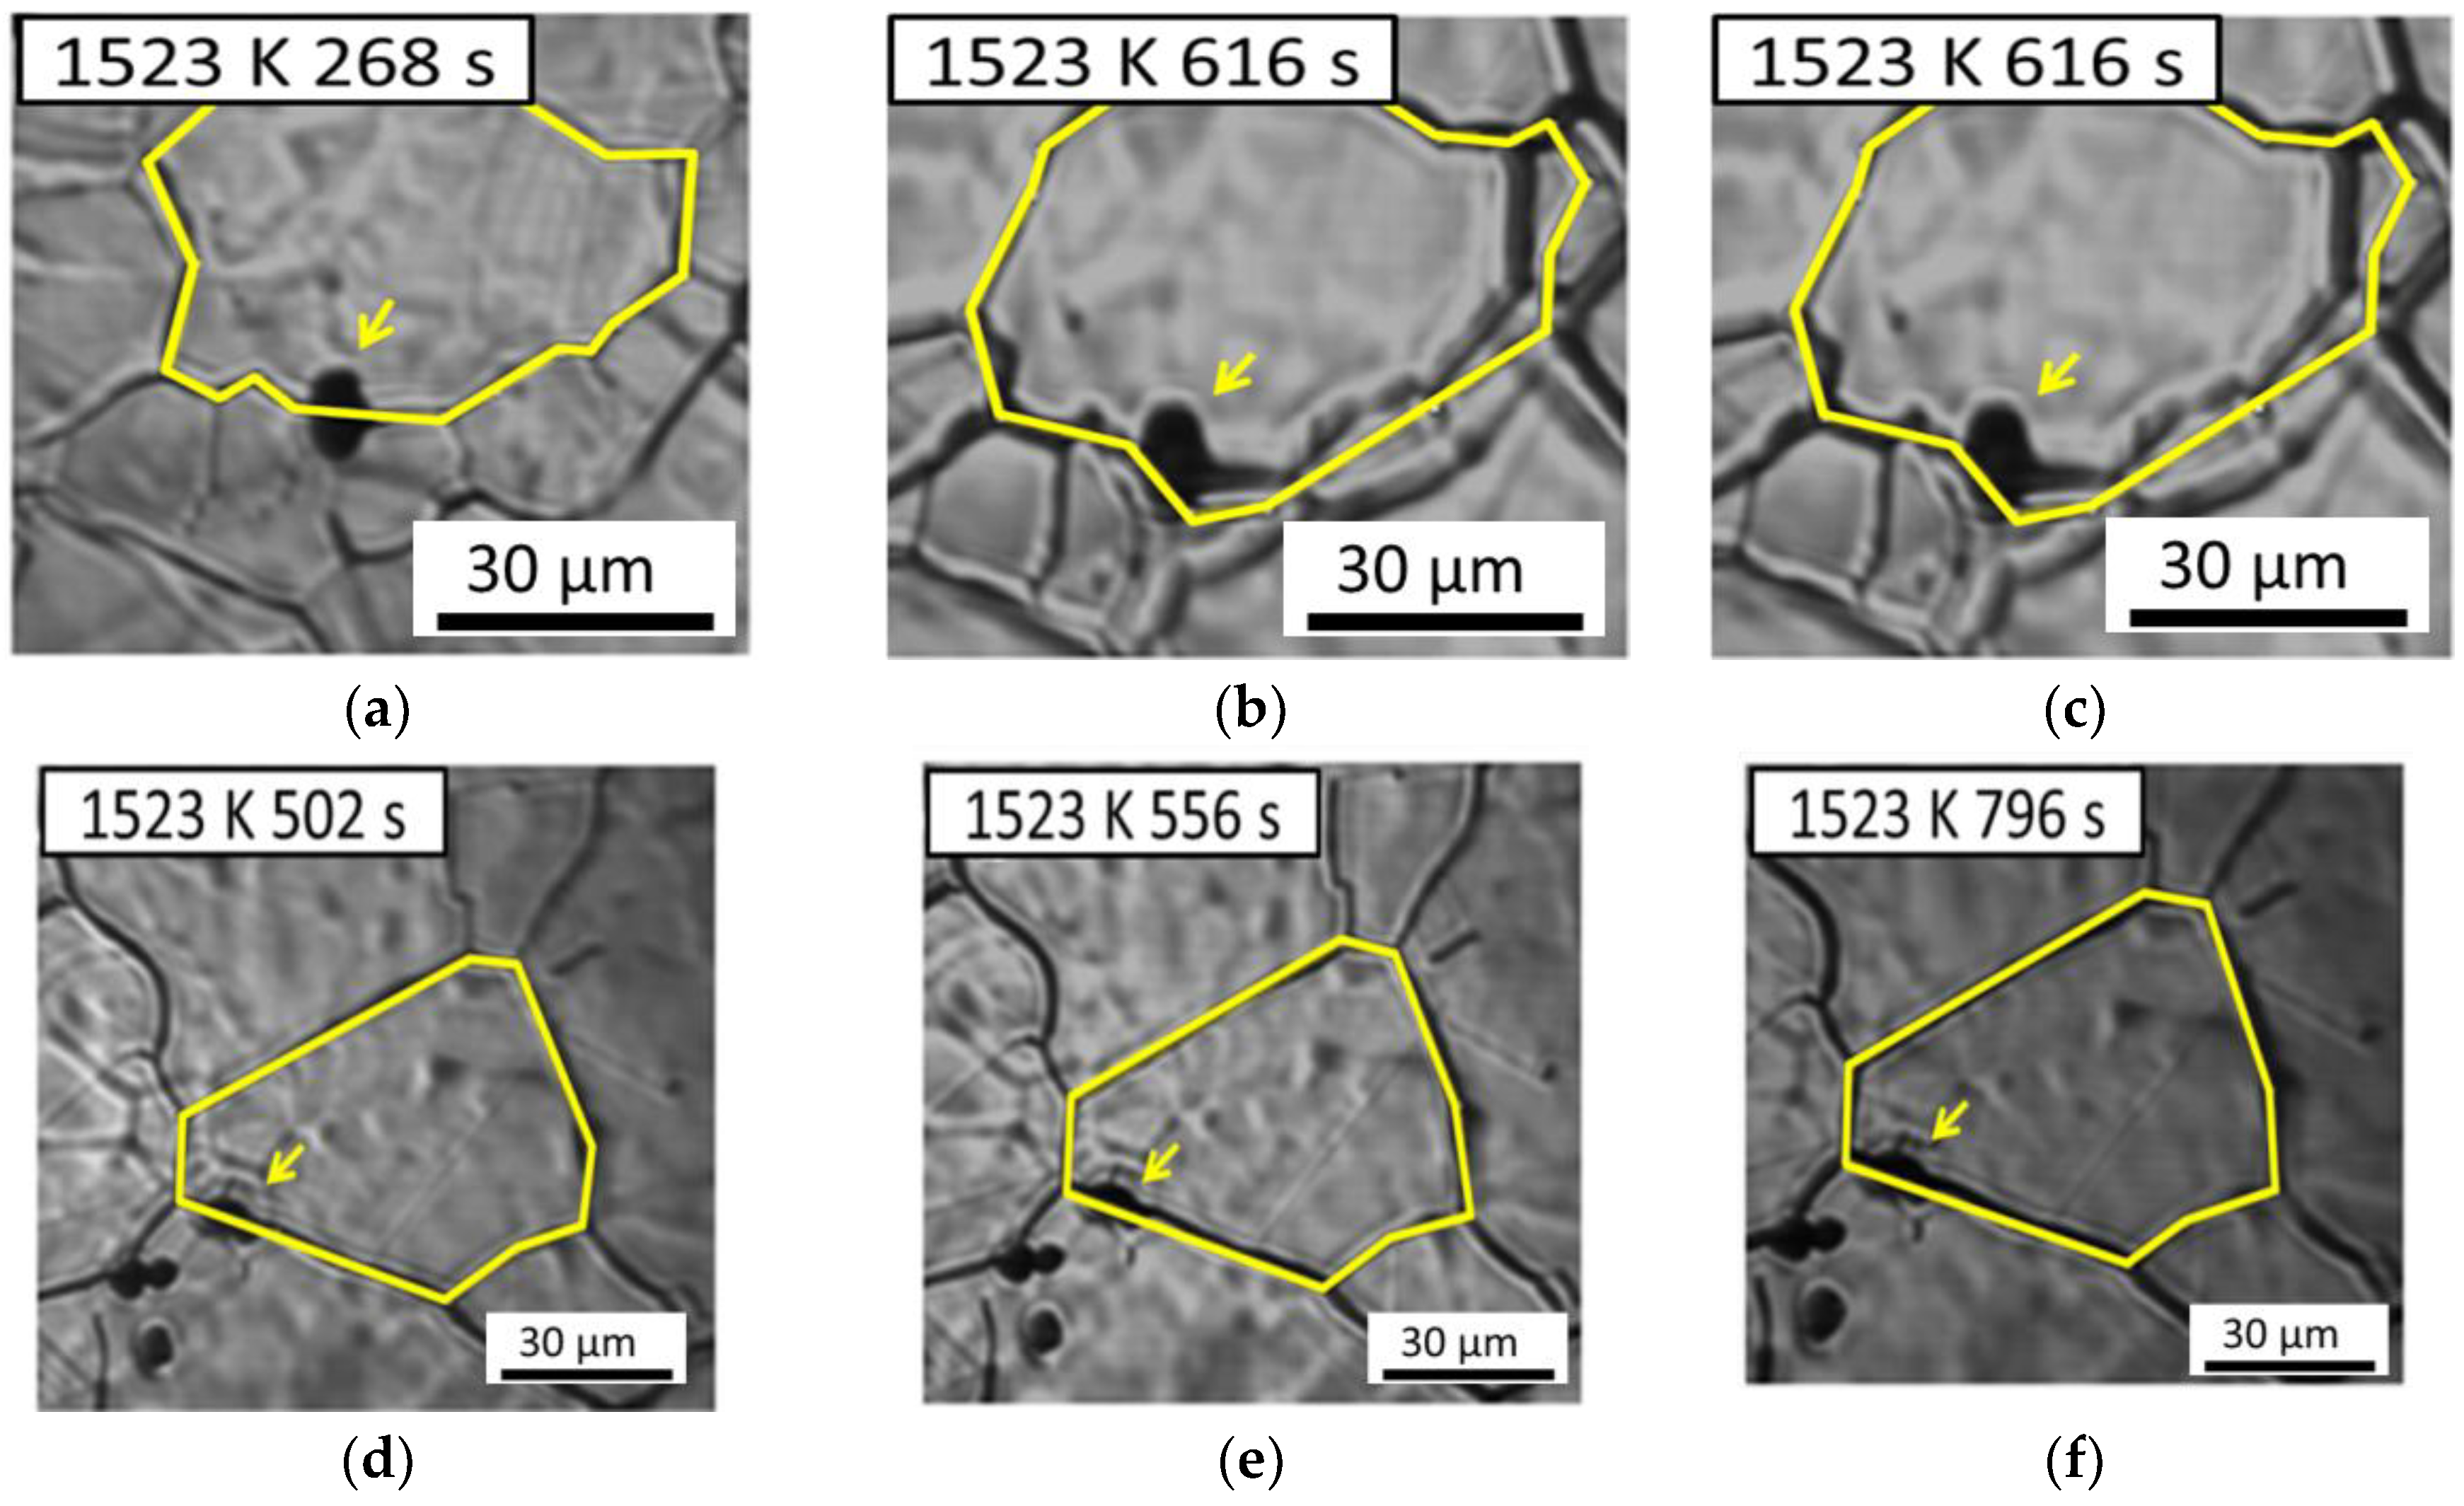
Figure 8 demonstrates the interaction between austenite grains and inclusions in low-carbon steel containing 22 ppm Mg as an example. Here one austenite grain boundary passes through an inclusion in
Figure 8a–c, whereas another austenite grain boundary is retarded by an inclusion in
Figure 8d–f. The results obtained suggest that austenite grain boundaries can pass through an inclusion or be pinned by it. In general, inclusion could inhibit the austenite grain boundaries growth. In this study, we observed that it’s not every inclusion could inhibit austenite grain growth from in-situ observation of CSLM. This variation inspires us to investigate the relationship between the anisotropic pinning effect and inclusions.
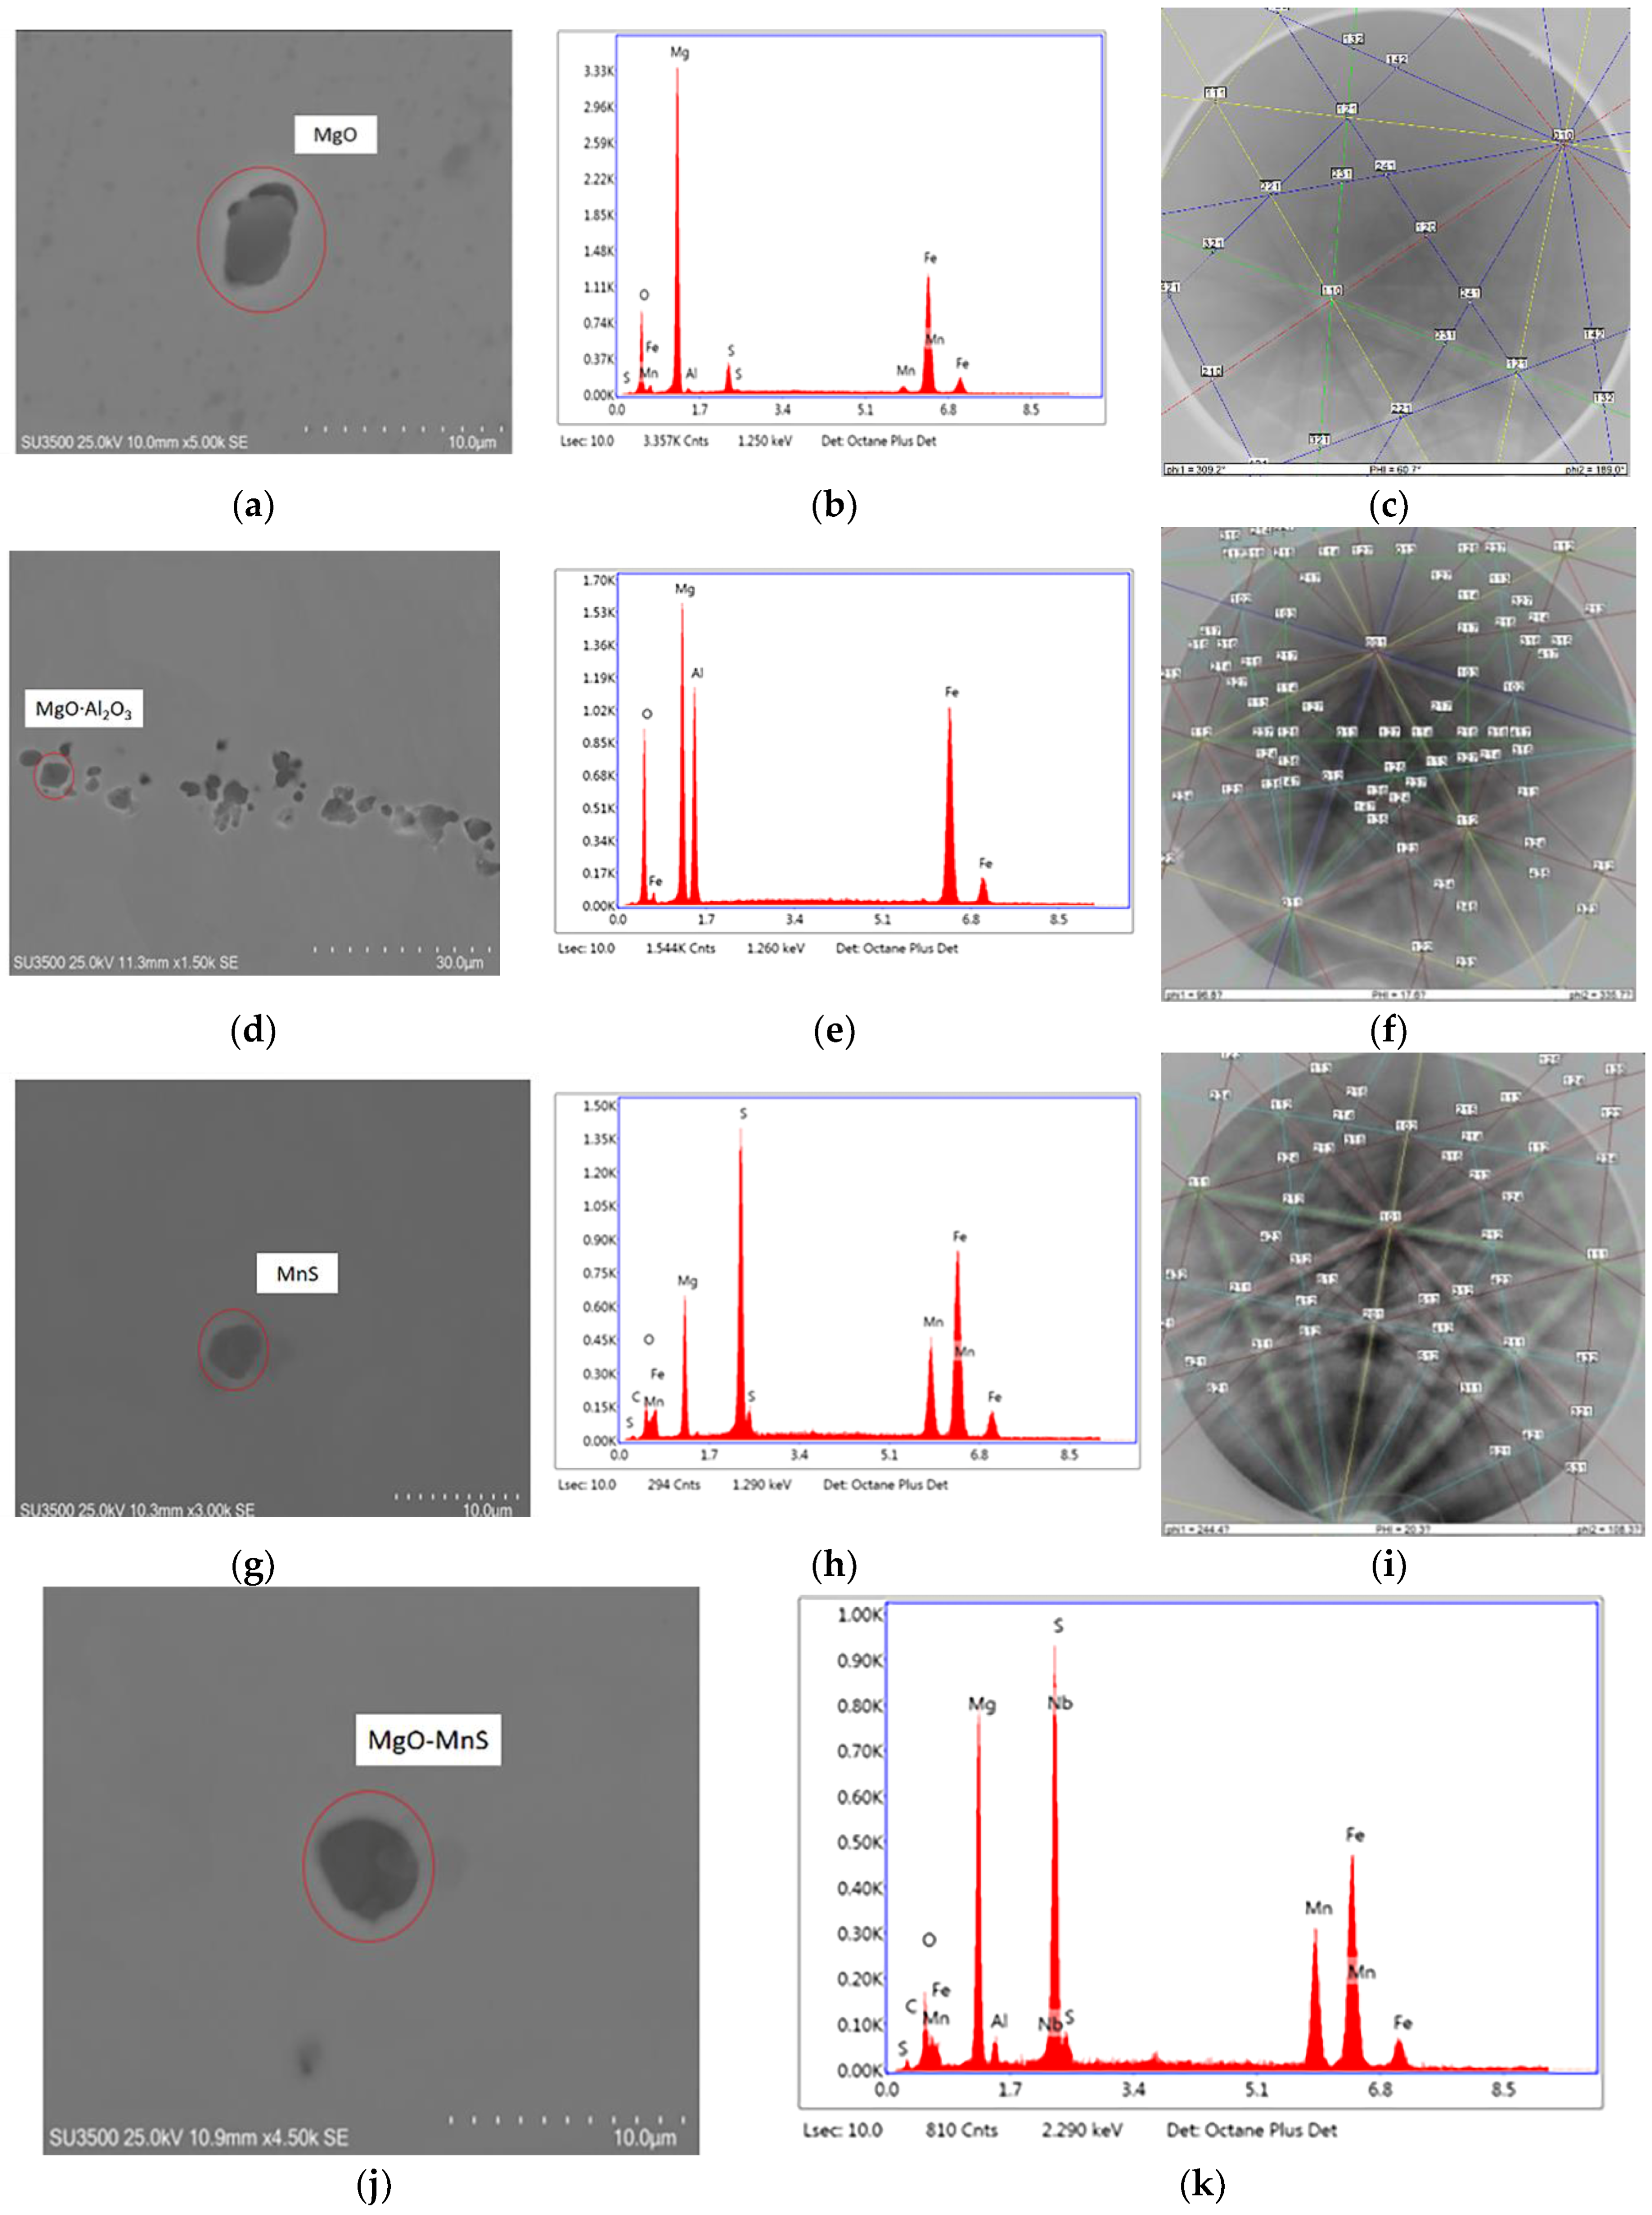
EDS and EBSD were utilized to determine inclusions in low-carbon steel samples containing 22 ppm Mg. The EDS spectra and Kikuchi patterns of the inclusions are summarized in
Figure 9; these inclusions include MgO, MgO
Al
2O
3, MnS, MgO–MnS, and MgO
Al
2O
3–MnS. Here MnS is able to precipitate on MgO or MgO
Al
2O
3 to form complex inclusions, such as MgO–MnS or MgAl
2O
4-MnS [
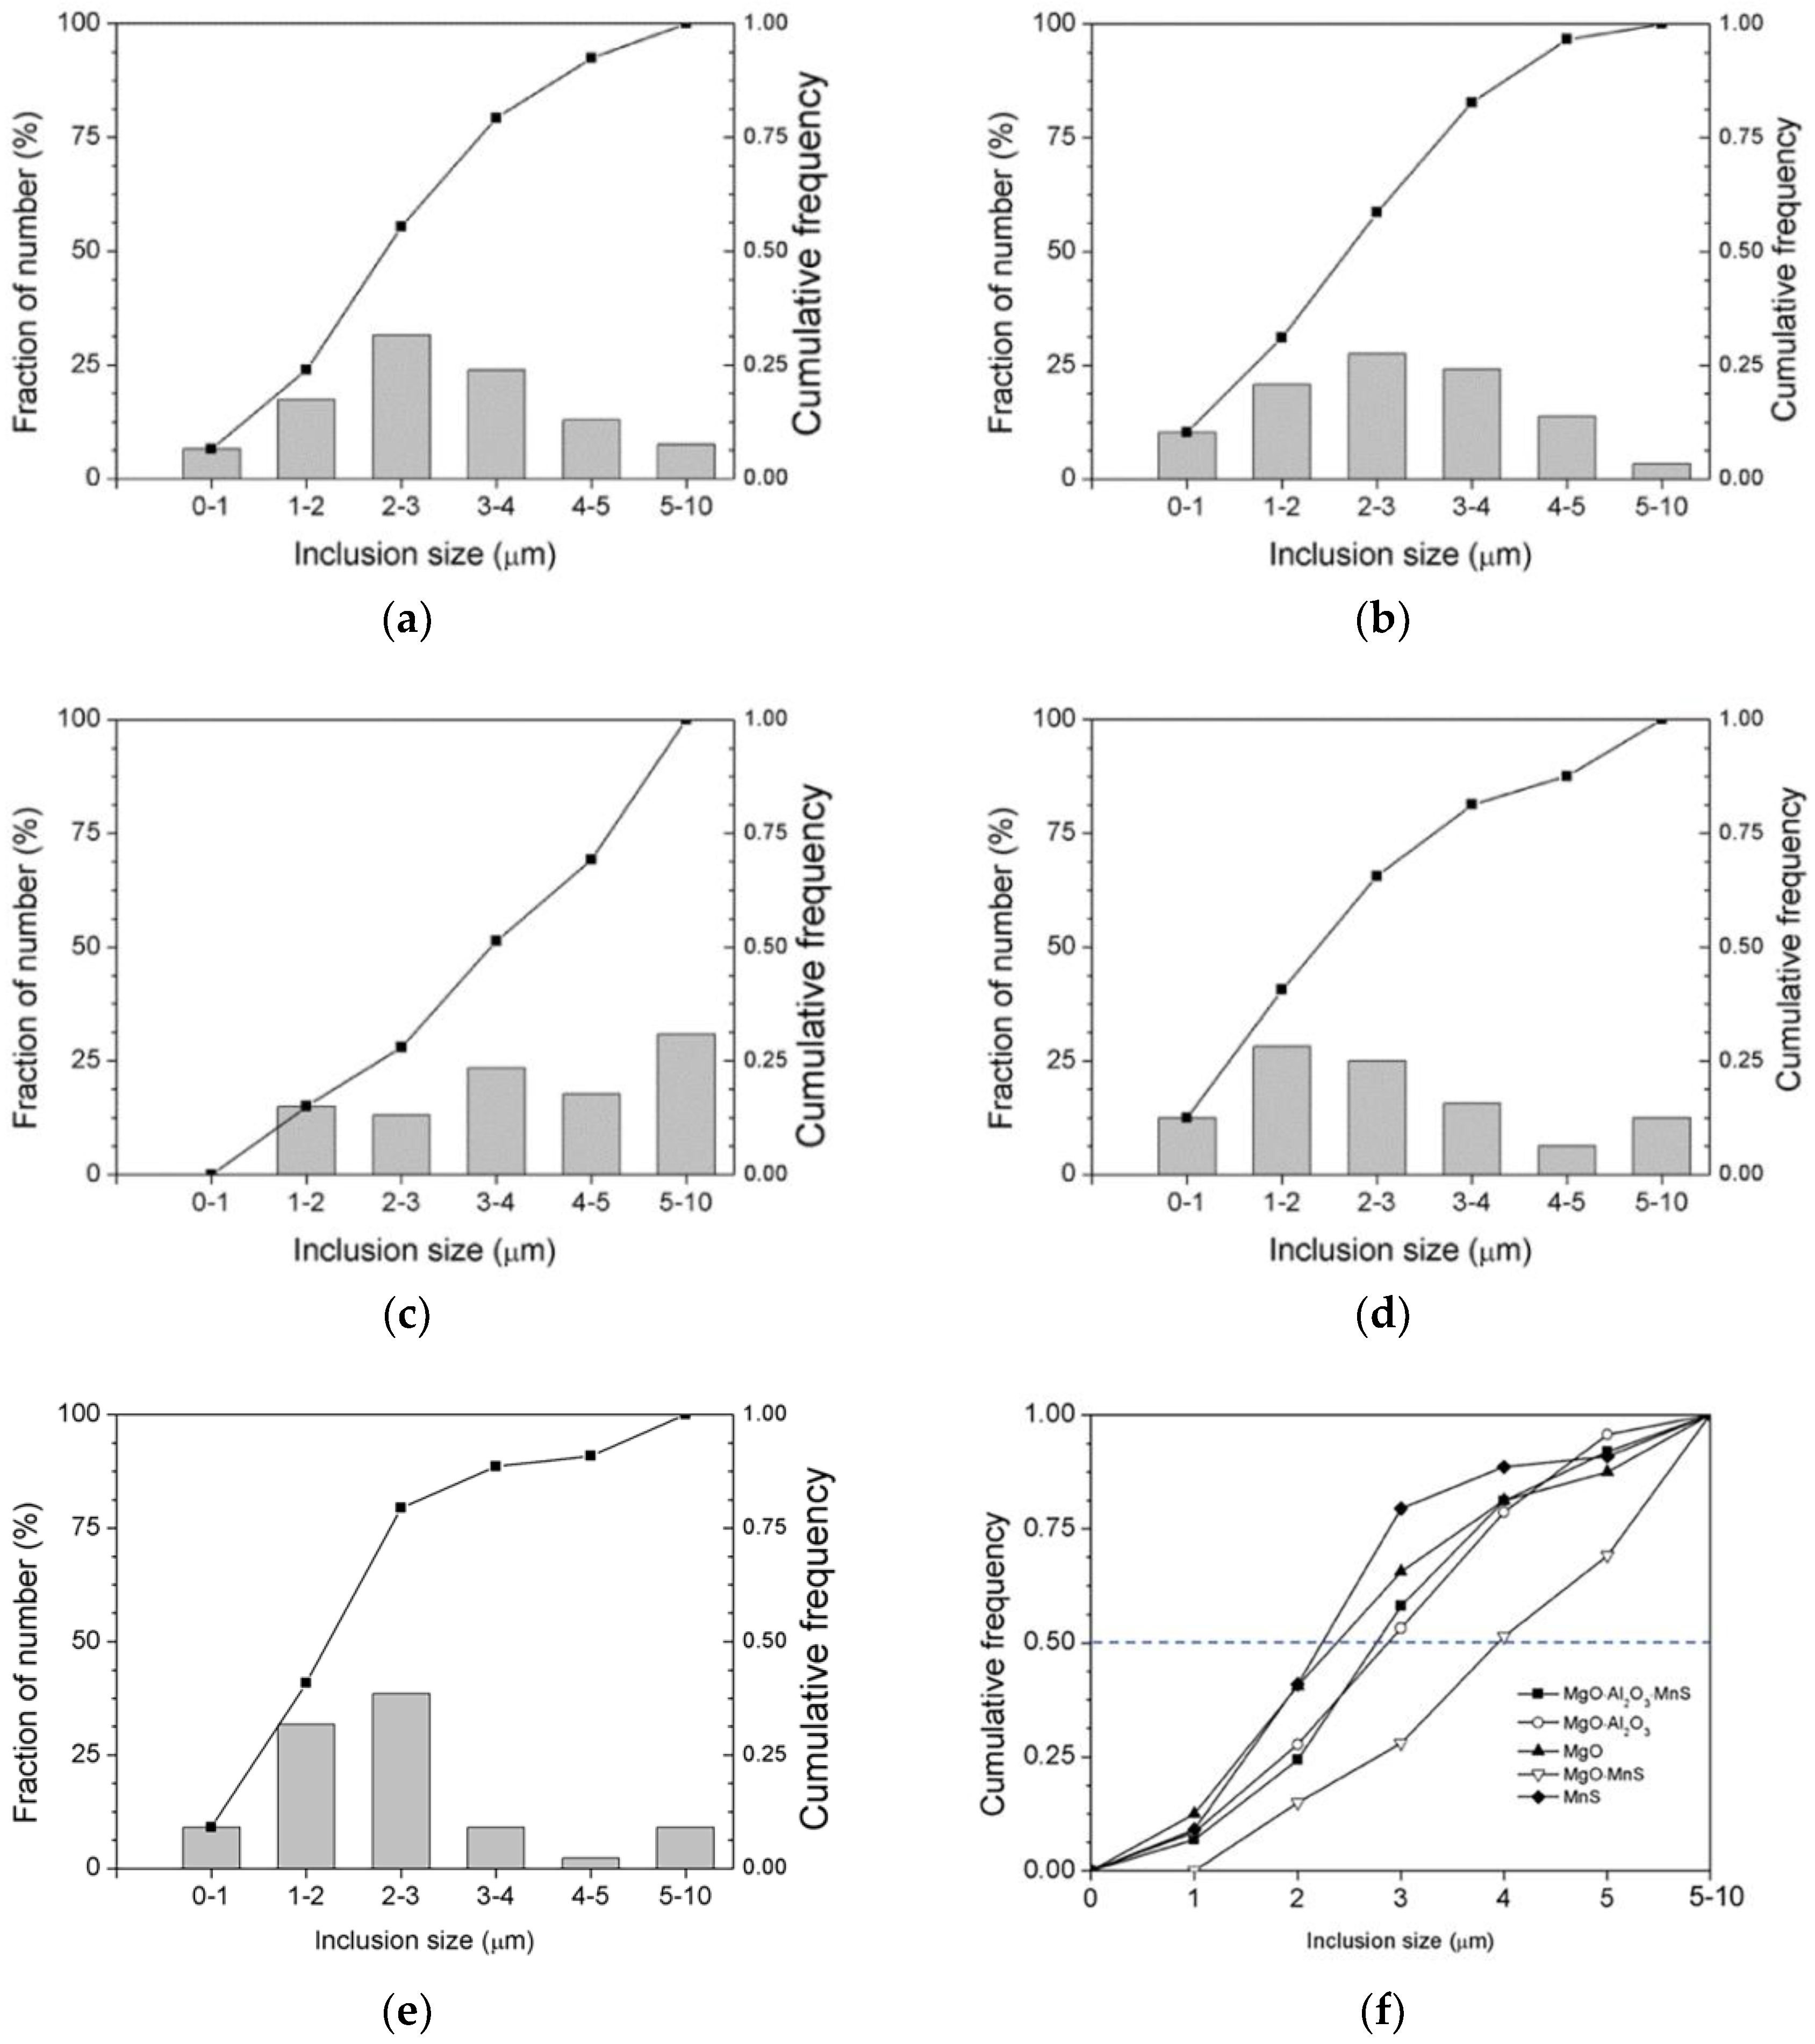
26]. ASPEX measurements were used to characterize the number and type of inclusions, and
Figure 10a–e show the histograms and cumulative frequency distributions of these inclusions. Most of the MgO-MnS inclusions range in size from 3 µm to 4 µm and from 5 µm to 10 µm in
Figure 10c. By comparison, MnS inclusions range in size from 1 µm to 3 μm in
Figure 10e.
After identifying inclusions, the mobility of grain boundaries was determined using in situ micrographs obtained by HT-CSLM. Here the mobility m of the grain boundaries is proportional to the net driving force, which is equal to the driving force of grain growth (
FP) subtracted from the Zener pinning force (
FR) and given as follows:
where
V is the velocity of the austenite boundary. According to Burke et al. report, the driving force for austenite grains is expressed as follows [
27]:
and the retarding force is given as
where
R is the curvature of the grain boundary,
is the austenite grain boundary energy,
fV is the volume fraction of the inclusion, and r is the inclusion radius. Here, the radius
r is equal to half of the average diameter, and
fA is obtained by dividing the number of inclusions
N by the measured area
A. Then, the equation
fV =
fA/2
N is employed.
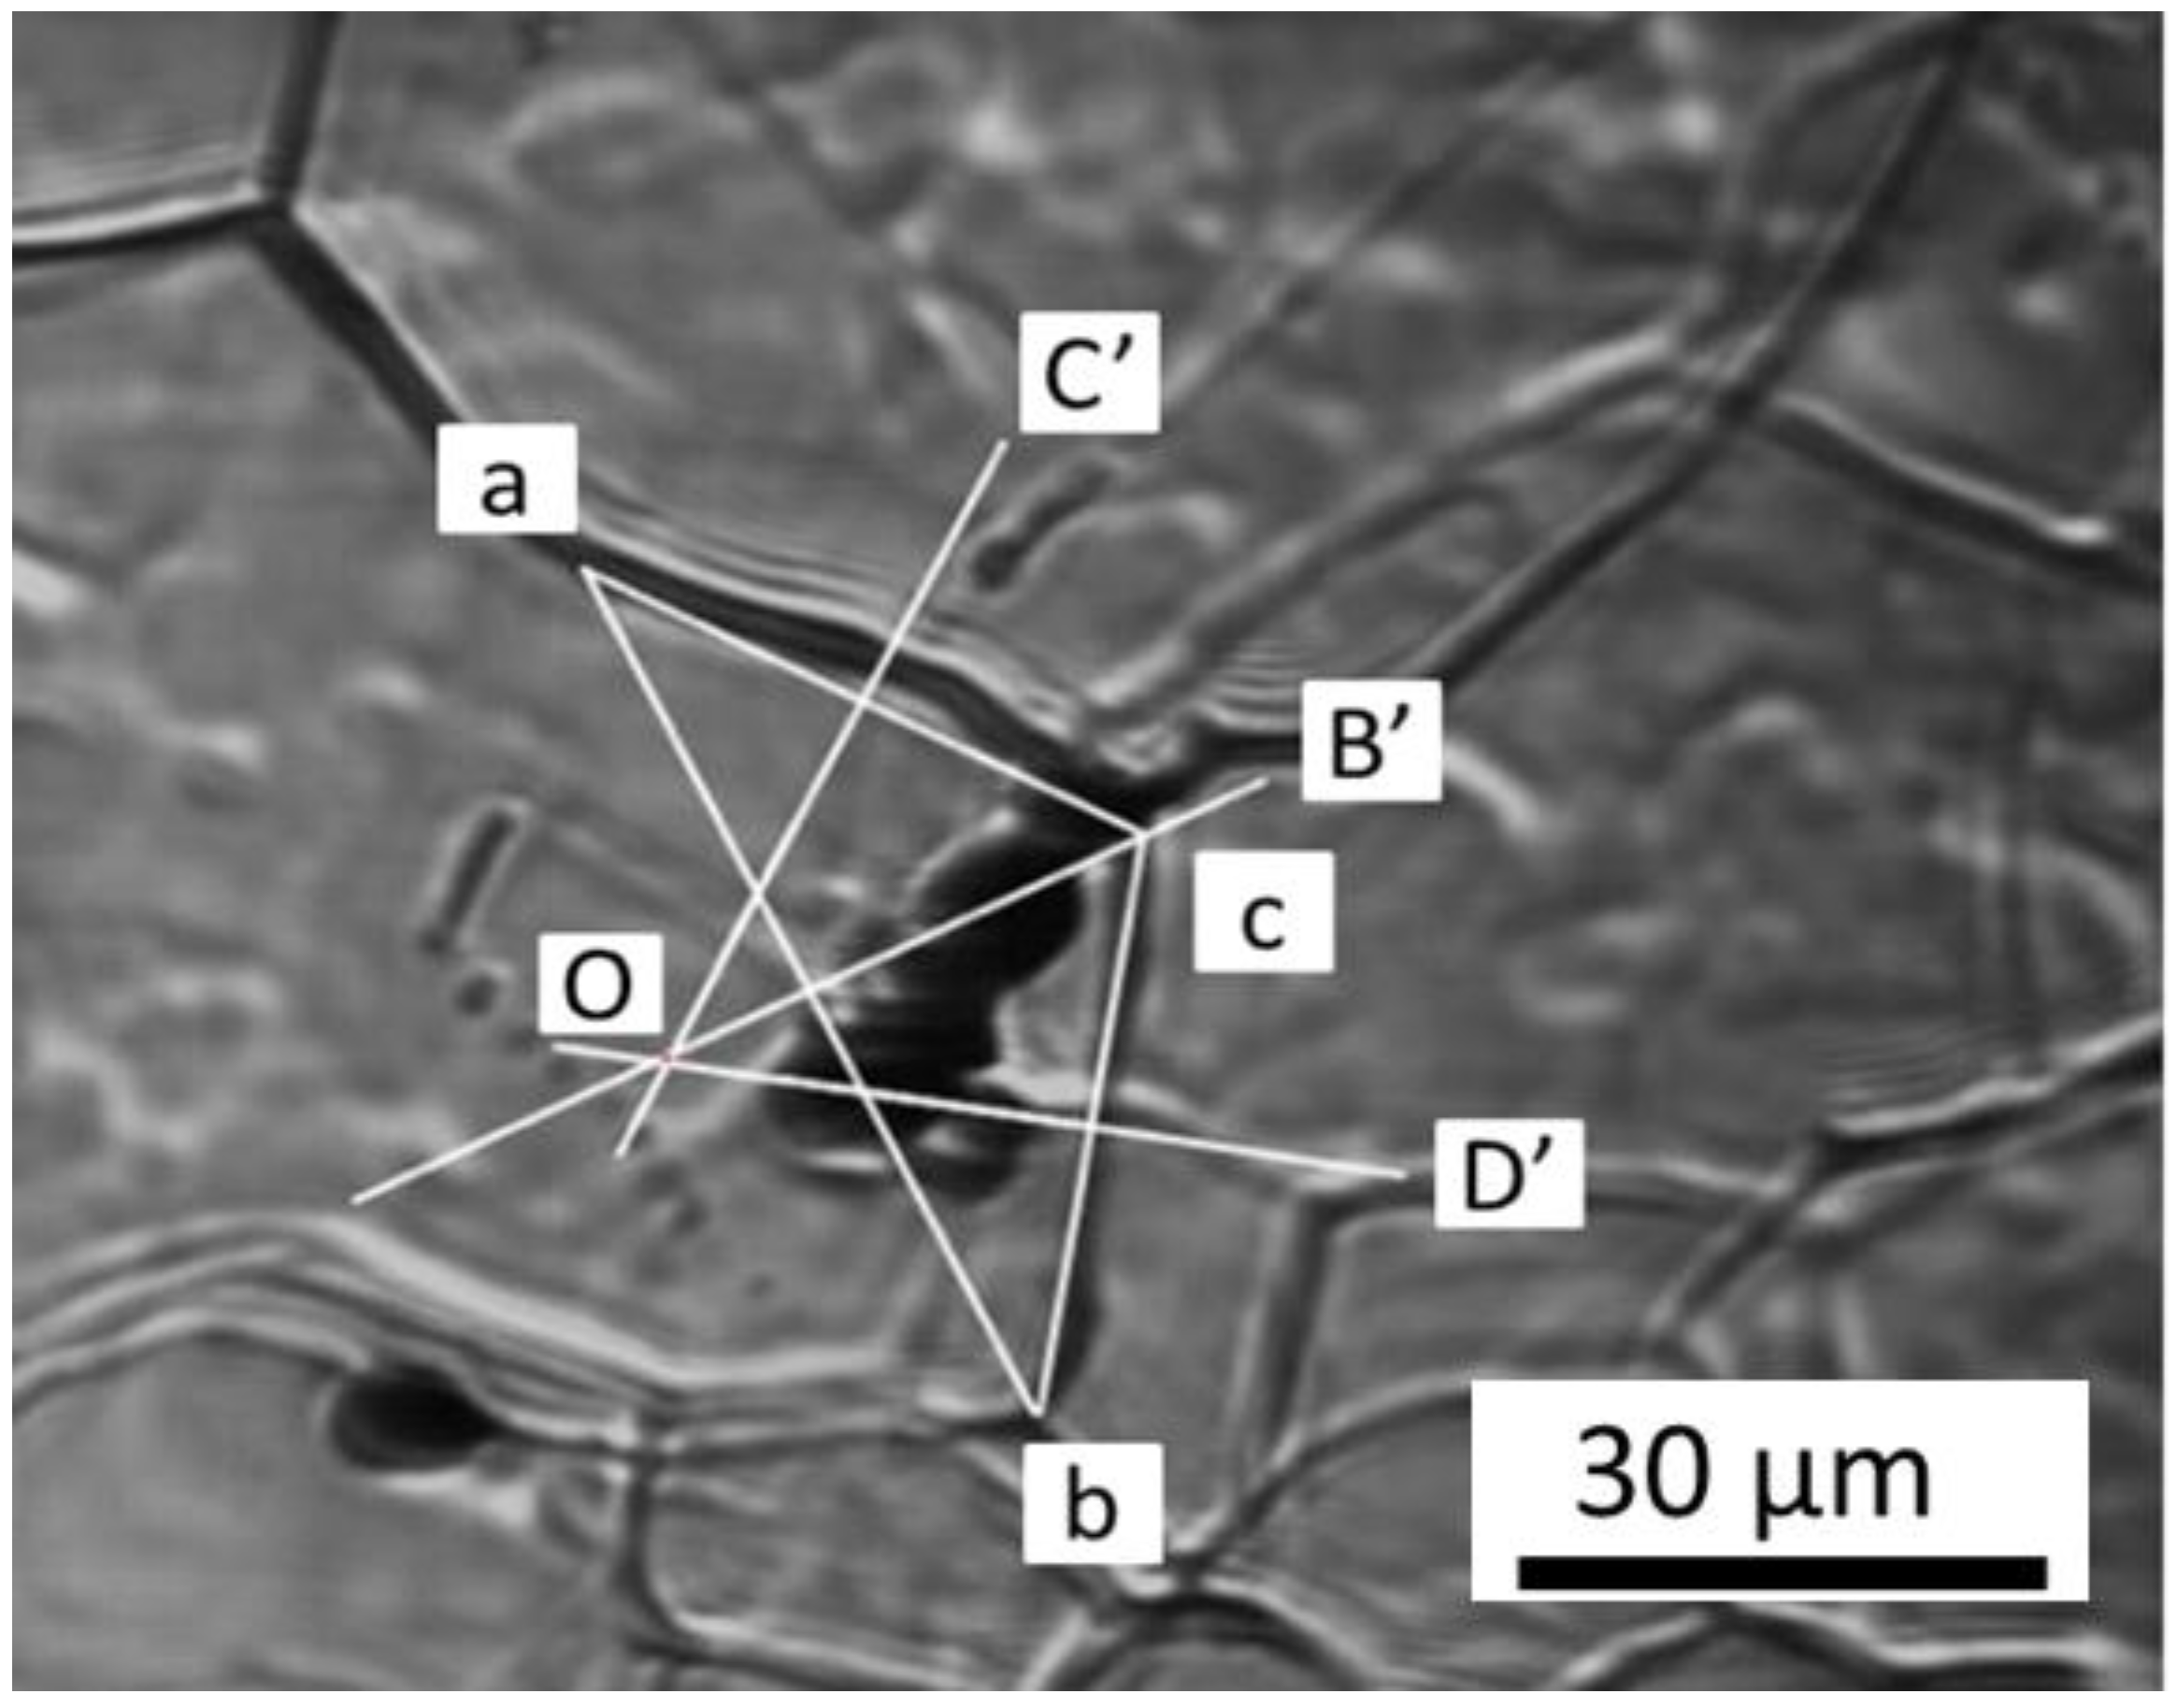
To determine the driving force for austenite grain, the average curvature of the grain is calculated by adopting the method proposed by Aleksandra et al. report [
28]. Considering the boundaries ac and cb in
Figure 11, we combined two points, a and b, and obtained a triangle acb. Then, the vertical lines of ac, cb, and ab are OC’, OD’, and OB’, respectively. Subsequently, point O was determined as the point of intersection of lines OC’, OD’, and OB’. Thus, the vertical distance from the point of intersection O to ac and cb is the curvature R of the grain boundaries ac and cb. The inclusion radius r was directly observed from the in situ image of HT-CSLM. Here the austenite grain boundary energy
is 1.159 J/m
2, as reported by Vynokur [
29]. With these data, we were able to calculate
FR,
FP, and
V according to Equations (5), (6), and (4), respectively.
Based on the results of HT-CSLM images, inclusions were found at the interior of grains, at the boundaries, and at the triple points. In theory, we should have identified inclusions by EDS first, and these inclusions should lie at the same time at the boundaries or at the triple points after annealing because the grain structure appears after annealing due to the thermal grooving effect. However, we successfully observed 17 inclusions at the boundaries or triple points and summarized our observations as four cases in
Table 3 for MgO, MnS, MgO–MnS, and MgO
Al
2O
3–MnS.
Figure 12,
Figure 13,
Figure 14,
Figure 15 and
Figure 16 show examples of in situ HT-CSLM micrographs of inclusions of MgO, MnS, MgO-MnS, and MgO
Al
2O
3-MnS. The grain boundaries are retarded by inclusions in the first case, which we call the pinning grain boundary The triple junctions of grain boundaries are pinned by inclusions in the second case, which we call the pinning triple point. The pinned grain boundaries pass through inclusions later in the third case, which we call the passing-through grain boundary, and the pinned triple junction of grain boundaries passes through inclusions in the fourth case, which we call the passing-through triple junction.
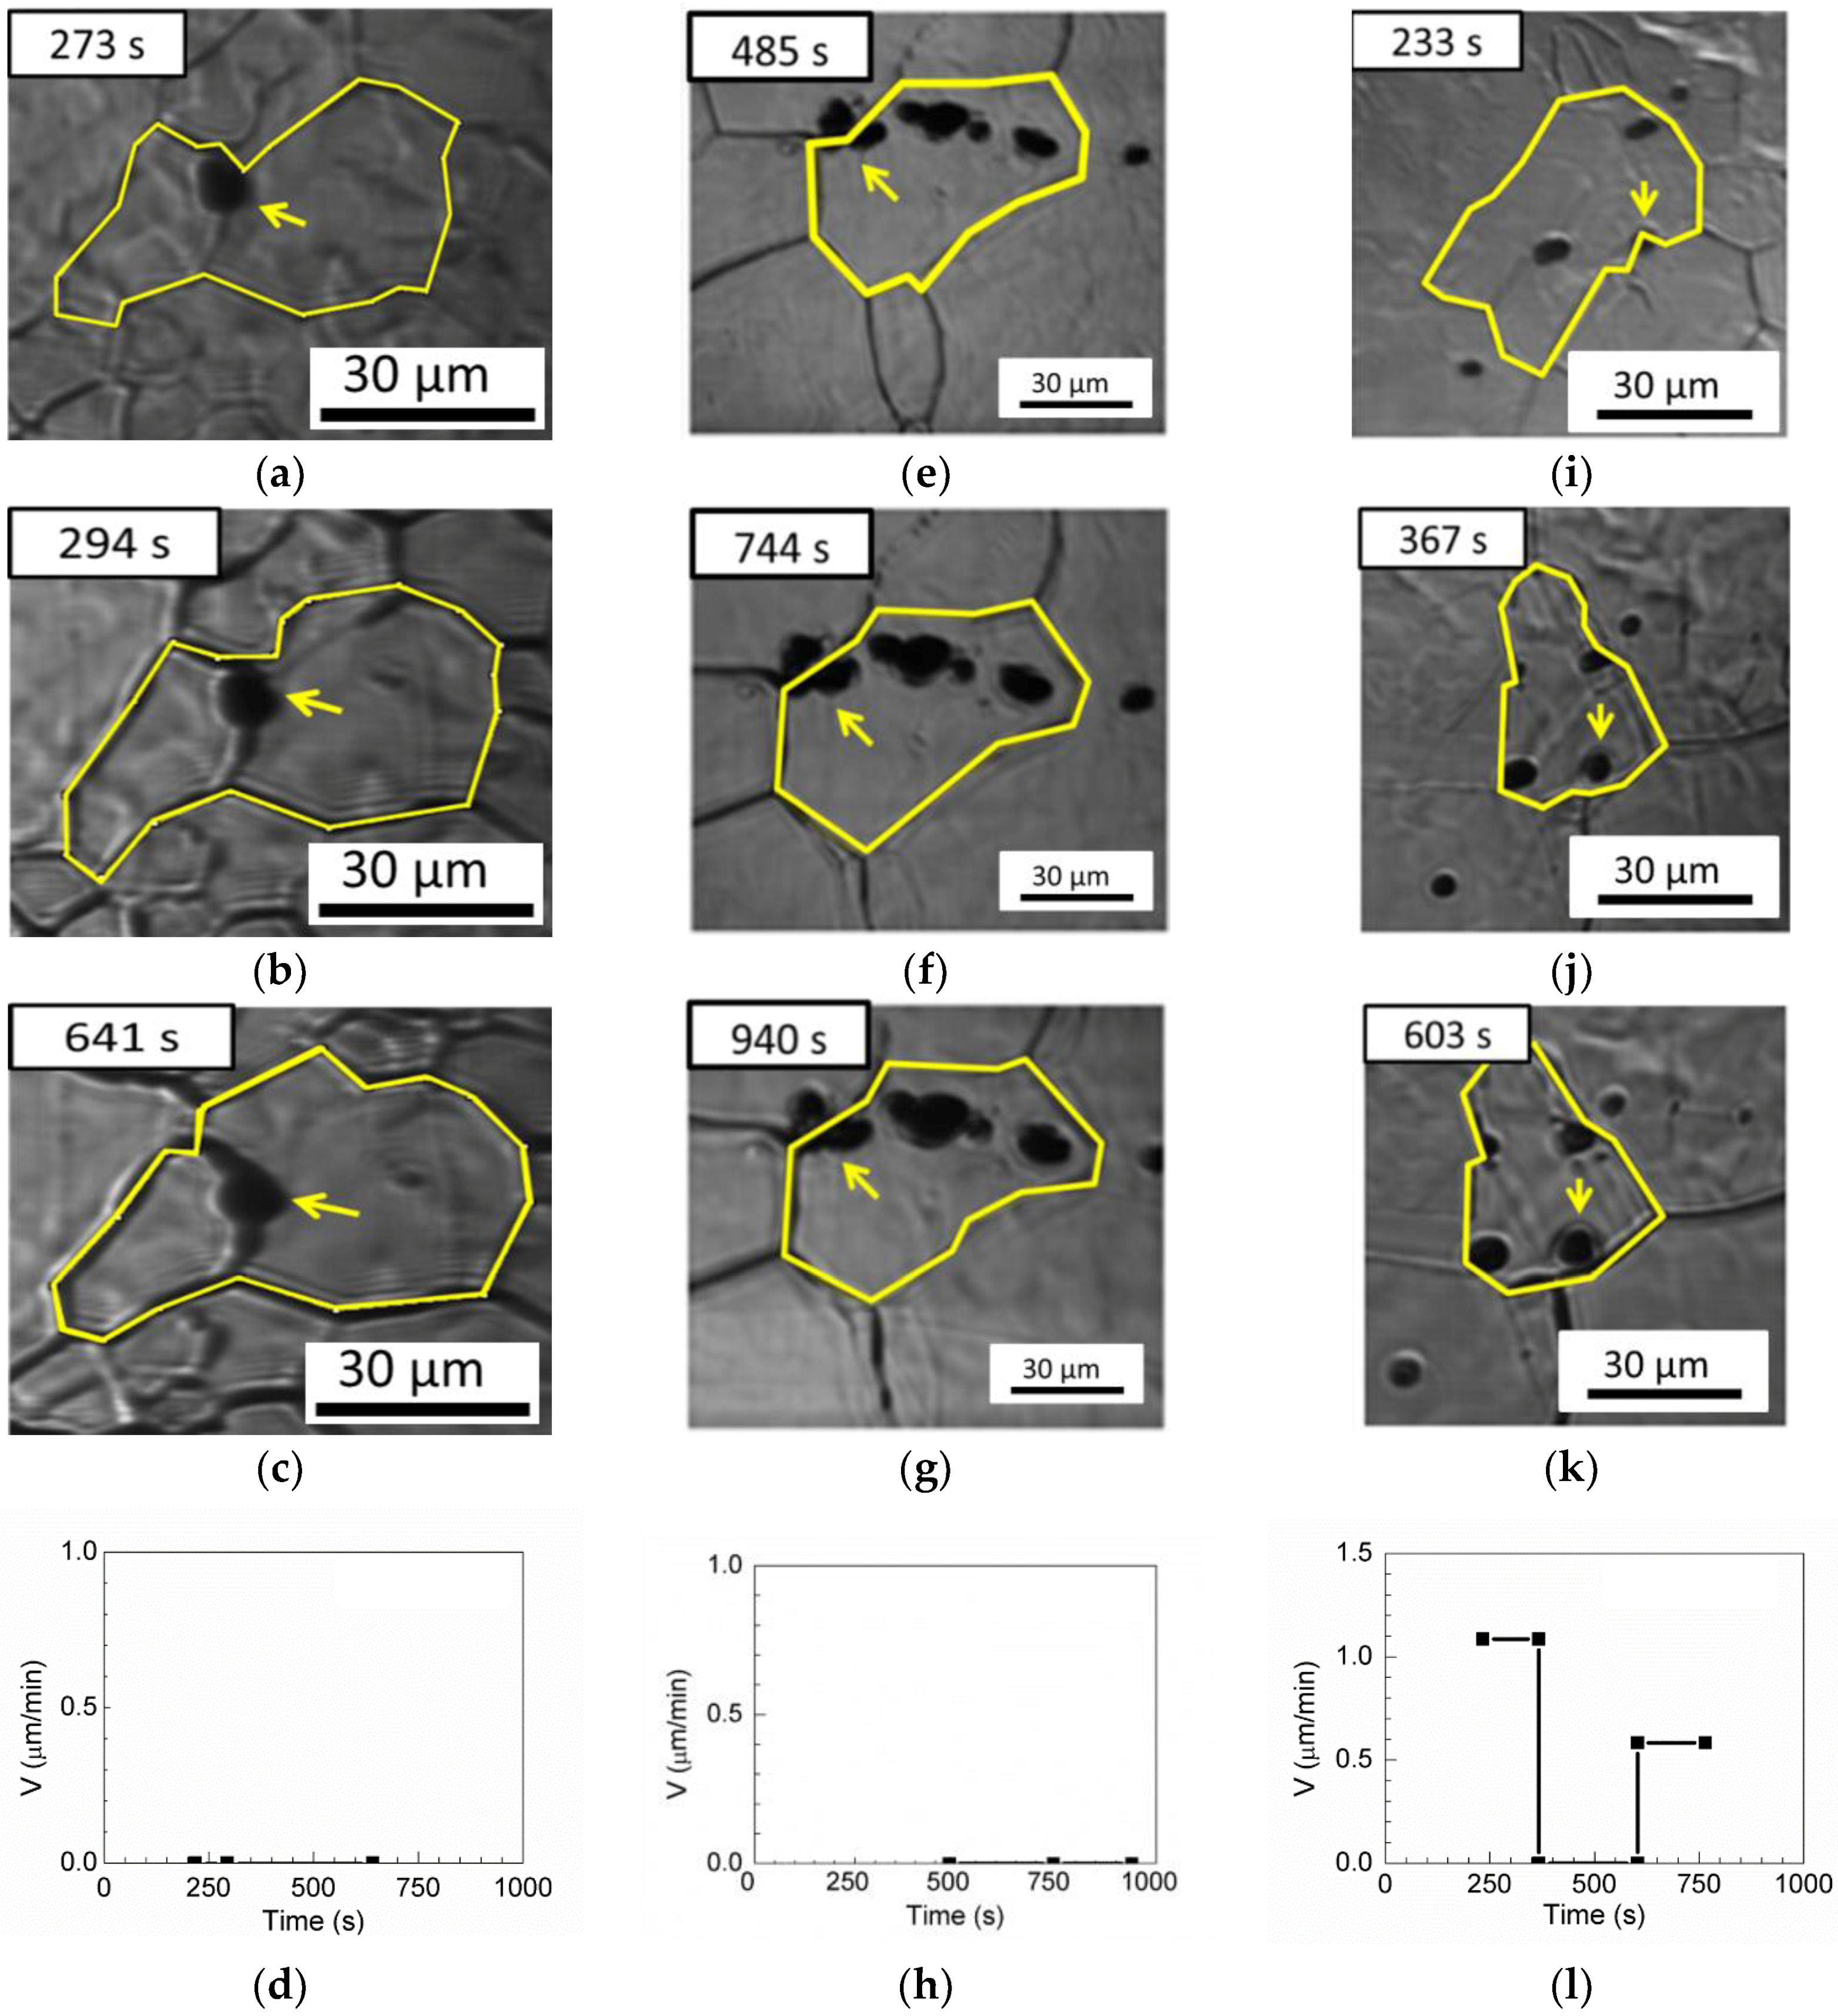
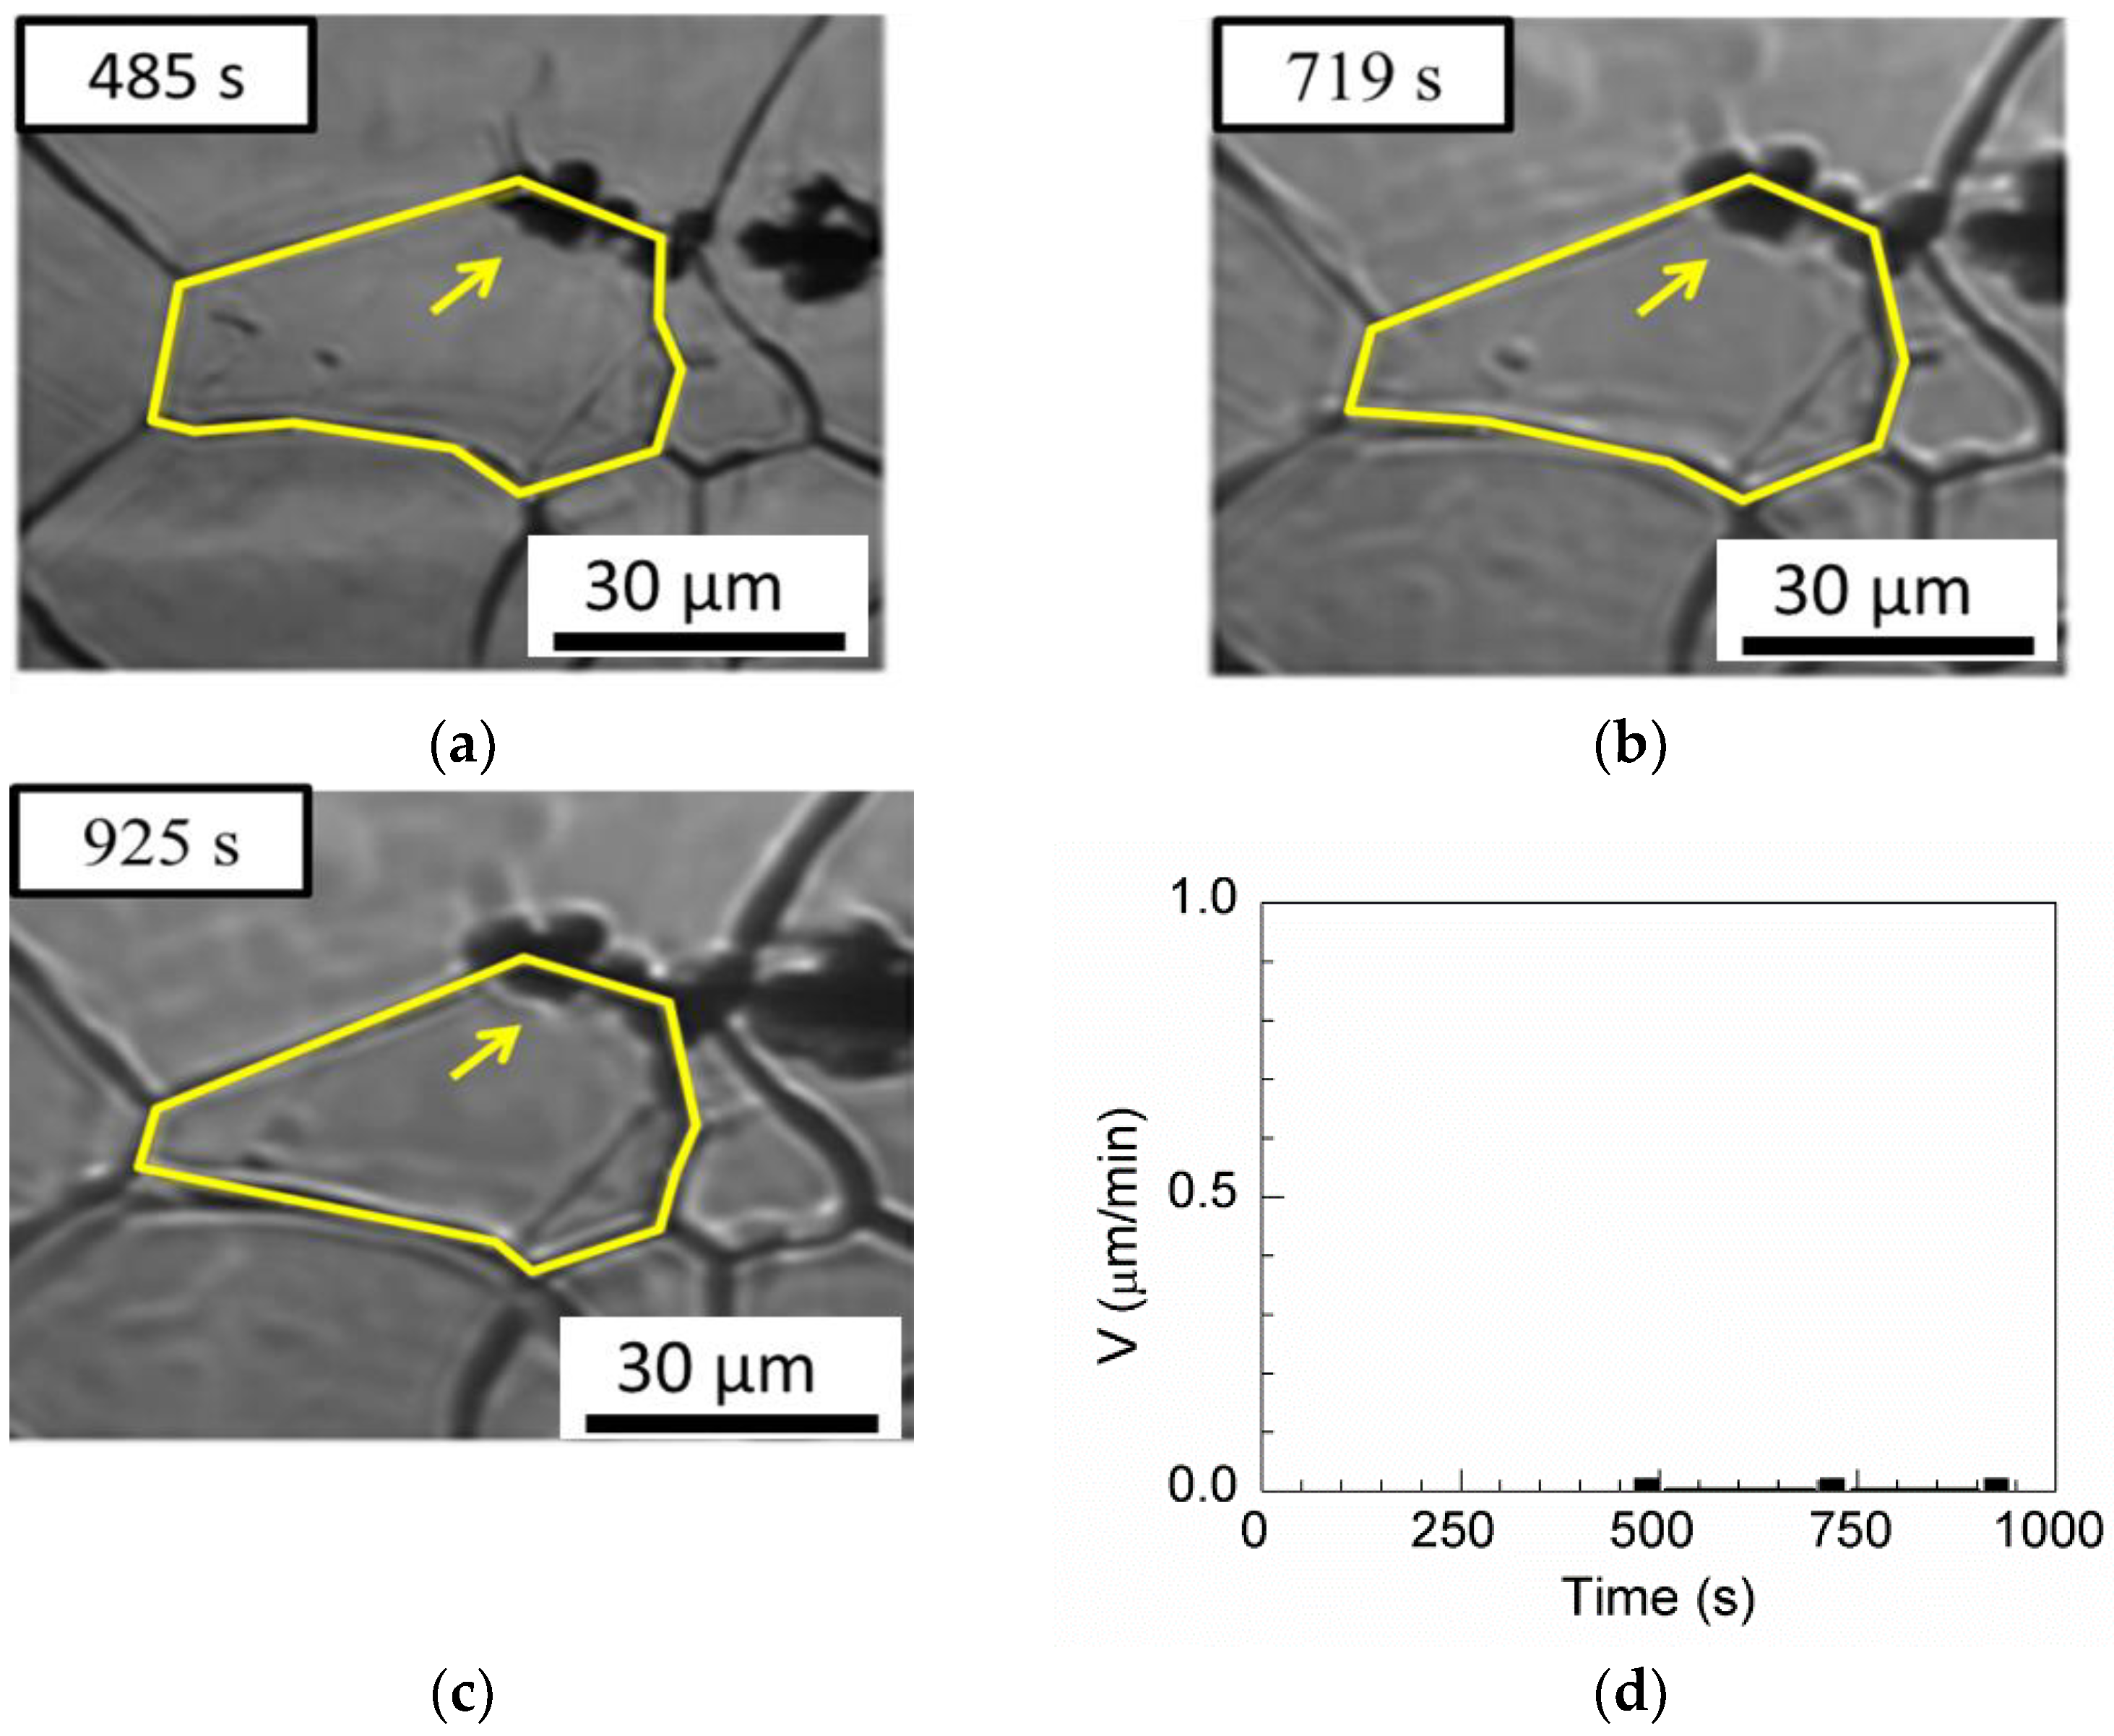
Three pinning boundaries, one pinning triple junction, and one passing-through boundary are observed for MgO in
Table 3. The grain boundary is retarded by MgO inclusion in
Figure 12a–c, and the velocity of the austenite boundary is 0 μm/min in
Figure 12d.
Figure 12e–g show the pinned triple junction with a boundary velocity of 0 µm/min in
Figure 12h.
Figure 12i–k illustrate boundary migration with inclusions. First, the austenite grain boundary without inclusions migrates freely, and the boundary velocity is 1.085 µm/min at annealing times less than 367 s. Subsequently, the boundary is pinned by inclusions, and the boundary velocity drops to 0 µm/min between annealing times of 367 and 604 s. Then, when the annealing time exceeds 604 s, the inclusions are unable to retard the migration of austenite grains. Grain boundary migration occurs through the inclusions, and the boundary velocity is 0.5838 µm/min, as shown in
Figure 12l.
Four passing-through grain boundaries and one pinning triple junction are observed for MnS in
Table 3.
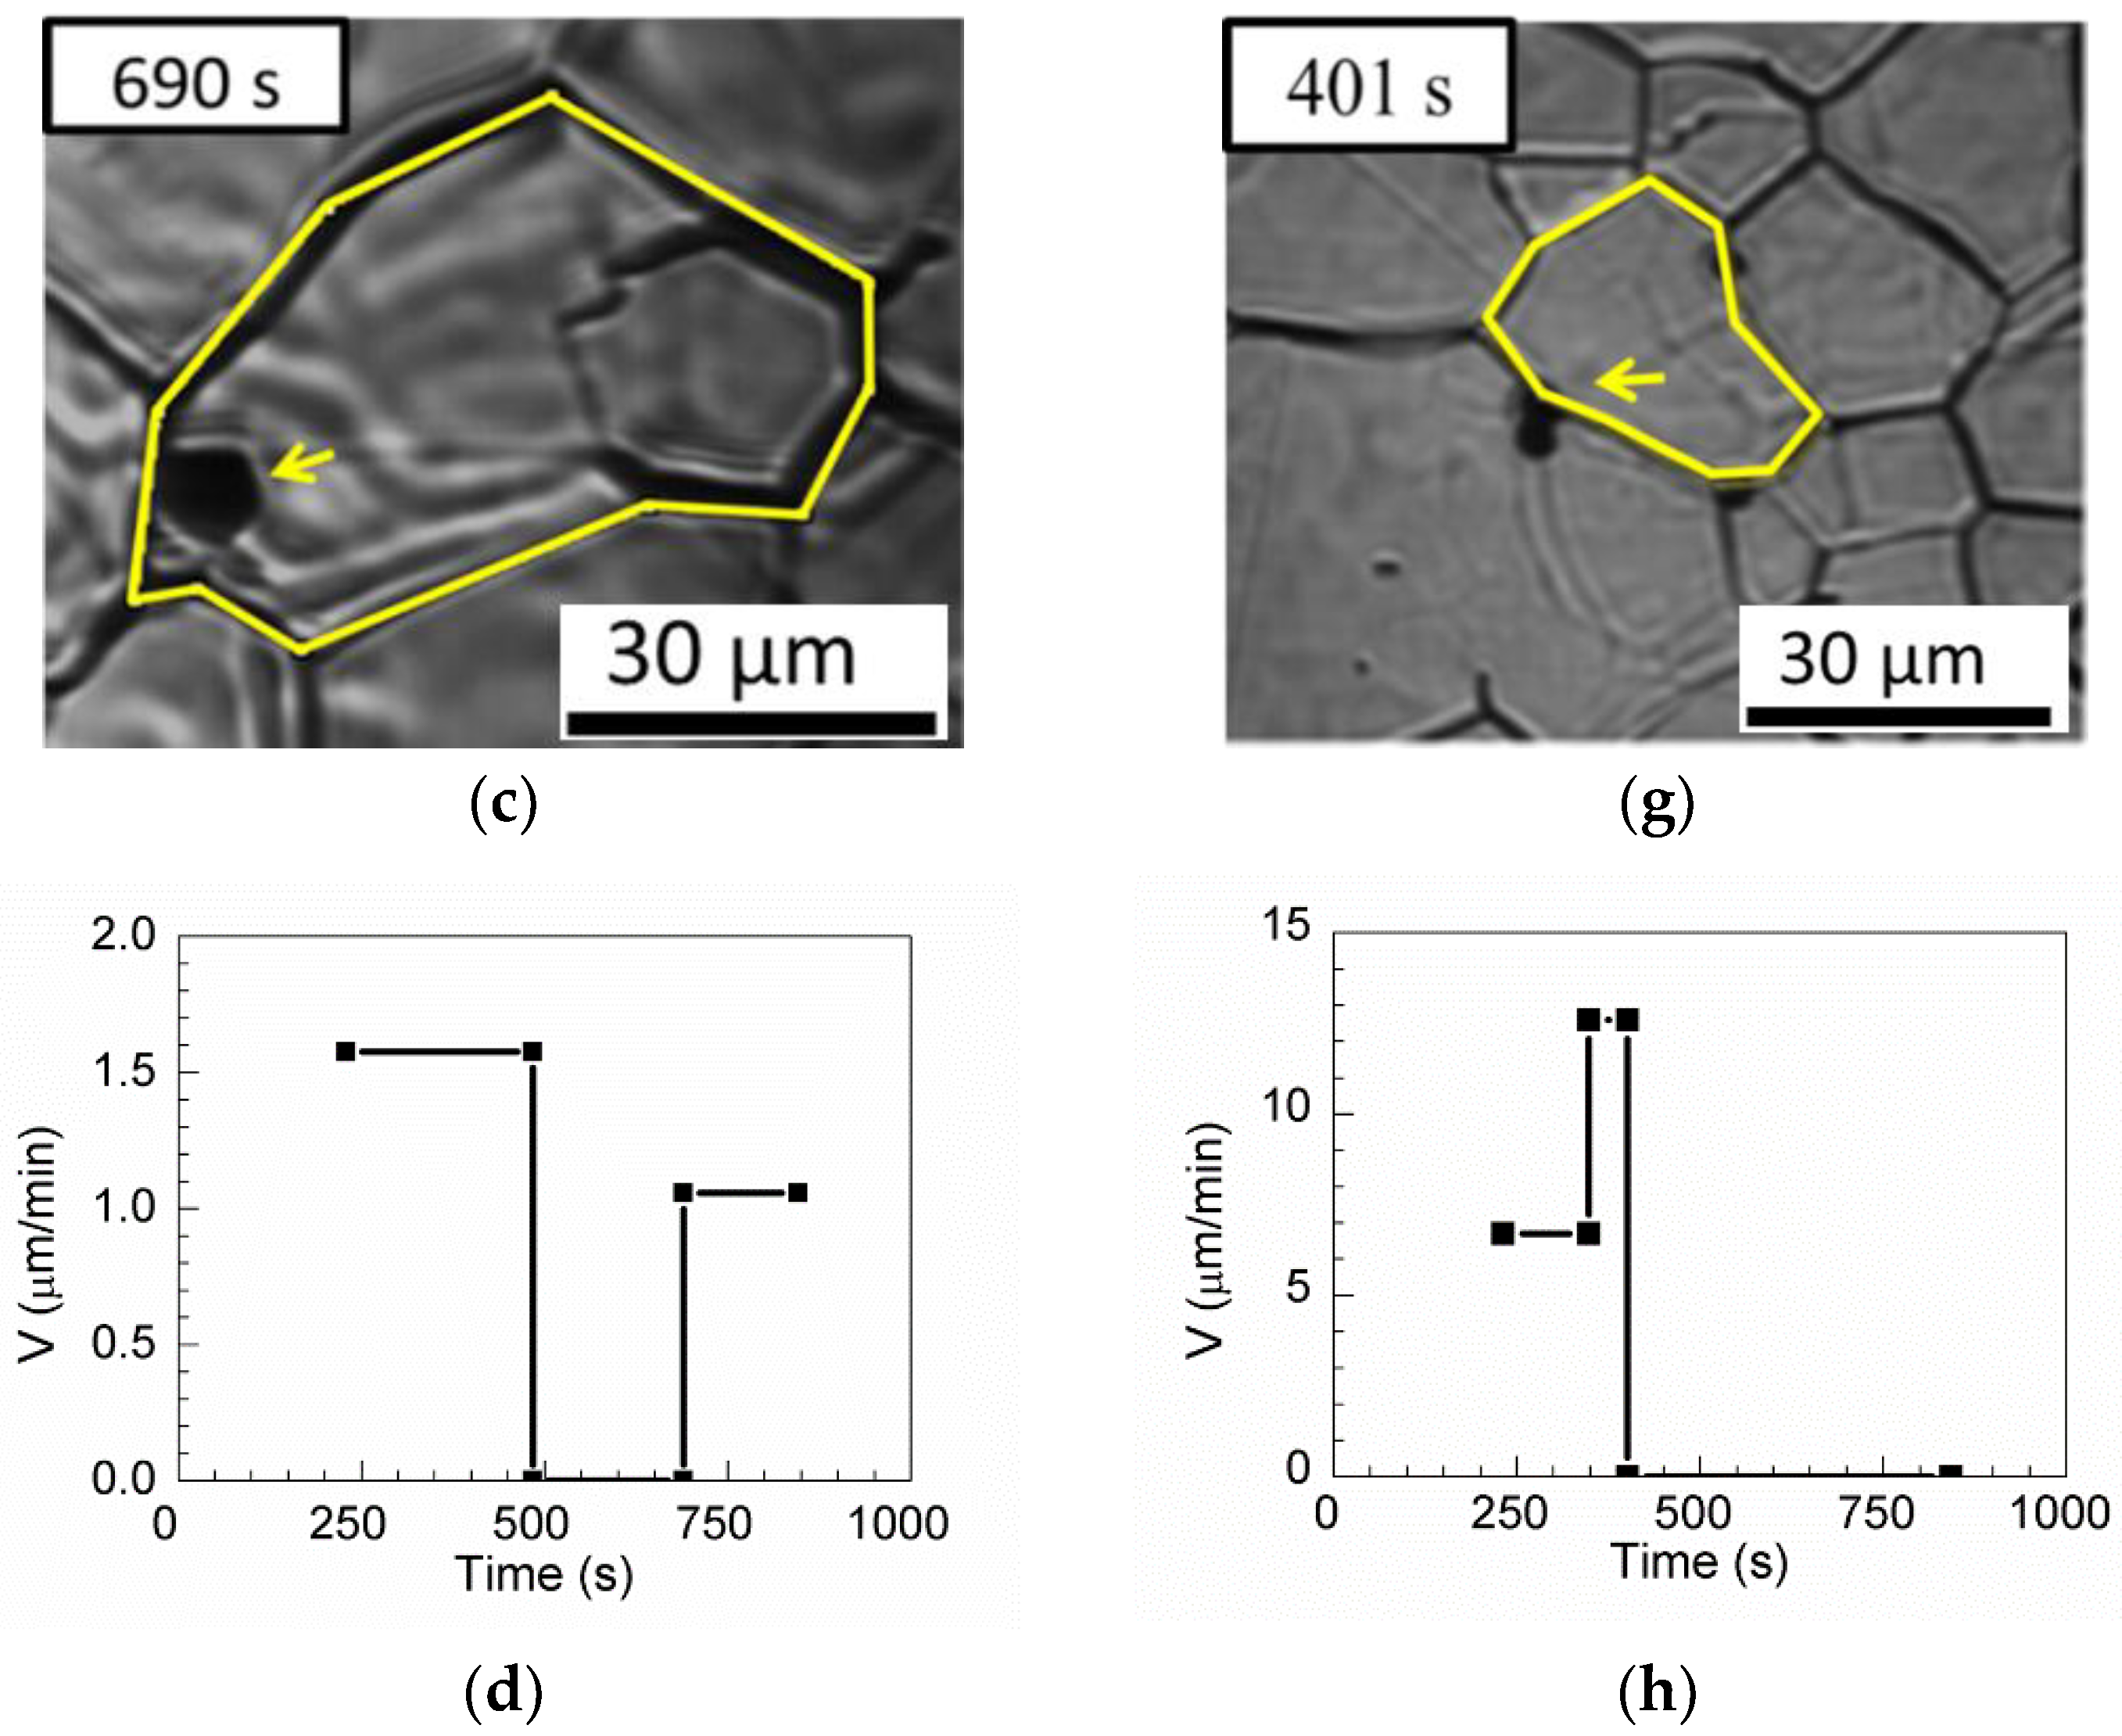
Figure 13a–c show the passing-through grain boundary. The boundary without inclusions can move freely when the annealing time is less than 484 s [
Figure 13a]. The austenite grain boundary is pinned by inclusions between annealing times of 484 and 690 s [
Figure 13b]. After annealing for 690 s, the boundary passed through the inclusions and continues to grow [
Figure 13c].
Figure 13d shows the evolution of the boundary velocity from 1.58 µm/min to 0 μm/min and then to 1.06 μm/min.
Figure 13e–g show the pinning triple junction. First, the triple junction of the grains has a boundary velocity of 6.71 µm/min at annealing times less than 348 s and 12.597 μm/min between annealing times of 348 and 401 s in
Figure 13e,f, respectively. After annealing for 484 s, the boundary is pinned, as shown in
Figure 13g.
One pinning grain boundary is observed for MgO
Al
2O
3 in
Table 3.
Figure 14a–c show that the boundary was pinned by inclusion, even when the annealing time increased to 440 s, and the boundary velocity was 0 µm/min, as shown in
Figure 14d.
One pinning grain boundary, two pinning triple junctions, and one passing-through grain boundary are observed for MgO–MnS in
Table 3.
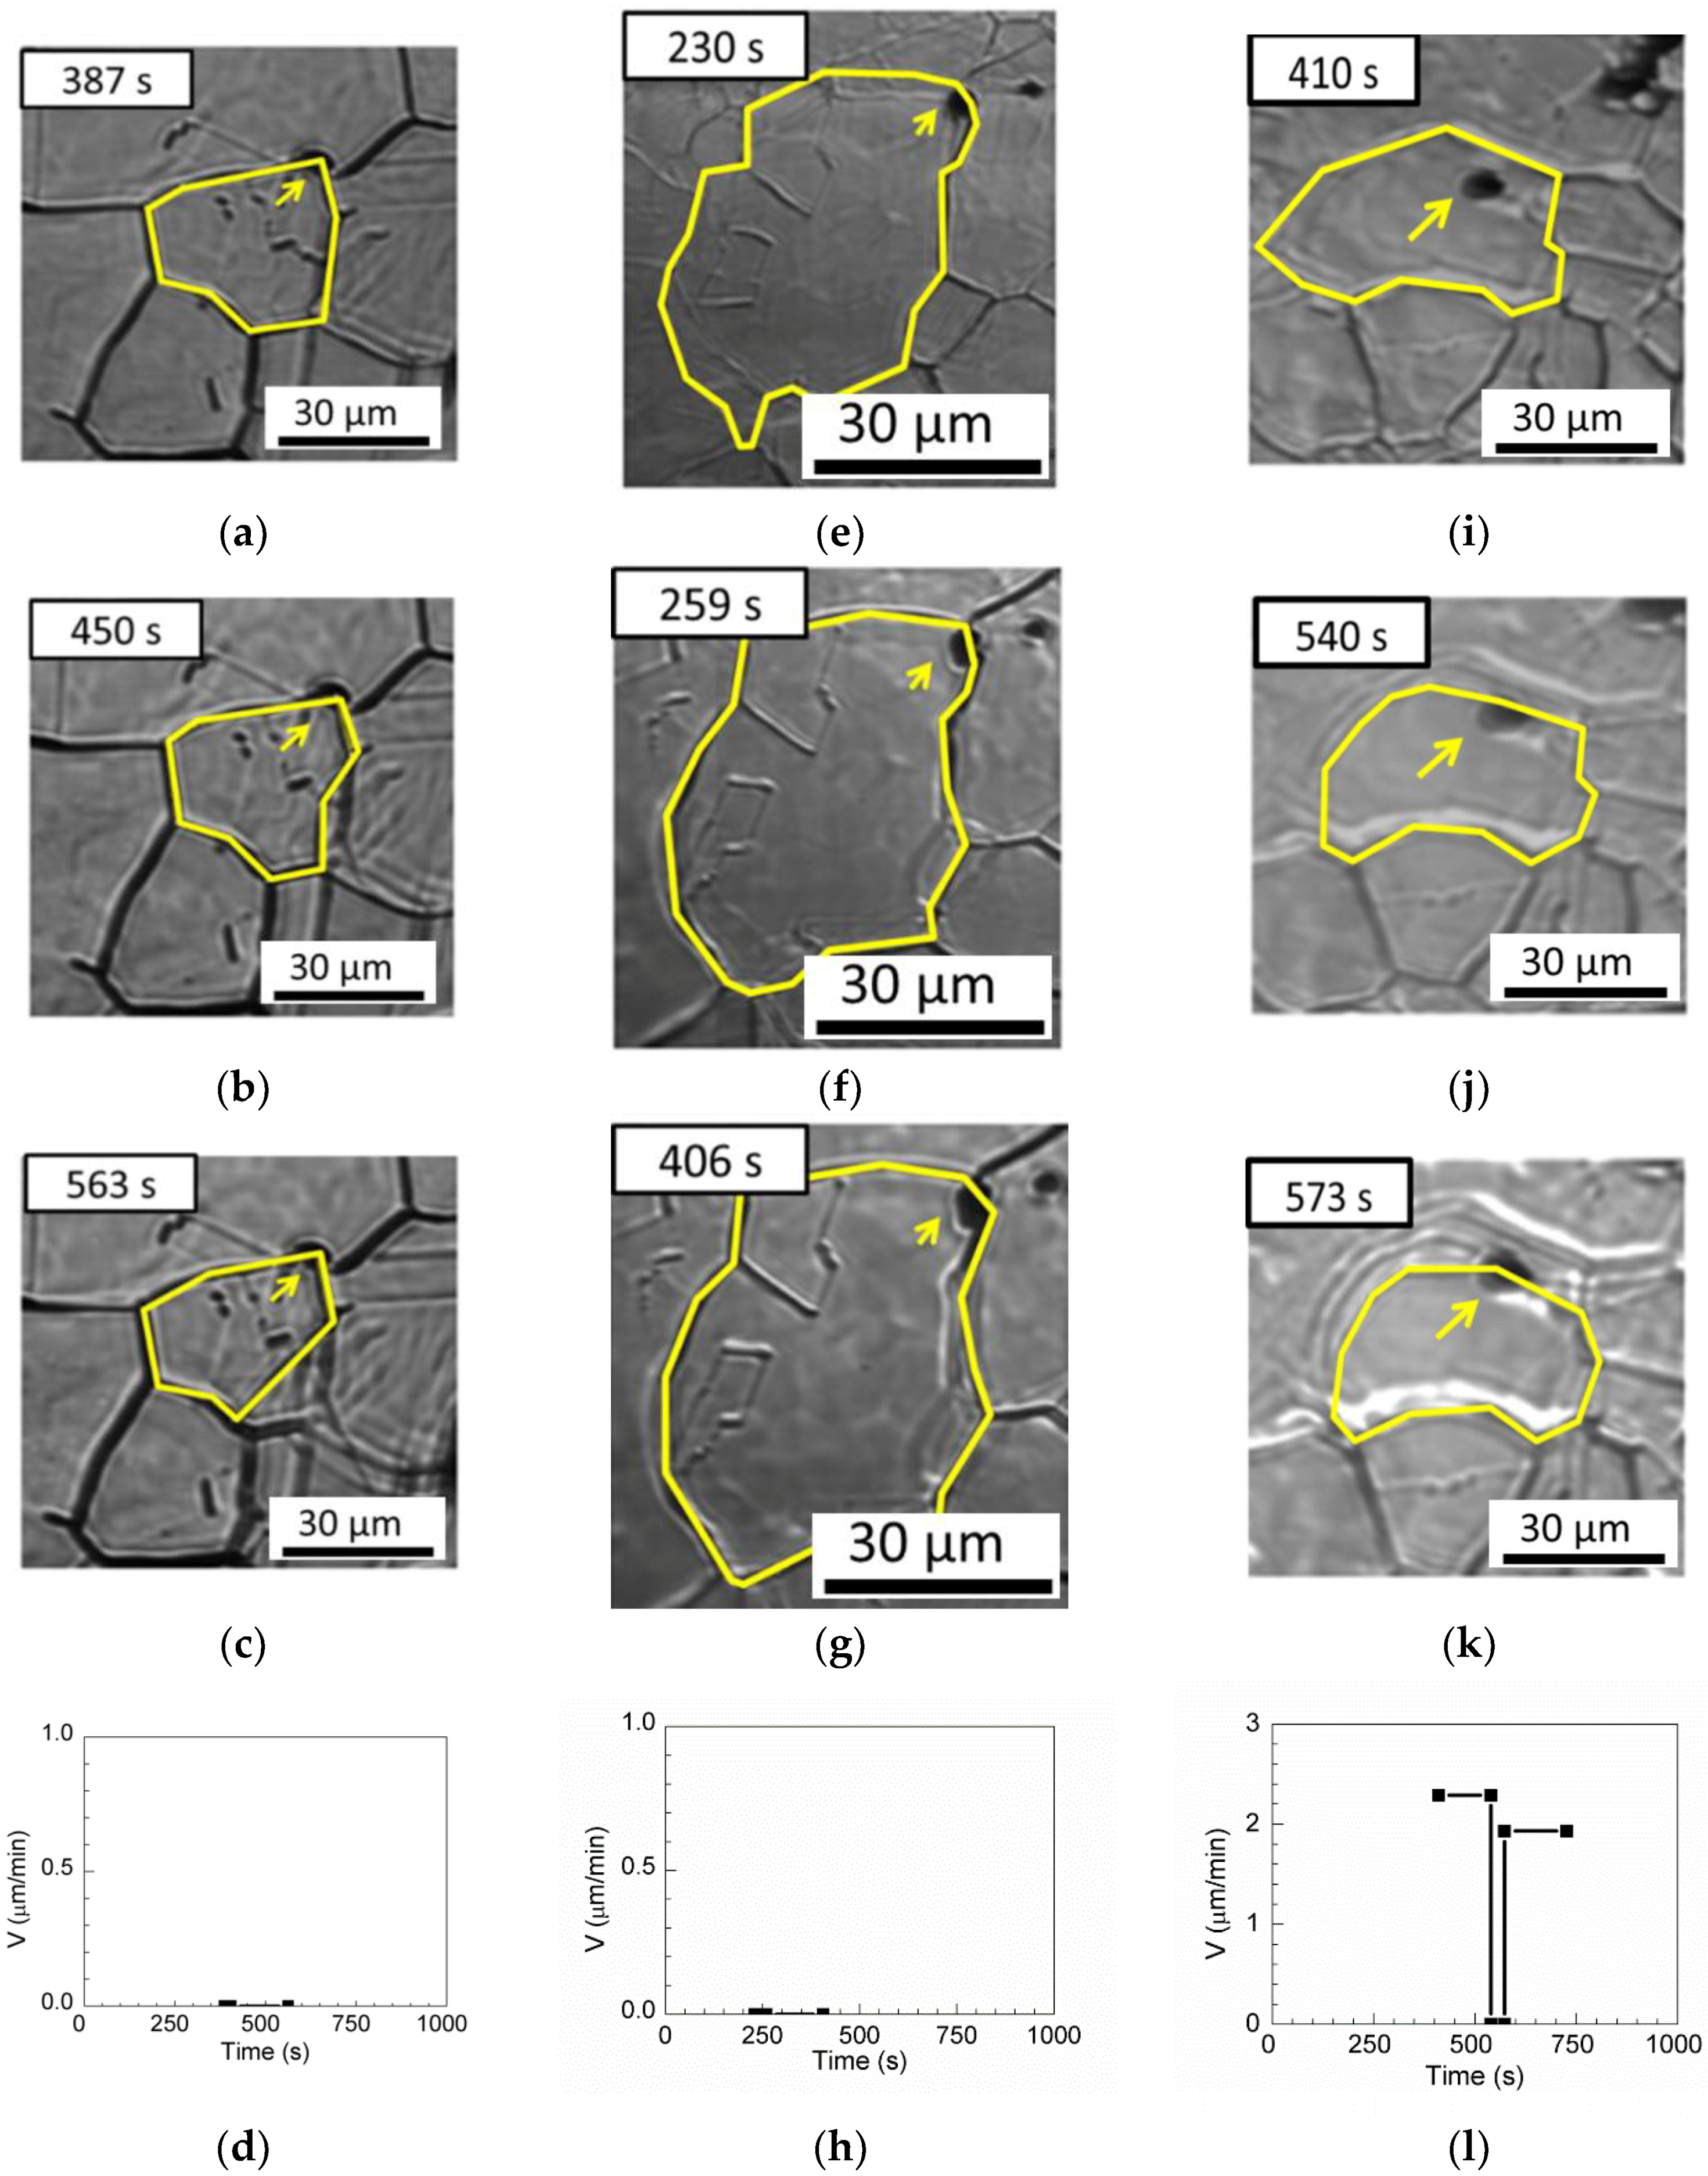
Figure 15a shows the pinning grain boundary. At annealing times of less than 563 s, the inclusions retard the boundary, as shown in
Figure 15b,c, and the boundary velocity is 0 µm/min in
Figure 15d.
Figure 15e shows the triple junction pinned by inclusions. When the annealing time is increased to 406 s, the triple point of the grain boundaries remains pinned by inclusions, as shown in
Figure 15f,g, and the boundary velocity is 0 µm/min, as shown in
Figure 15h.
Figure 15i–k illustrate the passing-through grain boundary. First, the boundary without inclusions migrates freely, and the boundary velocity is 2.29 µm/min at annealing times of less than 410 s. Next, the austenite grain boundary is retarded by inclusions at annealing times between 540 to 573 s. After annealing for 573 s, the boundary moves with a boundary velocity of 1.93 µm/min and passes through the inclusion, as shown in
Figure 15l.
One pinning grain boundary, one pinning triple point, and one passing-through grain boundary are observed for MgO
Al
2O
3–MnS (
Table 3). The grain boundary is pinned by MgO
Al
2O
3–MnS inclusions, as shown in
Figure 16a–c. Even when the annealing time increases to 592 s, inclusions continue to pin the boundary, and the boundary velocity is 0 µm/min, as shown in
Figure 16d.
Figure 16e shows a triple junction of grain boundaries retarded by inclusions. When the annealing time is increased to 641 s, the triple junction of the grain boundaries remains retarded by these inclusions, as shown in
Figure 16f–g, and the boundary velocity is 0 µm/min in
Figure 16h.
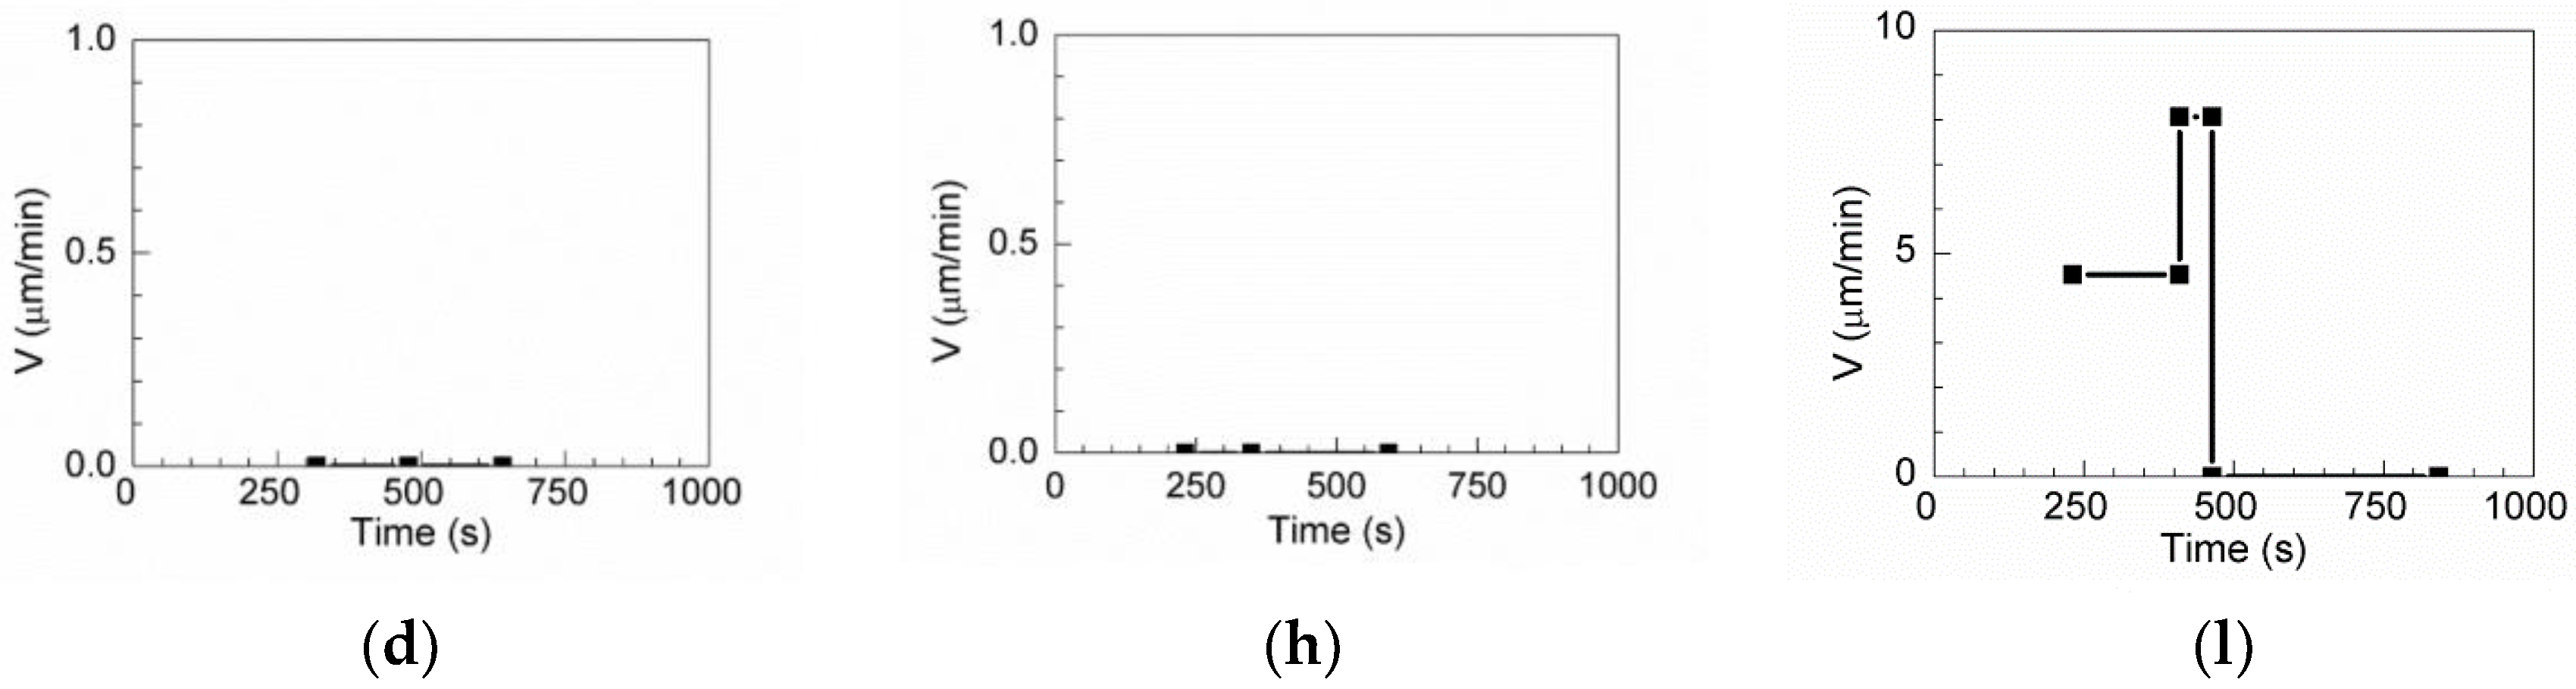
Figure 16i–k illustrate the process of the passing-through grain boundary. The boundary without inclusions could migrate freely with a boundary velocity of 4.53 μm/min annealing times of less than 231 s, as shown in
Figure 16i. At annealing times between 231 and 410 s, the boundary has a velocity of 8.06 μm/min and passes through the inclusion in
Figure 16j. When the annealing time exceeds 464 s, the boundary does not move (boundary velocity, 0 μm/min), as shown in
Figure 16l.
According to the results described above, the mobility of austenite grain boundaries can be calculated using Equation (4), together with the parameters measured from the HT-CSLM micrographs. However, in this work, we simply calculated two cases of the passing-through boundary and the passing-through triple junction.
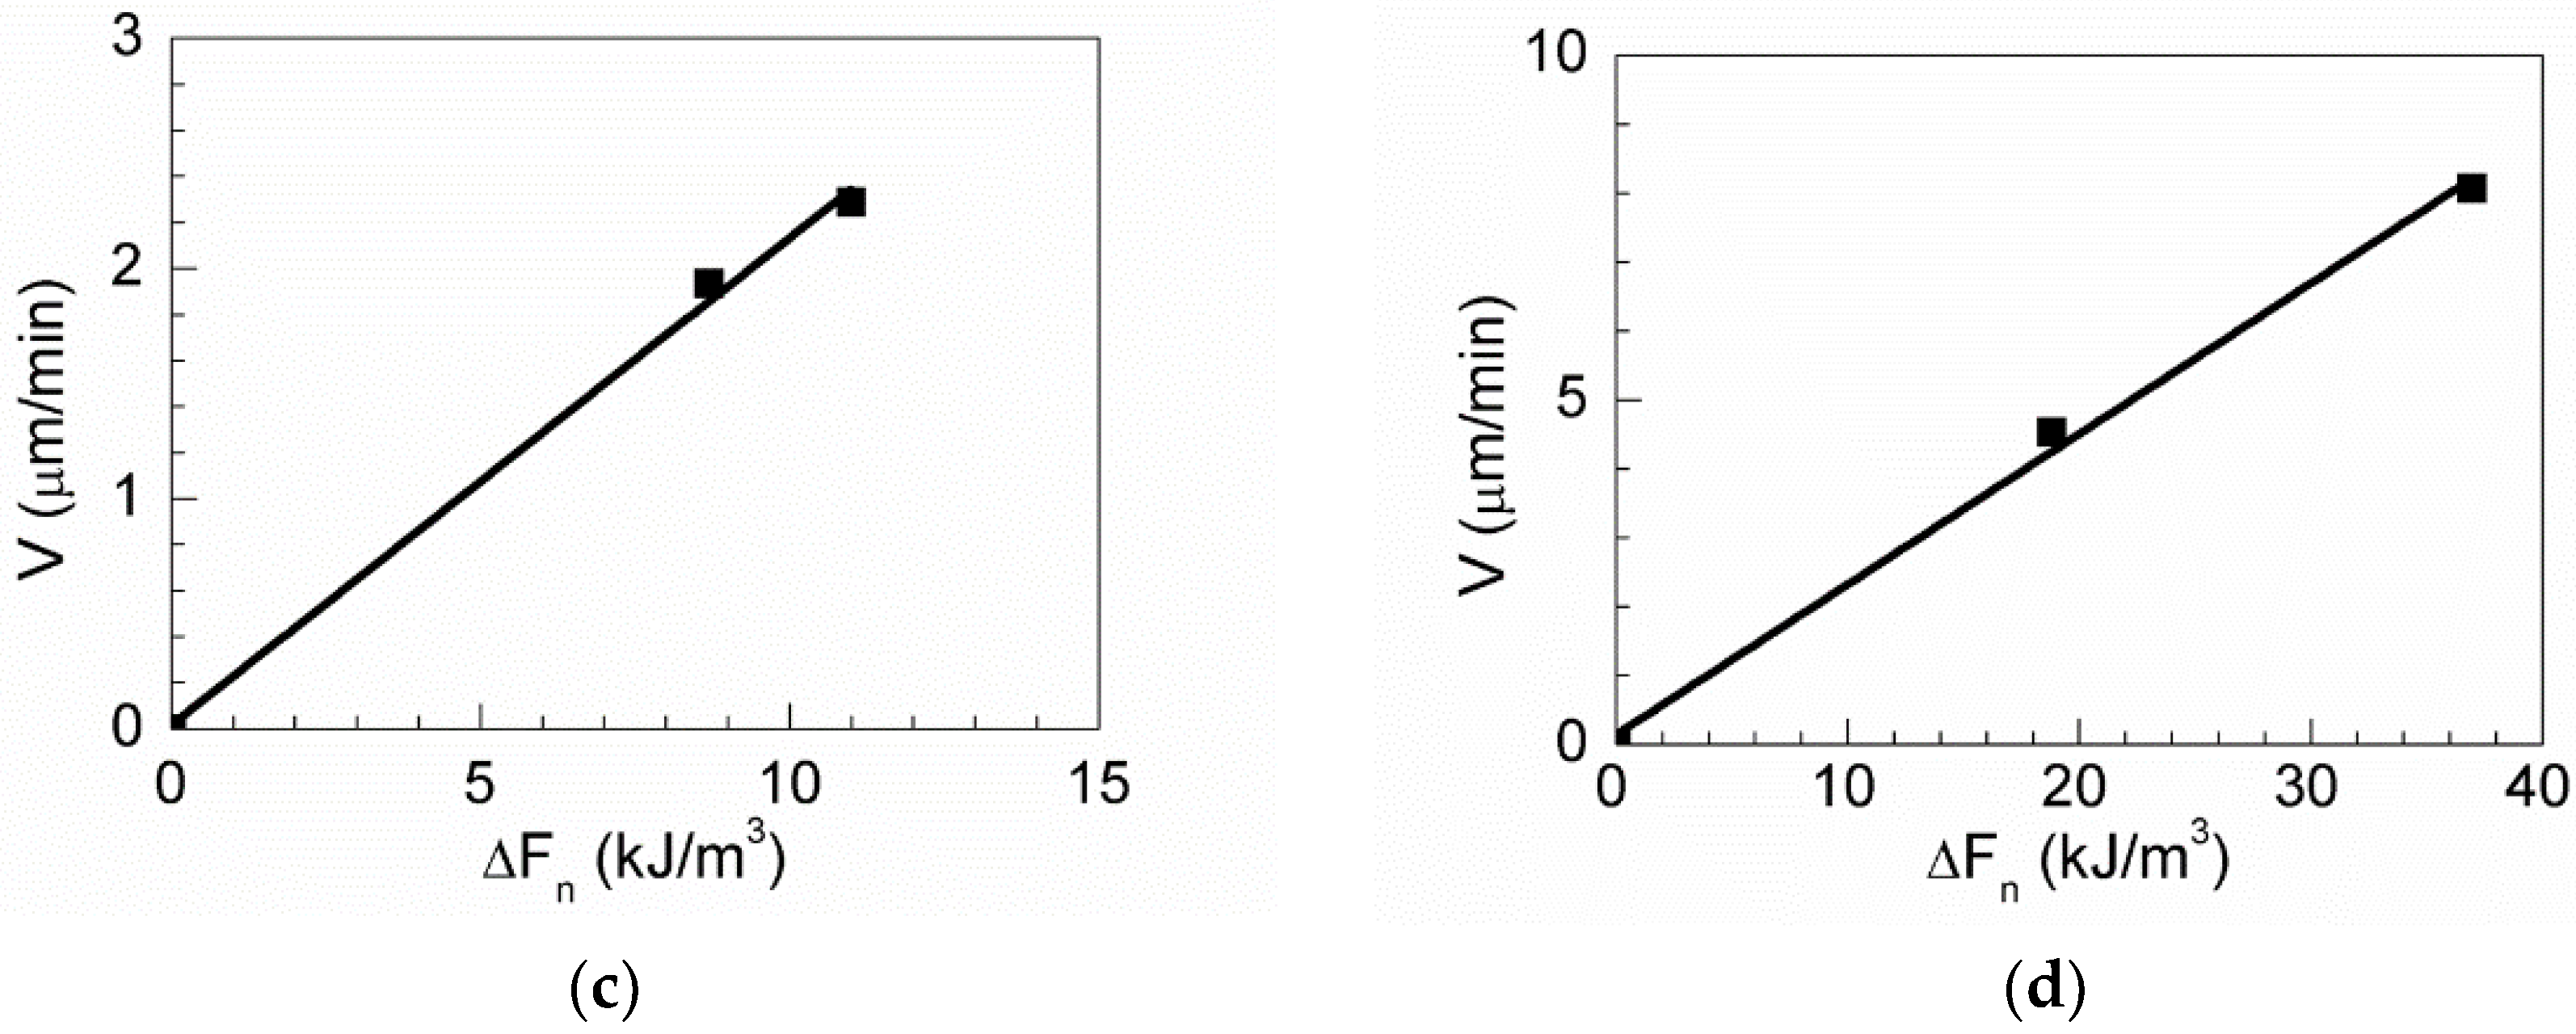
Figure 17 shows the boundary velocity in terms of the net force
for MgO, MnS, MgO-MnS, and MgO
Al
2O
3–MnS. The mobility of austenite grain boundaries was calculated using Equation (4) as the slope in
Figure 17. From Equation (4), when the grain boundary and triple point are pinned by an inclusion and the ∆
V of grain growth is 0 µm/min, the grain mobility is 0.
Table 4 lists all grain mobilities, boundary velocities, and ∆
F of the inclusions. The grain mobilities of MgO, MgO
Al
2O
3-MnS, and MgO–MnS were 0.05, 0.20, and 0.31, respectively. The average grain mobility of the MnS inclusion is 0.41 because this inclusion has four passing-through grain boundaries. Based on these results, Mg-based inclusions have lower grain mobility than MnS inclusions. From Equation (4), the degree of pinning effect gets higher with smaller value of grain mobility. Among the Mg-based inclusions, MgO inclusions showed the lowest grain mobility; in other words, MgO inclusions effectively retard austenite grain growth while MnS inclusions do not. It means that the MgO inclusions have the best pinning effect than other inclusions.


