Recovery in the Myogenic Program of Congenital Myotonic Dystrophy Myoblasts after Excision of the Expanded (CTG)n Repeat

 , , , and
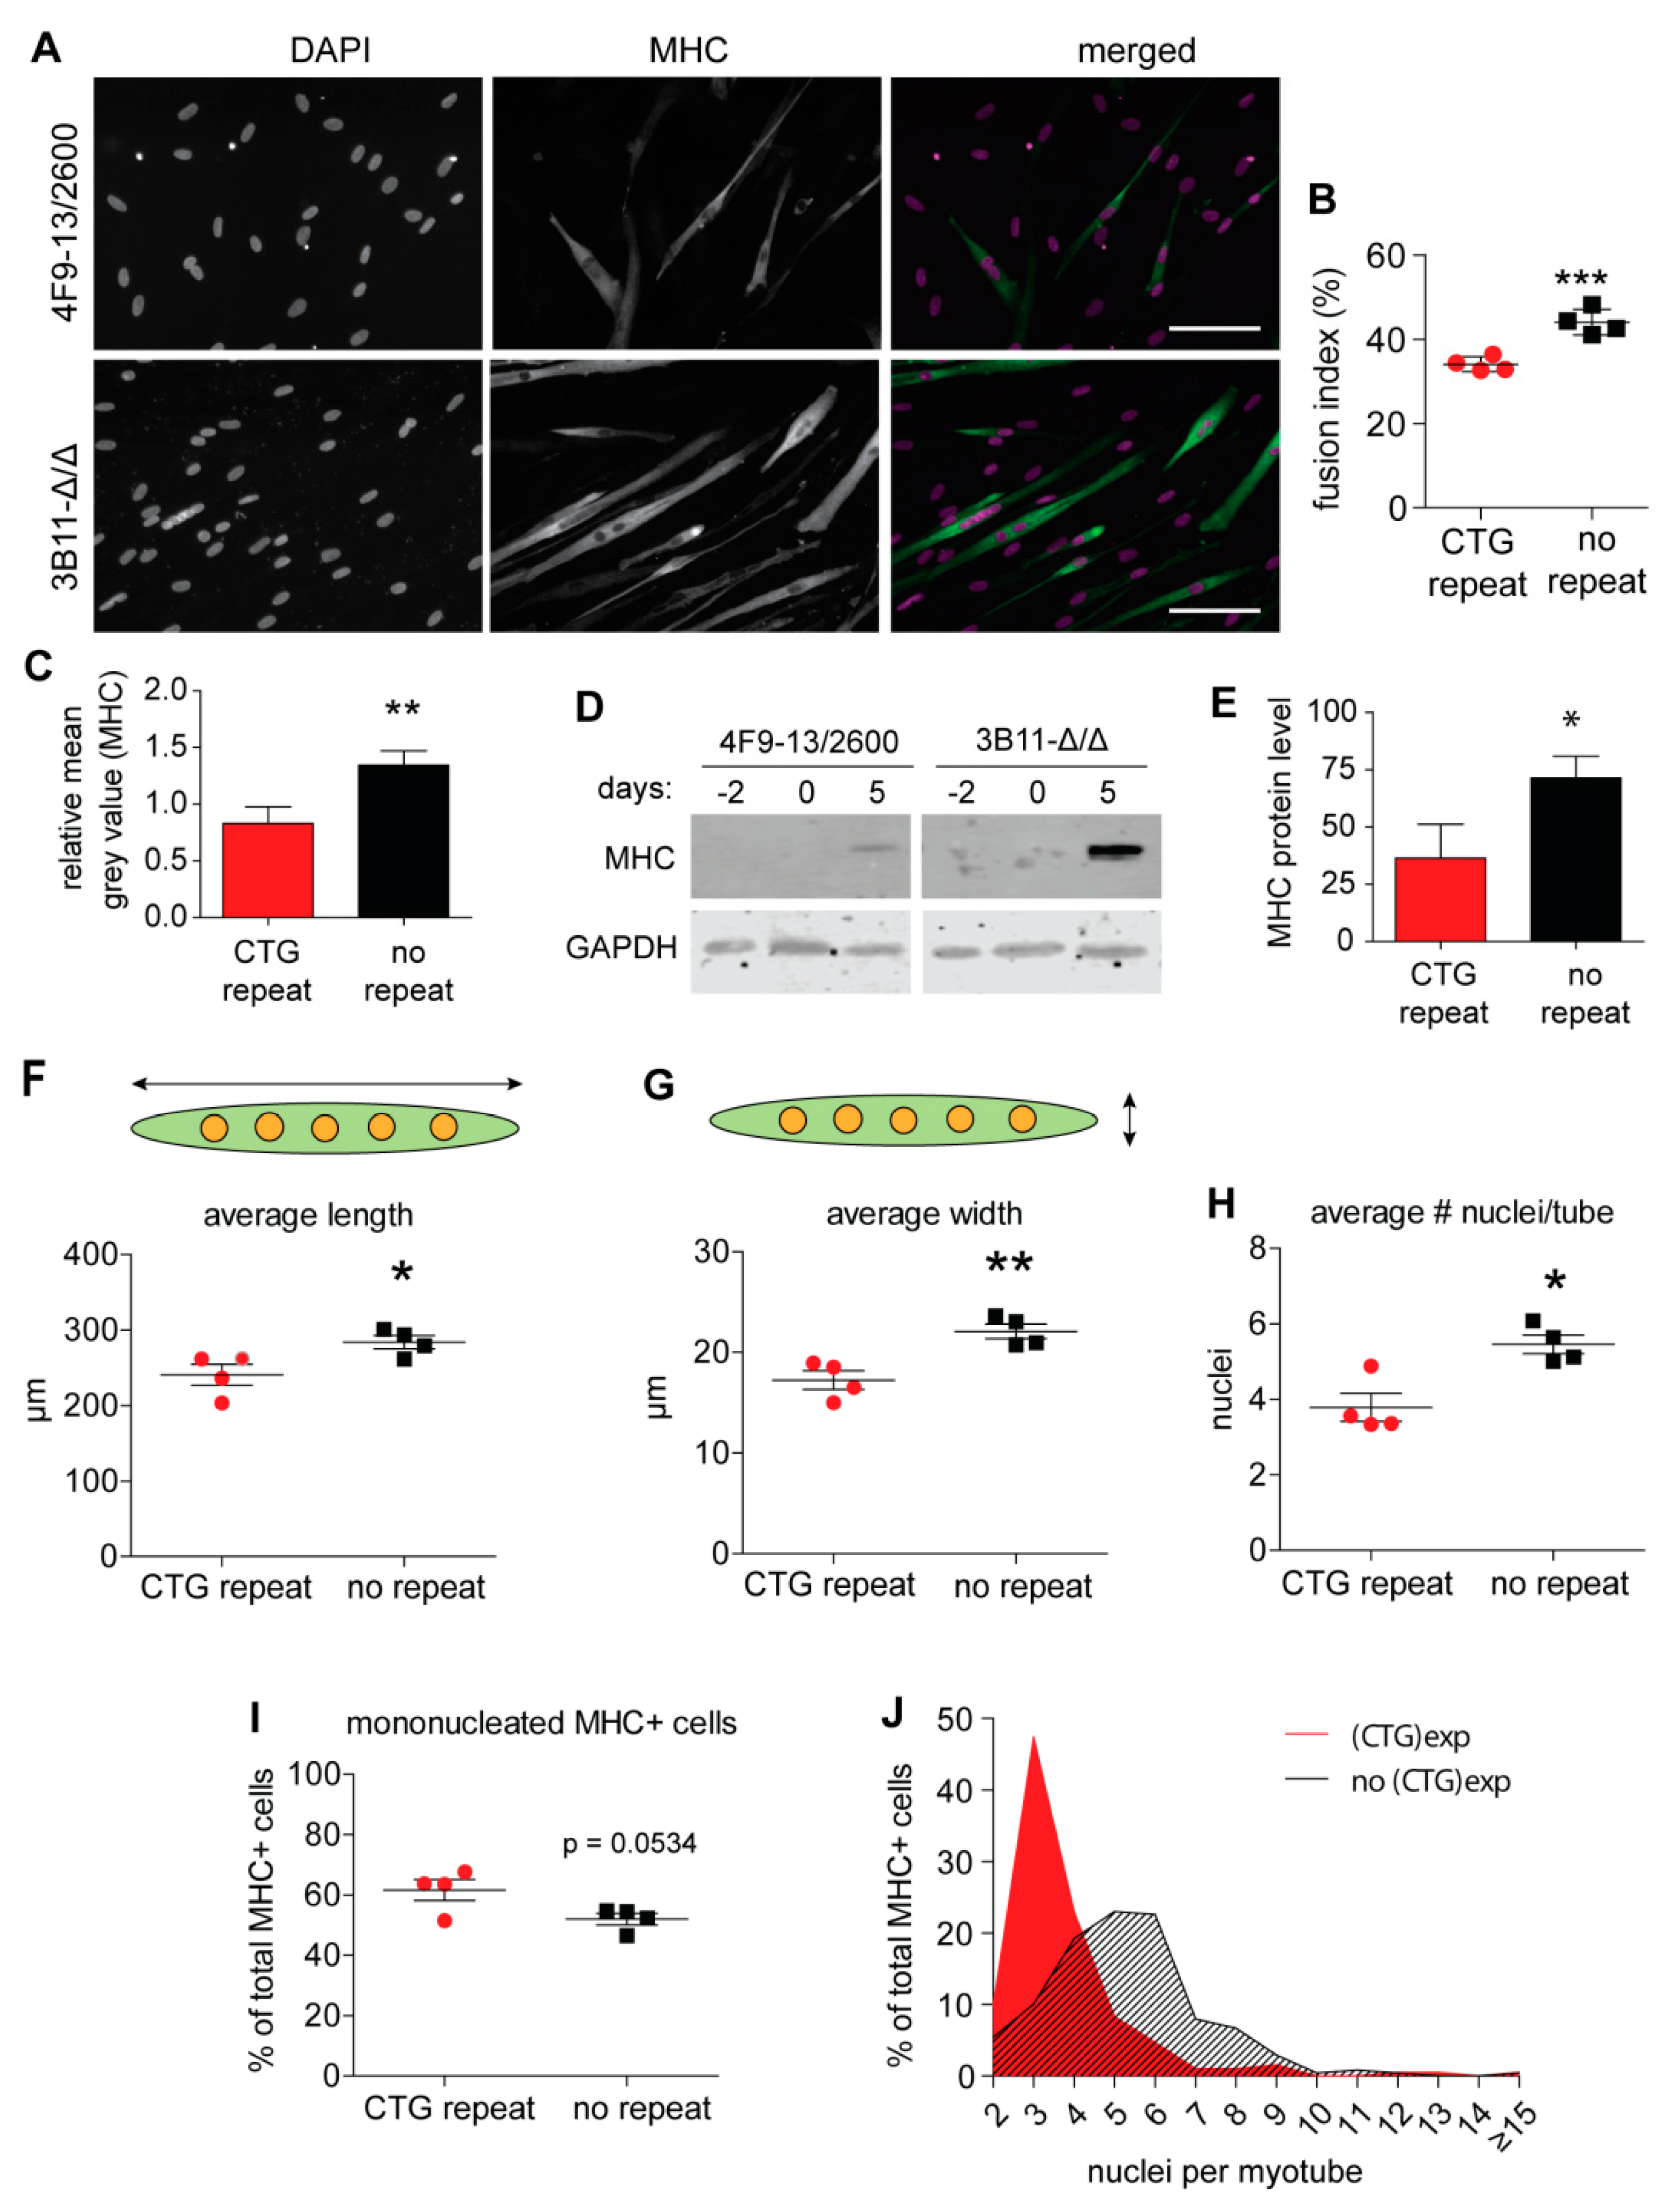
Abstract
:1. Introduction
2. Results
2.1. Isogenic cDM Myoblasts with and without an Expanded Repeat: Use as DM1 Cell Models
2.2. Myogenic Fusion Is Improved after (CTG)2600 Repeat Excision
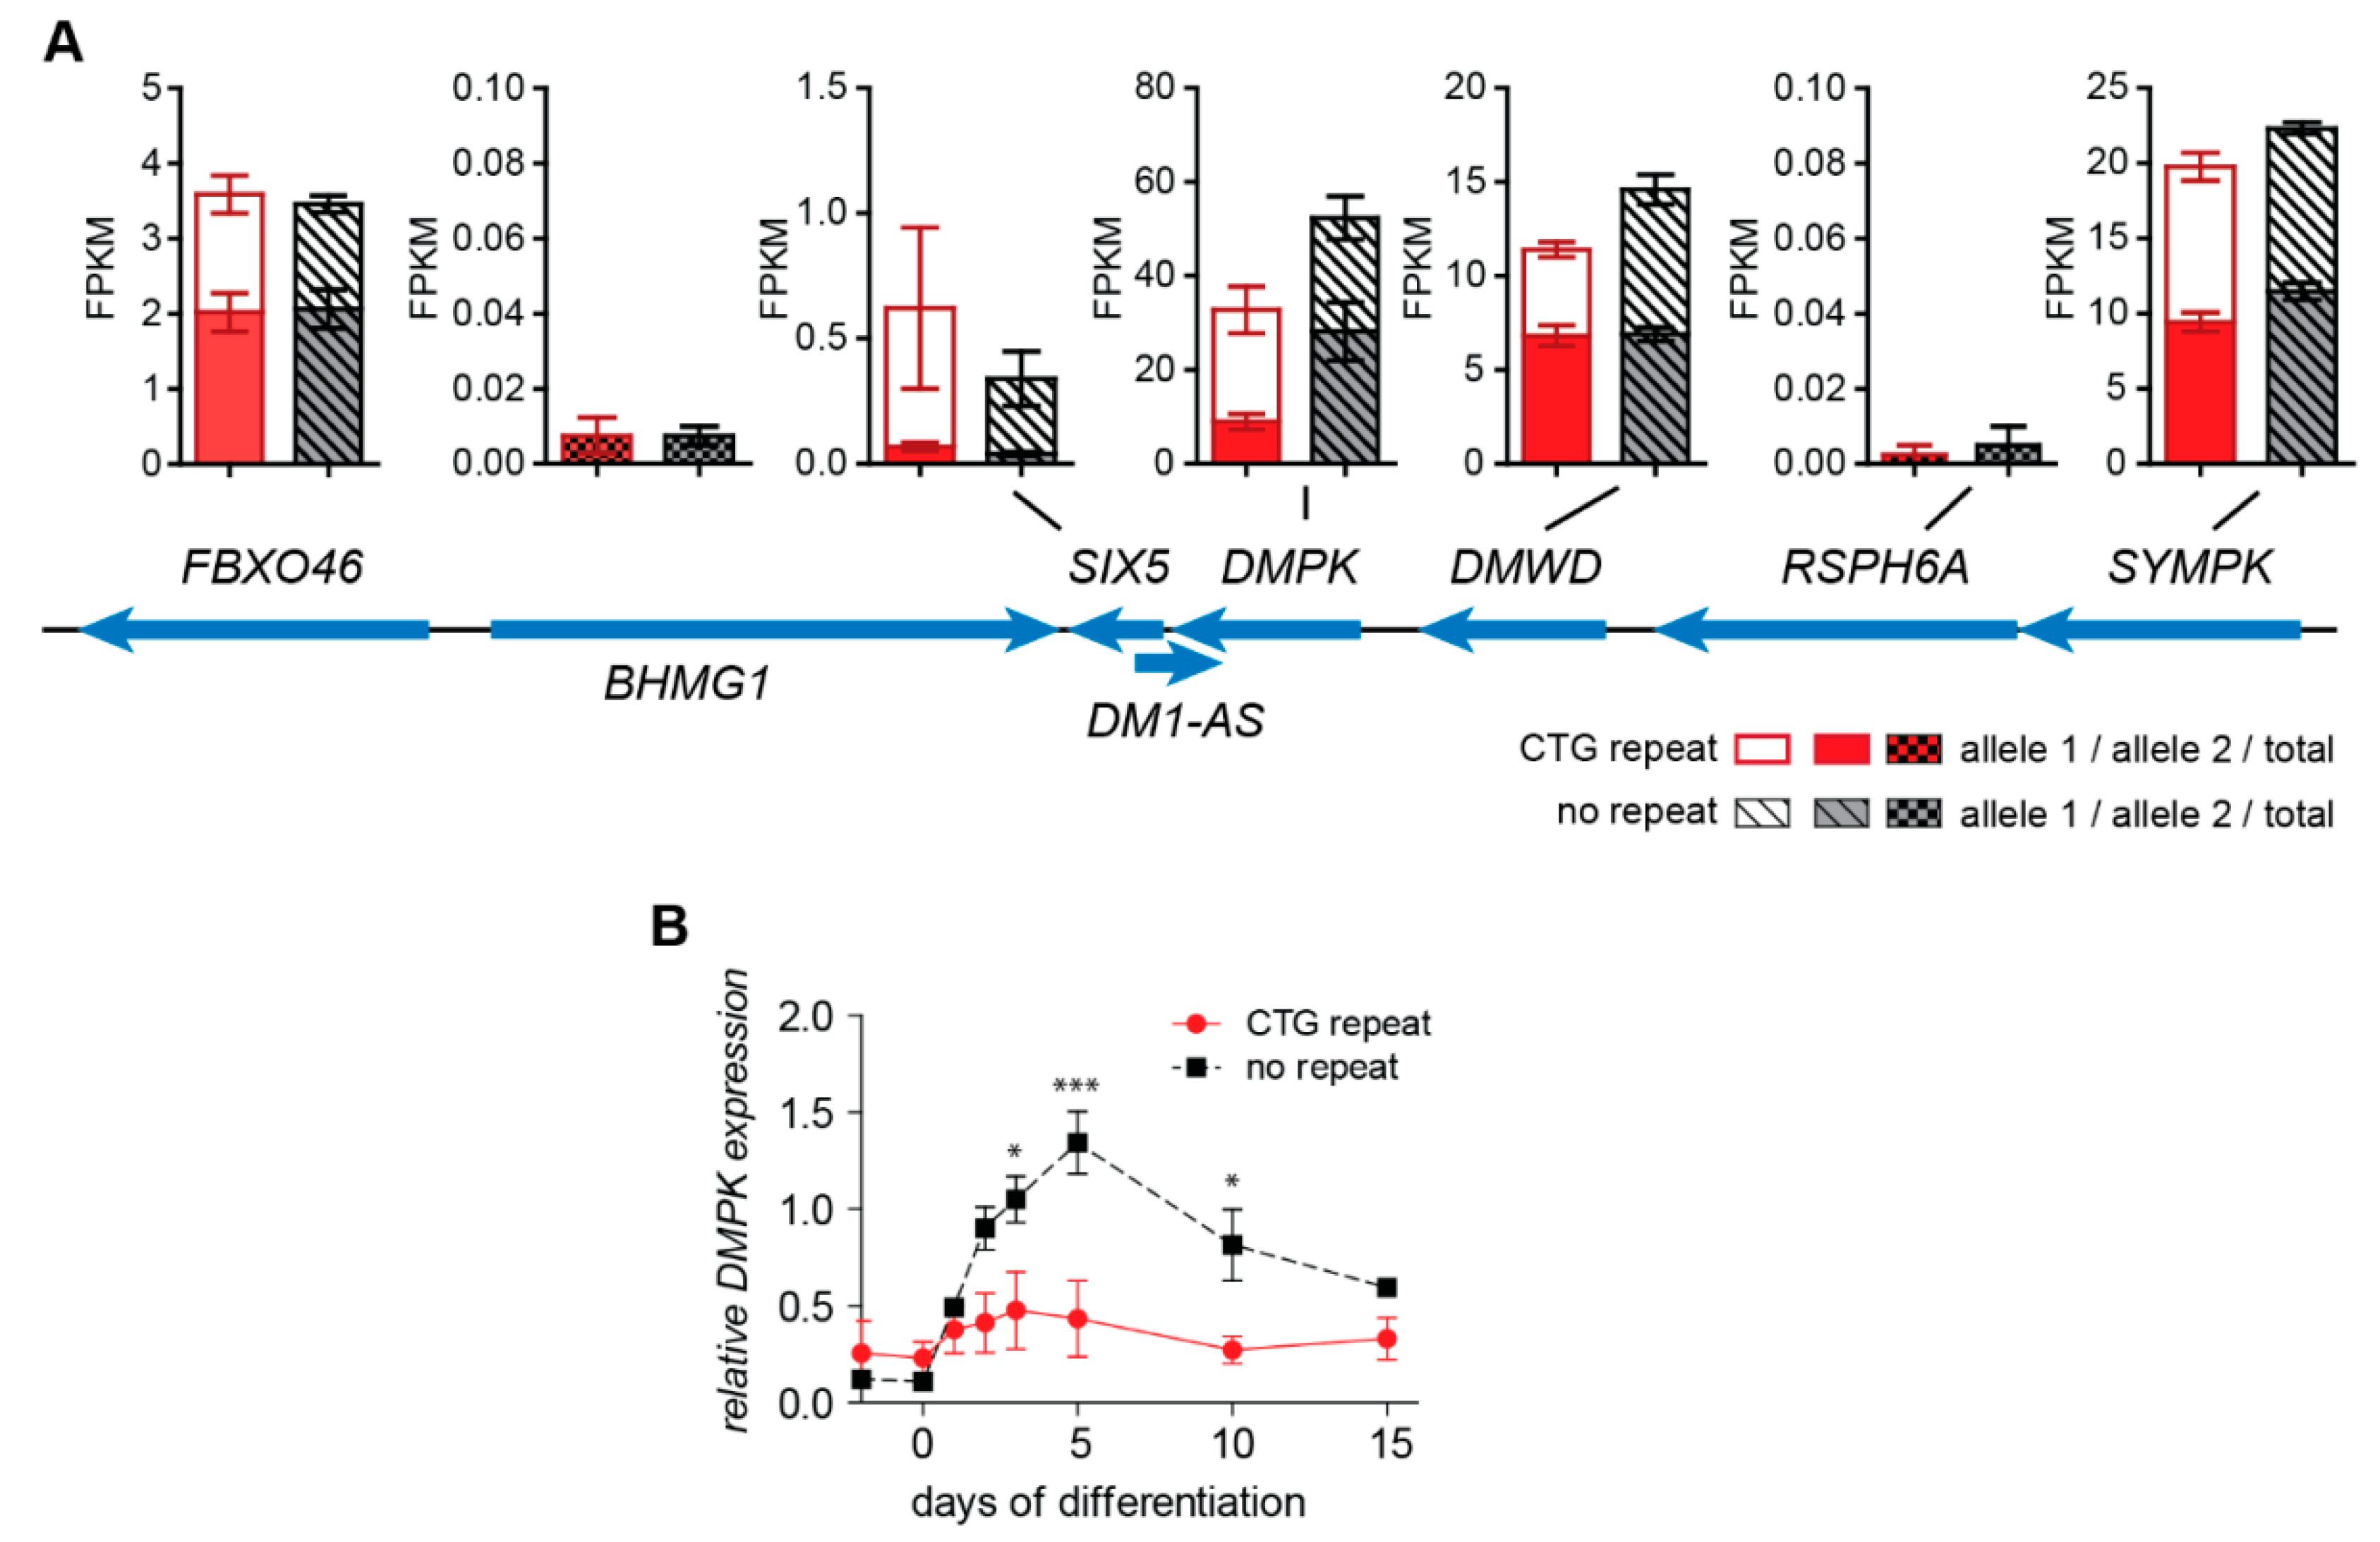
2.3. No Change in Chromatin Status and Associated Transcriptional Activity of DM1 Locus Genes upon (CTG)2600 Repeat Excision in Myoblasts
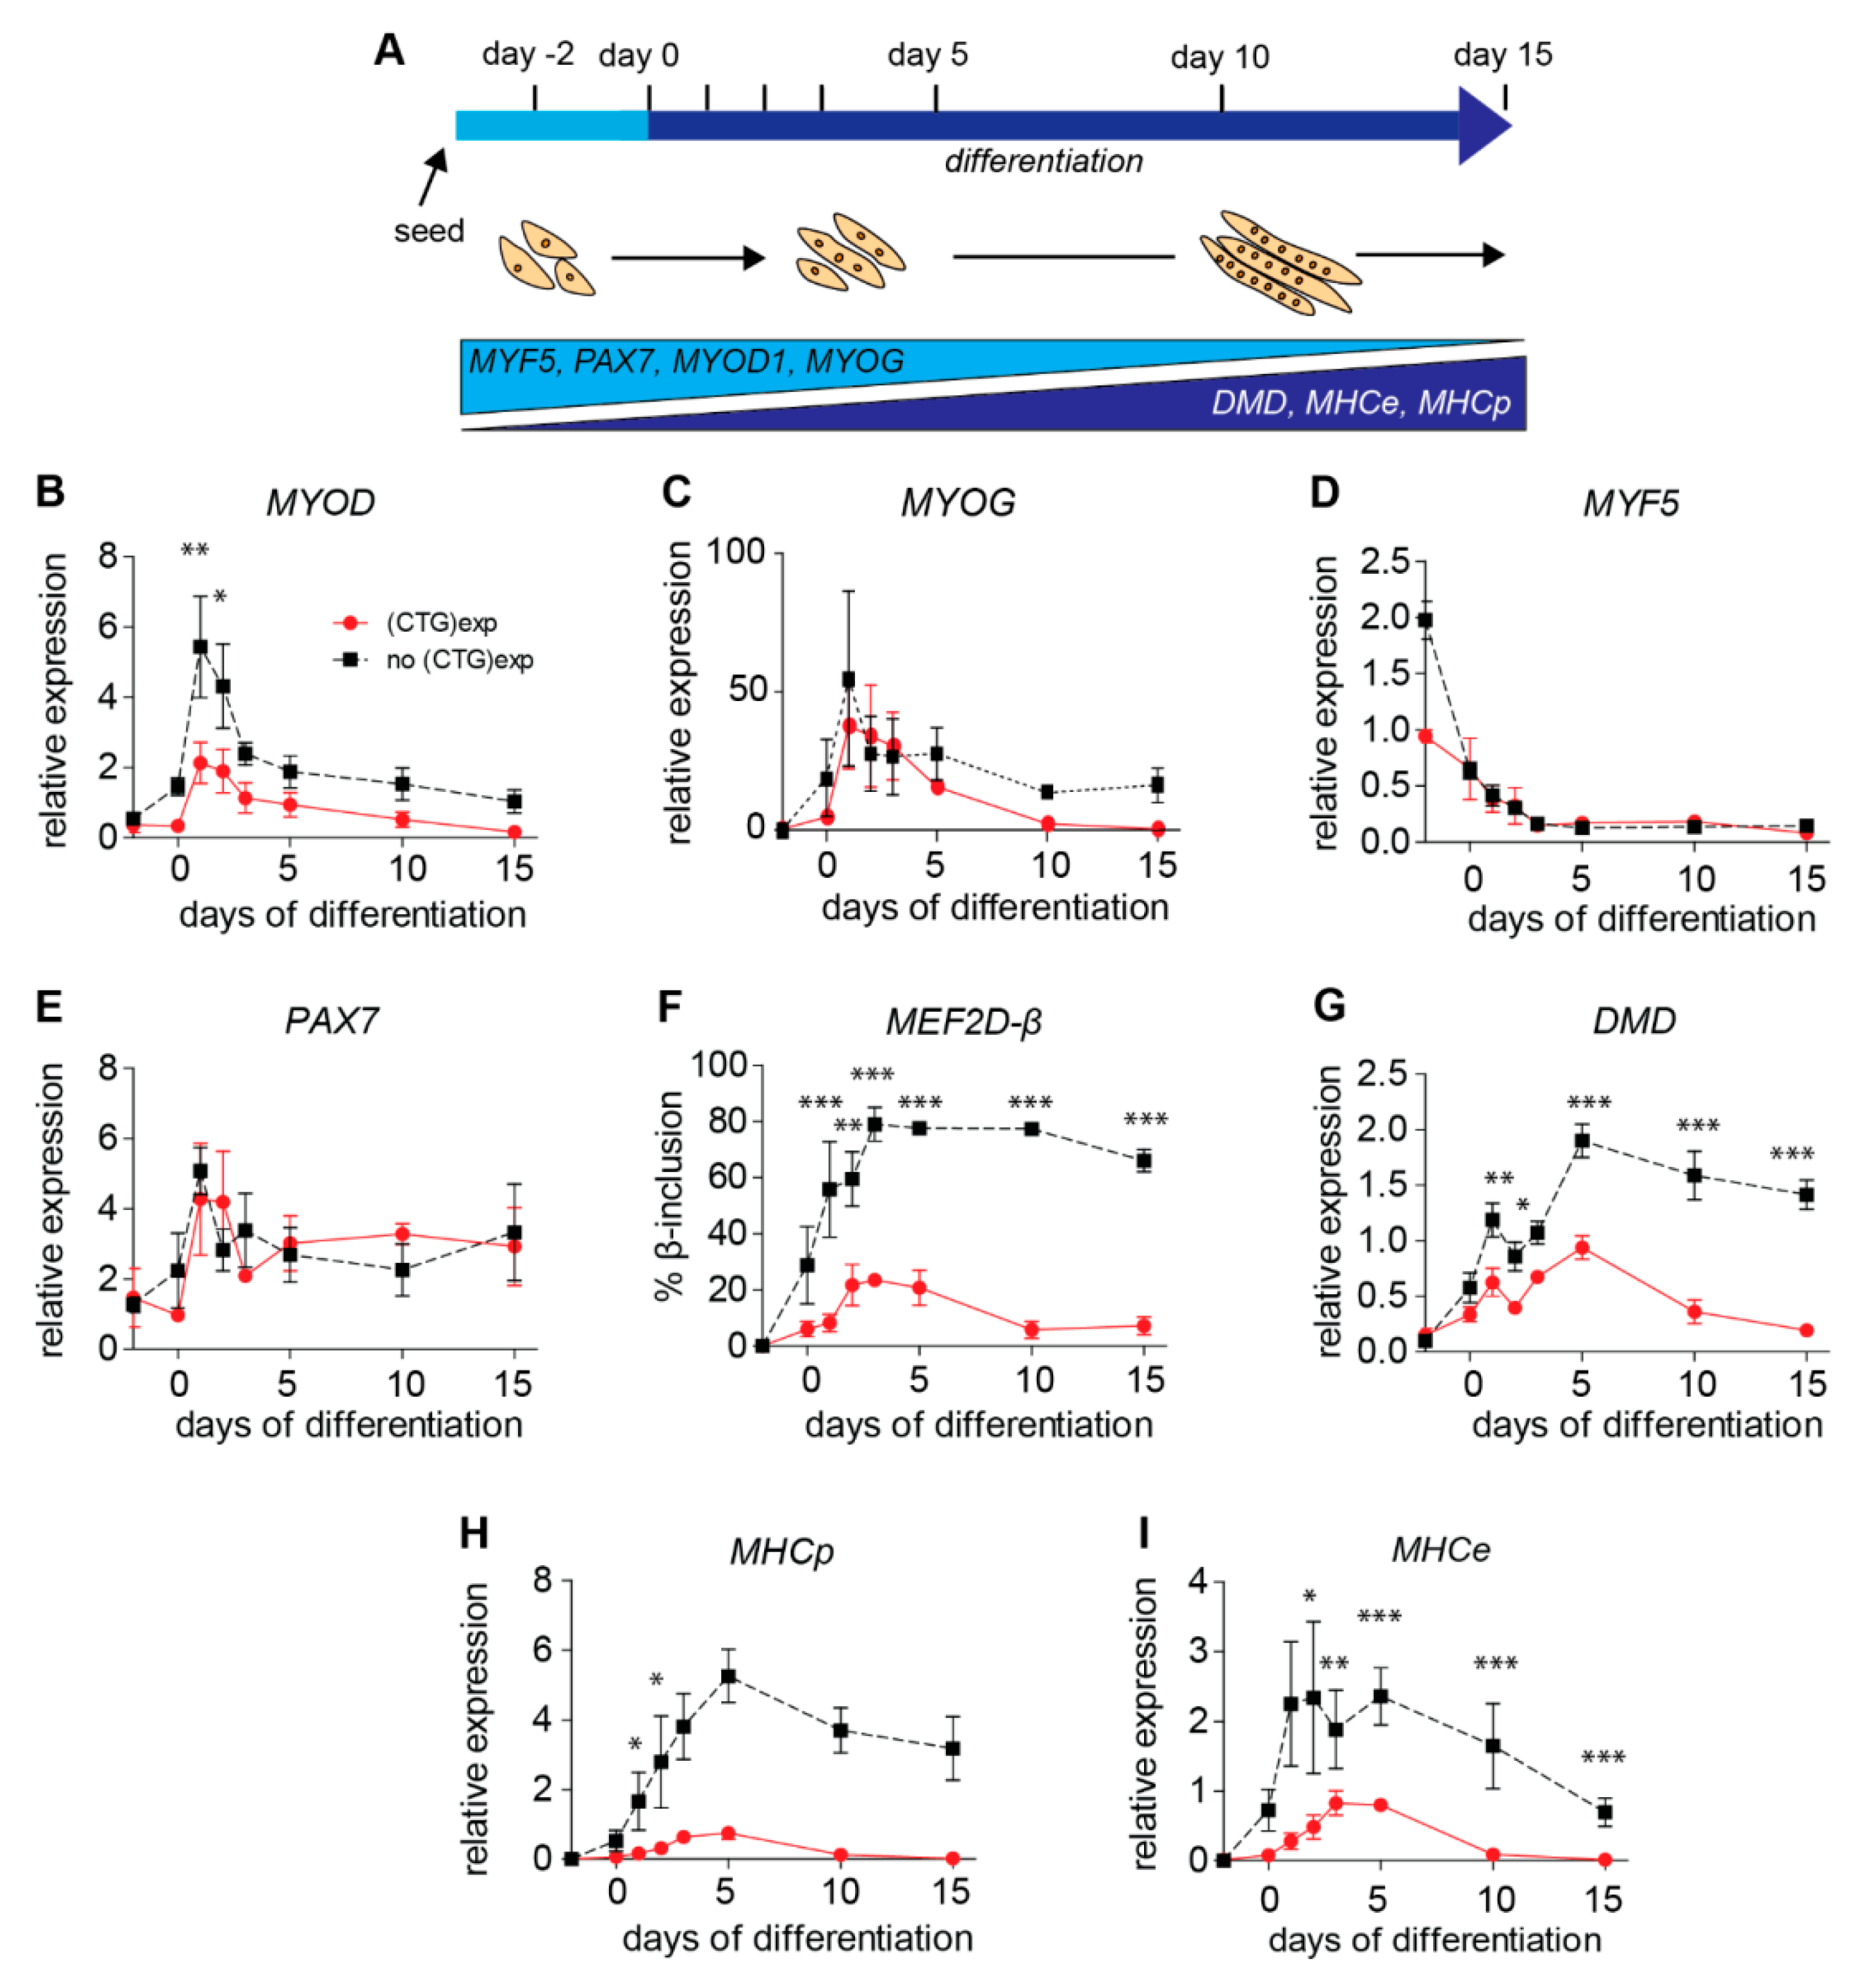
2.4. (CTG)2600-Repeat Effects on the Expression of Myogenic Transcription Factors
2.5. Levels of Archetypal Markers of Myogenic Progression Increase after Repeat Excision
2.6. (CTG)2600-Repeat Effects on the Expression of DM1 Relevant Splice Factors
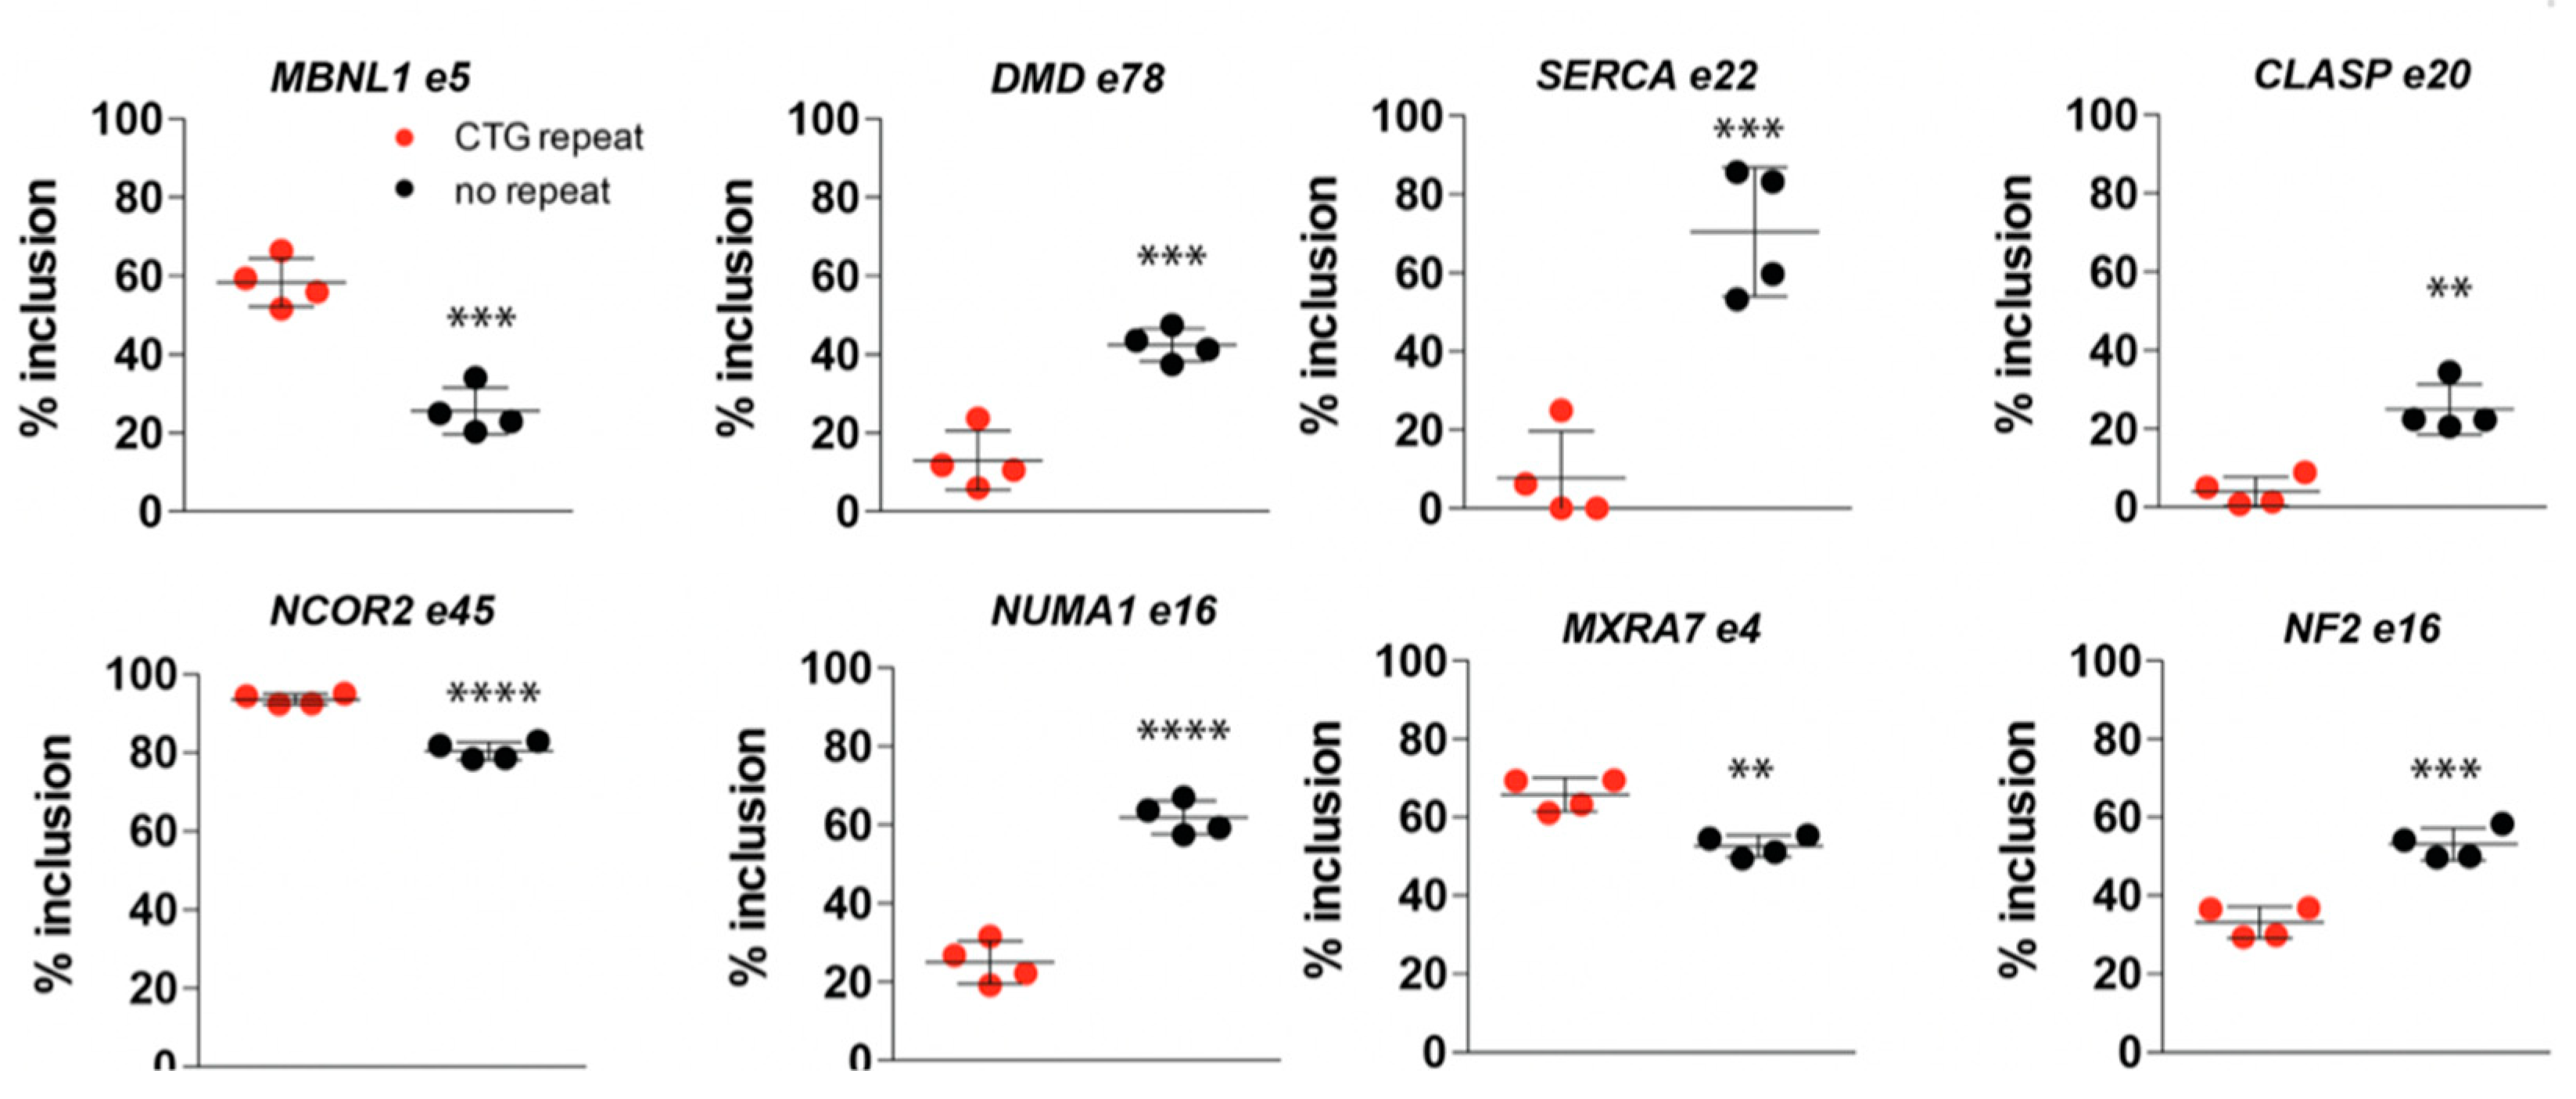
2.7. (CTG)2600-Repeat Removal Restores DM1-Typical Alternative Splicing Abnormalities Early in Myogenic Progression
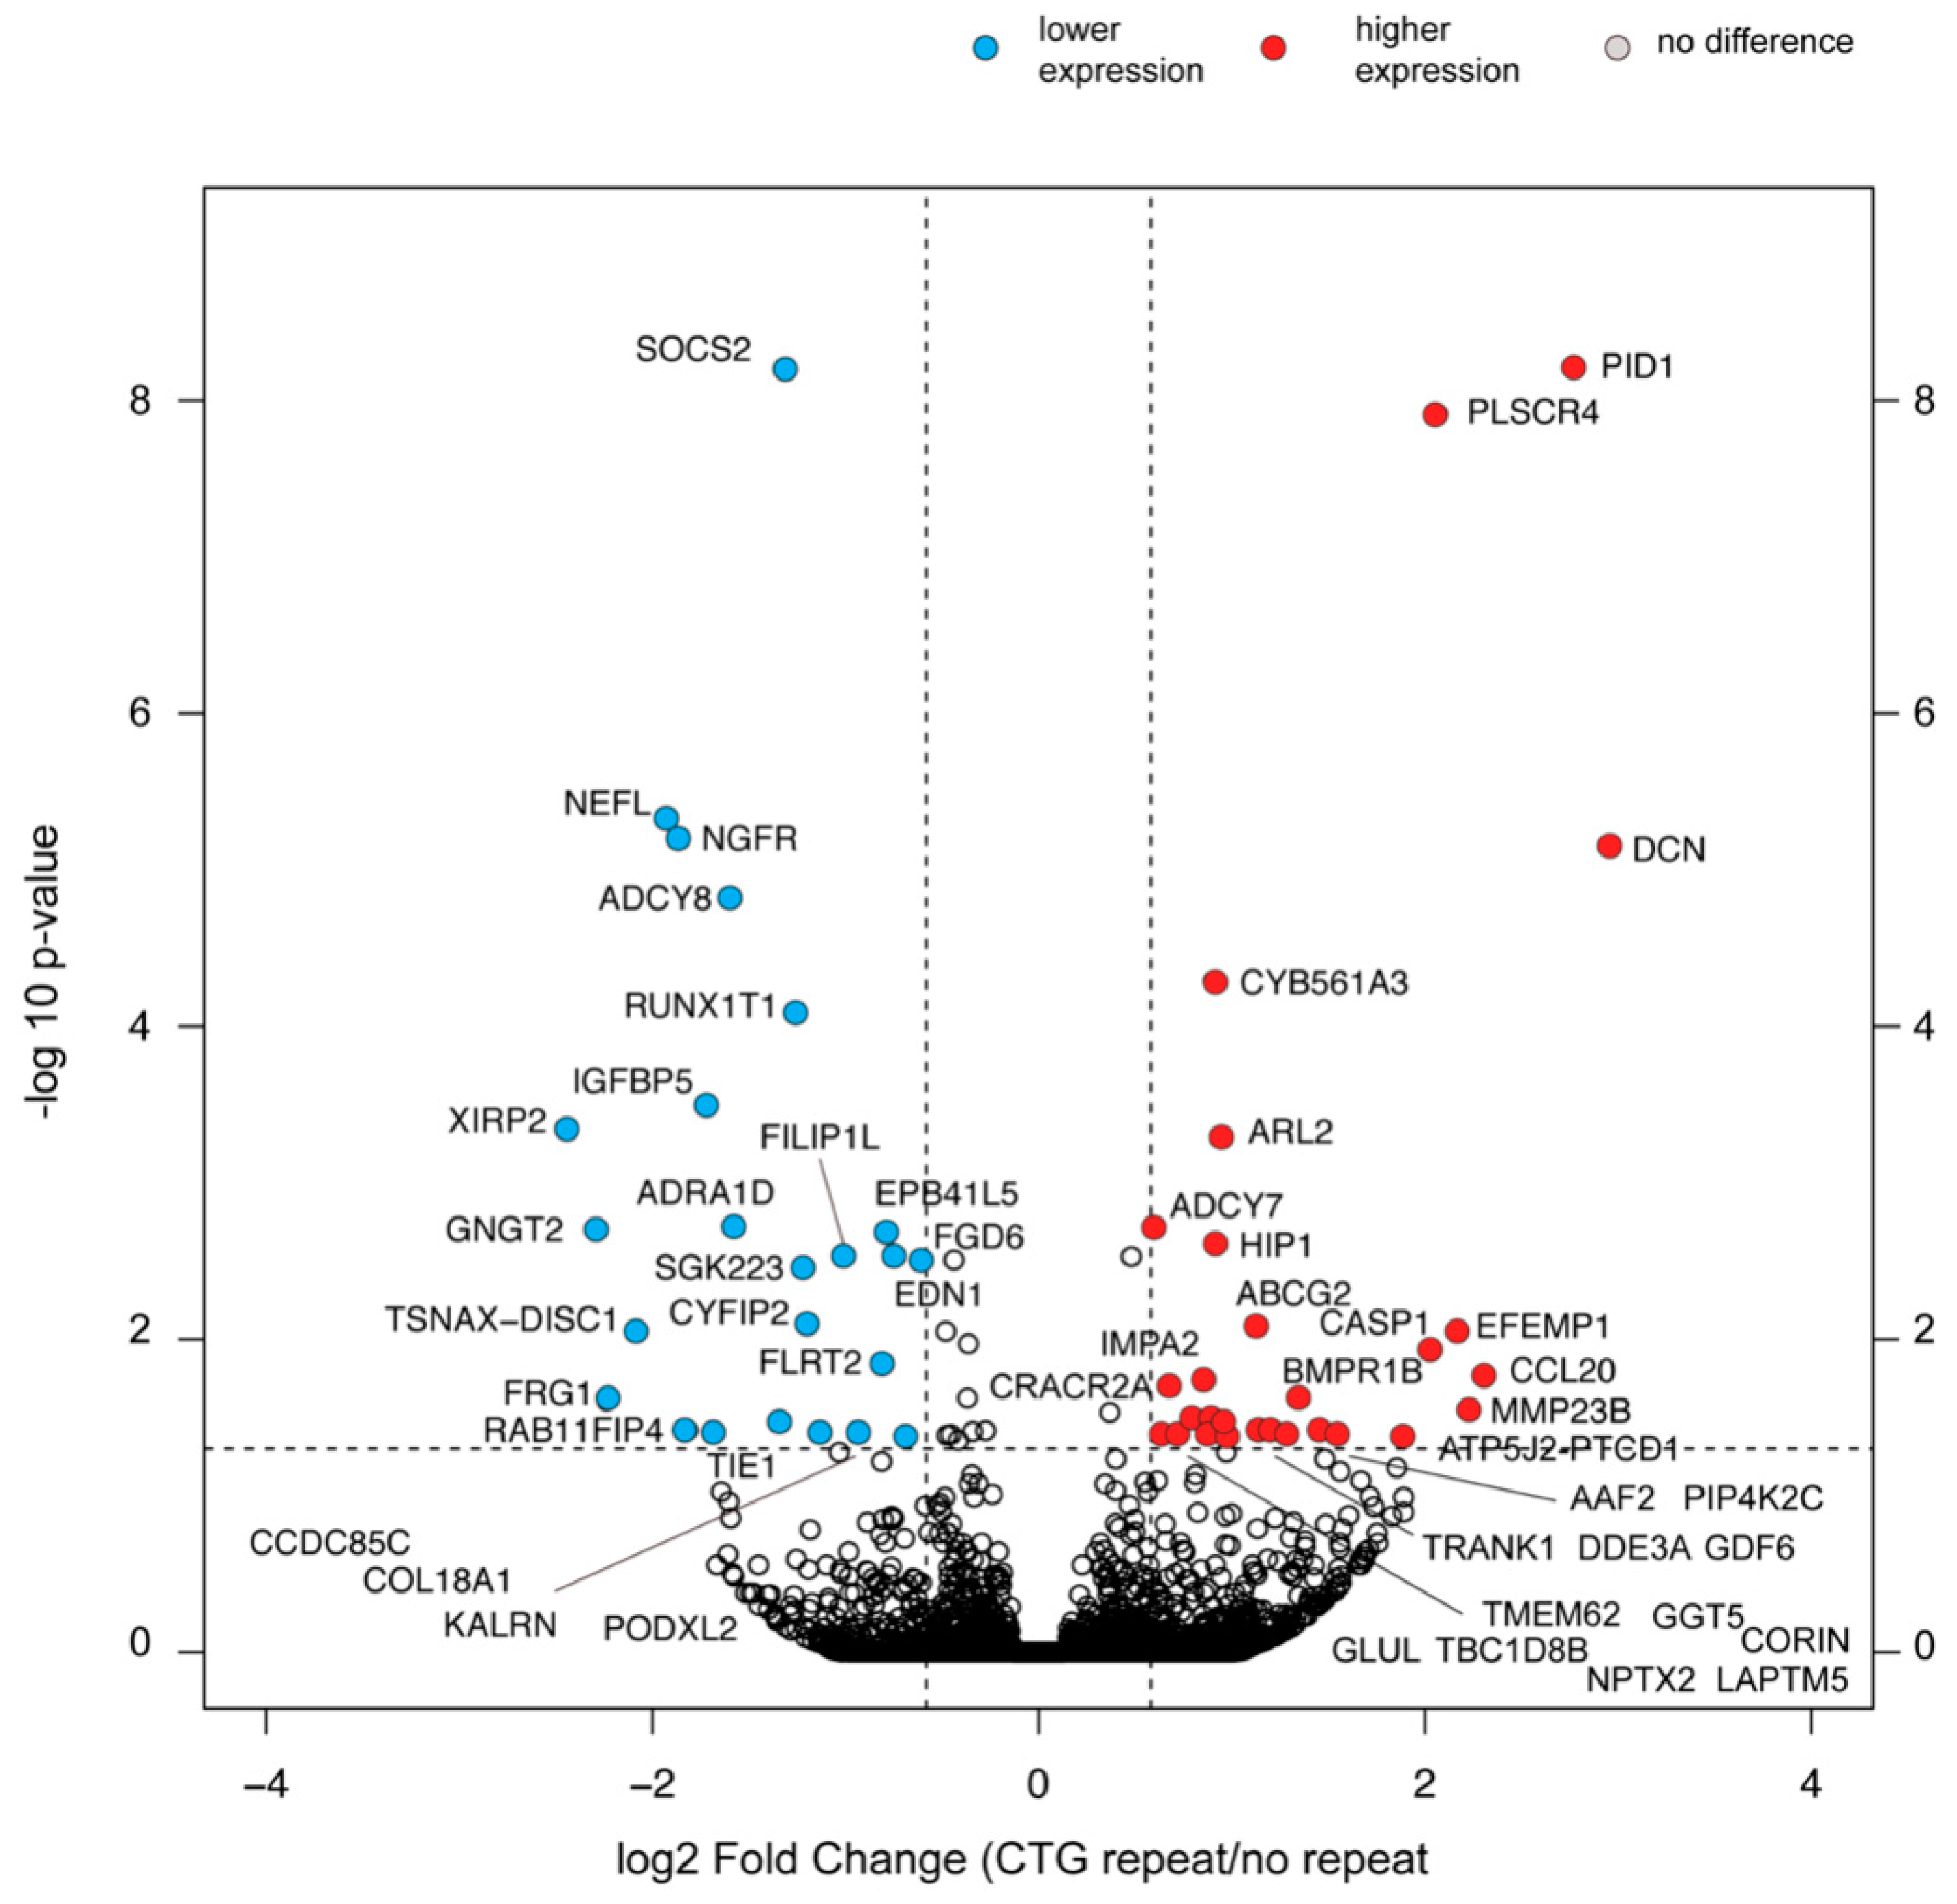
2.8. Selective Changes in the Transcriptome Composition of Myoblasts with the (CTG)2600 Repeat
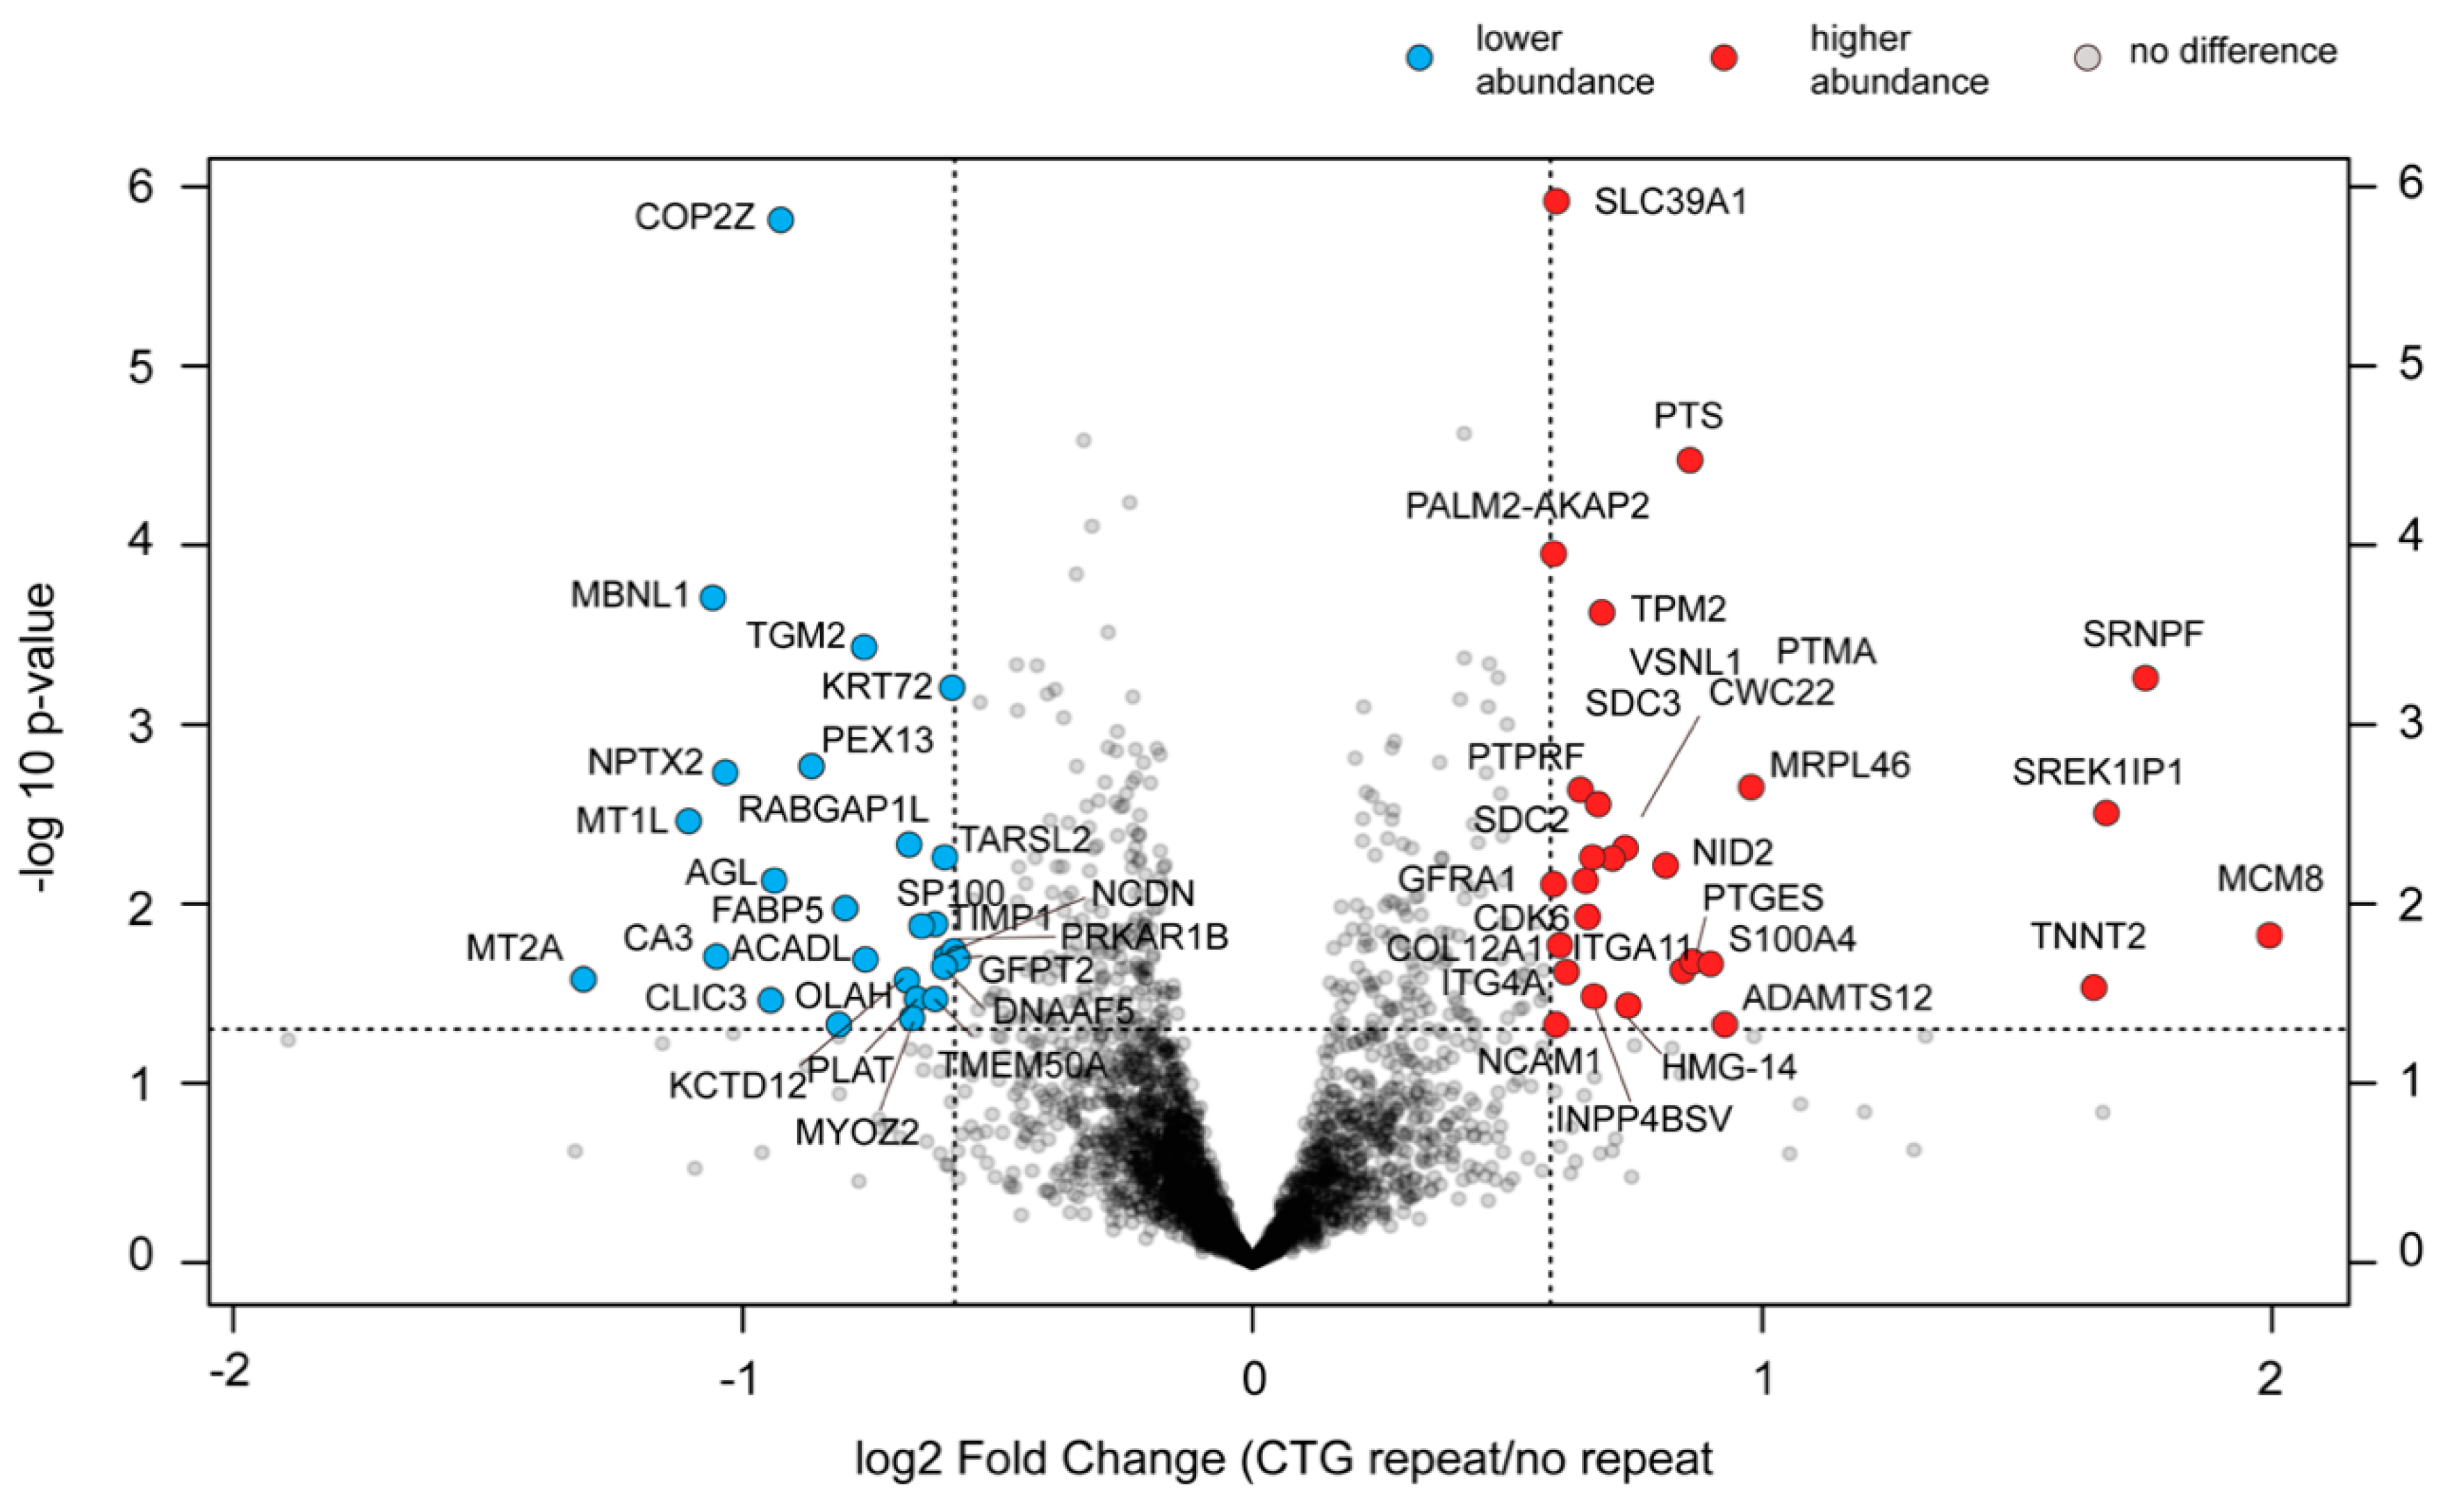
2.9. Changes in the Proteome of cDM Myoblasts after (CTG)2600 Repeat Excision Are Limited and Show Little Congruence with Transcriptome Alterations
3. Discussion
4. Materials and Methods
4.1. Cell Culture
4.2. EdU and Ki-67 Proliferation Assays
4.3. RNA Isolation and RT-qPCR
4.4. Validation of Alternative Splicing by RT-PCR
4.5. Myogenic Fusion Index Determination and Myotube Characterization
4.6. RNA Fluorescence In Situ Hybridization (FISH) and Image Analysis of RNP Foci
4.7. Protein Extraction and Western Blotting
4.8. RNA-Sequencing
4.9. Protein Preparation, Mass Spectrometry, and Data Analysis
4.10. Statistical Analysis
Supplementary Materials
Author Contributions
Funding
Acknowledgments
Conflicts of Interest
References
- Bentzinger, C.F.; Wang, Y.X.; Rudnicki, M.A.; Bentzinger, C.F.; Wang, Y.X.; Rudnicki, M.A. Building muscle: Molecular regulation of myogenesis. Cold Spring Harb. Perspect. Biol. 2012, 4, 1–16. [Google Scholar] [CrossRef] [PubMed]
- Tierney, M.T.; Sacco, A. Satellite Cell Heterogeneity in Skeletal Muscle Homeostasis. Trends Cell Biol. 2016, 26, 434–444. [Google Scholar] [CrossRef] [PubMed]
- Bell, R.A.V.; Al-Khalaf, M.; Megeney, L.A. The beneficial role of proteolysis in skeletal muscle growth and stress adaptation. Skelet. Muscle 2016, 6, 16. [Google Scholar]
- Bassel-Duby, R.; Olson, E.N. Signaling Pathways in Skeletal Muscle Remodeling. Annu. Rev. Biochem. 2006, 19–37. [Google Scholar] [CrossRef]
- Buckingham, M.; Rigby, P.W.J. Gene Regulatory Networks and Transcriptional Mechanisms that Control Myogenesis. Dev. Cell 2014, 28, 225–238. [Google Scholar] [CrossRef]
- Hentze, M.W.; Castello, A.; Schwarzl, T.; Preiss, T. A brave new world of RNA-binding proteins. Nat. Rev. Mol. Cell Biol. 2018, 19, 327–341. [Google Scholar] [CrossRef]
- Shin, J.; Tajrishi, M.M.; Ogura, Y.; Kumar, A. Wasting mechanisms in muscular dystrophy. Int. J. Biochem. Cell Biol. 2013, 45, 2266–2279. [Google Scholar] [CrossRef]
- Guiraud, S.; Aartsma-Rus, A.; Vieira, N.M.; Davies, K.E.; van Ommen, G.-J.B.; Kunkel, L.M. The Pathogenesis and Therapy of Muscular Dystrophies. Annu Rev. Genom. Hum. Genet. 2015, 16, 281–308. [Google Scholar] [CrossRef]
- Rahimov, F.; Kunkel, L.M. The cell biology of disease: Cellular and molecular mechanisms underlying muscular dystrophy. J. Cell Biol. 2013, 201, 499–510. [Google Scholar] [CrossRef]
- André, L.; Ausems, C.R.M.; Wansink, D.G.; Wieringa, B. Abnormalities in Skeletal Muscle Myogenesis, Growth and Regeneration in Myotonic Dystrophy. Front. Neurol. 2018, 9, 368. [Google Scholar] [CrossRef]
- Meola, G.; Cardani, R. Myotonic Dystrophy Type 2: An Update on Clinical Aspects, Genetic and Pathomolecular Mechanism. J. Neuromuscul. Dis. 2015, 2, S59–S71. [Google Scholar] [CrossRef] [PubMed]
- Thornton, C.; Griggs, R.; Moxley, R. Myotonic dystrophy with no trinucleotide repeat expansion. Ann. Neurol. 1994, 35, 269–272. [Google Scholar] [CrossRef] [PubMed]
- Mahadevan, M.; Tsilfidis, C.; Sabourin, L.; Shutler, G.; Amemiya, C.; Jansen, G.; Neville, C.; Narang, M.; Barcelo, J.; O’Hoy, K.; et al. Myotonic dystrophy mutation: an unstable CTG repeat in the 3’ untranslated region of the gene. Science 1992, 255, 1253–1255. [Google Scholar] [CrossRef] [PubMed]
- Brook, J.D.; McCurrach, M.E.; Harley, H.G.; Buckler, A.J.; Church, D.; Aburatani, H.; Hunter, K.; Stanton, V.P.; Thirion, J.P.; Hudson, T.; et al. Molecular basis of myotonic dystrophy: Expansion of a trinucleotide (CTG) repeat at the 3′ end of a transcript encoding a protein kinase family member. Cell 1992, 68, 799–808. [Google Scholar] [CrossRef]
- Arsenault, M.; Prévost, C.; Lescault, A.; Laberge, C.; Puymirat, J.; Mathieu, J. Clinical characteristics of myotonic dystrophy type 1 patients with small CTG expansions. Neurology 2006, 66, 1248–1250. [Google Scholar] [CrossRef]
- Ho, G. Congenital and childhood myotonic dystrophy: Current aspects of disease and future directions. World J. Clin. Pediatrics 2015, 4, 66. [Google Scholar] [CrossRef]
- Farkas-Bargeton, E.; Barbet, J.P.; Dancea, S.; Wehrle, R.; Checouri, A.; Dulac, O. Immaturity of muscle fibers in the congenital form of myotonic dystrophy: its consequences and its origin. J. Neurol. Sci. 1988, 83, 145–159. [Google Scholar] [CrossRef]
- Furling, D.; Lemieux, D.; Taneja, K.; Puymirat, J. Decreased levels of myotonic dystrophy protein kinase (DMPK) and delayed differentiation in human myotonic dystrophy myoblasts. Neuromuscul. Disord. 2001, 11, 728–735. [Google Scholar] [CrossRef]
- Pelletier, R.; Hamel, F.; Beaulieu, D.; Patry, L.; Haineault, C.; Tarnopolsky, M.; Schoser, B.; Puymirat, J. Absence of a differentiation defect in muscle satellite cells from DM2 patients. Neurobiol. Dis. 2009, 36, 181–190. [Google Scholar] [CrossRef]
- Mamchaoui, K.; Trollet, C.; Bigot, A.; Negroni, E.; Chaouch, S.; Wolff, A.; Kandalla, P.K.; Marie, S.; Di Santo, J.; St Guily, J.L.; et al. Immortalized pathological human myoblasts: Towards a universal tool for the study of neuromuscular disorders. Skelet. Muscle 2011, 1, 34. [Google Scholar] [CrossRef]
- Arandel, L.; Polay Espinoza, M.; Matloka, M.; Bazinet, A.; De Dea Diniz, D.; Naouar, N.; Rau, F.; Jollet, A.; Edom-Vovard, F.; Mamchaoui, K.; et al. Immortalized human myotonic dystrophy muscle cell lines to assess therapeutic compounds. Dis. Models Mech. 2017, 10, 487–497. [Google Scholar] [CrossRef] [PubMed]
- Thomas, J.D.; Sznajder, Ł.J.; Bardhi, O.; Aslam, F.N.; Anastasiadis, Z.P.; Scotti, M.M.; Nishino, I.; Nakamori, M.; Wang, E.T.; Swanson, M.S. Disrupted prenatal RNA processing and myogenesis in congenital myotonic dystrophy. Genes Dev. 2017, 31, 1122–1133. [Google Scholar] [CrossRef] [PubMed]
- Barbé, L.; Lanni, S.; López-Castel, A.; Franck, S.; Spits, C.; Keymolen, K.; Seneca, S.; Tomé, S.; Miron, I.; Letourneau, J.; et al. CpG Methylation, a Parent-of-Origin Effect for Maternal-Biased Transmission of Congenital Myotonic Dystrophy. Am. J. Hum. Genet. 2017, 100, 488–505. [Google Scholar] [CrossRef] [PubMed]
- Yanovsky-Dagan, S.; Avitzour, M.; Altarescu, G.; Renbaum, P.; Eldar-Geva, T.; Schonberger, O.; Mitrani-Rosenbaum, S.; Levy-Lahad, E.; Birnbaum, R.Y.; Gepstein, L.; et al. Uncovering the Role of Hypermethylation by CTG Expansion in Myotonic Dystrophy Type 1 Using Mutant Human Embryonic Stem Cells. Stem Cell Rep. 2015, 5, 221–231. [Google Scholar] [CrossRef]
- Buckley, L.; Lacey, M.; Ehrlich, M. Epigenetics of the myotonic dystrophy-associated DMPK gene neighborhood. Epigenomics 2016, 8, 13–31. [Google Scholar] [CrossRef]
- Van Agtmaal, E.L.; André, L.M.; Willemse, M.; Cumming, S.; van Kessel, I.D.G.; van den Broek, W.J.A.A.; Gourdon, G.; Furling, D.; Mouly, V.; Monckton, D.G.; et al. CRISPR/Cas9- induced (CTG•CAG)n repeat instability in the myotonic dystrophy type 1 locus: implications for therapeutic genome editing. Mol. Ther. 2017, 25, 24–43. [Google Scholar] [CrossRef]
- Raaijmakers, R.H.L.; Ripken, L.; Ausems, C.R.M.; Wansink, D.G. CRISPR/Cas Applications in Myotonic Dystrophy: Expanding Opportunities. Int. J. Mol. Sci. 2019, 20, 3689. [Google Scholar] [CrossRef]
- Mankodi, A.; Urbinati, C.R.; Yuan, Q.P.; Moxley, R.T.; Sansone, V.; Krym, M.; Henderson, D.; Schalling, M.; Swanson, M.S.; Thornton, C.A. Muscleblind localizes to nuclear foci of aberrant RNA in myotonic dystrophy types 1 and 2. Hum. Mol. Genet. 2001, 10, 2165–2170. [Google Scholar]
- André, L.; van Cruchten, R.; Willemse, M.; Wansink, D. (CTG) n repeat-mediated dysregulation of MBNL1 and MBNL2 expression during myogenesis in DM1 occurs already at the myoblast stage. PLoS ONE 2019, 14, 1–17. [Google Scholar] [CrossRef]
- Meola, G.; Cardani, R. Myotonic dystrophies: An update on clinical aspects, genetic, pathology, and molecular pathomechanisms. Biochim. Et Biophys. Acta-Mol. Basis Dis. 2015, 1852, 594–606. [Google Scholar] [CrossRef]
- Yanovsky-Dagan, S.; Bnaya, E.; Diab, M.A.; Handal, T.; Zahdeh, F.; van den Broek, W.J.A.A.; Epsztejn-Litman, S.; Wansink, D.G.; Eiges, R. Deletion of the CTG Expansion in Myotonic Dystrophy Type 1 Reverses DMPK Aberrant Methylation in Human Embryonic Stem Cells but not Affected Myoblasts. bioRxiv 2019. [Google Scholar] [CrossRef]
- Gudde, A.E.E.G.E.G.; González-Barriga, A.; van den Broek, W.J.A.A.A.A.; Wieringa, B.; Wansink, D.G. A low absolute number of expanded transcripts is involved in myotonic dystrophy type 1 manifestation in muscle. Hum. Mol. Genet. 2016, 25, 1648–1662. [Google Scholar] [CrossRef] [PubMed]
- Poulos, M.G.; Batra, R.; Li, M.; Yuan, Y.; Zhang, C.; Darnell, R.B.; Swanson, M.S. Progressive impairment of muscle regeneration in muscleblind-like 3 isoform knockout mice. Hum. Mol Genet. 2013, 22, 3547–3558. [Google Scholar] [CrossRef] [PubMed] [Green Version]
- Brouwer, J.R.; Huguet, A.; Nicole, A.; Munnich, A.; Gourdon, G. Transcriptionally Repressive Chromatin Remodelling and CpG Methylation in the Presence of Expanded CTG-Repeats at the DM1 Locus. J. Nucleic Acids 2013, 2013, 567435. [Google Scholar] [CrossRef]
- Eden, E.; Lipson, D.; Yogev, S.; Yakhini, Z. Discovering motifs in ranked lists of DNA sequences. PLoS Comput. Biol. 2007, 3, 0508–0522. [Google Scholar] [CrossRef]
- Thomas, J.D.; Oliveira, R.; Sznajder, Ł.J.; Swanson, M.S. Myotonic Dystrophy and Developmental Regulation of RNA Processing. Compr. Physiol. 2018, 8, 509–553. [Google Scholar]
- Bland, C.S.; Wang, E.T.; Vu, A.; David, M.P.; Castle, J.C.; Johnson, J.M.; Burge, C.B.; Cooper, T.A. Global regulation of alternative splicing during myogenic differentiation. Nucleic Acids Res. 2010, 38, 7651–7664. [Google Scholar] [CrossRef] [Green Version]
- Buj-Bello, A.; Furling, D.; Tronchere, H.; Laporte, J.; Lerouge, T.; Butler-Browne, G.S.; Mandel, J.L. Muscle-specific alternative splicing of myotubularin-related 1 gene is impaired in DM1 muscle cells. Hum. Mol. Genet. 2002, 11, 2297–2307. [Google Scholar] [CrossRef]
- Bryson-Richardson, R.J.; Currie, P.D. The genetics of vertebrate myogenesis. Nat. Rev. Genet. 2008, 9, 632–646. [Google Scholar] [CrossRef]
- Osborne, R.J.; Thornton, C.A. RNA-dominant diseases. Hum. Mol Genet. 2006, 15, R162–R169. [Google Scholar] [CrossRef] [Green Version]
- Ranum, L.P.W.; Cooper, T.A. Rna-Mediated Neuromuscular Disorders. Annu. Rev. Neurosci. 2006, 29, 259–277. [Google Scholar] [CrossRef] [PubMed]
- Lee, K.S.; Cao, Y.; Witwicka, H.E.; Tom, S.; Tapscott, S.J.; Wang, E.H. RNA-binding protein muscleblind-like 3 (MBNL3) disrupts myocyte enhancer factor 2 (Mef2) β-exon splicing. J. Biol. Chem. 2010, 285, 33779–33787. [Google Scholar] [CrossRef] [PubMed] [Green Version]
- Lin, X.; Miller, J.W.; Mankodi, A.; Kanadia, R.N.; Yuan, Y.; Moxley, R.T.; Swanson, M.S.; Thornton, C.A. Failure of MBNL1-dependent post-natal splicing transitions in myotonic dystrophy. Hum. Mol. Genet. 2006, 15, 2087–2097. [Google Scholar] [CrossRef] [PubMed]
- Botta, A.; Malena, A.; Tibaldi, E.; Rocchi, L.; Loro, E.; Pena, E.; Cenci, L.; Ambrosi, E.; Bellocchi, M.C.; Pagano, M.A.; et al. MBNL142 and MBNL143 gene isoforms, overexpressed in DM1-patient muscle, encode for nuclear proteins interacting with Src family kinases. Cell Death Dis. 2013, 4, e770. [Google Scholar] [CrossRef] [PubMed] [Green Version]
- Dhaenens, C.M.; Schraen-Maschke, S.; Tran, H.; Vingtdeux, V.; Ghanem, D.; Leroy, O.; Delplanque, J.; Vanbrussel, E.; Delacourte, A.; Vermersch, P.; et al. Overexpression of MBNL1 fetal isoforms and modified splicing of Tau in the DM1 brain: Two individual consequences of CUG trinucleotide repeats. Exp. Neurol. 2008, 210, 467–478. [Google Scholar] [CrossRef] [PubMed]
- Kozlowski, P.; de Mezer, M.; Krzyzosiak, W.J. Trinucleotide repeats in human genome and exome. Nucleic Acids Res. 2010, 38, 4027–4039. [Google Scholar] [CrossRef]
- Dumont, N.A.; Bentzinger, C.F.; Sincennes, M.-C.; Rudnicki, M.A. Satellite Cells and Skeletal Muscle Regeneration. Compr. Physiol. 2015, 5, 1027–1059. [Google Scholar]
- Timchenko, N.A.; Iakova, P.; Cai, Z.; James, R.; Timchenko, L.T.; Smith, J.R. Molecular Basis for Impaired Muscle Differentiation in Myotonic Dystrophy Molecular Basis for Impaired Muscle Differentiation in Myotonic Dystrophy. Mol. Cell. Biol. 2001, 21, 6927–6938. [Google Scholar] [CrossRef] [Green Version]
- Thornell, L.-E.; Lindstöm, M.; Renault, V.; Klein, A.; Mouly, V.; Ansved, T.; Butler-Browne, G.; Furling, D. Satellite cell dysfunction contributes to the progressive muscle atrophy in myotonic dystrophy type. Neuropathol. Appl. Neurobiol. 2009, 35, 603–613. [Google Scholar] [CrossRef]
- Renna, L.V.; Cardani, R.; Botta, A.; Rossi, G.; Fossati, B.; Costa, E.; Meola, G. Premature senescence in primary muscle cultures of myotonic dystrophy type 2 is not associated with p16 induction. Eur. J. Histochem. 2014, 58, 275–286. [Google Scholar] [CrossRef]
- Amack, J.D.; Reagan, S.R.; Mahadevan, M.S. Mutant DMPK 3′-UTR transcripts disrupt C2C12 myogenic differentiation by compromising MyoD. J. Cell Biol. 2002, 159, 419–429. [Google Scholar] [CrossRef] [Green Version]
- Lee, K.S.; Smith, K.; Amieux, P.S.; Wang, E.H. MBNL3/CHCR prevents myogenic differentiation by inhibiting MyoD-dependent gene transcription. Differentiation 2008, 76, 299–309. [Google Scholar] [CrossRef] [PubMed]
- Amack, J.D.; Paguio, A.P.; Mahadevan, M.S. Cis and trans effects of the myotonic dystrophy (DM) mutation in a cell culture model. Hum. Mol. Genet. 1999, 8, 1975–1984. [Google Scholar] [CrossRef] [PubMed] [Green Version]
- Loro, E.; Rinaldi, F.; Malena, A.; Masiero, E.; Novelli, G.; Angelini, C.; Romeo, V.; Sandri, M.; Botta, A.; Vergani, L. Normal myogenesis and increased apoptosis in myotonic dystrophy type-1 muscle cells. Cell Death Differ. 2010, 17, 1315–1324. [Google Scholar] [CrossRef] [Green Version]
- Larsen, J.; Pettersson, O.J.; Jakobsen, M.; Thomsen, R.; Pedersen, C.B.; Hertz, J.M.; Gregersen, N.; Corydon, T.J.; Jensen, T.G. Myoblasts generated by lentiviral mediated MyoD transduction of myotonic dystrophy type 1 (DM1) fibroblasts can be used for assays of therapeutic molecules. BMC Res. Notes 2011, 4, 490. [Google Scholar] [CrossRef] [Green Version]
- Michel, L.; Huguet-Lachon, A.; Gourdon, G. Sense and antisense DMPK RNA foci accumulate in DM1 tissues during development. PLoS ONE 2015, 10, 1–17. [Google Scholar] [CrossRef] [Green Version]
- Amack, J.; Mahadevan, M. The myotonic dystrophy expanded CUG repeat tract is necessary but not sufficient to disrupt C2C12 myoblast differentiation. Hum. Mol. Genet. 2001, 10, 1879–1887. [Google Scholar] [CrossRef] [Green Version]
- Bachinski, L.L.; Sirito, M.; Böhme, M.; Baggerly, K.A.; Udd, B.; Krahe, R. Altered MEF2 isoforms in myotonic dystrophy and other neuromuscular disorders. Muscle Nerve 2010, 42, 856–863. [Google Scholar] [CrossRef]
- Kalsotra, A.; Singh, R.K.; Gurha, P.; Ward, A.J.; Creighton, C.J.; Cooper, T.A. The Mef2 Transcription Network Is Disrupted in Myotonic Dystrophy Heart Tissue, Dramatically Altering miRNA and mRNA Expression. Cell Rep. 2014, 6, 336–345. [Google Scholar] [CrossRef] [Green Version]
- Trapnell, C.; Williams, B.A.; Pertea, G.; Mortazavi, A.; Kwan, G.; van Baren, M.J.; Salzberg, S.L.; Wold, B.J.; Pachter, L. Transcript assembly and quantification by RNA-Seq reveals unannotated transcripts and isoform switching during cell differentiation. Nat. Biotechnol. 2010, 28, 511–515. [Google Scholar] [CrossRef] [Green Version]
- Potthoff, M.J.; Olson, E.N. MEF2: A central regulator of diverse developmental programs. Development 2007, 134, 4131–4140. [Google Scholar] [CrossRef] [PubMed] [Green Version]
- Holt, I.; Jacquemin, V.; Fardaei, M.; Sewry, C.A.; Butler-Browne, G.S.; Furling, D.; Brook, J.D.; Morris, G.E. Muscleblind-Like Proteins. Am. J. Pathol. 2009, 174, 216–227. [Google Scholar] [CrossRef] [PubMed] [Green Version]
- Batra, R.; Charizanis, K.; Manchanda, M.; Mohan, A.; Li, M.; Finn, D.J.; Goodwin, M.; Zhang, C.; Sobczak, K.; Thornton, C.A.; et al. Loss of MBNL Leads to Disruption of Developmentally Regulated Alternative Polyadenylation in RNA-Mediated Disease. Mol. Cell 2014, 56, 311–322. [Google Scholar] [CrossRef] [PubMed] [Green Version]
- Matloka, M.; Klein, A.F.; Rau, F.; Furling, D. Cells of Matter-In Vitro Models for Myotonic Dystrophy. Front. Neurol. 2018, 9, 361. [Google Scholar] [CrossRef] [PubMed]
- Faustino, N.A.; Cooper, T.A.; Andre, N. Pre-mRNA splicing and human disease. Genes Dev. 2003, 17, 419–437. [Google Scholar] [CrossRef] [PubMed] [Green Version]
- Hino, S.-I.; Kondo, S.; Sekiya, H.; Saito, A.; Kanemoto, S.; Murakami, T.; Chihara, K.; Aoki, Y.; Nakamori, M.; Takahashi, M.P.; et al. Molecular mechanisms responsible for aberrant splicing of SERCA1 in myotonic dystrophy type. Hum. Mol. Genet. 2007, 16, 2834–2843. [Google Scholar]
- Fugier, C.; Klein, A.F.; Hammer, C.; Vassilopoulos, S.; Ivarsson, Y.; Toussaint, A.; Tosch, V.; Vignaud, A.; Ferry, A.; Messaddeq, N.; et al. Misregulated alternative splicing of BIN1 is associated with T tubule alterations and muscle weakness in myotonic dystrophy. Nat. Med. 2011, 17, 720–725. [Google Scholar] [CrossRef] [Green Version]
- Rau, F.; Lainé, J.; Ramanoudjame, L.; Ferry, A.; Arandel, L.; Delalande, O.; Jollet, A.; Dingli, F.; Lee, K.-Y.; Peccate, C.; et al. Abnormal splicing switch of DMD’s penultimate exon compromises muscle fibre maintenance in myotonic dystrophy. Nat. Commun. 2015, 6, 7205. [Google Scholar] [CrossRef] [Green Version]
- Wang, E.T.; Cody, N.A.L.; Jog, S.; Biancolella, M.; Wang, T.T.; Treacy, D.J.; Luo, S.; Schroth, G.P.; Housman, D.E.; Reddy, S.; et al. Transcriptome-wide regulation of pre-mRNA splicing and mRNA localization by muscleblind proteins. Cell 2012, 150, 710–724. [Google Scholar] [CrossRef] [Green Version]
- Wang, E.T.; Treacy, D.; Eichinger, K.; Struck, A.; Estabrook, J.; Olafson, H.; Wang, T.T.; Bhatt, K.; Westbrook, T.; Sedehizadeh, S.; et al. Transcriptome alterations in myotonic dystrophy skeletal muscle and heart. Hum. Mol. Genet. 2019, 28, 1312–1321. [Google Scholar] [CrossRef]
- Richards, R.I.; Robertson, S.A.; Kastner, D.L. Neurodegenerative diseases have genetic hallmarks of autoinflammatory disease. Hum. Mol. Genet. 2018, 27, R108–R118. [Google Scholar] [CrossRef] [PubMed] [Green Version]
- Nakamori, M.; Hamanaka, K.; Thomas, J.D.; Wang, E.T.; Hayashi, Y.K.; Takahashi, M.P.; Swanson, M.S.; Nishino, I.; Mochizuki, H. Aberrant Myokine Signaling in Congenital Myotonic Dystrophy. Cell Rep. 2017, 21, 1240–1252. [Google Scholar] [CrossRef] [PubMed] [Green Version]
- Knight, J.D.; Kothary, R. The myogenic kinome: Protein kinases critical to mammalian skeletal myogenesis. Skelet. Muscle 2011, 1, 29. [Google Scholar] [CrossRef] [PubMed] [Green Version]
- Abmayr, S.M.; Pavlath, G.K. Myoblast fusion: Lessons from flies and mice. Development 2012, 139, 641–656. [Google Scholar] [CrossRef] [PubMed] [Green Version]
- Du, H.; Cline, M.S.; Osborne, R.J.; Tuttle, D.L.; Clark, T.A.; Donohue, J.P.; Hall, M.P.; Shiue, L.; Swanson, M.S.; Thornton, C.A.; et al. Aberrant alternative splicing and extracellular matrix gene expression in mouse models of myotonic dystrophy. Nat. Struct. Mol. Biol. 2010, 17, 187–193. [Google Scholar] [CrossRef] [Green Version]
- Jun, D.Y.; Kim, H.; Jang, W.Y.; Lee, J.Y.; Fukui, K.; Kim, Y.H. Ectopic overexpression of LAPTM5 results in lysosomal targeting and induces Mcl-1 down-regulation, Bak activation, and mitochondria-dependent apoptosis in human HeLa cells. PLoS ONE 2017, 12, e0176544. [Google Scholar] [CrossRef] [Green Version]
- Hsu, Y.-C.; Perin, M.S. Human Neuronal Pentraxin II (NPTX2): Conservation, Genomic Structure, and Chromosomal Localization. Genomics 1995, 28, 220–227. [Google Scholar] [CrossRef]
- Batra, R.; Nelles, D.A.; Krach, F.; Thomas, J.D.; Snjader, L.; Blue, S.M.; Aigner, S.; Swanson, M.S.; Yeo, G.W. Reversal of molecular pathology by RNA-targeting Cas9 in a myotonic dystrophy mouse model. bioRxiv 2017, 184408. [Google Scholar] [CrossRef] [Green Version]
- Summermatter, S.; Bouzan, A.; Pierrel, E.; Melly, S.; Fryer, C.; Leighton-davies, J.; Glass, D.J. Blockade of metallothioneins 1 and 2 increases skeletal muscle mass and strength. Mol. Cell. Biol. 2017, 37. [Google Scholar] [CrossRef] [Green Version]
- Urso, M.L.; Scrimgeour, A.G.; Chen, Y.-W.; Thompson, P.D.; Clarkson, P.M. Analysis of human skeletal muscle after 48 h immobilization reveals alterations in mRNA and protein for extracellular matrix components. J. Appl. Physiol. 2006, 101, 1136–1148. [Google Scholar] [CrossRef] [Green Version]
- Lecker, S.H.; Jagoe, R.T.; Gilber, A.; Gomes, M.; Baracos, V.; Bailey, J.; Price, S.R.; Mtich, W.E.; Goldberg, A.L. Multiple types of skeletal muscle atrophy involve a common program of changes in gene expression. FASEB J. 2004, 18, 39–51. [Google Scholar] [CrossRef] [PubMed]
- Latres, E.; Amini, A.R.; Amini, A.A.; Griffiths, J.; Martin, F.J.; Wei, Y.; Hsin, C.L.; Yancopoulos, G.D.; Glass, D.J. Insulin-like growth factor-1 (IGF-1) inversely regulates atrophy-induced genes via the phosphatidylinositol 3-kinase/Akt/mammalian target of rapamycin (PI3K/Akt/mTOR) pathway. J. Biol. Chem. 2005, 280, 2737–2744. [Google Scholar] [CrossRef] [PubMed] [Green Version]
- Schindelin, J.; Arganda-Carreras, I.; Frise, E.; Kaynig, V.; Longair, M.; Pietzsch, T.; Preibisch, S.; Rueden, C.; Saalfeld, S.; Schmid, B.; et al. Fiji: An open-source platform for biological-image analysis. Nat. Methods 2012, 9, 676–682. [Google Scholar] [CrossRef] [PubMed] [Green Version]
- Shen, S.; Park, J.W.; Lu, Z.; Lin, L.; Henry, M.D.; Wu, Y.N.; Zhou, Q.; Xing, Y. rMATS: Robust and flexible detection of differential alternative splicing from replicate RNA-Seq data. Proc. Natl. Acad. Sci. USA 2014, 111, E5593–E5601. [Google Scholar] [CrossRef] [PubMed] [Green Version]
- Li, B.; Dewey, C.N. RSEM: Accurate transcript quantification from RNA-Seq data with or without a reference genome. BMC Bioinform. 2011, 12, 323. [Google Scholar] [CrossRef] [Green Version]
- Langmead, B.; Salzberg, S.L. Fast gapped-read alignment with Bowtie. Nat. Methods 2012, 9, 357–359. [Google Scholar]
- Robinson, J.T.; Thorvaldsdóttir, H.; Winckler, W.; Guttman, M.; Lander, E.S.; Getz, G.; Mesirov, J.P. Integrative genomics viewer. Nat. Biotechnol. 2011, 29, 24–26. [Google Scholar] [CrossRef] [Green Version]
- Sherry, S.T.; Ward, M.H.; Kholodov, M.; Baker, J.; Phan, L.; Smigielski, E.M.; Sirotkin, K. dbSNP: The NCBI database of genetic variation. Nucleic Acids Res. 2001, 29, 308–311. [Google Scholar] [CrossRef] [Green Version]
- Eden, E.; Navon, R.; Steinfeld, I.; Lipson, D.; Yakhini, Z. GOrilla: A tool for discovery and visualization of enriched GO terms in ranked gene lists. BMC Bioinform. 2009, 10, 48. [Google Scholar] [CrossRef] [Green Version]
- Chong, J.; Soufan, O.; Li, C.; Caraus, I.; Li, S.; Bourque, G.; Wishart, D.S.; Xia, J. MetaboAnalyst 4.0: Towards more transparent and integrative metabolomics analysis. Nucleic Acids Res. 2018, 46, W486–W494. [Google Scholar] [CrossRef] [Green Version]
© 2019 by the authors. Licensee MDPI, Basel, Switzerland. This article is an open access article distributed under the terms and conditions of the Creative Commons Attribution (CC BY) license (http://creativecommons.org/licenses/by/4.0/).
Share and Cite
André, L.M.; van Cruchten, R.T.P.; Willemse, M.; Bezstarosti, K.; Demmers, J.A.A.; van Agtmaal, E.L.; Wansink, D.G.; Wieringa, B. Recovery in the Myogenic Program of Congenital Myotonic Dystrophy Myoblasts after Excision of the Expanded (CTG)n Repeat. Int. J. Mol. Sci. 2019, 20, 5685. https://doi.org/10.3390/ijms20225685
André LM, van Cruchten RTP, Willemse M, Bezstarosti K, Demmers JAA, van Agtmaal EL, Wansink DG, Wieringa B. Recovery in the Myogenic Program of Congenital Myotonic Dystrophy Myoblasts after Excision of the Expanded (CTG)n Repeat. International Journal of Molecular Sciences. 2019; 20(22):5685. https://doi.org/10.3390/ijms20225685
Chicago/Turabian StyleAndré, Laurène M., Remco T.P. van Cruchten, Marieke Willemse, Karel Bezstarosti, Jeroen A.A. Demmers, Ellen L. van Agtmaal, Derick G. Wansink, and Bé Wieringa. 2019. "Recovery in the Myogenic Program of Congenital Myotonic Dystrophy Myoblasts after Excision of the Expanded (CTG)n Repeat" International Journal of Molecular Sciences 20, no. 22: 5685. https://doi.org/10.3390/ijms20225685