The Role of Osteopontin as a Diagnostic and Prognostic Biomarker in Sepsis and Septic Shock

 , , , ,
Abstract
:1. Introduction
2. Materials and Methods
2.1. Setting and Patients
2.2. Experimental Analysis
2.3. Statistical Analysis
3. Results
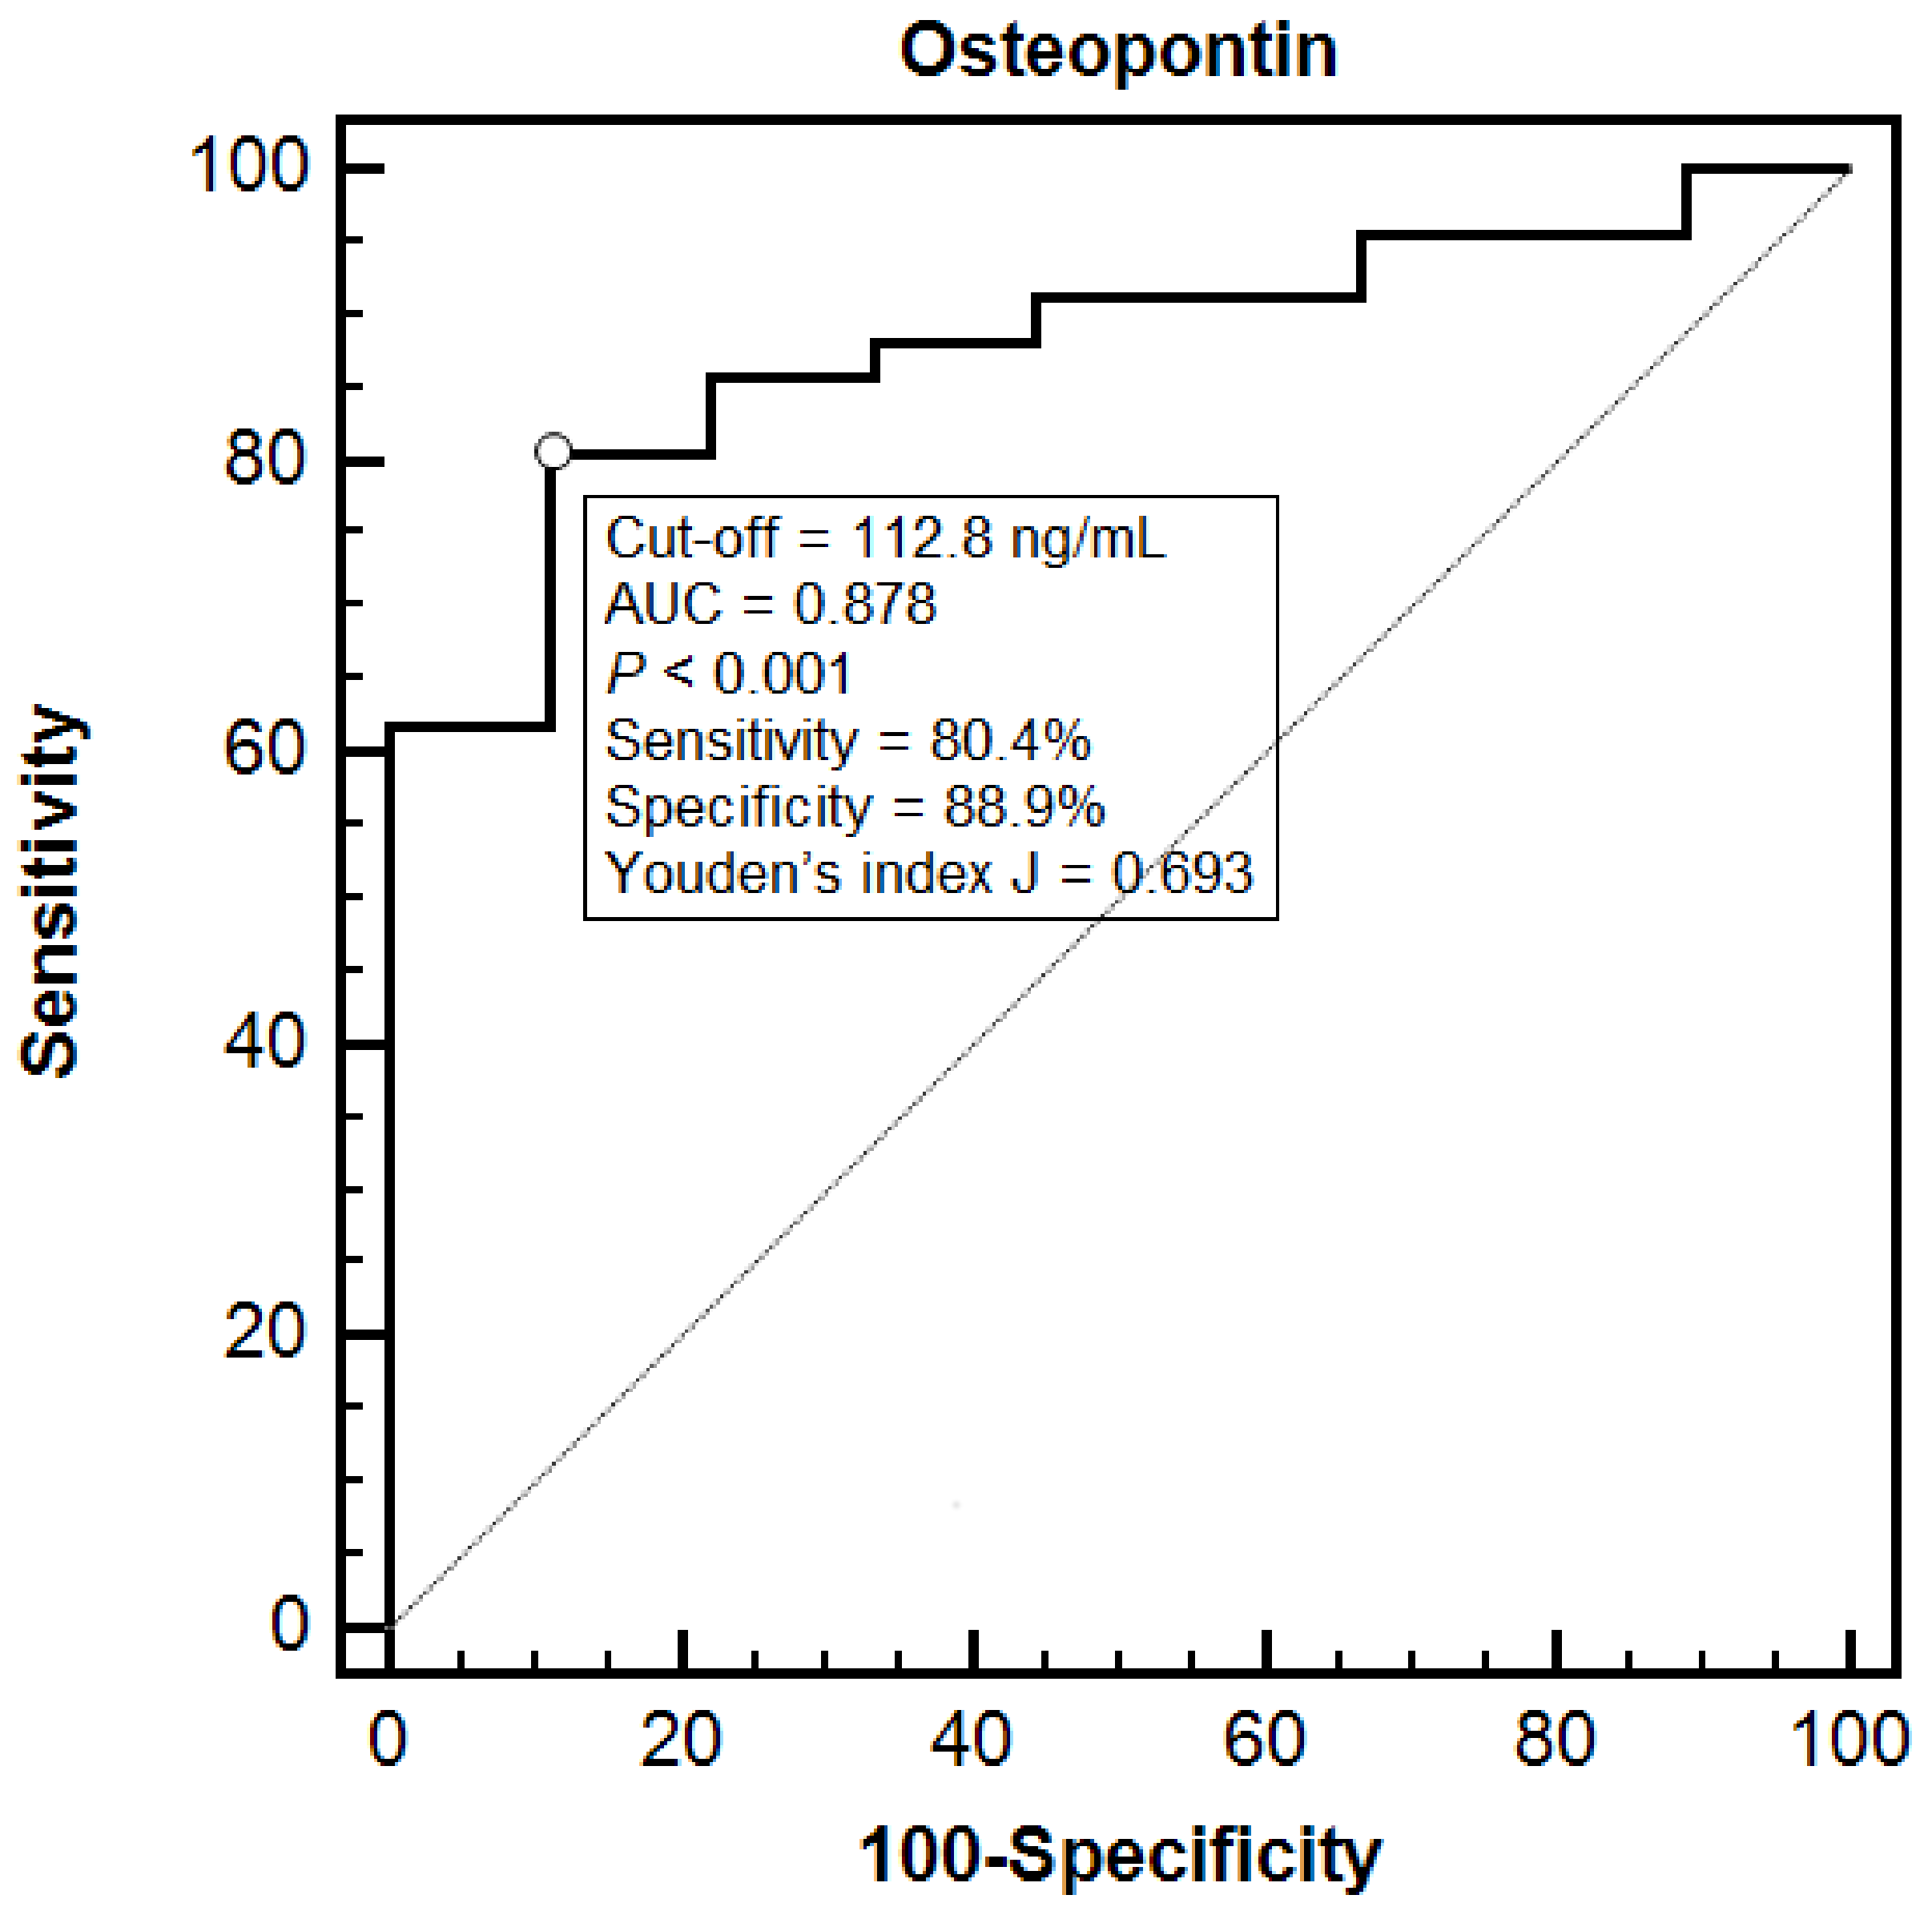
3.1. Diagnosis
3.2. Independent Predictors of OPN Concentration
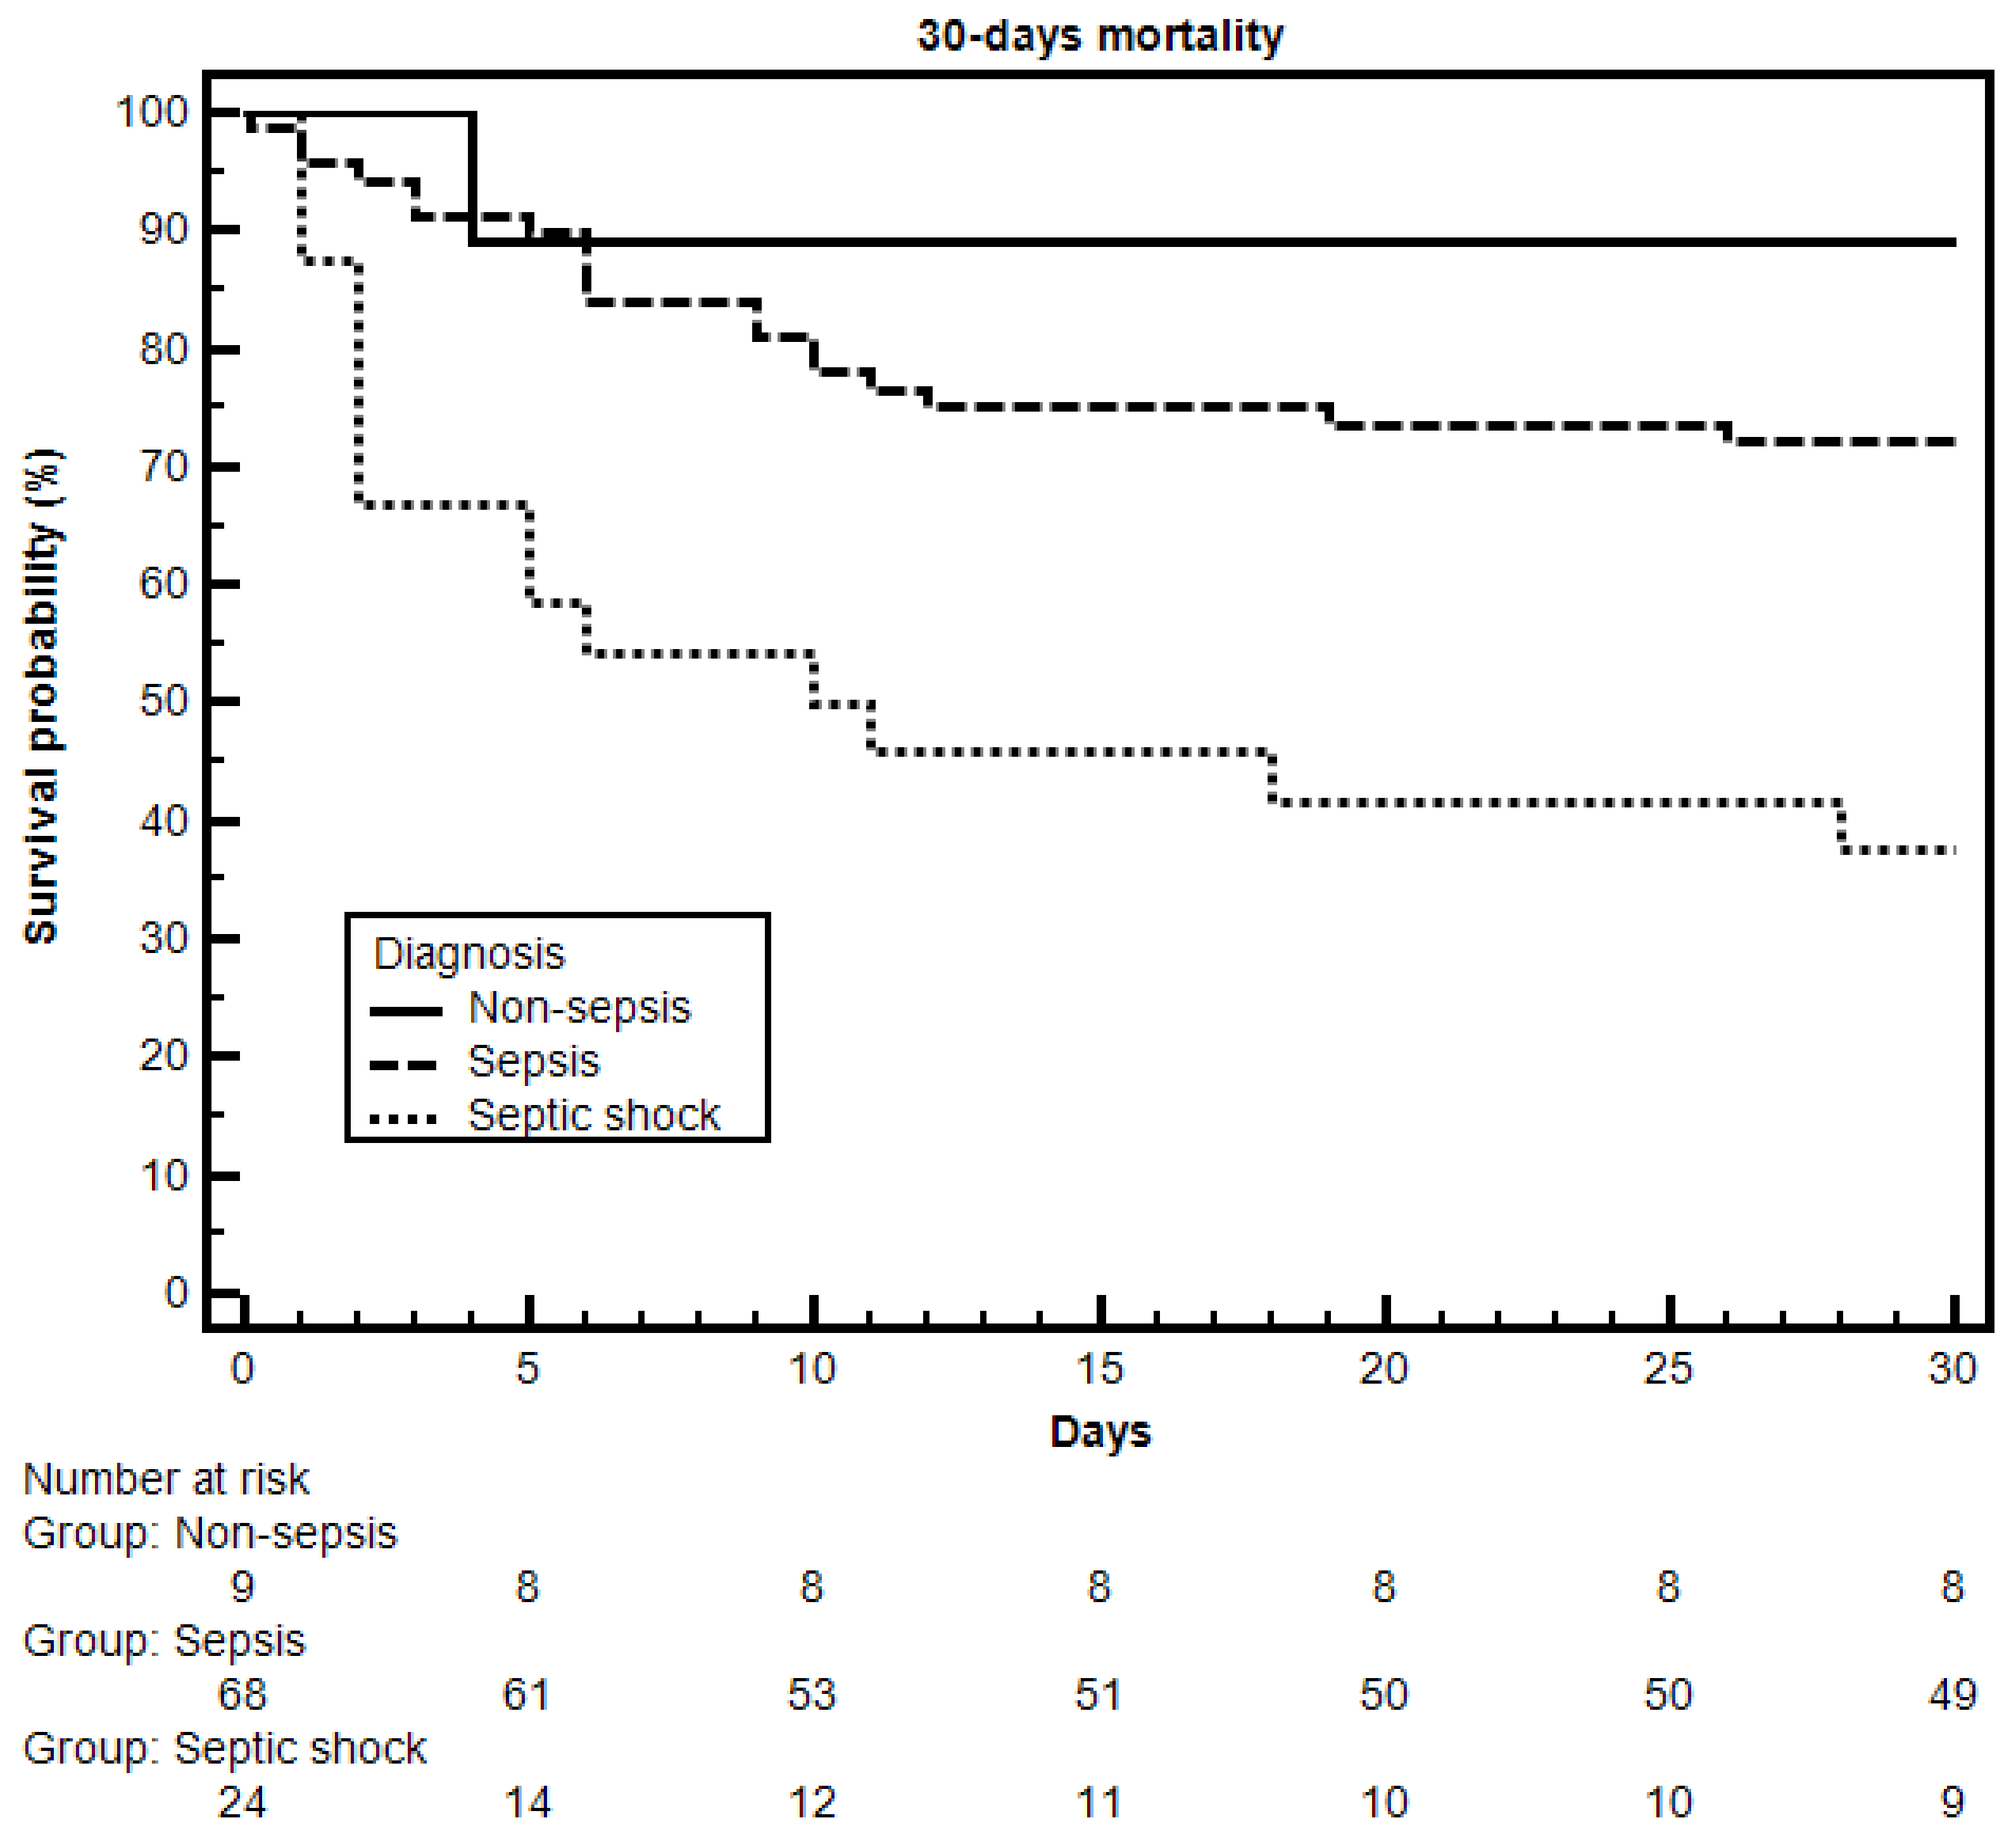
3.3. Mortality
4. Discussion
5. Conclusions
Supplementary Materials
Author Contributions
Funding
Conflicts of Interest
Abbreviations
References
- Singer, M.; Deutschman, C.S.; Seymour, C.W.; Shankar-Hari, M.; Annane, D.; Bauer, M.; Bellomo, R.; Bernard, G.R.; Chiche, J.D.; Coopersmith, C.M.; et al. The Third International Consensus Definitions for Sepsis and Septic Shock (Sepsis-3). JAMA 2016, 315, 801–810. [Google Scholar] [CrossRef] [PubMed]
- Vincent, J.L.; de Mendonça, A.; Cantraine, F.; Moreno, R.; Takala, J.; Suter, P.M.; Sprung, C.L.; Colardyn, F.; Blecher, S. Use of the SOFA score to assess the incidence of organ dysfunction/failure in intensive care units: Results of a multicenter, prospective study. Working group on "sepsis-related problems" of the European Society of Intensive Care Medicine. Crit. Care Med. 1998, 26, 1793–1800. [Google Scholar] [CrossRef] [PubMed]
- Rhodes, A.; Evans, L.E.; Alhazzani, W.; Levy, M.M.; Antonelli, M.; Ferrer, R.; Kumar, A.; Sevransky, J.E.; Sprung, C.L.; Nunnally, M.E.; et al. Surviving Sepsis Campaign: International Guidelines for Management of Sepsis and Septic Shock: 2016. Crit. Care Med. 2017, 45, 486–552. [Google Scholar] [CrossRef] [PubMed]
- Mearelli, F.; Fiotti, N.; Giansante, C.; Casarsa, C.; Orso, D.; De Helmersen, M.; Altamura, N.; Ruscio, M.; Castello, L.M.; Colonetti, E.; et al. Derivation and Validation of a Biomarker-Based Clinical Algorithm to Rule Out Sepsis From Noninfectious Systemic Inflammatory Response Syndrome at Emergency Department Admission: A Multicenter Prospective Study. Crit. Care Med. 2018. [Google Scholar] [CrossRef] [PubMed]
- Kim, H.; Hur, M.; Moon, H.W.; Yun, Y.M.; Di Somma, S.; Network, G. Multi-marker approach using procalcitonin, presepsin, galectin-3, and soluble suppression of tumorigenicity 2 for the prediction of mortality in sepsis. Ann. Intensive Care 2017, 7, 27. [Google Scholar] [CrossRef] [PubMed]
- Reinhart, K.; Meisner, M.; Brunkhorst, F.M. Markers for sepsis diagnosis: What is useful? Crit. Care Clin. 2006, 22, 503–519. [Google Scholar] [CrossRef] [PubMed]
- Pierrakos, C.; Vincent, J.L. Sepsis biomarkers: A review. Crit. Care 2010, 14, R15. [Google Scholar] [CrossRef]
- Liu, Y.; Hou, J.H.; Li, Q.; Chen, K.J.; Wang, S.N.; Wang, J.M. Biomarkers for diagnosis of sepsis in patients with systemic inflammatory response syndrome: A systematic review and meta-analysis. Springerplus 2016, 5, 2091. [Google Scholar] [CrossRef]
- Wu, C.C.; Lan, H.M.; Han, S.T.; Chaou, C.H.; Yeh, C.F.; Liu, S.H.; Li, C.H.; Blaney, G.N.; Liu, Z.Y.; Chen, K.F. Comparison of diagnostic accuracy in sepsis between presepsin, procalcitonin, and C-reactive protein: A systematic review and meta-analysis. Ann. Intensive Care 2017, 7, 91. [Google Scholar] [CrossRef]
- Castello, L.M.; Raineri, D.; Salmi, L.; Clemente, N.; Vaschetto, R.; Quaglia, M.; Garzaro, M.; Gentilli, S.; Navalesi, P.; Cantaluppi, V.; et al. Osteopontin at the Crossroads of Inflammation and Tumor Progression. Mediators Inflamm. 2017, 2017, 4049098. [Google Scholar] [CrossRef]
- Kahles, F.; Findeisen, H.M.; Bruemmer, D. Osteopontin: A novel regulator at the cross roads of inflammation, obesity and diabetes. Mol. Metab. 2014, 3, 384–393. [Google Scholar] [CrossRef] [PubMed]
- Icer, M.A.; Gezmen-Karadag, M. The multiple functions and mechanisms of osteopontin. Clin. Biochem. 2018, 59, 17–24. [Google Scholar] [CrossRef] [PubMed]
- Bellan, M.; Castello, L.M.; Pirisi, M. Candidate Biomarkers of Liver Fibrosis: A Concise, Pathophysiology-oriented Review. J. Clin. Transl. Hepatol. 2018, 6, 317–325. [Google Scholar] [CrossRef] [PubMed]
- Vaschetto, R.; Navalesi, P.; Clemente, N.; Boggio, E.; Valsecchi, S.; Olivieri, C.; Soluri, M.F.; Kroumova, V.; Fonio, P.; Dinatale, C.; et al. Osteopontin induces soluble urokinase-type plasminogen activator receptor production and release. Minerva. Anestesiol. 2015, 81, 157–165. [Google Scholar] [PubMed]
- Vaschetto, R.; Nicola, S.; Olivieri, C.; Boggio, E.; Piccolella, F.; Mesturini, R.; Damnotti, F.; Colombo, D.; Navalesi, P.; Della Corte, F.; et al. Serum levels of osteopontin are increased in SIRS and sepsis. Intensive Care Med. 2008, 34, 2176–2184. [Google Scholar] [CrossRef]
- Fortis, S.; Khadaroo, R.G.; Haitsma, J.J.; Zhang, H. Osteopontin is associated with inflammation and mortality in a mouse model of polymicrobial sepsis. Acta Anaesthesiol. Scand. 2015, 59, 170–175. [Google Scholar] [CrossRef] [PubMed]
- Roderburg, C.; Benz, F.; Cardenas, D.V.; Lutz, M.; Hippe, H.J.; Luedde, T.; Trautwein, C.; Frey, N.; Koch, A.; Tacke, F.; et al. Persistently elevated osteopontin serum levels predict mortality in critically ill patients. Crit. Care 2015, 19, 271. [Google Scholar] [CrossRef]
- Mehta, R.L.; Kellum, J.A.; Shah, S.V.; Molitoris, B.A.; Ronco, C.; Warnock, D.G.; Levin, A.; Network, A.K.I. Acute Kidney Injury Network: Report of an initiative to improve outcomes in acute kidney injury. Crit. Care 2007, 11, R31. [Google Scholar] [CrossRef]
- Lorenzen, J.; Krämer, R.; Kliem, V.; Bode-Boeger, S.M.; Veldink, H.; Haller, H.; Fliser, D.; Kielstein, J.T. Circulating levels of osteopontin are closely related to glomerular filtration rate and cardiovascular risk markers in patients with chronic kidney disease. Eur. J. Clin Invest. 2010, 40, 294–300. [Google Scholar] [CrossRef]
- Lorenzen, J.M.; Hafer, C.; Faulhaber-Walter, R.; Kümpers, P.; Kielstein, J.T.; Haller, H.; Fliser, D. Osteopontin predicts survival in critically ill patients with acute kidney injury. Nephrol. Dial. Transplant. 2011, 26, 531–537. [Google Scholar] [CrossRef]
- Mikkelsen, M.E.; Miltiades, A.N.; Gaieski, D.F.; Goyal, M.; Fuchs, B.D.; Shah, C.V.; Bellamy, S.L.; Christie, J.D. Serum lactate is associated with mortality in severe sepsis independent of organ failure and shock. Crit. Care Med. 2009, 37, 1670–1677. [Google Scholar] [CrossRef] [PubMed]
- Hirano, Y.; Aziz, M.; Yang, W.L.; Wang, Z.; Zhou, M.; Ochani, M.; Khader, A.; Wang, P. Neutralization of osteopontin attenuates neutrophil migration in sepsis-induced acute lung injury. Crit. Care 2015, 19, 53. [Google Scholar] [CrossRef] [PubMed]
- Freund, Y.; Lemachatti, N.; Krastinova, E.; Van Laer, M.; Claessens, Y.E.; Avondo, A.; Occelli, C.; Feral-Pierssens, A.L.; Truchot, J.; Ortega, M.; et al. Prognostic Accuracy of Sepsis-3 Criteria for In-Hospital Mortality Among Patients With Suspected Infection Presenting to the Emergency Department. JAMA 2017, 317, 301–308. [Google Scholar] [CrossRef] [PubMed]


| All Patients (N. 101) | Non-sepsis (N. 9) | Sepsis (N. 92) | p-Value | |
|---|---|---|---|---|
| General characteristics | ||||
| Age, years | 80 (73–88) | 84 (64–90) | 80 (73–88) | 0.934 |
| Sex, M/F | 57 (56.4%)/44 (43.6%) | 7 (77.8%)/2 (22.2%) | 50 (54.3%)/42 (45.7%) | 0.317 |
| BMI, kg/m2 | 24.8 (22.0–27.5) | 28.9 (24.6–31.2) | 24.2 (22.0–27.1) | 0.071 |
| Comorbidities | ||||
| Heart failure | 25 (24.8%) | 3 (33.3%) | 22 (24.0%) | 0.826 |
| Previous stroke | 19 (18.8%) | 1 (11.1%) | 18 (19.6%) | 0.863 |
| Dementia | 28 (27.7%) | 2 (22.2%) | 26 (28.3%) | 0.997 |
| COPD | 17 (16.8%) | 1 (11.1%) | 16 (17.4%) | 0.989 |
| Diabetes mellitus | 33 (32.7%) | 1 (11.1%) | 32 (34.8%) | 0.283 |
| Neoplasia | 24 (23.8%) | 1 (11.1%) | 23 (25.0%) | 0.600 |
| Arterial hypertension | 71 (70.3%) | 7 (77.8%) | 64 (69.6%) | 0.895 |
| CKD | 31 (30.7%) | 3 (33.3%) | 28 (30.4%) | 0.948 |
| Initiated antibiotic treatment ‡ | 22 (21.8%) | 1 (11.1%) | 21 (22.8%) | 0.674 |
| Clinical parameters | ||||
| HR, bpm | 107 (91–125) | 80 (73–108) | 110 (93–126) | 0.029 * |
| MAP, mmHg | 73.3 (64.6–95.0) | 76.3 (70.0–103.9) | 73.3 (61.7–94.2) | 0.270 |
| RR, breaths per minute | 30 (25–36) | 26 (24–30) | 30 (26–36) | 0.056 |
| POS, % | 91 (85–95) | 96 (94–98) | 90 (85–95) | 0.009 * |
| GCS | 13 (11–14) | 13 (12–14) | 13 (10–14) | 0.316 |
| Body temperature, °C | 37.9 (37.3–38.8) | 37.7 (36.0–38.5) | 38.0 (37.3–38.8) | 0.459 |
| Laboratory data | ||||
| WBCs, ×103/mm3 | 14.44 (9.46–20.40) | 12.99 (10.00–16.56) | 14.57 (9.26–21.78) | 0.520 |
| Hb, g/dL | 12.3 (10.8–13.6) | 12.1 (11.5–14.3) | 12.4 (10.8–13.5) | 0.962 |
| PLTs, ×103/mm3 | 217 (160–295) | 206 (177–301) | 218 (149–294) | 0.757 |
| Glucose, mg/dL | 138 (104–191) | 136 (122–148) | 139 (103–217) | 0.807 |
| Creatinine, mg/dL | 1.45 (0.94–2.12) | 1.18 (0.88–1.66) | 1.54 (0.94–2.15) | 0.311 |
| Total bilirubin, mg/dL | 0.7 (0.5–1.3) | 0.5 (0.5–1.0) | 0.8 (0.5–1.4) | 0.197 |
| CRP, mg/dL | 12.77 (3.12–19.40) | 2.10 (1.40–14.67) | 13.24 (3.40–19.57) | 0.127 |
| Arterial pH | 7.44 (7.39–7.48) | 7.44 (7.37–7.48) | 7.44 (7.39–7.48) | 0.826 |
| Plasma lactate, mmol/L | 2.5 (1.6–4.8) | 0.8 (0.7–1.6) | 2.8 (1.8–5.3) | <0.001 * |
| PaO2/FiO2, mmHg | 250.0 (210.2–321.6) | 300.5 (225.2–358.0) | 247.6 (210.0–313.4) | 0.255 |
| OPN, ng/mL | 204.6 (112.5–376.8) | 91.3 (63.9–105.4) | 225.2 (138.2–387.8) | <0.001 * |
| Scores | ||||
| qSOFA, 2/3 † | 69 (68.3%)/32 (31.7%) | 7 (77.8%)/2 (22.2%) | 62 (67.4%)/30 (32.6%) | 0.792 |
| SOFA | 6 (4–7) | 4 (2–5) | 6 (4–7) | 0.021 * |
| OR | 95% CI | p-Value | |
|---|---|---|---|
| Age | 0.976 | 0.876–1.087 | 0.656 |
| BMI | 0.656 | 0.455–0.947 | 0.024 * |
| HR | 1.003 | 0.937–1.074 | 0.934 |
| RR | 1.187 | 0.896–1.574 | 0.233 |
| POS | 1.008 | 0.808–1.256 | 0.946 |
| Plasma lactate | 4.546 | 0.500–41.303 | 0.179 |
| OPN | 1.020 | 1.002–1.039 | 0.031 * |
| SOFA | 1.799 | 0.840–3.849 | 0.131 |
| OPN, ng/mL | ρ | 95% CI | p-Value | ||
|---|---|---|---|---|---|
| Categorical Variables | |||||
| Sex | M | 191.3 (105.7–353.7) | 0.511 | ||
| F | 226.0 (123.0–387.8) | ||||
| Heart failure | Y | 190.0 (107.3–237.8) | 0.325 | ||
| N | 225.2 (117.3–387.8) | ||||
| Previous stroke | Y | 226.1 (115.0–355.6) | 0.768 | ||
| N | 193.6 (112.8–378.8) | ||||
| Dementia | Y | 228.0 (149.0–354.6) | 0.750 | ||
| N | 193.1 (106.1–386.7) | ||||
| COPD | Y | 215.4 (107.5–390.5) | 0.806 | ||
| N | 193.6 (117.1–377.5) | ||||
| Diabetes mellitus | Y | 204.6 (125.6–380.5) | 0.789 | ||
| N | 200.2 (112.2–354.6) | ||||
| Neoplasia | Y | 225.3 (165.3–411.0) | 0.128 | ||
| N | 190.0 (107.7–350.8) | ||||
| Arterial hypertension | Y | 206.3 (122.8–384.0) | 0.542 | ||
| N | 192.0 (99.1–345.9) | ||||
| CKD | Y | 189.9 (108.8–344.1) | 0.581 | ||
| N | 207.0 (122.6–385.7) | ||||
| Continuous variables | |||||
| SOFA | 0.243 | 0.050–0.418 | 0.014 * | ||
| Age, years | 0.112 | −0.085–0.301 | 0.264 | ||
| BMI, kg/m2 | −0.038 | −0.233–0.161 | 0.711 | ||
| Creatinine, mg/dL | 0.262 | 0.070–0.435 | 0.008 * | ||
| PaO2/FiO2, mmHg | −0.139 | −0.326–0.058 | 0.165 | ||
| WBCs, ×103/mm3 | 0.070 | −0.128–0.262 | 0.489 | ||
| PLTs, ×103/mm3 | 0.003 | −0.192–0.198 | 0.975 | ||
| CRP, mg/dL | 0.161 | −0.036–0.345 | 0.108 | ||
| Arterial pH | −0.114 | −0.303–0.083 | 0.257 | ||
| Plasma lactate, mmol/L | 0.370 | 0.188–0.527 | 0.0001 * | ||
| Non-sepsis (N. 9) | Sepsis (N. 92) | p-Value | ||
|---|---|---|---|---|
| 30-days mortality | 1/9 (11.1%) | 34/92 (37.0%) | 0.235 | |
| Non-sepsis (N. 9) | Sepsis (N. 68) | Septic shock (N. 24) | p-Value | |
| 30-days mortality | 1/9 (11.1%) | 19/68 (27.9%) | 15/24 (62.5%) | 0.003 * |
| Alive at 30 days (N. 58) | Dead at 30 days (N. 34) | p-Value | |
|---|---|---|---|
| General characteristics | |||
| Age, years | 80 (71–86) | 84 (75–89) | 0.175 |
| Sex, M/F | 33 (56.8%)/25 (43.2%) | 17 (50.0%)/17 (50.0%) | 0.671 |
| BMI, kg/m2 | 25.0 (22.2–27.3) | 24.1 (21.3–26.1) | 0.283 |
| Comorbidities | |||
| Heart failure | 14 (24.1%) | 8 (23.5%) | 0.852 |
| Previous stroke | 8 (13.8%) | 10 (29.4%) | 0.121 |
| Dementia | 17 (29.3%) | 9 (26.5%) | 0.958 |
| COPD | 11 (19.0%) | 5 (14.7%) | 0.814 |
| Diabetes mellitus | 20 (34.5%) | 12 (35.3%) | 0.882 |
| Neoplasia | 15 (25.8%) | 8 (23.5%) | 0.999 |
| Arterial hypertension | 42 (72.4%) | 22 (64.7%) | 0.589 |
| CKD | 17 (29.3%) | 11 (32.4%) | 0.880 |
| Initiated antibiotic treatment ‡ | 14 (24.1%) | 7 (20.6%) | 0.824 |
| Clinical parameters | |||
| HR, bpm | 107 (92–125) | 113 (94–127) | 0.710 |
| MAP, mmHg | 73.3 (61.7–95.0) | 73.3 (61.7–93.3) | 0.900 |
| RR, breaths per minute | 28 (25–35) | 32 (26–40) | 0.080 |
| POS, % | 91 (86–95) | 89 (81–94) | 0.122 |
| GCS | 13 (11–14) | 12 (9–13) | 0.010 * |
| Body temperature, °C | 38.0 (37.3–38.9) | 37.8 (37.2–38.7) | 0.201 |
| Laboratory data | |||
| WBCs, ×103/mm3 | 13.87 (8.30–20.86) | 15.09 (9.80–24.16) | 0.656 |
| Hb, g/dL | 12.3 (10.9–13.5) | 12.6 (10.5–13.5) | 0.815 |
| PLTs, ×103/mm3 | 218 (163–294) | 216 (128–290) | 0.680 |
| Glucose, mg/dL | 142 (108–190) | 131 (90–224) | 0.332 |
| Creatinine, mg/dL | 1.39 (0.94–2.09) | 1.66 (1.08–2.39) | 0.280 |
| Total bilirubin, mg/dL | 0.7 (0.6–1.4) | 0.8 (0.3–1.4) | 0.491 |
| CRP, mg/dL | 10.36 (2.92–17.20) | 15.72 (6.21–19.94) | 0.046 * |
| Arterial pH | 7.44 (7.42–7.49) | 7.40 (7.36–7.46) | 0.012 * |
| Plasma lactate, mmol/L | 2.4 (1.6–4.0) | 3.2 (2.1–6.8) | 0.029 * |
| PaO2/FiO2, mmHg | 260.0 (230.0–336.7) | 234.5 (182.2–259.5) | 0.023 * |
| OPN, ng/mL | 216.8 (144.0–356.6) | 231.3 (123.4–526.4) | 0.482 |
| Scores | |||
| qSOFA, 2/3† | 44 (75.9%)/14 (24.1%) | 18 (52.9%)/16 (47.1%) | 0.042 * |
| SOFA | 5 (4–7) | 7 (5–8) | 0.023 * |
© 2019 by the authors. Licensee MDPI, Basel, Switzerland. This article is an open access article distributed under the terms and conditions of the Creative Commons Attribution (CC BY) license (http://creativecommons.org/licenses/by/4.0/).
Share and Cite
Castello, L.M.; Baldrighi, M.; Molinari, L.; Salmi, L.; Cantaluppi, V.; Vaschetto, R.; Zunino, G.; Quaglia, M.; Bellan, M.; Gavelli, F.; et al. The Role of Osteopontin as a Diagnostic and Prognostic Biomarker in Sepsis and Septic Shock. Cells 2019, 8, 174. https://doi.org/10.3390/cells8020174
Castello LM, Baldrighi M, Molinari L, Salmi L, Cantaluppi V, Vaschetto R, Zunino G, Quaglia M, Bellan M, Gavelli F, et al. The Role of Osteopontin as a Diagnostic and Prognostic Biomarker in Sepsis and Septic Shock. Cells. 2019; 8(2):174. https://doi.org/10.3390/cells8020174
Chicago/Turabian StyleCastello, Luigi Mario, Marco Baldrighi, Luca Molinari, Livia Salmi, Vincenzo Cantaluppi, Rosanna Vaschetto, Greta Zunino, Marco Quaglia, Mattia Bellan, Francesco Gavelli, and et al. 2019. "The Role of Osteopontin as a Diagnostic and Prognostic Biomarker in Sepsis and Septic Shock" Cells 8, no. 2: 174. https://doi.org/10.3390/cells8020174