1. Introduction
Hypoxia arises when oxygen demands exceed its supply, which often is linked to diseases such as diabetes, autoimmune disorders, or cancer [
1,
2,
3,
4]. However, the severity of hypoxia varies, and its duration ranges from acute to chronic. In contrast to acute hypoxia, the term chronic hypoxia is not well defined, nor have its metabolic adaptations been explored. Previously, we specified chronic hypoxia as the phase of the hypoxic response where the protein expression of hypoxia inducible factors (HIF)-1α and HIF-2α decreased from their initial peaks under acute hypoxia to a steady state level slightly above normoxia [
5]. This was accompanied by the corresponding regulation of HIF-inducible genes. They strongly increased under acute hypoxia, and decreased during over 48–72 h of oxygen shortage. Based on these experiments 1% oxygen and 72 h-incubations were chosen to study chronic hypoxia.
Mitochondria are major consumers of oxygen in cells, and they are forced to adapt to low oxygen availability. The activity of the respiratory chain substantially decreases, which is not only caused by a reduced mitochondrial mass, but it also results from adaptations within the individual respiratory chain complexes. For example, HIF-1 alters the composition of complex IV by increasing cytochrome c oxidase subunit (COX) 4-2 expression, which optimizes complex IV for oxygen usage under hypoxic conditions [
6]. In contrast, the activity of complex I is reduced by a HIF-1-facilitated increase of NADH dehydrogenase (ubiquinone) 1 alpha subcomplex subunit 4-like 2 (NDUFA4L2) [
7]. The adaptive response to chronic hypoxia also includes the proteasomal degradation of the complex I assembly factor TMEM126B. Thereby, the protein level of complex I is reduced, and oxygen consumption at this site of the ETC is impaired [
8]. However, despite a substantial reduction of complex I amount and activity, the ETC continues to work at a lower level. This raises the question of how the ETC is fueled with electrons under acute vs. chronic hypoxia. Electrons can be delivered to the ETC by complex I (NADH:ubiquinone oxidoreductase), complex II (succinate dehydrogenase), electron-transferring flavoproteins (ETF), and the glycerin-3-phosphate shuttle. Each of these donors reduces ubiquinone to ubiquinol, which then passes electrons to complex III. Of note, different metabolites and metabolic pathways are involved in facilitating the distinct transfer mechanisms. Complex I takes over electrons from NADH, complex II oxidizes succinate to fumarate, and ETFs transfer reducing equivalents from acyl-CoA dehydrogenases [
9,
10]. ETFs are heterodimeric, FAD-containing proteins, found in all kingdoms of life. The primary function of ETFs is to carry one or two electrons from about 10 different flavoprotein-containing dehydrogenases to the respiratory chain, by forming transient complexes with their interaction partners [
11,
12]. ETFs transfer electrons to the membrane bound ETF-ubiquinone oxidoreductase (ETFDH) and from there, to the mitochondrial ubiquinone pool [
13]. Mutations in those proteins may cause severe symptoms, such as multiple acyl-CoA dehydrogenase dysfunctional disease (MADD), underscoring the importance of ETFs [
14,
15]. In essence, these considerations point to pivotal roles of the TCA cycle and β-oxidation in fueling the ETC, with three metabolic pathways of major importance. Glycolysis produces pyruvate, which enters the Krebs cycle as acetyl-CoA. Glutamine, via glutamate and glutamate dehydrogenase, is converted into α-ketoglutarate to maintain the TCA cycle, while fatty acid oxidation contributes to ETF-mediated electron transfer. Interestingly, under hypoxia, fatty acid oxidation and the TCA cycle intermediate citrate are closely connected. The reductive carboxylation of α-ketoglutarate produces citrate, which leaves mitochondria to be cleaved by ATP citrate lyase (ACLY), with the resultant acetyl-CoA being consumed for fatty acid synthesis [
16].
This study describes how electrons are channeled into the ETC under acute vs. chronic hypoxia. With the transition from acute to chronic hypoxia, cellular respiration shifted from being pyruvate-centered, to fatty acid- and ETF-based electron flow, in parallel with enhanced glutamine oxidation. A metabolic shift towards fatty acid oxidation was also noticed under conditions of impaired complex I activity, showing the dynamic range of adjusting oxygen-dependent respiration under hypoxia.
2. Materials and Methods
2.1. Cell Culture
THP-1 cells (derived from a male donor) were purchased from ATCC and incubated at 37 °C with 5% CO2 in RPMI medium (GE Healthcare, Munich, Germany), with the addition of 10% FCS, 1% pyruvate, 1% glutamine, and 1% penicillin/streptomycin (PAA Laboratories, Cölbe, Germany). ETFDH knockdown was induced by transfecting 2 × 10⁶ THP-1 cells with 50 nM small interfering RNAs (siRNAs) (ON-TARGETplus SMART pool, human ETFDH, Thermo Scientific, Karlsruhe, Germany), using Hiperfect (Qiagen, Hilden, Germany). For clustered regulatory interspaced short palindromic repeats (CRISPR)-mediated knockout of TMEM126B, THP-1 cells, stably transduced with a lentiviral vector containing Cas9 (pLentiCas9-Blast; Addgene #52962) and selected with 50 µg/mL blasticidine for 10 days, were again transduced with a lentivirus expressing the guide RNA against TMEM126B (pLentiCRISPRv2 ΔCas9 (derivate of pLentiCRISPRv2; Addgene #52961)). Afterwards, single-cell clones were created. For the experiments, five clones were selected, which showed knockout at the protein level. For the control, a non-target guide RNA (sgC) was used. For the metabolic studies, MDA-MB-231 cells (ATCC) were cultured in Dulbecco’s Modified Eagle’s Medium (DMEM) medium (GE Healthcare), with the addition of 10% fetal calve serum (FCS), 1% glutamine, and 1% penicillin/streptomycin (PAA Laboratories, Cölbe, Germany).
2.2. Hypoxic Incubation
Hypoxic incubations were performed in a SciTive Workstation (Baker Ruskinn, Leeds, UK) at 1% O2 and 5% CO2 for the times indicated. To ensure constant nutrient availability, equilibrated fresh media was added to the cells after 24 h and 48 h.
2.3. Western Analysis
Cells were lysed in a buffer containing 4% sodium dodecyl sulfate (SDS), 150 mM NaCl, and 100 mM Tris/HCl, pH 7.4, and sonicated. Protein content was determined by a protein assay kit (Bio-Rad, Munich, Germany), and 100 µg protein was loaded onto a 10% SDS gel. Gels were blotted by using a Trans Blot Turbo blotting system (Bio-Rad).
Membranes were blocked in 5% milk in Tris-buffered saline with 0.05% tween 20 (TBS-T) for tubulin (Sigma-Aldrich, Munich, Germany), or 5% bovine serum albumin (BSA) in TBS-T for TMEM126B (Atlas Antibodies via Sigma-Aldrich, Munich, Germany), electron transferring flavoprotein-ubiquinone oxidoreductase (ETFDH) (Abcam, Berlin, Germany), and oxidative phosphorylation (OXPHOS) Western cocktail (abcam). Enhanced chemiluminescence on a C-DIGIT scanner (Licor, Lincoln, USA), or fluorescence on an Odyssey scanner (Licor), were quantified with Image Studio Digits 5.0 (Licor).
2.4. Real-Time PCR
RNA was isolated using peqGold (Peqlab, Erlangen, Germany) and measured by using a Nanodrop ND-1000 spectrophotometer (Peqlab, Erlangen, Germany). Reverse transcription was performed with the Maxima First Strand cDNA Synthesis Kit for RT-PCR (Thermo Fisher Scientific, Waltham, USA). RNA expression was analyzed by using a SYBR green fluorescent mix (Thermo Fischer Scientific) on a CFX96 Real Time PCR Detection System (Bio-Rad), and normalized to TATA box binding protein (TBP). All primer sequences are listed in
Table 1.
2.5. Seahorse
The cellular oxygen consumption rate (OCR) and the extracellular acidification rate (ECAR) were analyzed using a Seahorse 96 extracellular flux analyzer (Agilent, Waldbronn, Germany). THP-1 cells were plated in Seahorse 96-well cell culture plates one day prior to the measurements, and equilibrated for 30 min before recordings were made in Krebs Henseleit buffer (111 mM NaCl, 4.7 mM KCl, 1.25 mM CaCl2, 2 mM MgSO4, 1.2 mM Na2HPO4) supplemented with 5 mM l-glucose and 1 mM l-glutamine. Cells were treated with 1 μM rotenone (Sigma-Aldrich, Munich, Germany), 50 µM etomoxir (Cayman Chemicals), 30 µM Bis-2-(5-phenylacetamido-1,3,4-thiadiazol-2-yl)ethyl sulfide (BPTES, Sigma-Aldrich, Munich, Germany), 20 µM UK5099 (Sigma-Aldrich, Munich, Germany), or 1 µM atpenin A5 (Cayman Chemicals).
2.6. Mitochondrial Membrane Potential
Cells were incubated with 1 µM of the mitochondrial membrane potential-sensitive dye JC-1 (Thermo Fischer Scientific) for 20 min at 37 °C, under hypoxia. Afterwards, cells were washed with PBS and green (fluorescein, FITC) vs. red (PE 561-A) fluorescence was measured on an LSRFortessa (BD, Heidelberg, Germany).
2.7. Quantification of Free Amino Acids in Cells and Cell Culture Media
Exactly 25 μL sample volumes were used for amino acid analysis. Sample preparation was performed by using the EZ:faast LC-MS free amino acid analysis kit (Phenomenex, Aschaffenburg, Germany) according to the manufacturer’s instructions, with minor modifications. Only 10 µL of the internal standard mix were applied to all samples and to the standard curve. After processing, the samples and standards were evaporated and resolved in 75 µL in 66.6% methanol containing 10 mM ammonium formate. Analysis of metabolites was performed by LC-MS/MS, using the EZ:faast AAA-MS HPLC column on an Agilent 1290 Infinity LC system (Agilent) coupled to a QTrap 5500 mass spectrometer (Sciex, Darmstadt, Germany). The column temperature was set to 35 °C. Gradient elution was performed with 10 mM ammonium formate in water (mobile phase A) and 10 mM ammonium formate in methanol (mobile phase B). Conditions for the separation were a 13 min gradient from 68% B to 83% B, followed by an equilibration step. The flow rate was set to 250 µL/min. The injection volume was 1 µL. Electro spray ionization in positive mode was employed. The ion source parameter was as follows, CUR 25 psi, IS 4000 °C, TEM 425 °C, GS1 40 psi, GS2 40 psi. Calibration curves were performed with the authentic standards from the EZ:faast kit. The intensities of the measured metabolite were normalized to internal standards. Analyst 1.6.2 and MultiQuant 3.0 (Sciex, Darmstadt, Germany), were used for data acquisition and analysis, respectively.
2.8. Quantification of TCA Cycle Metabolites
The cell homogenate (150 µL) or cell culture medium (100 µL) were mixed with 50 µL or 25 µL isotope-labeled internal standard, respectively. Samples were evaporated in a vacuum concentrator (Eppendorf, Hamburg, Germany) at 30 °C, resolved in 50 µL water, and subsequently transferred to the LC-MS system. Cell culture medium samples were directly transferred to the LC-MS system.
Liquid chromatography mass spectrometry was performed on an Agilent 1290 Infinity LC system (Agilent) coupled to a QTrap 5500 mass spectrometer (Sciex, Darmstadt, Germany). The reversed-phase LC separation was performed using a Waters Acquity UPLC HSS T3 column (150 mm × 2.1 mm, 1.8 µm (Waters, Eschborn, Germany)) at 40 °C. Gradient elution was performed with 0.15% formic acid in water (mobile phase A) and 0.15% formic acid in acetonitrile (mobile phase B) at a flow rate of 400 µL/min. Gradient conditions were 2% B for 1.5 min, followed by a 3 min gradient to 100% B, followed by a cleaning and equilibration step, with 10 min of total LC run time. The injection volume was 2.5 μL for all samples. The autosampler temperature was 6 °C. Electrospray ionization at 400 °C, with 4500 V in negative ionization mode, was employed. The ion source gas parameters were as follows, CUR 30 psi, GS1 45 psi, GS2 25 psi. The specific MRM transition for every compound was normalized to the appropriate isotope-labeled internal standard. Calibration curves were performed with authentic standards. Analyst 1.6.2 and MultiQuant 3.0 (Sciex, Darmstadt, Germany), were used for data acquisition and analysis, respectively.
2.9. Statistics
Data are expressed as mean values ± SEM. Statistically significant differences were calculated after analysis of variance (ANOVA) and Bonferroni’s test or Students t-test; p < 0.05 was considered as significant.
4. Discussion
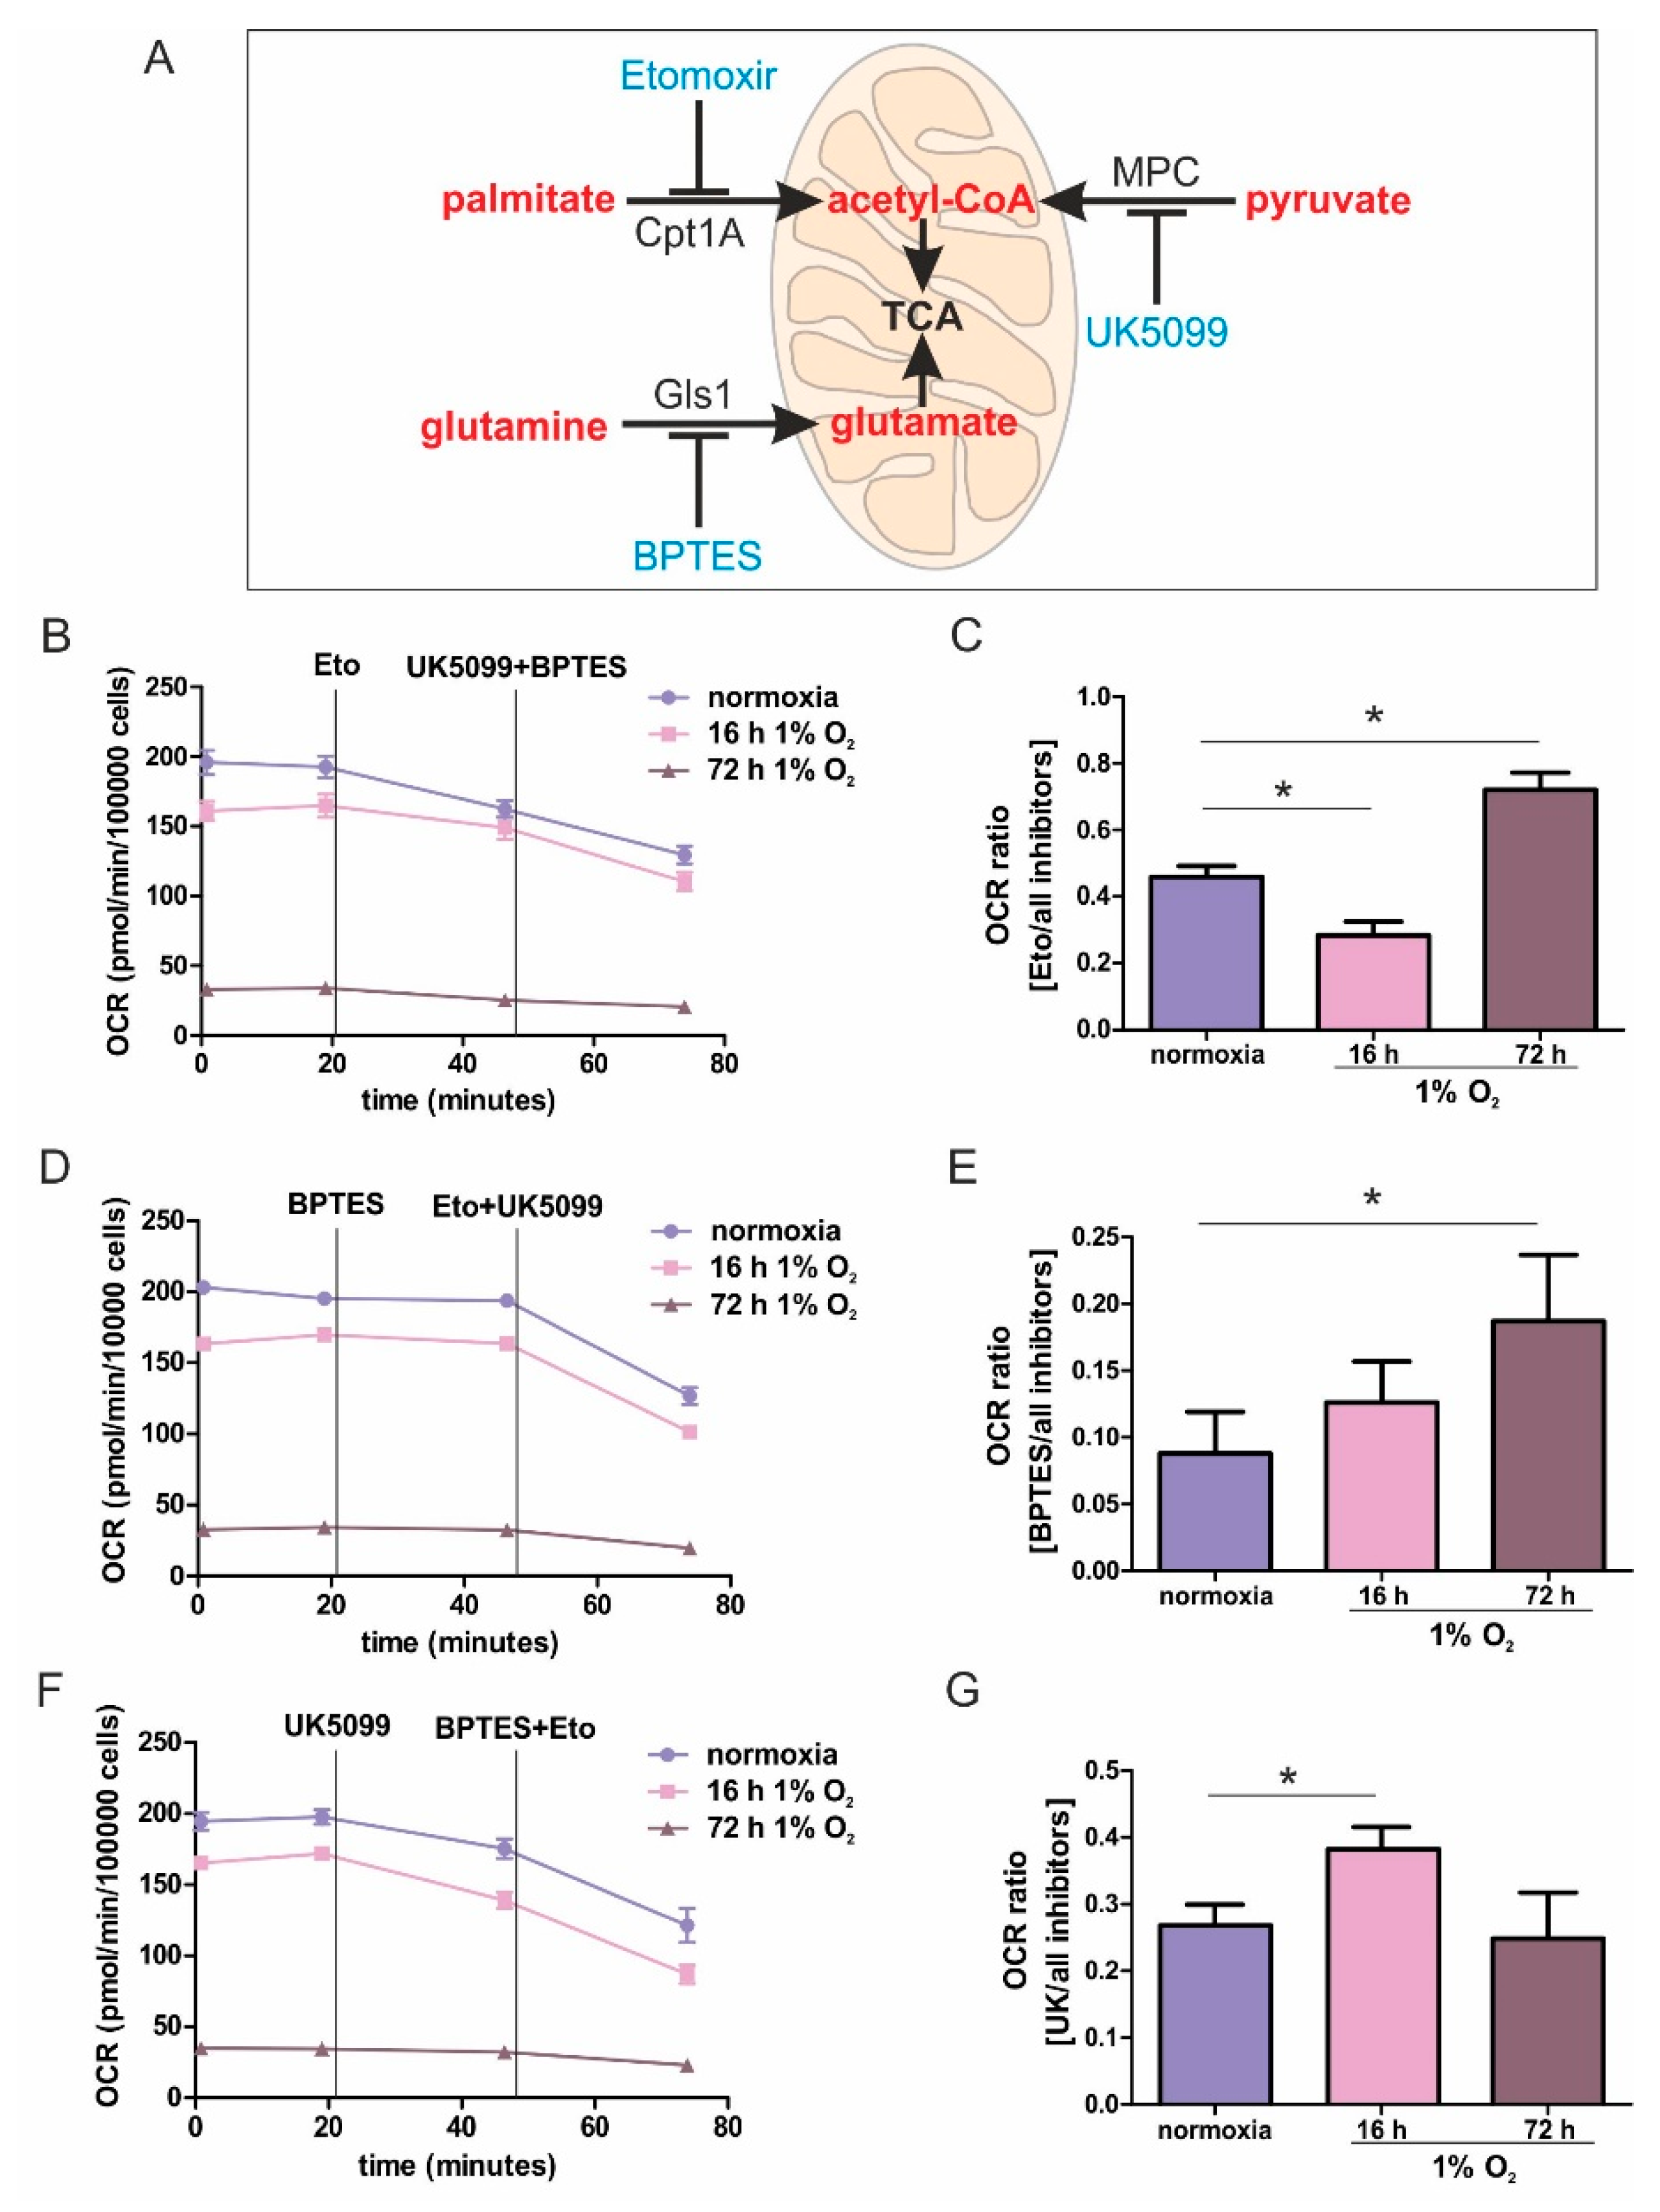
While metabolic adaptations under acute hypoxia are reasonably well-studied, the metabolic flexibility during long-term oxygen deprivation was less explored. Here, we examined the metabolic changes in THP-1 monocytes during the transition from acute to chronic hypoxia. With prolonged periods of hypoxia, cells show an increased demand for the oxidization of fatty acids to channel electrons via ETFs into the respiratory chain. Cellular respiration demands oxygen, and logically, it is impaired under hypoxia. It is generally accepted that pyruvate dehydrogenase is impaired due to phosphorylation via PDK1 (pyruvate dehydrogenase kinase 1), which itself is a hypoxia inducible gene. Therefore, the TCA cycle should be slowed down, and the generation of redox equivalents for complex I are reduced. With a slower turnover of the TCA cycle, succinate dehydrogenase also may face reduced substrate availability, and the delivery of electrons via complex II may be impaired. Along these lines, fatty acids are stored in lipid droplets, making them inaccessible for mitochondrial β-oxidation. Consequently, channeling electrons via ETFs into the ETC is attenuated. Besides the generation of reducing equivalents, components of the respiratory chain themselves are also subjected to hypoxic regulation. However, in this case, conflicting concepts exist. On one hand a decreased activity of complex I had been noticed, while on the other hand, changes in the complex formation of cytochrome c oxidase may occur, to maximize the limited usage of oxygen. Even if respiration under acute hypoxia is reduced, cells continue to maintain some mitochondrial respiratory activity, as this seems important for cancer cells to survive and to metastasize. The situation even becomes more blurry if we move from acute to chronic hypoxia. Under chronic hypoxia, expression of beta-transducin repeat-containing protein 1 (β-TrCP1) is upregulated, which ubiquitinates and destroys the complex I assembly factor TMEM126B. Consequently, complex abundance is drastically lowered, and its activity is severely impaired. Compared with acute hypoxia showing an OCR of roughly 150 pmol/min/100,000 cells, oxygen consumption under chronic hypoxia drops to values of below 50 pmol/min/100,000 cells. Addressing mitochondrial fuel usage under chronic hypoxia, we assessed the flexibility of THP-1 cells in oxidizing three critical mitochondrial fuels, such as glucose, glutamine, or long-chain fatty acids. With a Seahorse flux analyzer, we followed the rates of substrate oxidation of each fuel, by measuring mitochondrial respiration. Therefore, we initially inhibited one pathway, followed by blocking the remaining two. Using a combination of etomoxir, which interferes with the transport of fatty acids into mitochondria, UK5099, which blocks the transport of pyruvate into mitochondria, and BPTES, which inhibits the conversion of glutamine to glutamate, the dependency of cells on different substrates can be explored. Expressing the ratio of OCR with one inhibitor vs. all inhibitors allows a standardized output value and the comparison of data.
For chronically hypoxic THP-1 monocytes, we noticed an unexpected demand for the oxidization of fatty acids and glutamine, while acutely hypoxic cells appeared to rely on pyruvate, with a decreased importance of fatty acid oxidation. Also, liver cells attenuated β-oxidation under acute hypoxia, mediated via HIF-2 [
17,
18]. Corroborating these findings, the Cpt1-facilitated mitochondrial uptake of fatty acids is impaired under hypoxia [
19]. Pyruvate-dependent respiration under acute hypoxia is perplexing. However, monocytes, compared to fully differentiated macrophages, only show a modest upregulation of hypoxic genes [
20,
21]. The expression of glycolytic enzymes, as well as the secretion of lactate under hypoxia, was low compared to macrophages exposed to hypoxia, and they only reached values already found in differentiated monocytes, i.e., macrophages under normoxia. Taking the minor regulation of hypoxic genes in monocytes into consideration, it is no longer surprising that we do see a slight dependence on pyruvate under acute hypoxia.
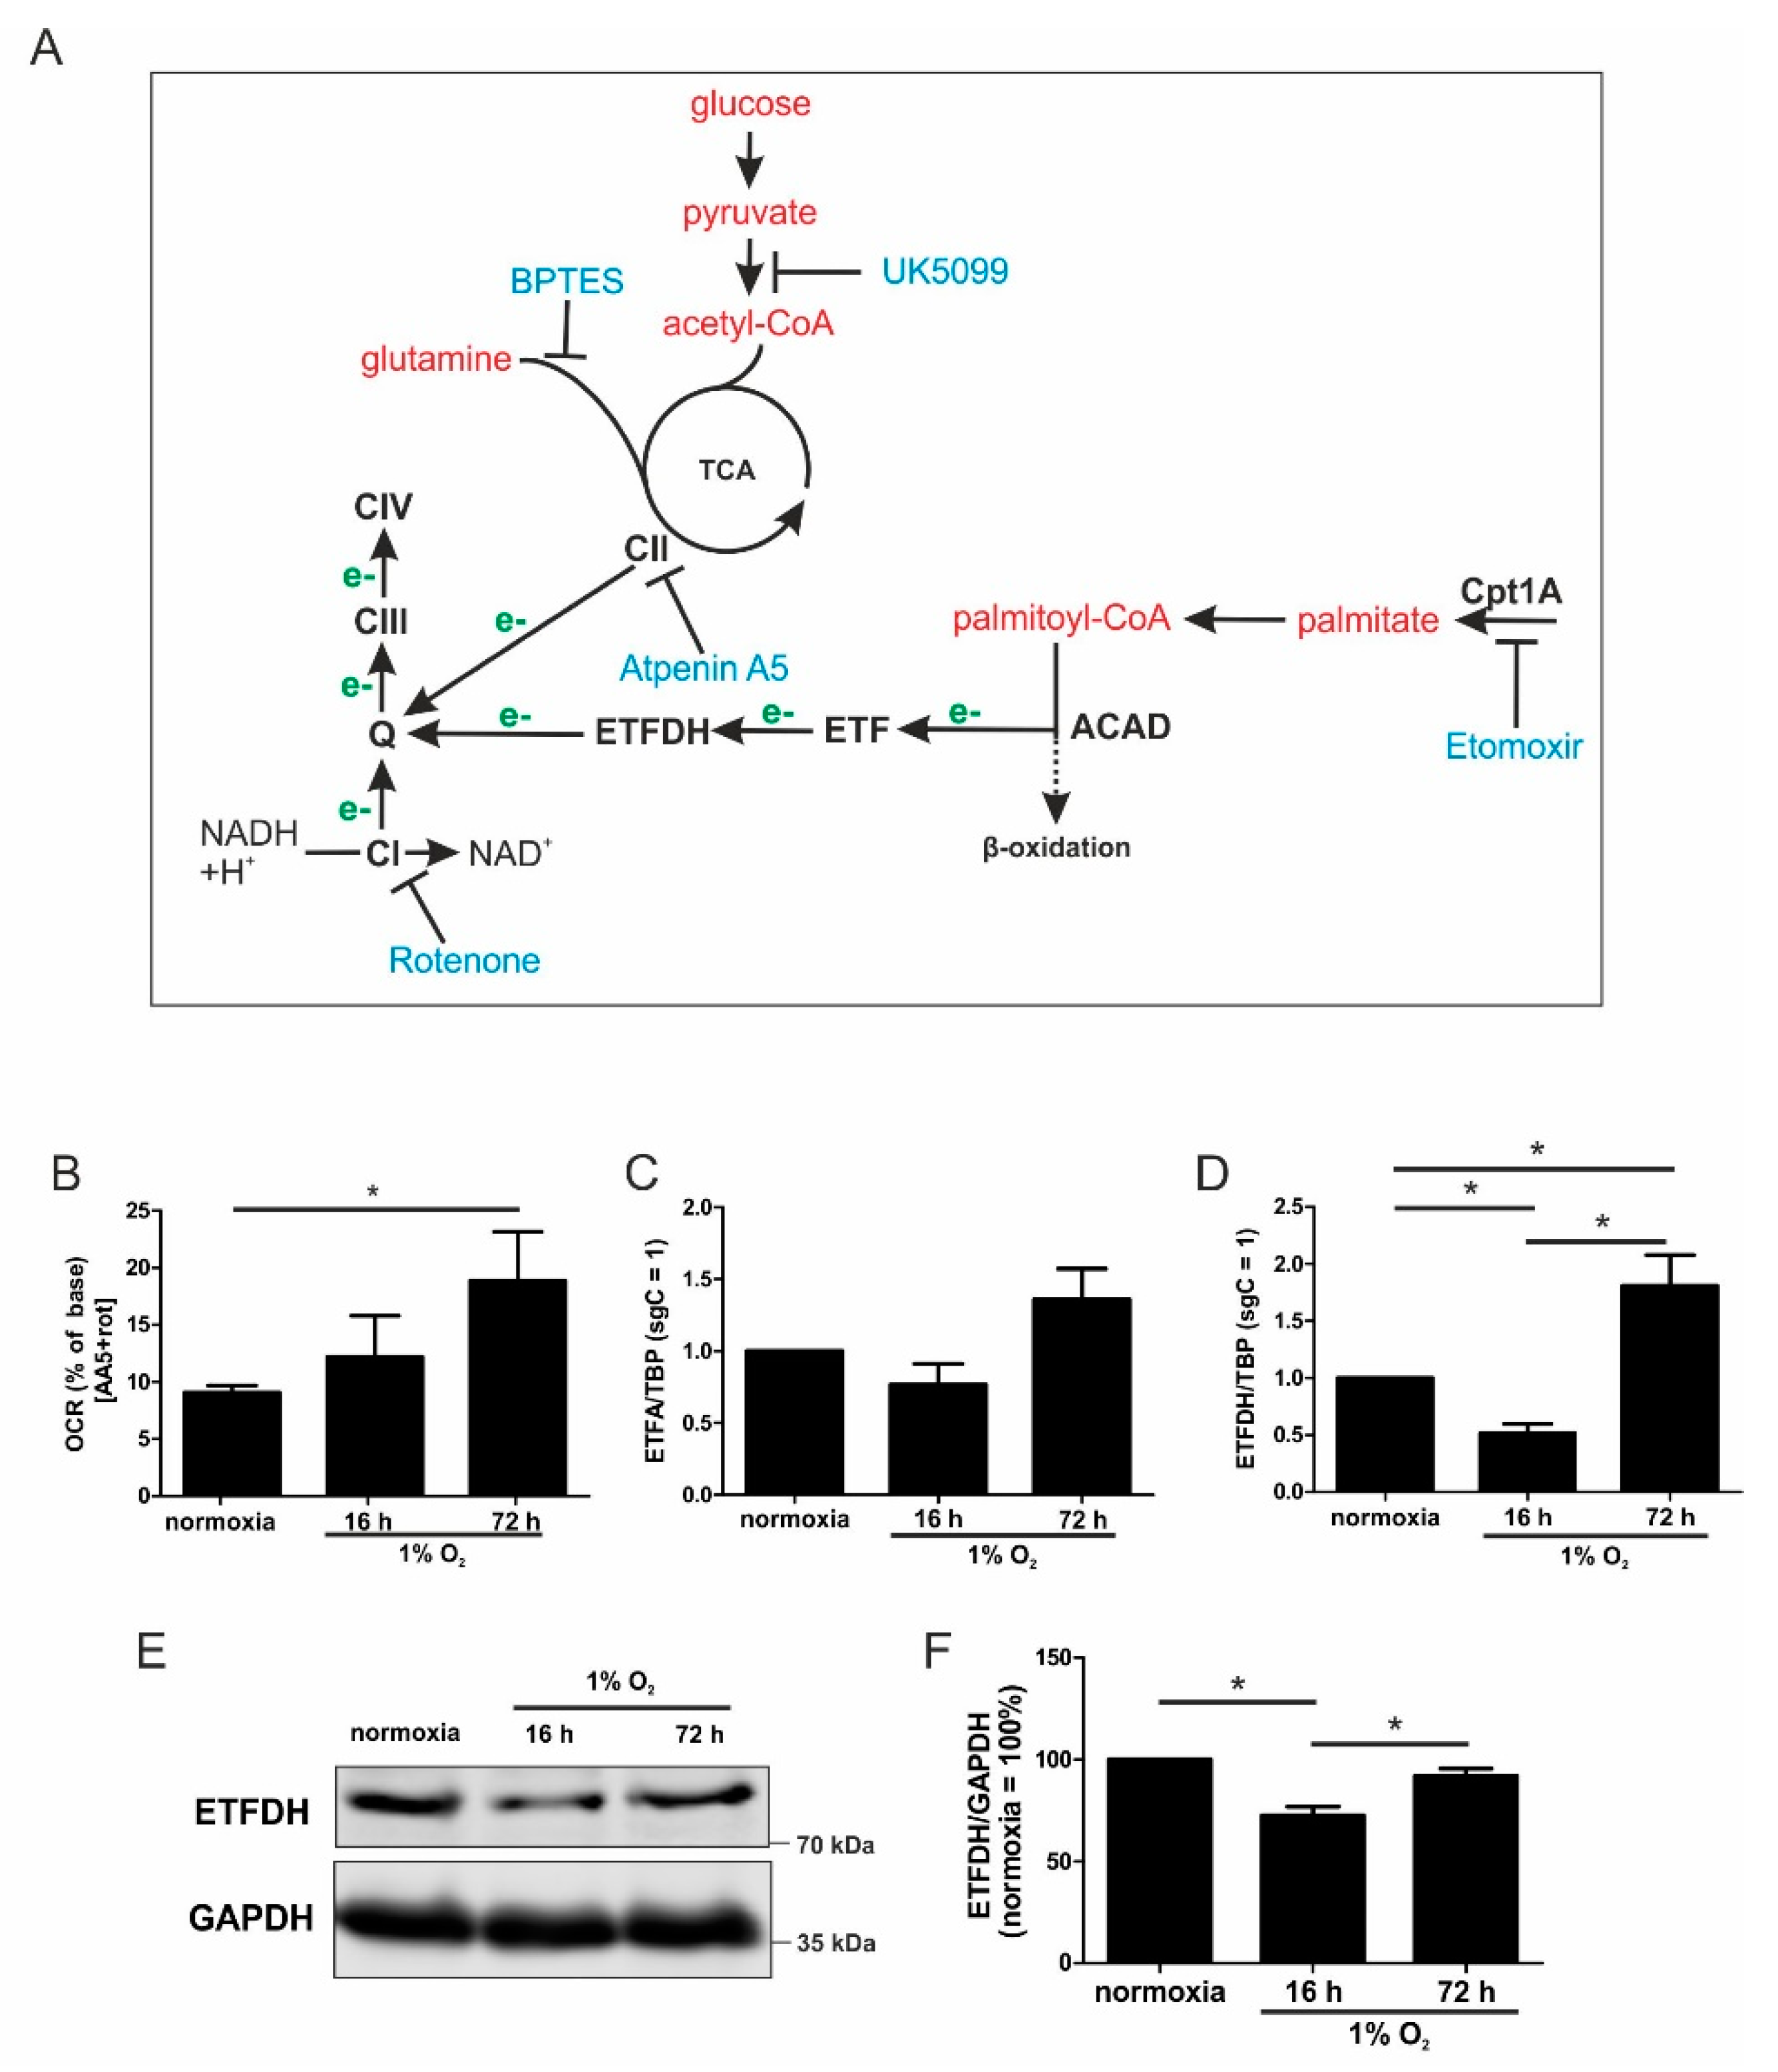
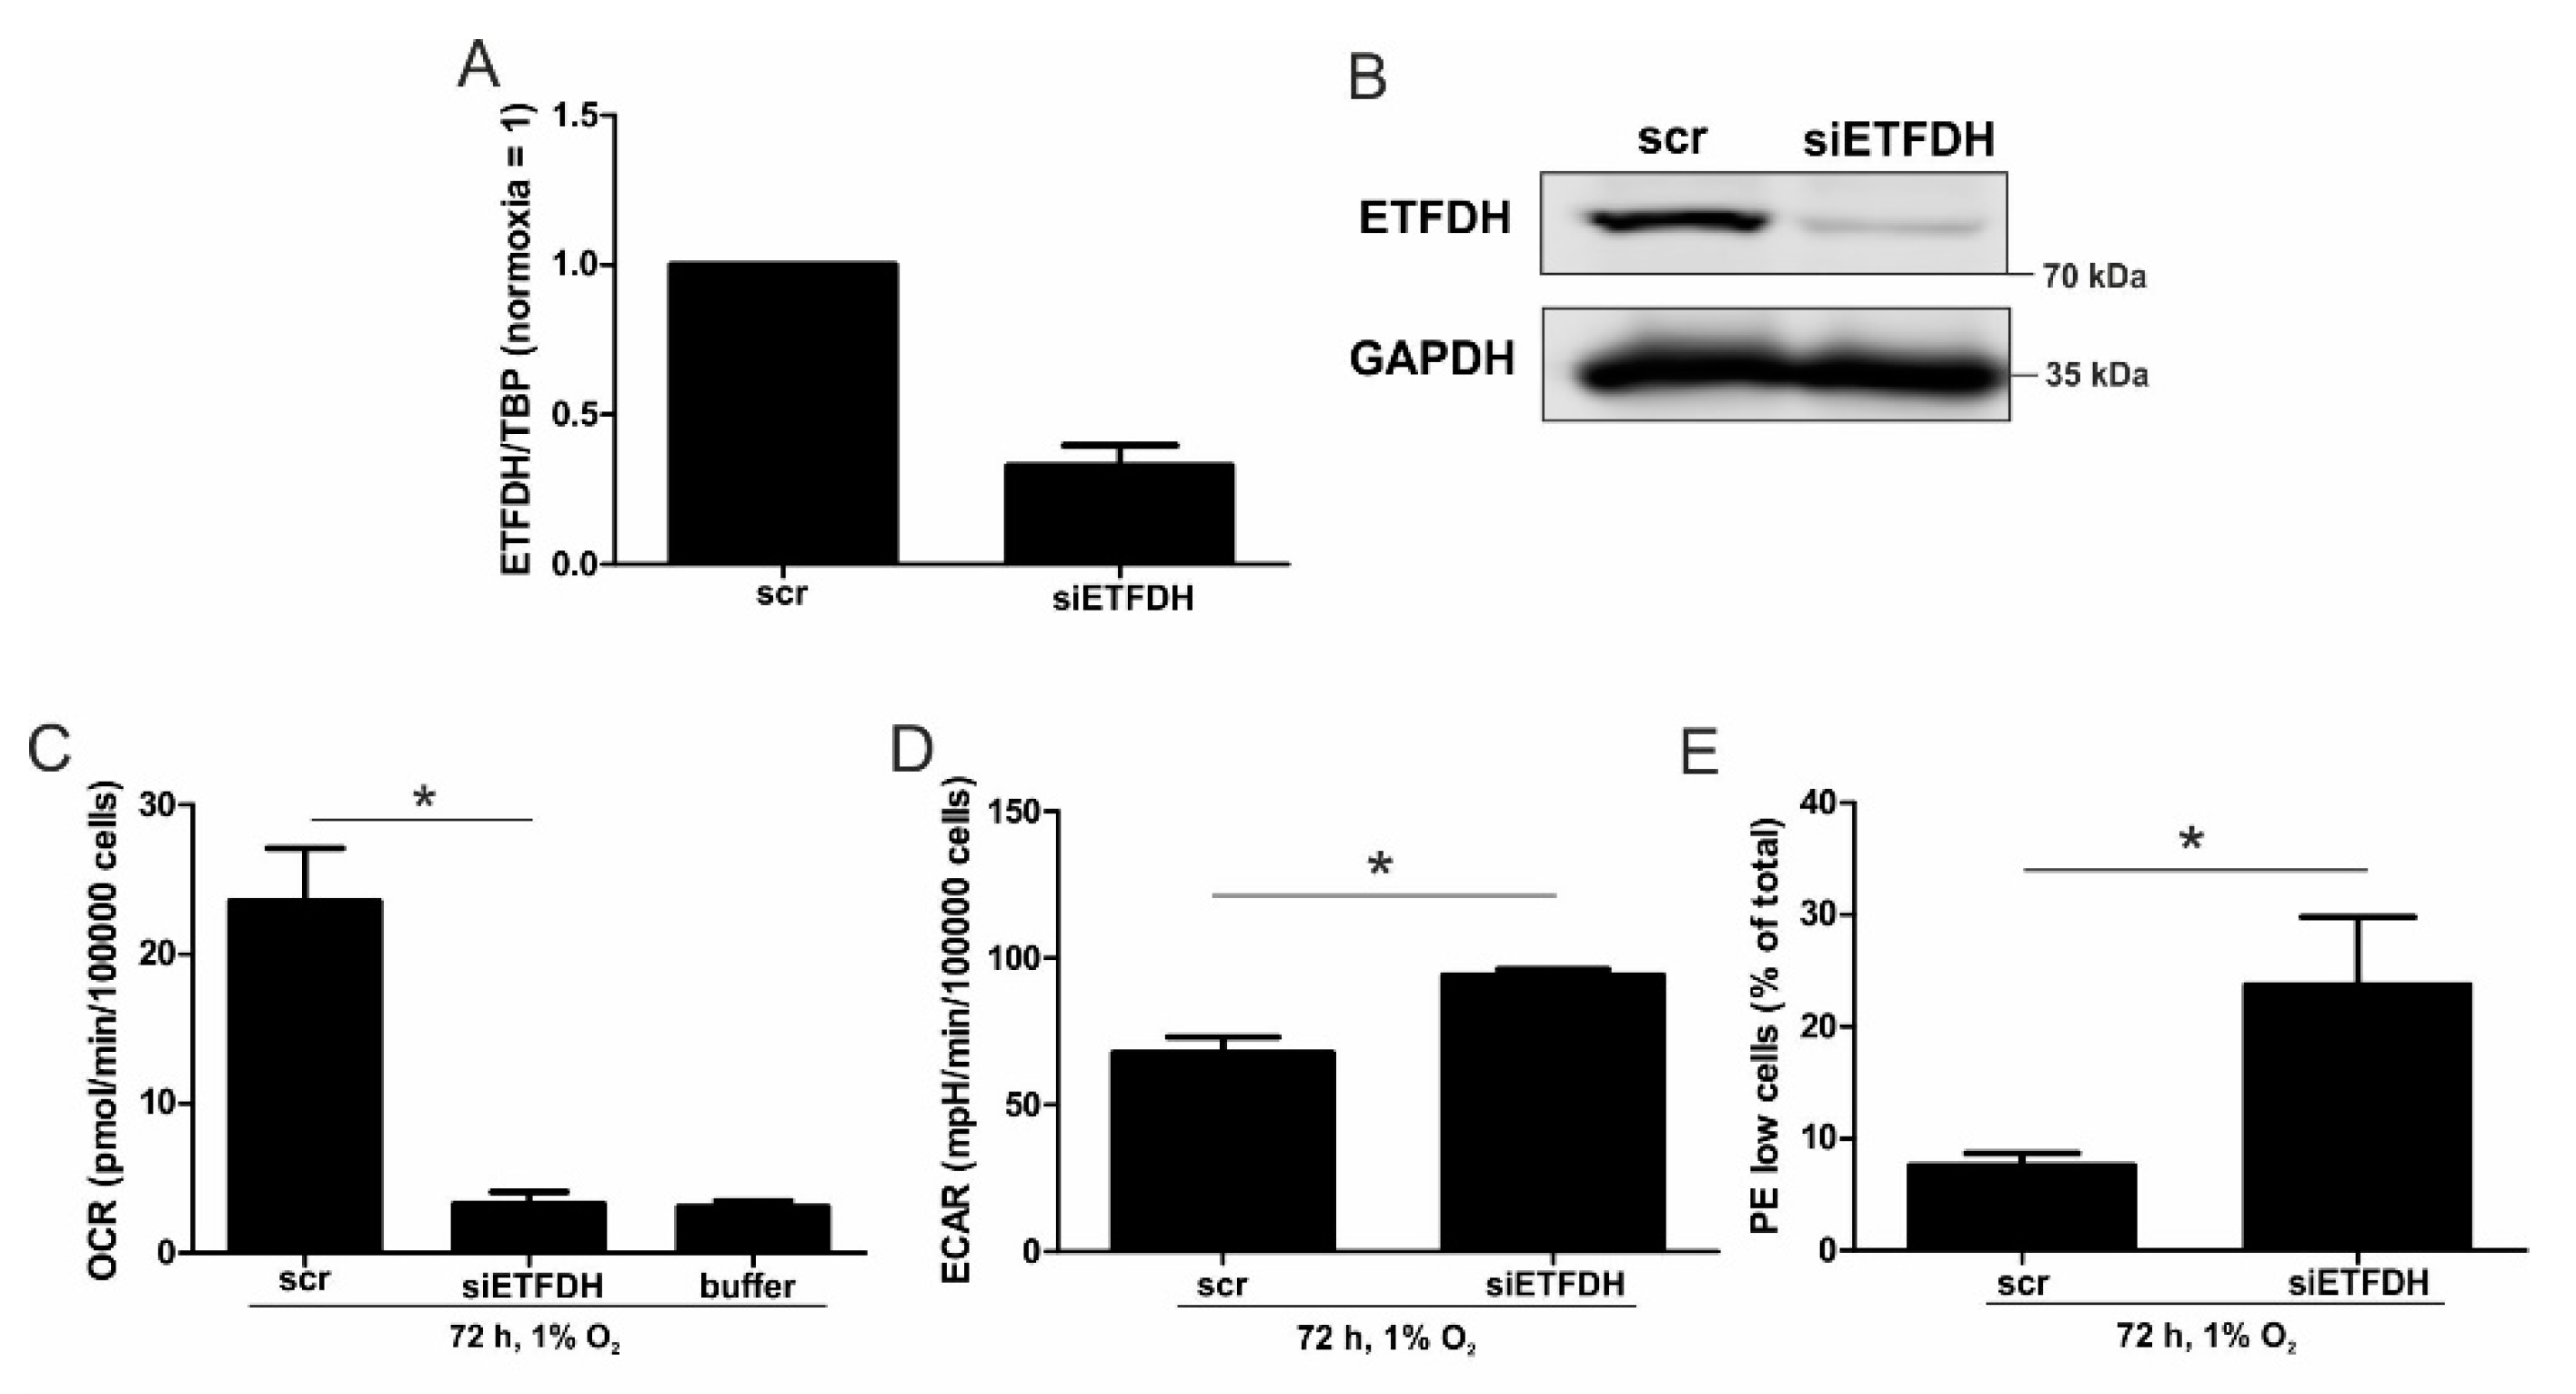
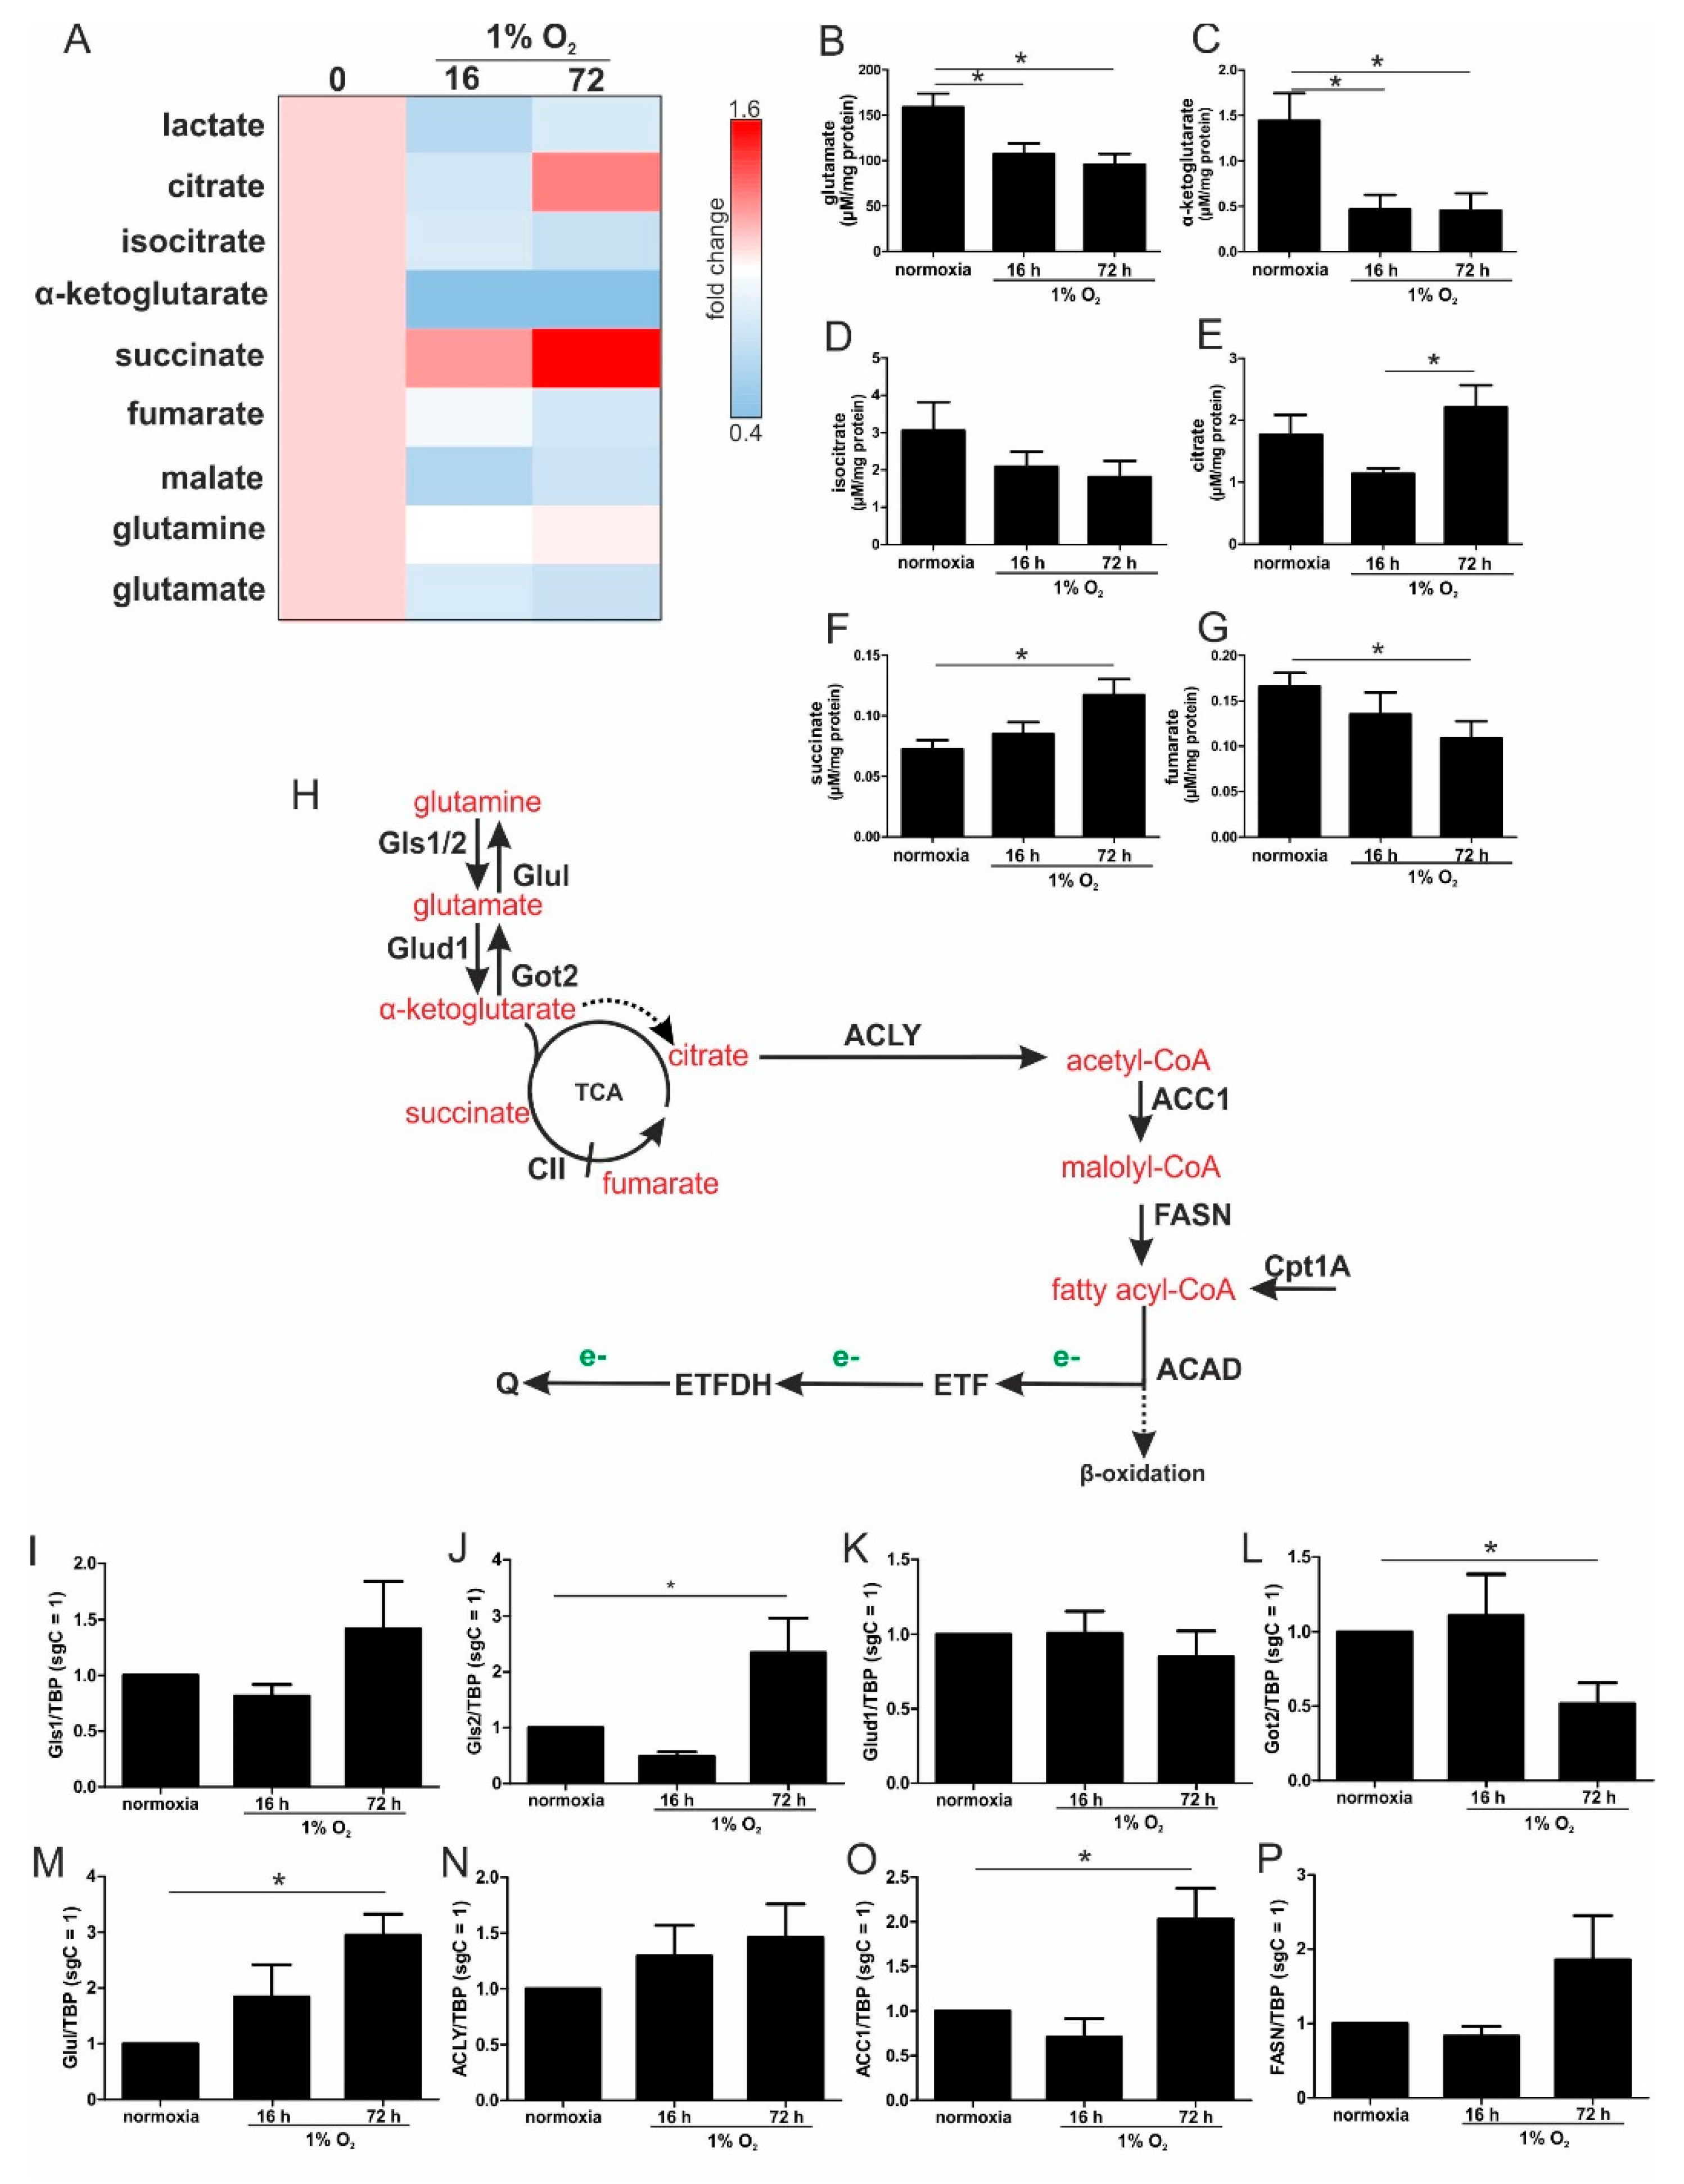
During the progression from acute to chronic hypoxia, we noticed a decline of HIF-1α, HIF-2α, as well as HIF-target gene expression [
5,
22]. Reaching this new ‘set point’, which is apparently distinct from acute hypoxic responses, cells may reset their metabolism accordingly. Since electrons from β-oxidation are transferred via ETFs to ubiquinone, oxygen consumption was measured with the inhibition of complex I and complex II, leaving ETFs as a possible electron source. Under these conditions, we noticed an increase in respiration under chronic hypoxia compared to normoxia, pointing to the importance of ETFs. The ETF-dependency was proven by a siRNA-mediated knockdown of ETFDH, reducing respiration under chronic hypoxia to background levels. In addition, we observed a decrease in ΔΨm in siETFDH cells under chronic hypoxia. Apparently, the ETF system appears to be crucial for maintaining mitochondrial integrity, guaranteeing/preserving their crucial functions in metabolism (e.g., glutaminolysis and β-oxidation) and signal transduction (e.g., the formation of reactive oxygen species and inflammatory signaling). Looking for distinct metabolites, succinate accumulated under chronic hypoxia, while fumarate decreased, which implied a lower complex II activity. This constellation makes an electron transfer via ETFs in an exclusive way, to fuel ETC under chronic hypoxia, and it explains the increased dependency on fatty acid oxidation. Besides, we noticed an increasing demand for glutamine under chronic hypoxia. Also, levels of citrate increased under chronic hypoxia, and the mRNA expression of genes involved in glutamine breakdown pointed to the possibility that glutamine is processed to α-ketoglutarate and citrate. Citrate in turn can be used for the production and metabolism of fatty acid oxidation via ACLY, ACC1, and FASN [
23]. Supporting our hypothesis of a metabolic switch to β-oxidation under chronic hypoxia, pulmonary artery endothelial cells expressed increased levels of FASN under chronic hypoxic conditions to produce palmitate, which facilitates increased proliferation [
24]. In mesenchymal stem cells BNIP3 is needed under hypoxia to induce FASN, and to synthesize fatty acids [
25]. Restricting electron flow into the ETC via ETFs under chronic hypoxia fits with the reduced availability of oxygen but leaves the mitochondria as the central organelles in metabolism intact. A therapeutic approach uses etomoxir to inhibit β-oxidation in tumors, and to enhance the impact of irradiation [
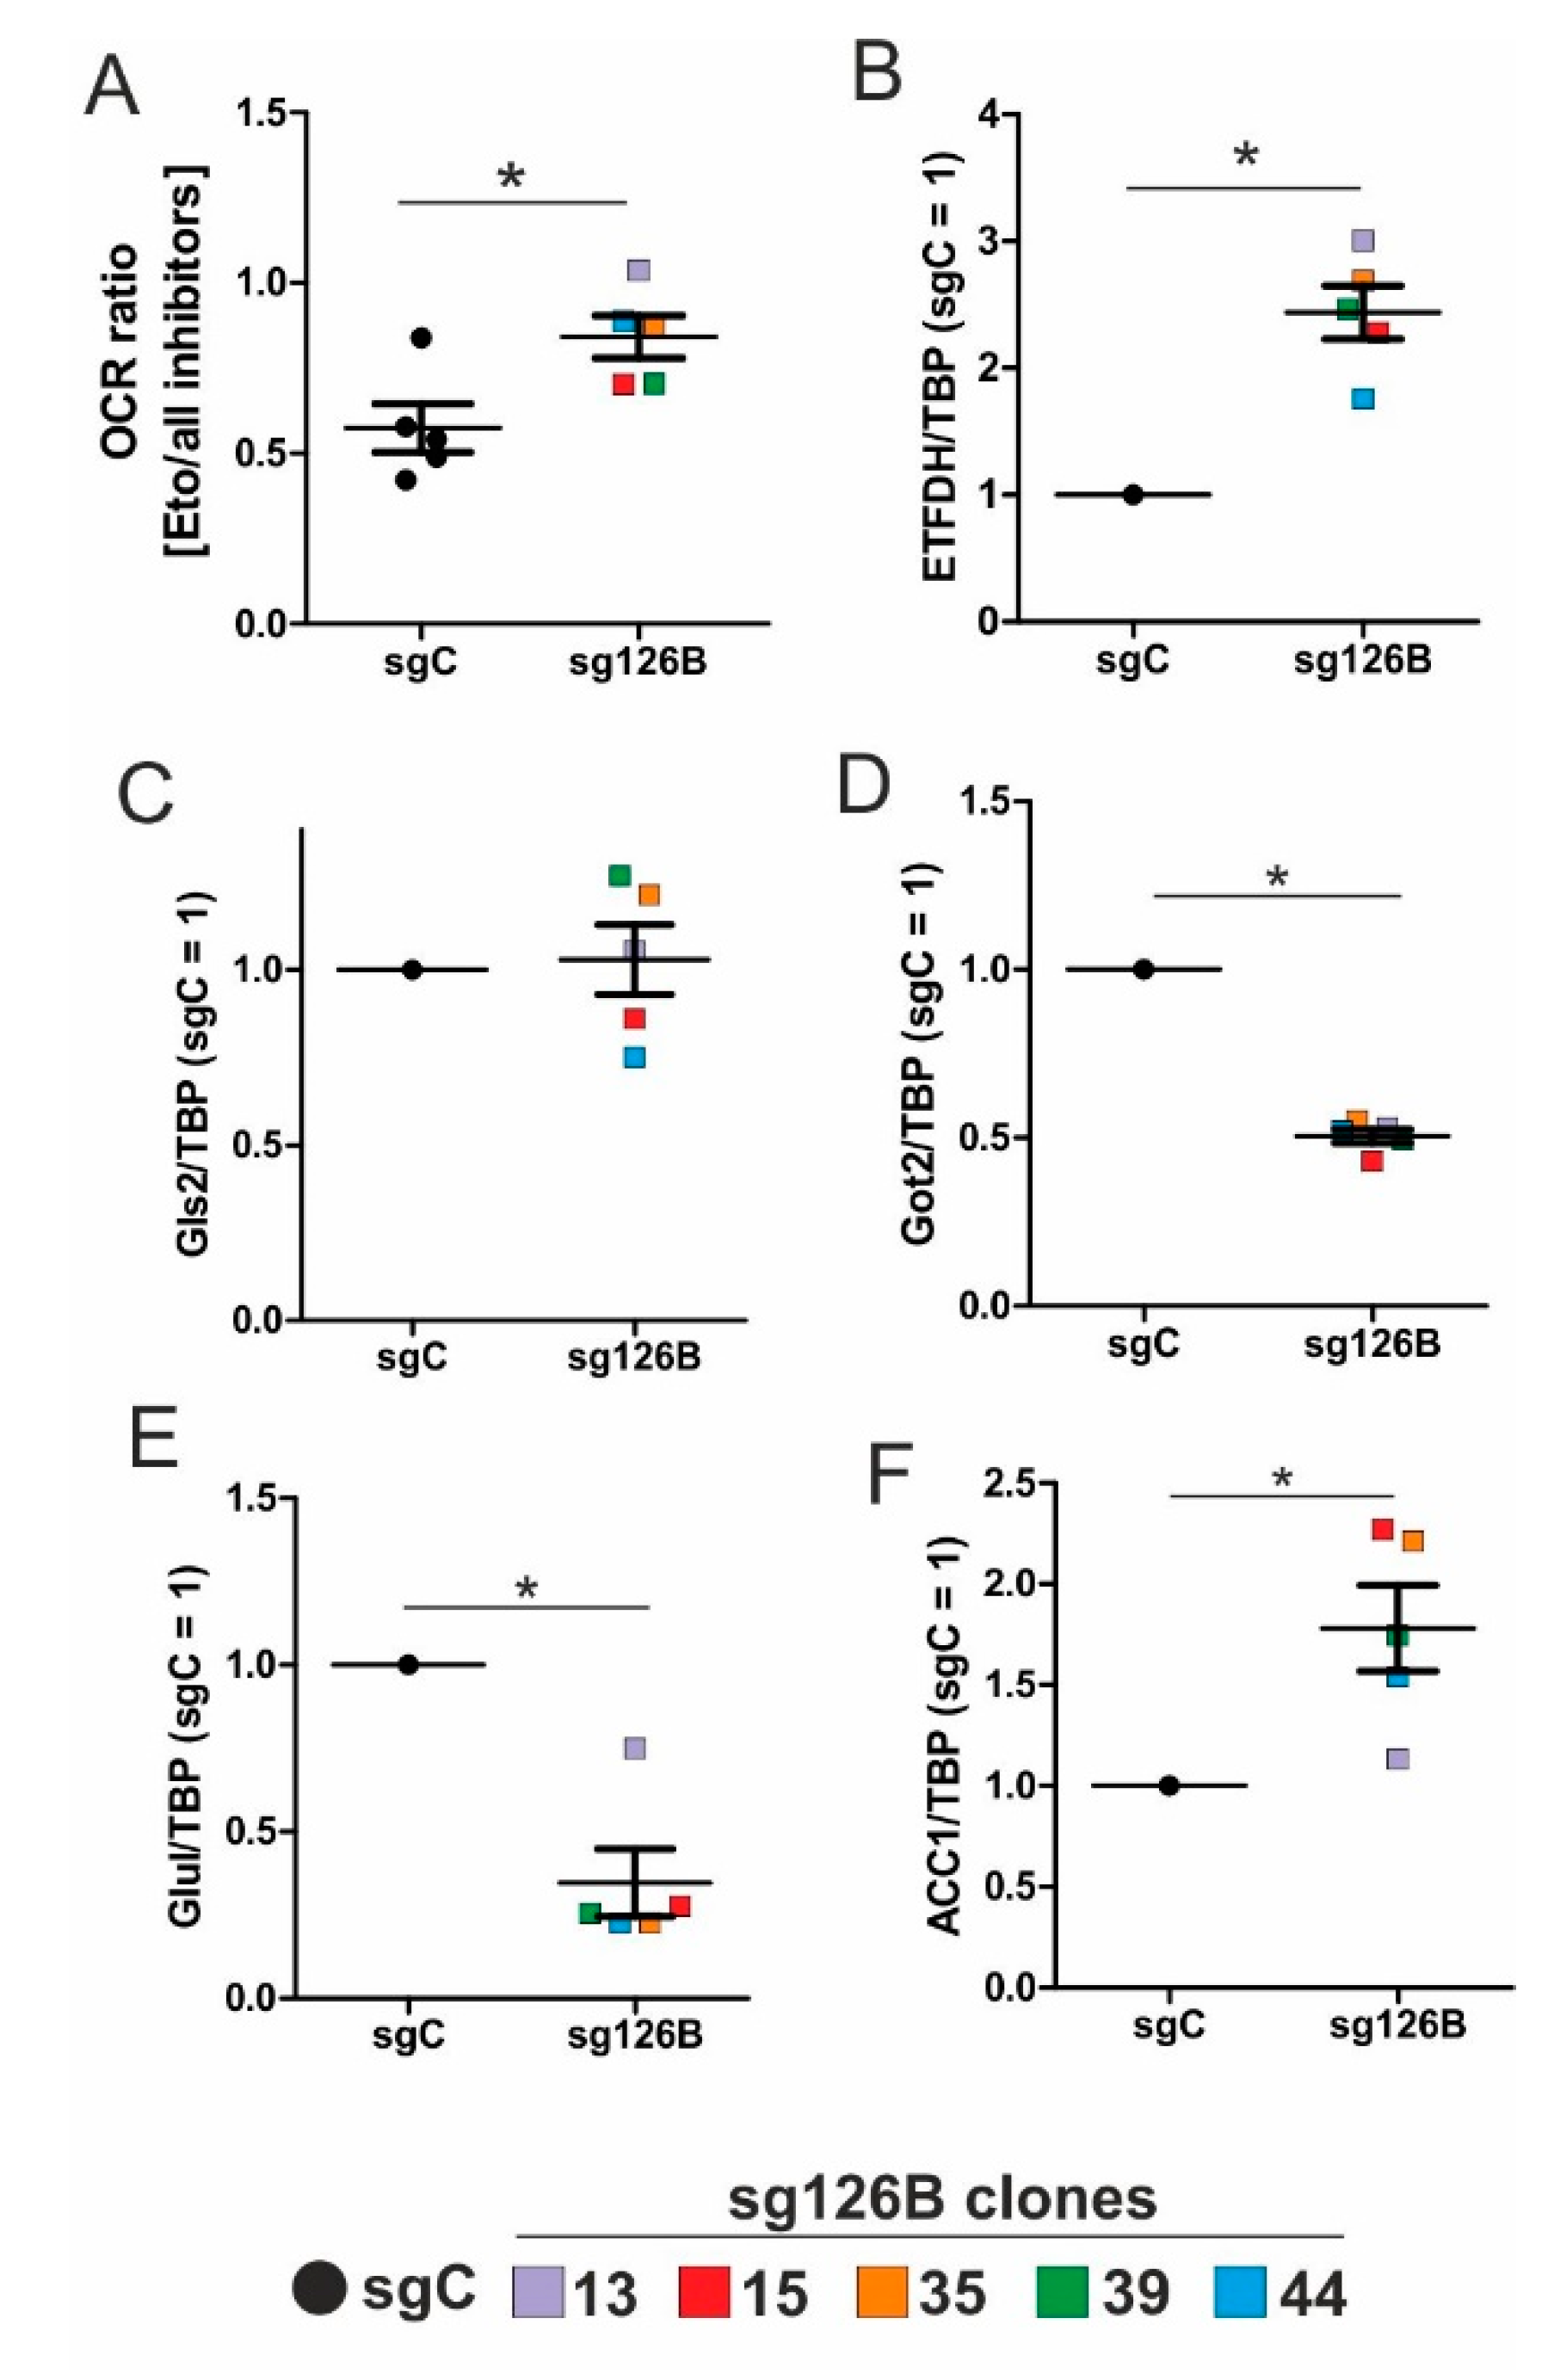
26]. This approach especially targets hypoxic cells, which, according to our study, are highly dependent on β-oxidation. To explore whether the decrease of complex I under chronic hypoxia might be sufficient to induce this metabolic switch, the complex I assembly factor TMEM126B was depleted in THP-1 cells, which reduced complex I abundance and activity. Interestingly, sg1261B cells reflect several characteristics of chronic hypoxic cells. Of importance, these cells also show a strong dependency on fatty acid oxidation. β-oxidation might be a critical pathway to compensate for a severe complex I deficiency, and to maintain mitochondrial integrity. Normally, fatty acid synthesis and β-oxidation are reciprocally regulated, in order to avoid a futile cycle. Apparently this fundamental regulatory principle is overruled when cells adapt to stresses such as chronic hypoxia. The same phenomena of fatty acid synthesis simultaneously occurring alongside β-oxidation is reported for the adaptation to cold stress in brown adipose tissue [
27], or under conditions of acidosis [
28], pointing to unique metabolic profiles under potentially harmful cellular conditions. Corbet and coworkers reported an increase in acetylation during acidosis, which reduced mitochondrial complex I activity. In parallel, histone deacetylation resulted in a decline in ACC2 expression. This in turn allowed for the concomitance of fatty acid oxidation and synthesis via reductive carboxylation of glutamine-derived α-ketoglutarate, which subsequently supported complex I-independent oxidative phosphorylation. However, under our experimental conditions we ruled hypoxic-elicited acidosis out, as we frequently changed media, and moreover, we took the low capacity of monocytes to acidify the media into consideration. In addition, it might be of importance that ACC1, which was upregulated in our study, is cytosolic, and it is believed to be the primary acetyl-CoA carboxylase involved in de novo fatty-acid synthesis, while ACC2, studied by Corbet and coworkers, appears to regulate fatty-acid oxidation through the malonyl-CoA-mediated inhibition of Cpt1 [
29]. Nevertheless, an increase in histone acetylation due to alterations in ACC expression, which may alter the transcriptional profiles of cells, cannot be ruled out, and this needs consideration in further studies.
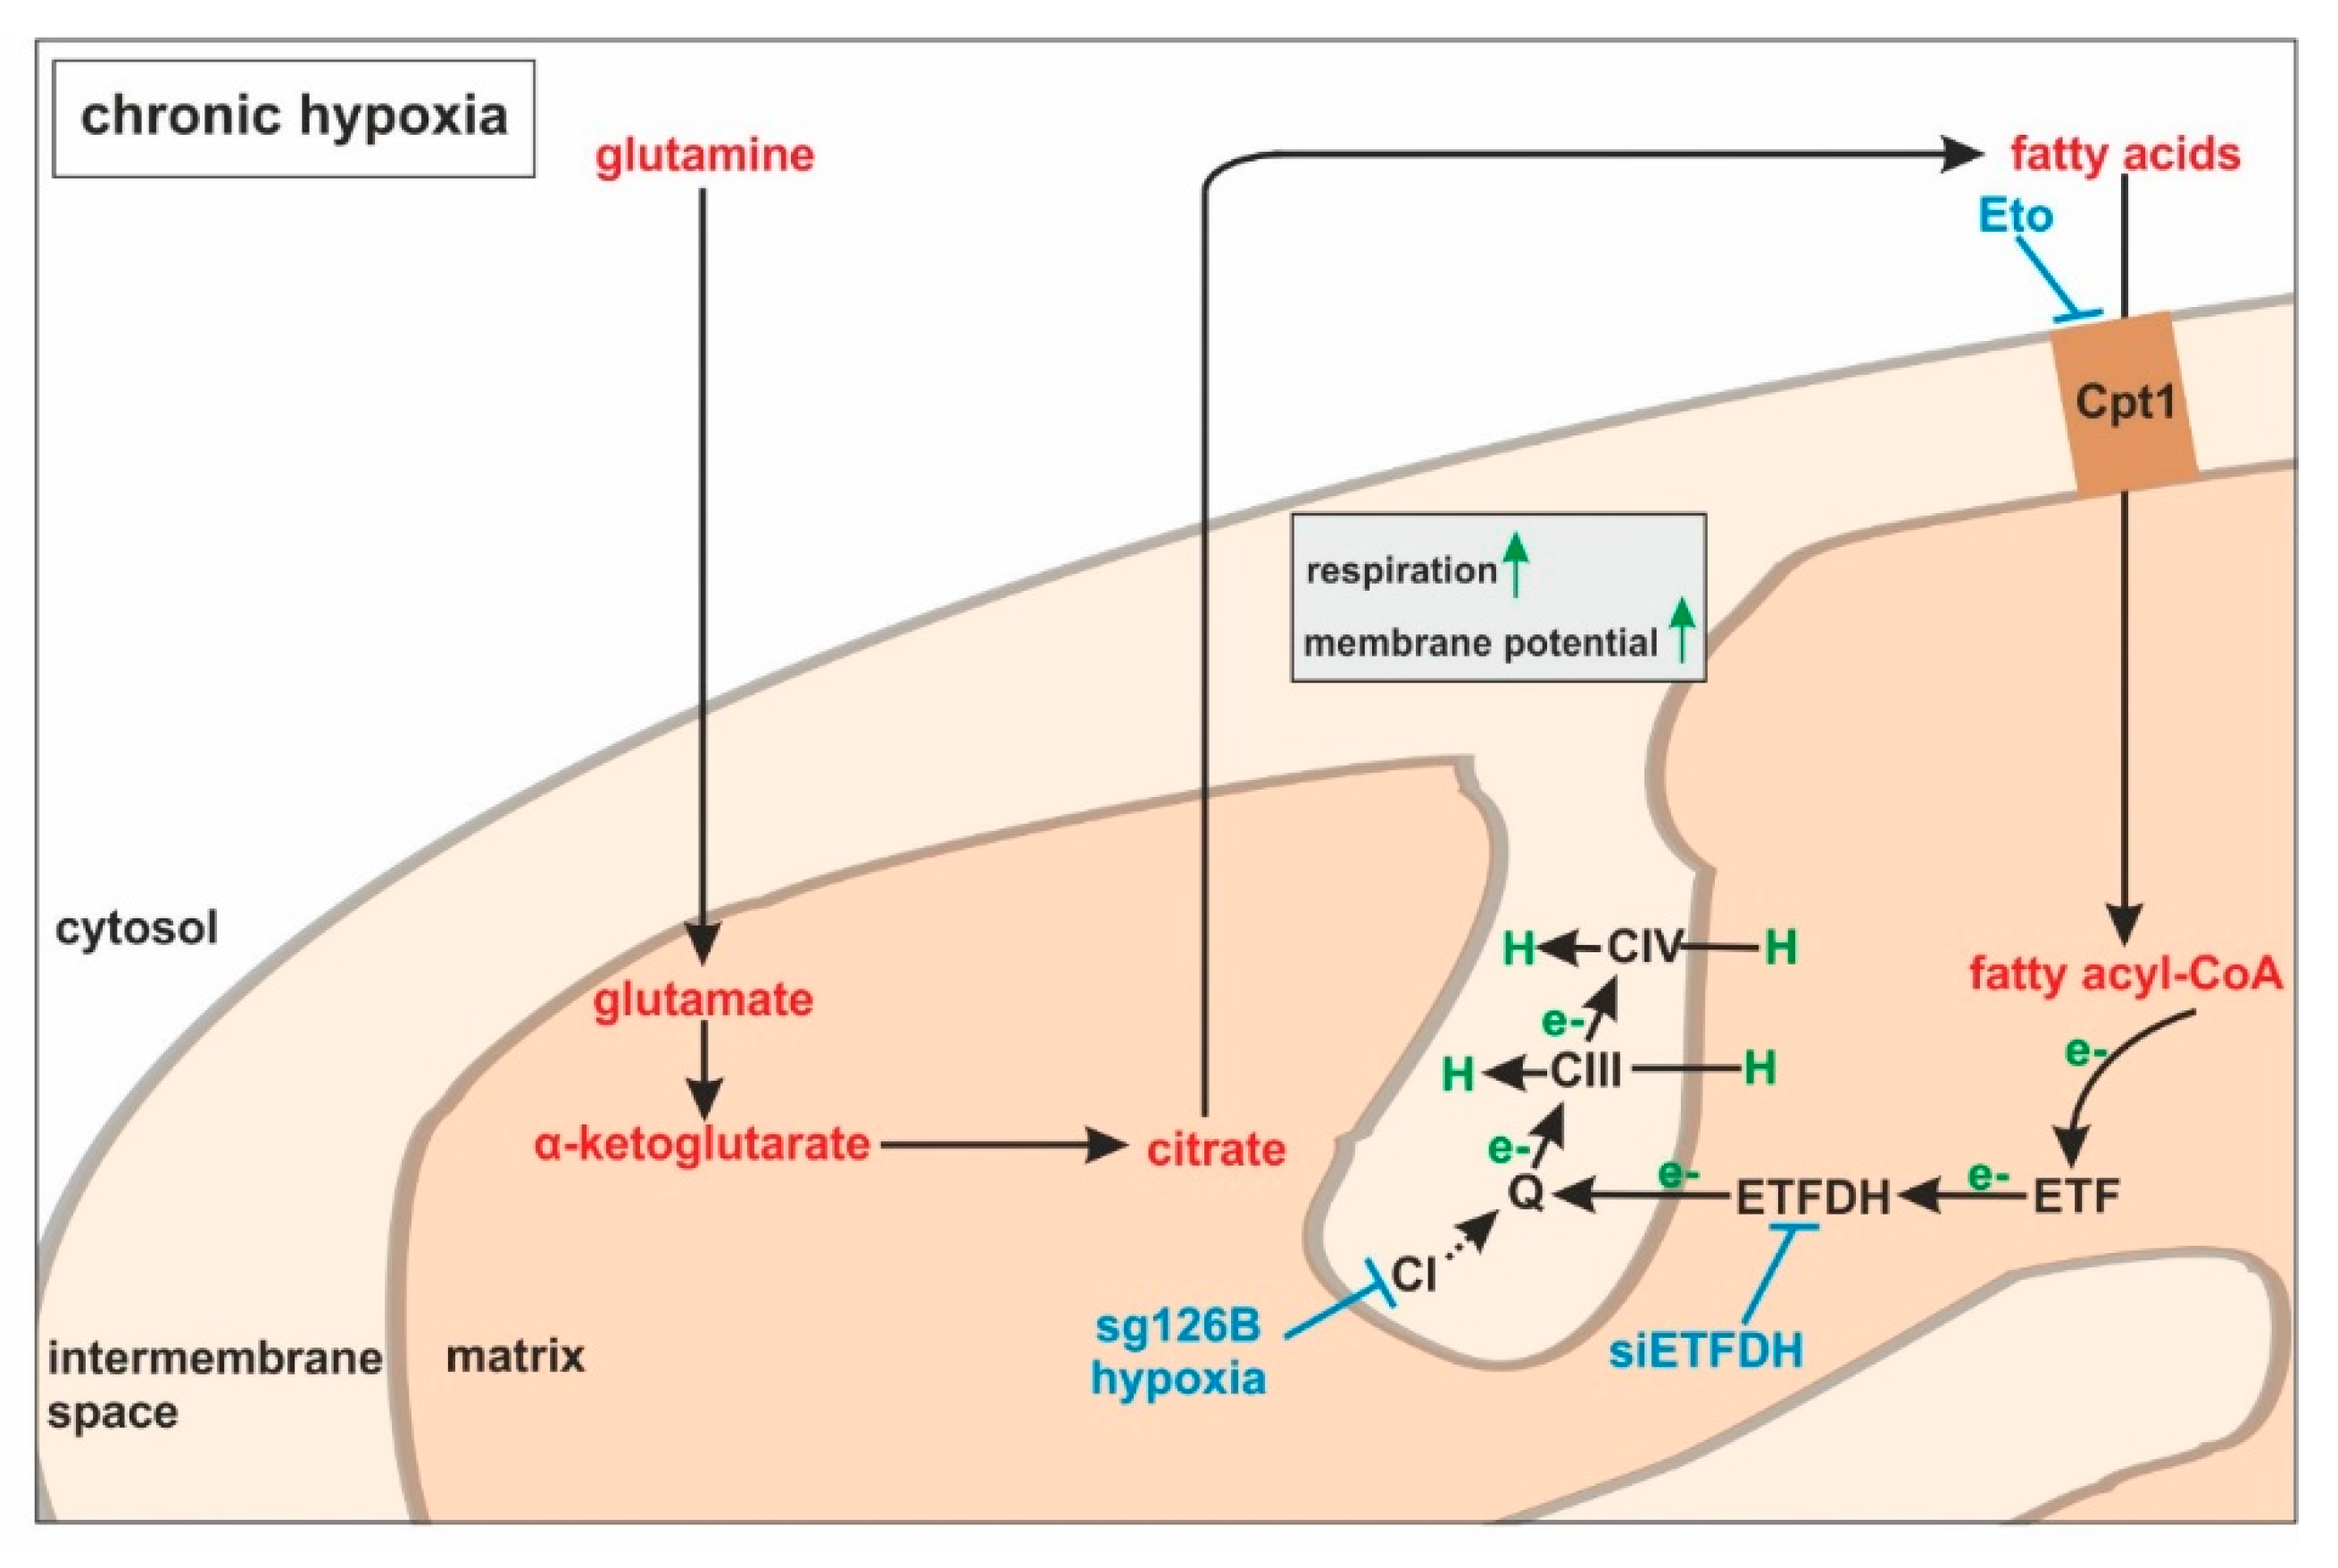
Large-scale metabolomic studies and enzyme expression, as well as activity assays, are needed to further verify our hypothesis, and to generalize conclusions for cells others than monocytes. Oxygen consumption and mitochondrial fuel analysis under chronic hypoxia, and metabolite exploration, as well as mRNA expression regulation of glutamine and fatty acid-metabolizing enzymes, favor electron flow via ETF, rather than complex I or complex II, to maintain mitochondrial integrity (
Figure 7).

 ,
, 


