Manganese Porphyrin-Based SOD Mimetics Produce Polysulfides from Hydrogen Sulfide

 ,
,  , and
, and 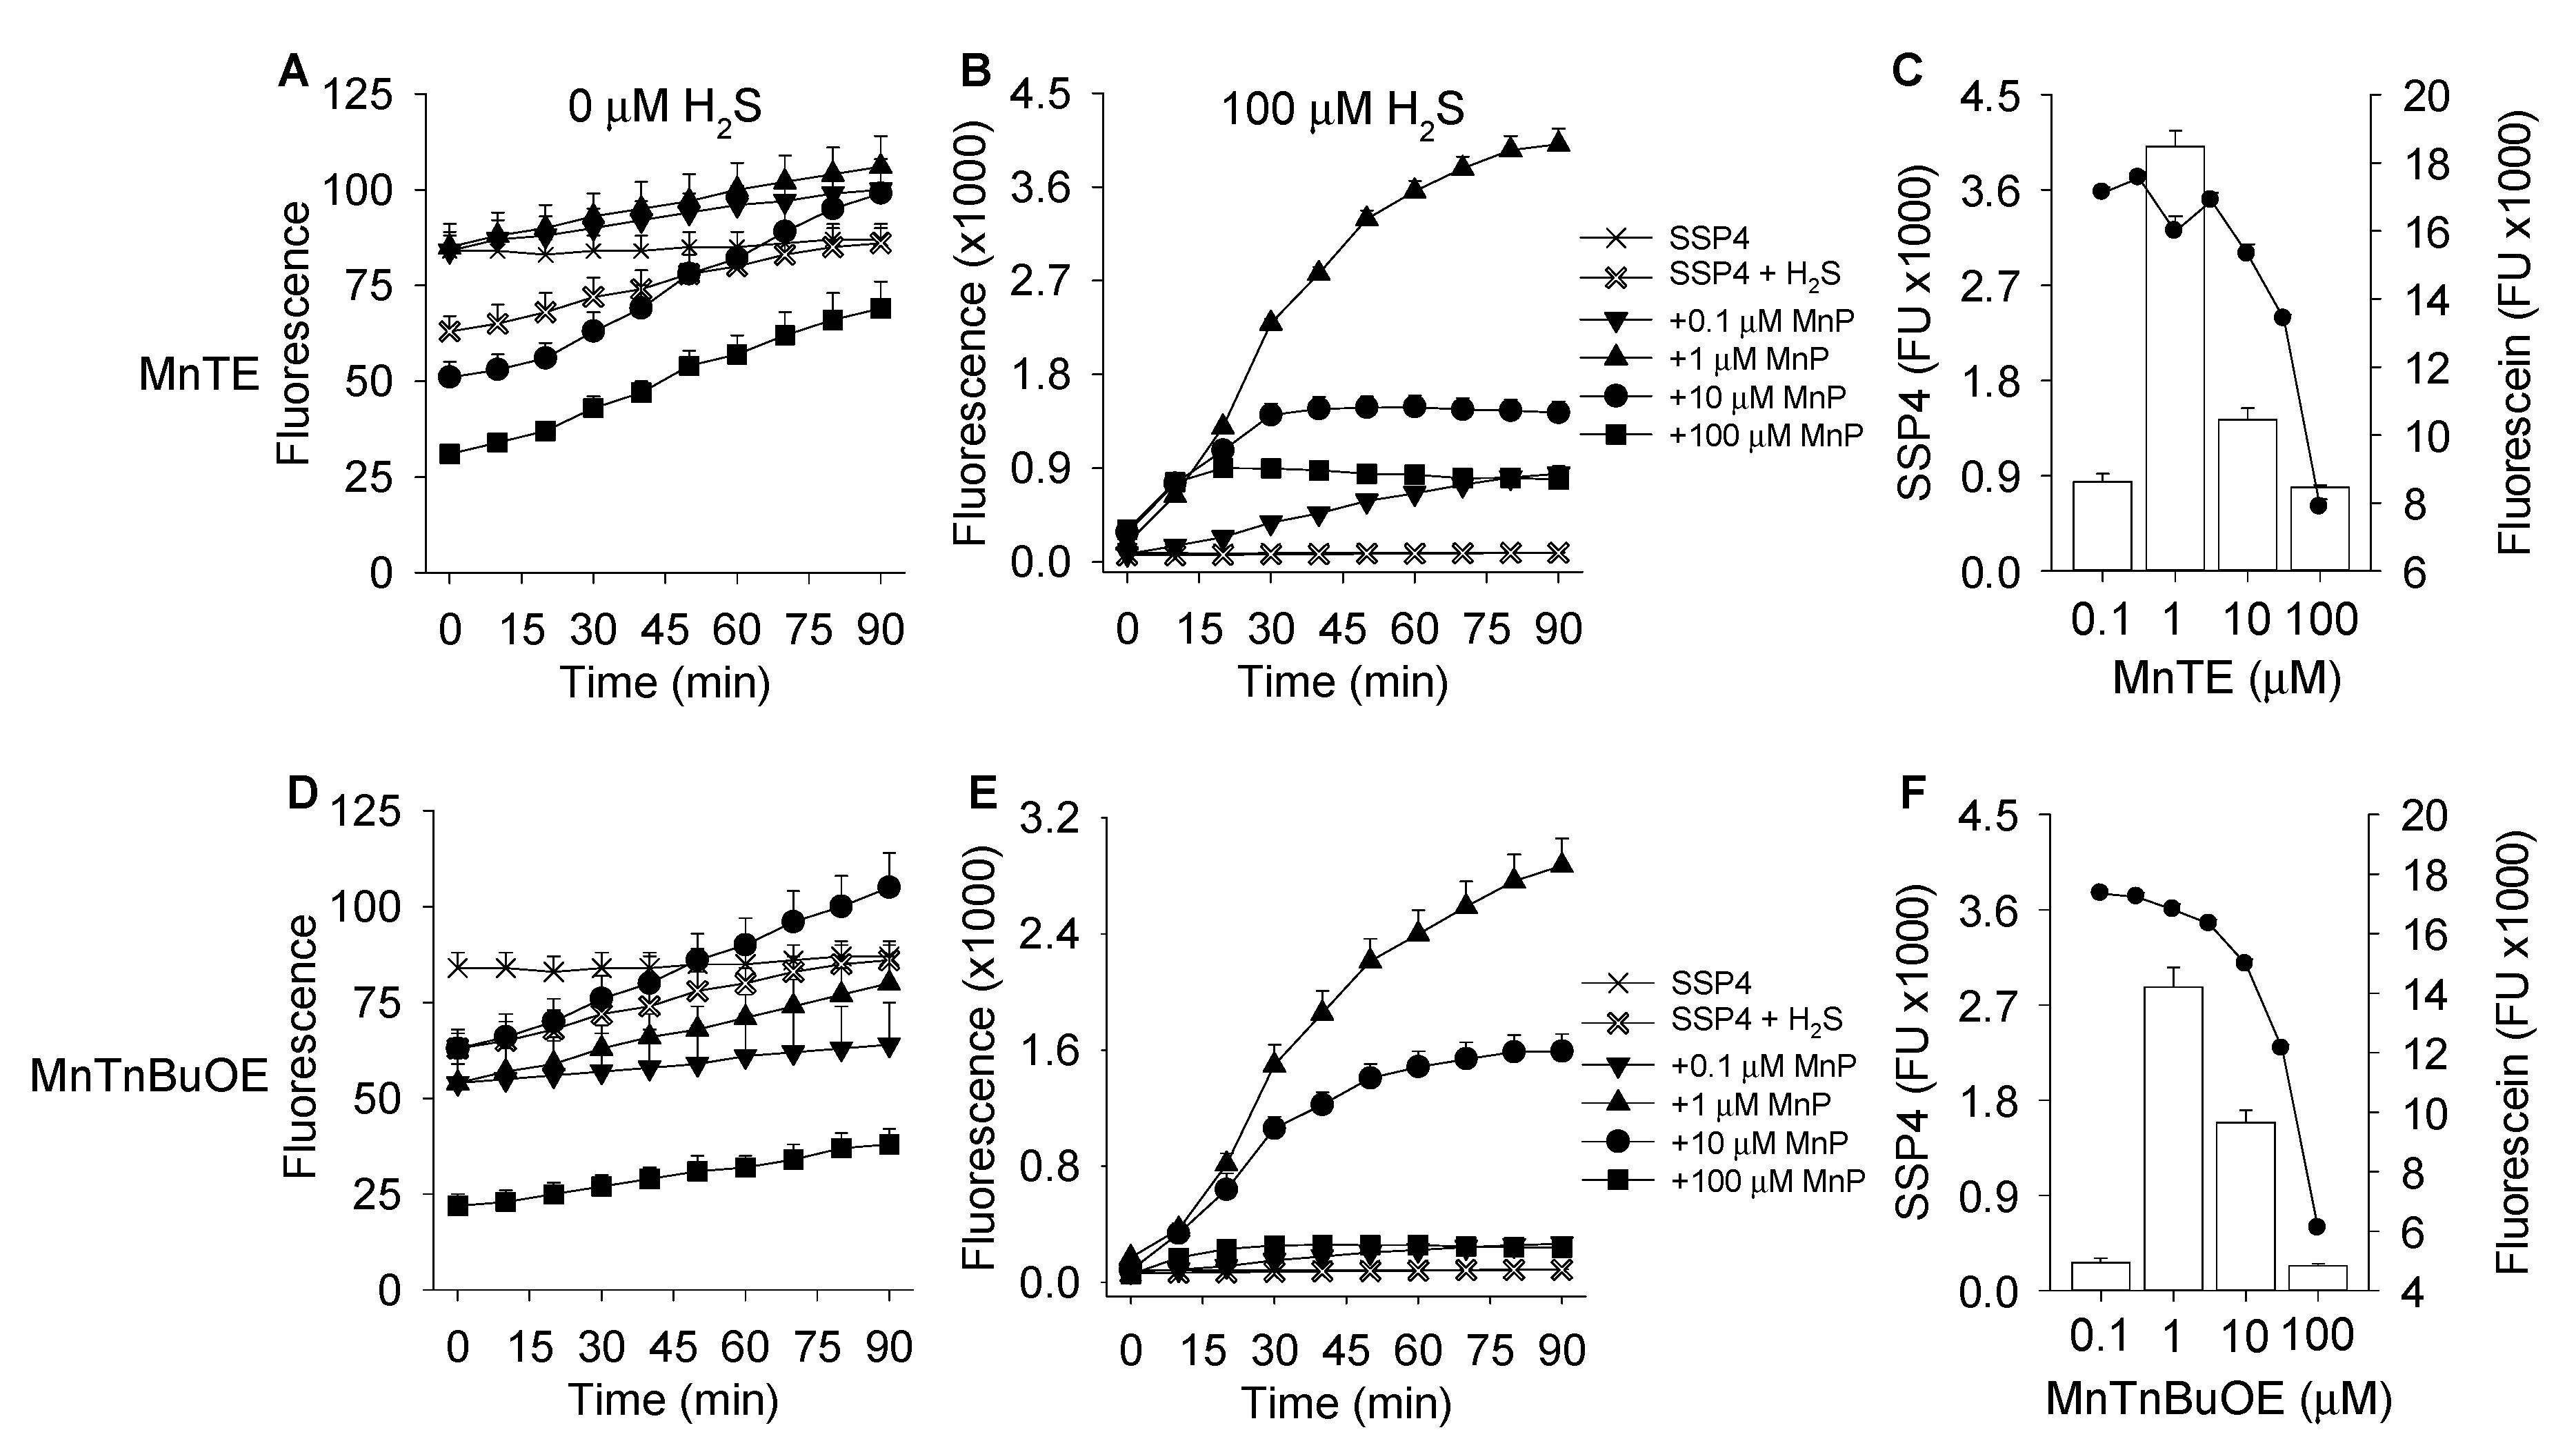
Abstract
:1. Introduction
2. Materials and Methods
2.1. Chemicals
2.2. Fluorescence Measurements
2.3. Hypoxia
2.4. Mass Spectrometry
2.5. Absorbance Spectroscopy
2.6. Oxygen Consumption
2.7. Calculations
3. Results
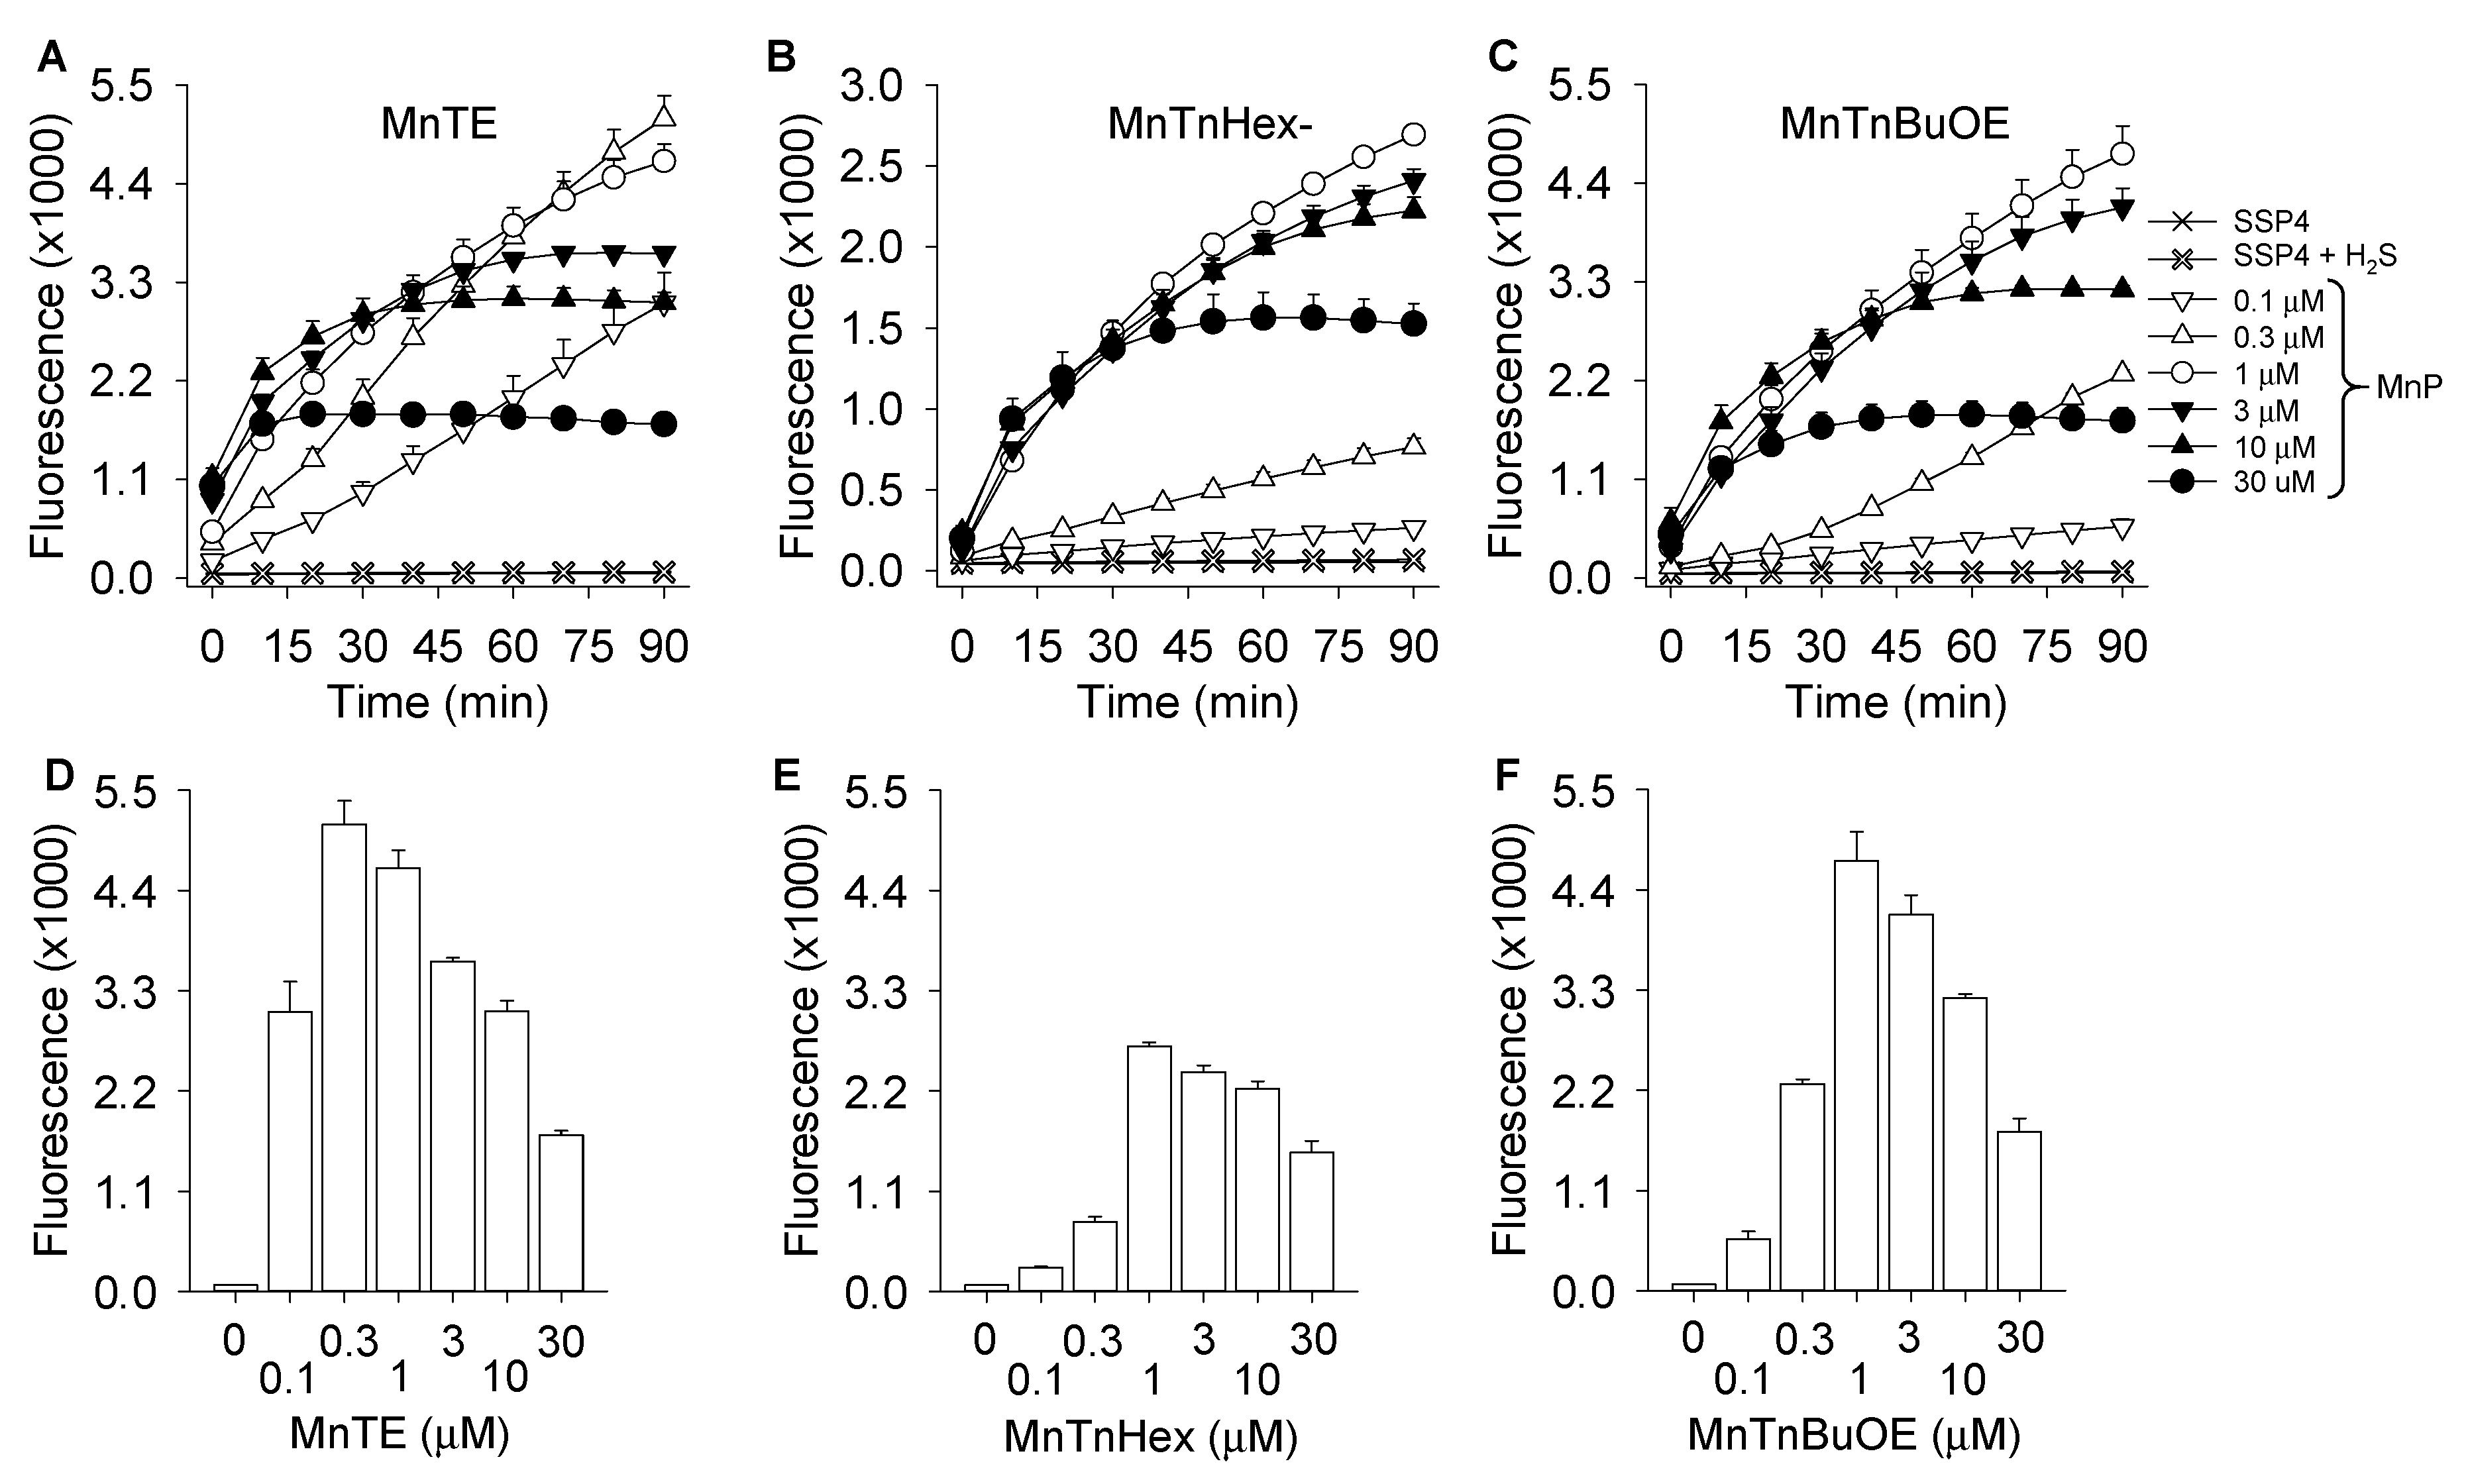
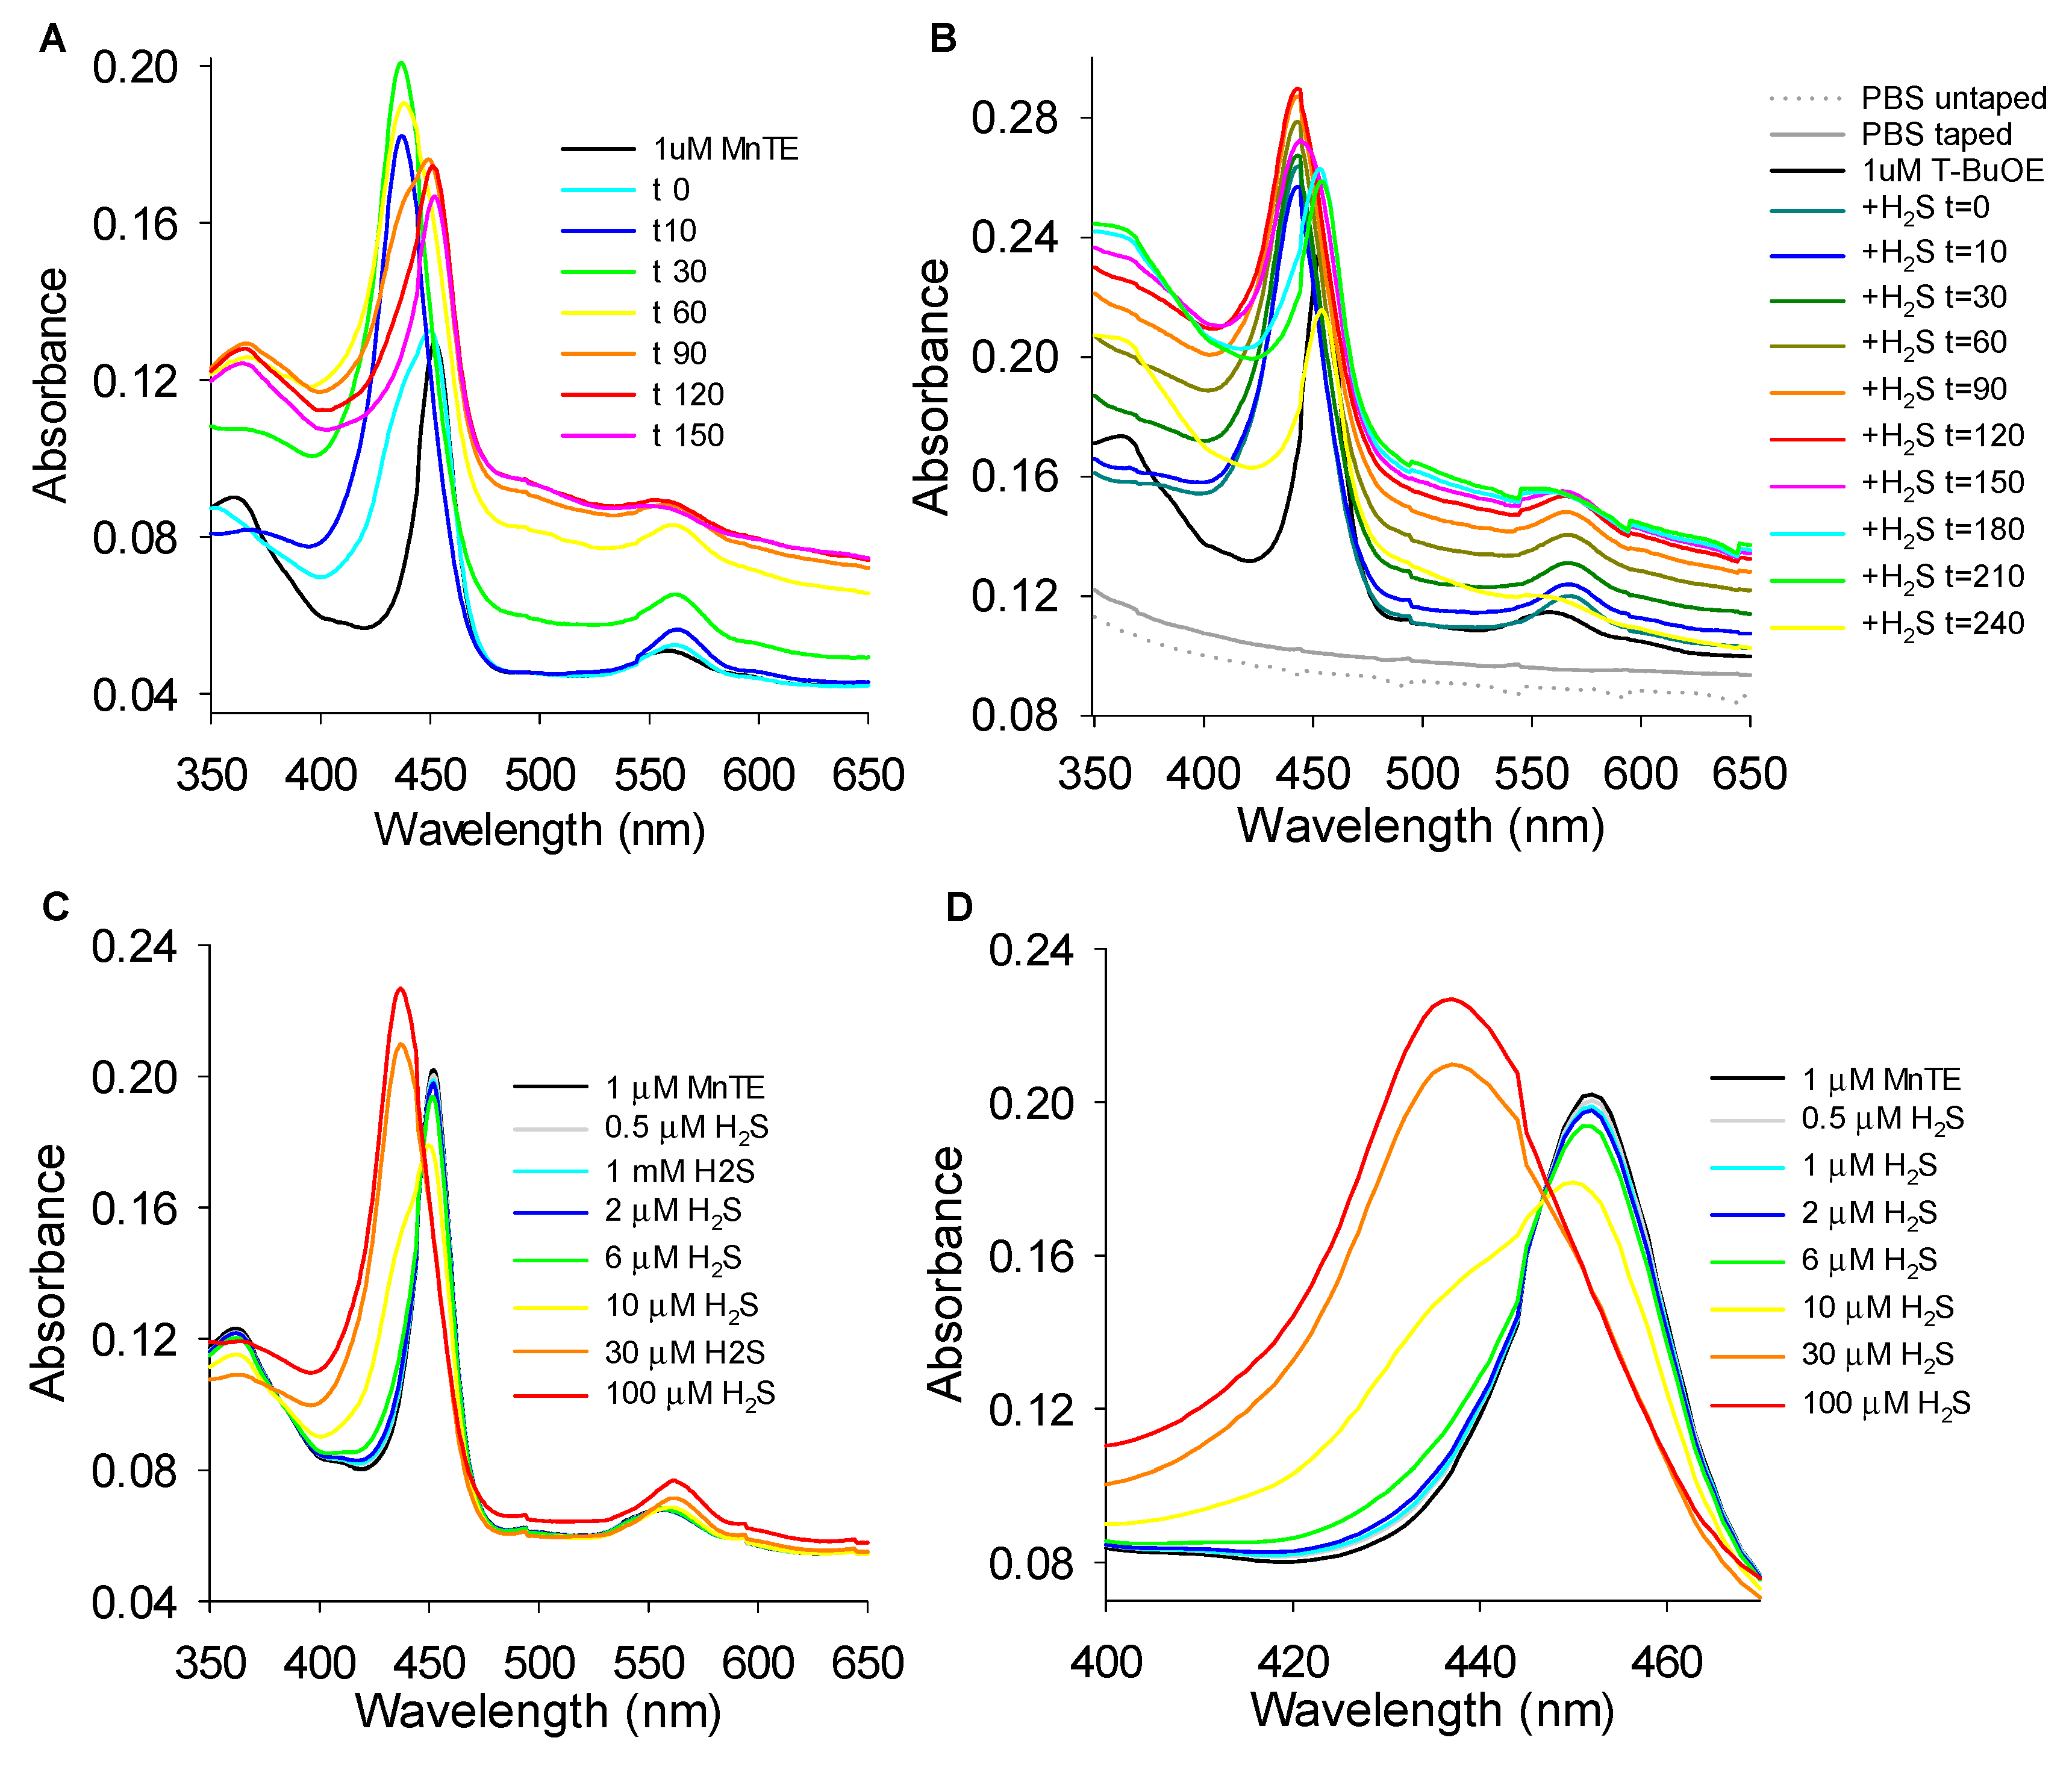
3.1. MnP-Catalyzed Polysulfide Generation from H2S with Variable MnP in PBS
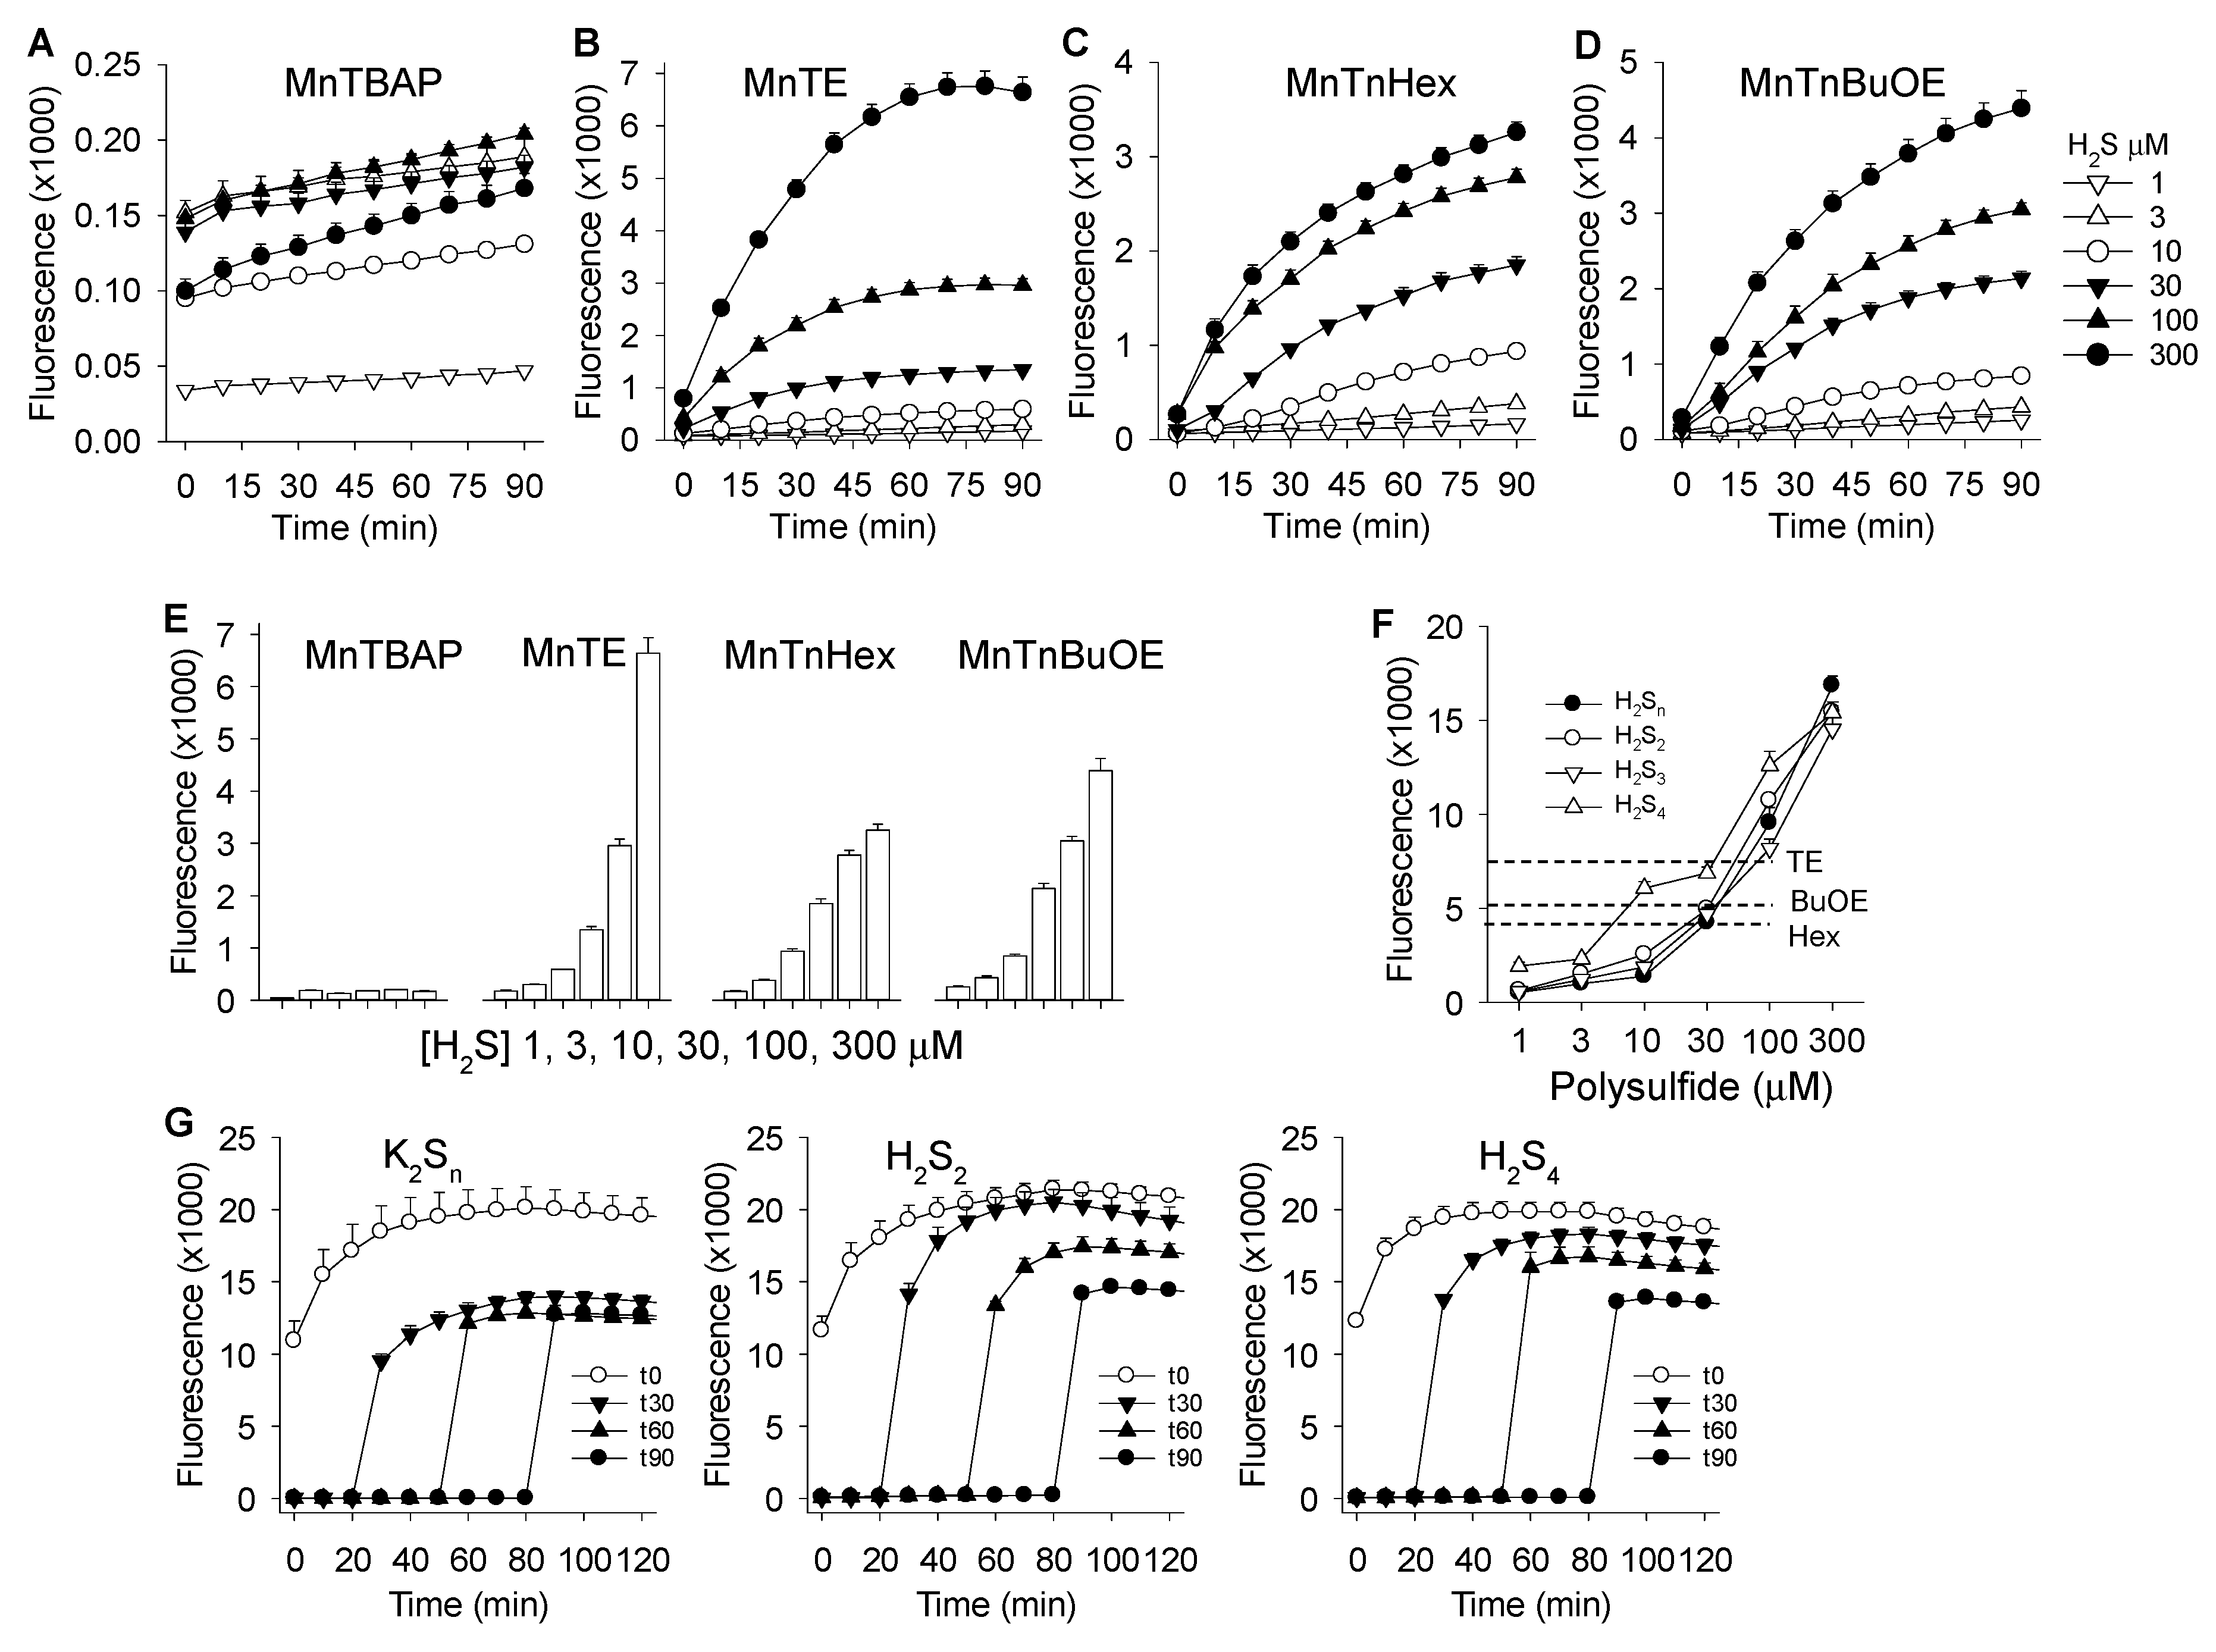
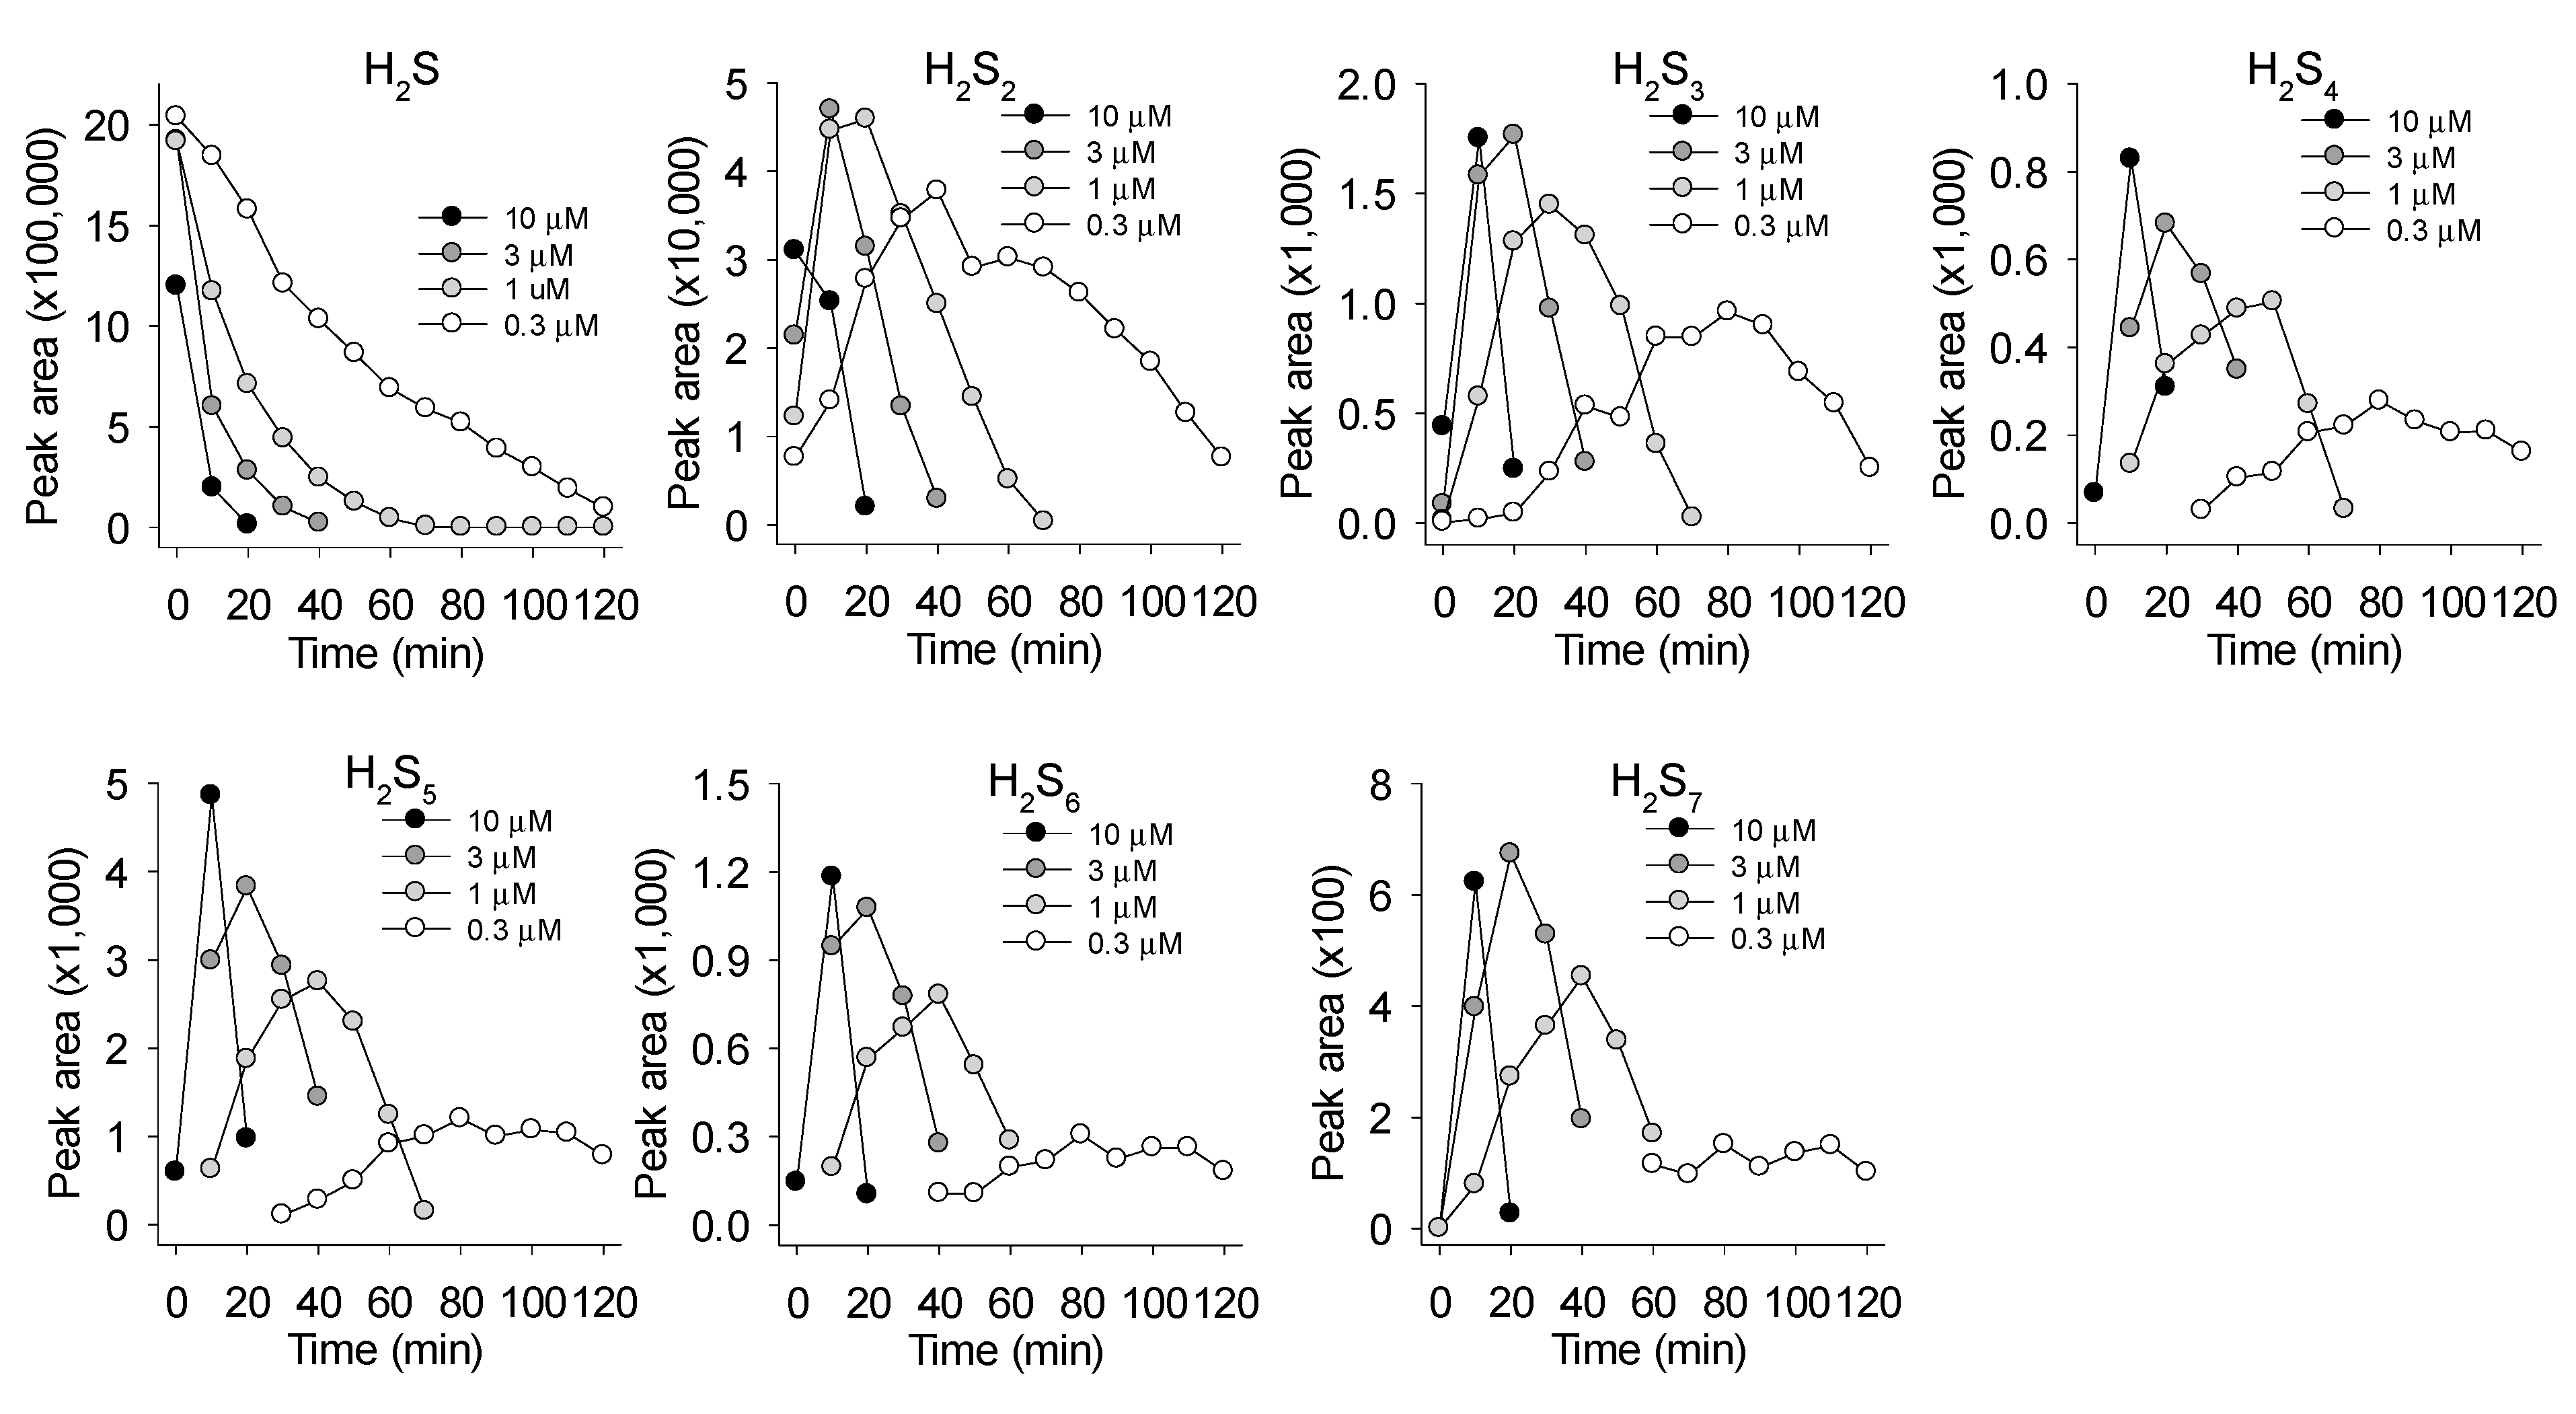
3.2. MnP-Catalyzed Polysulfide Generation from Variable H2S in PBS
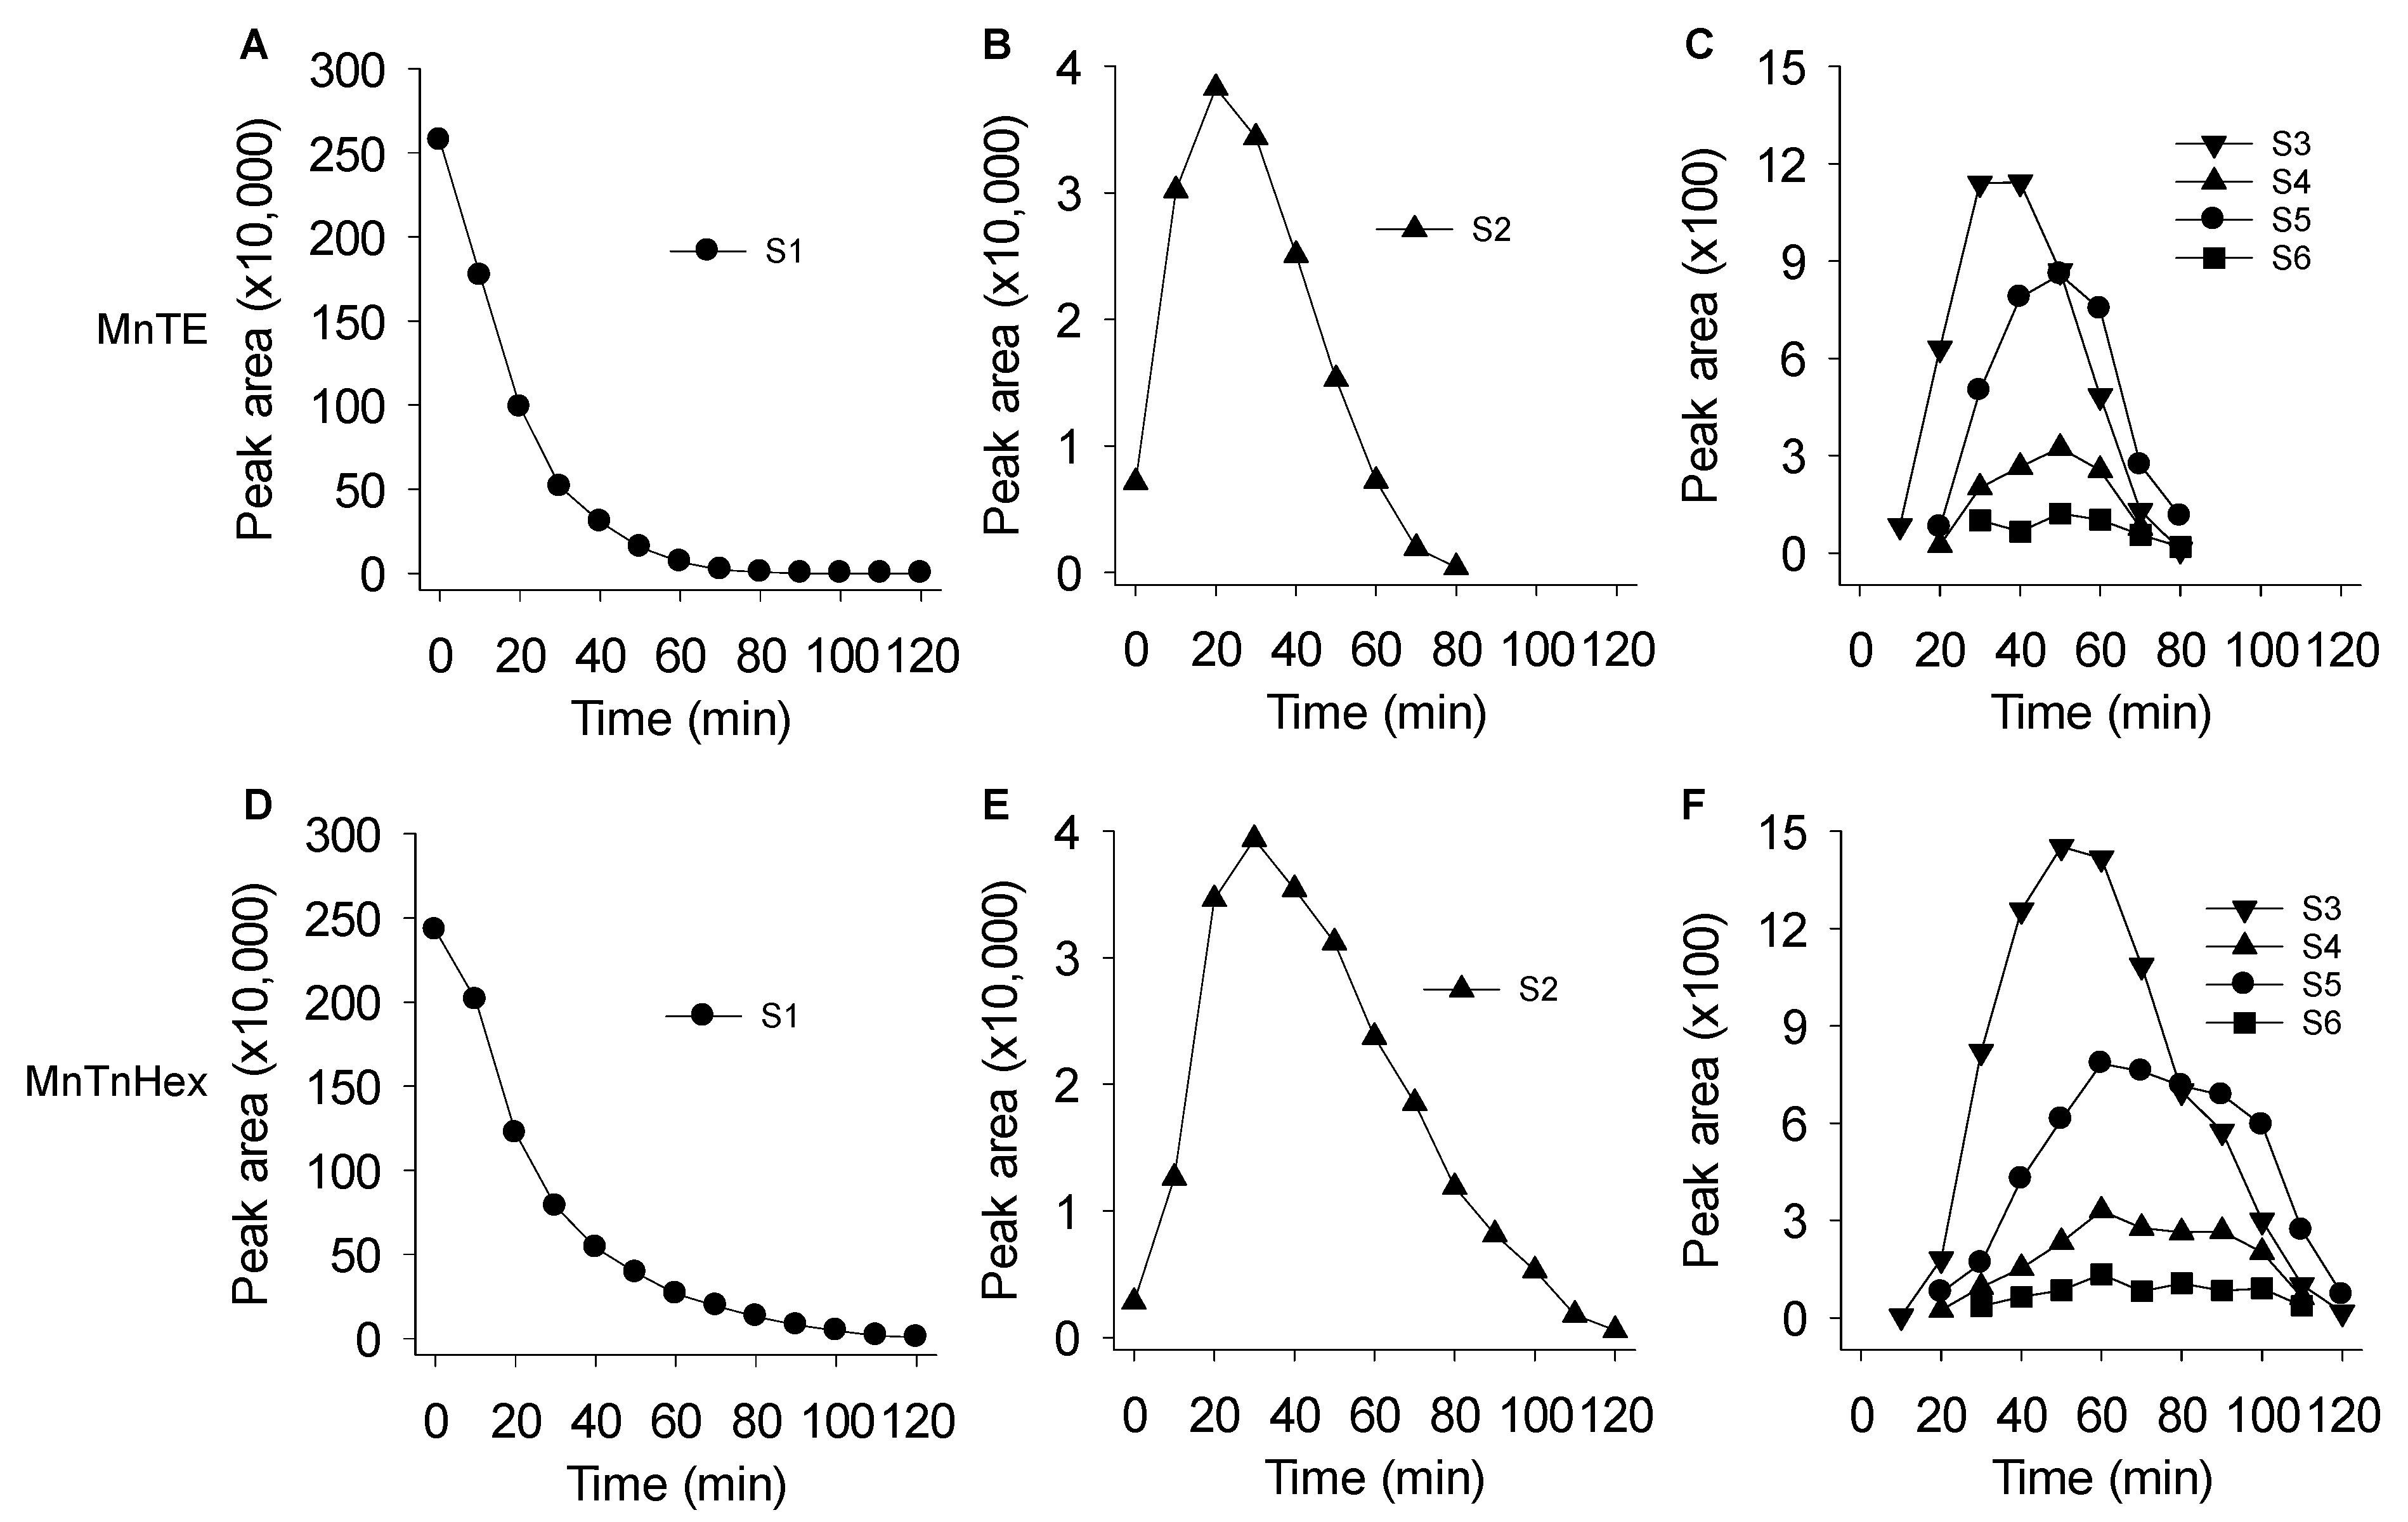
3.3. Mass Spectrometric Identification of Polysulfides Produced from H2S and MnPs
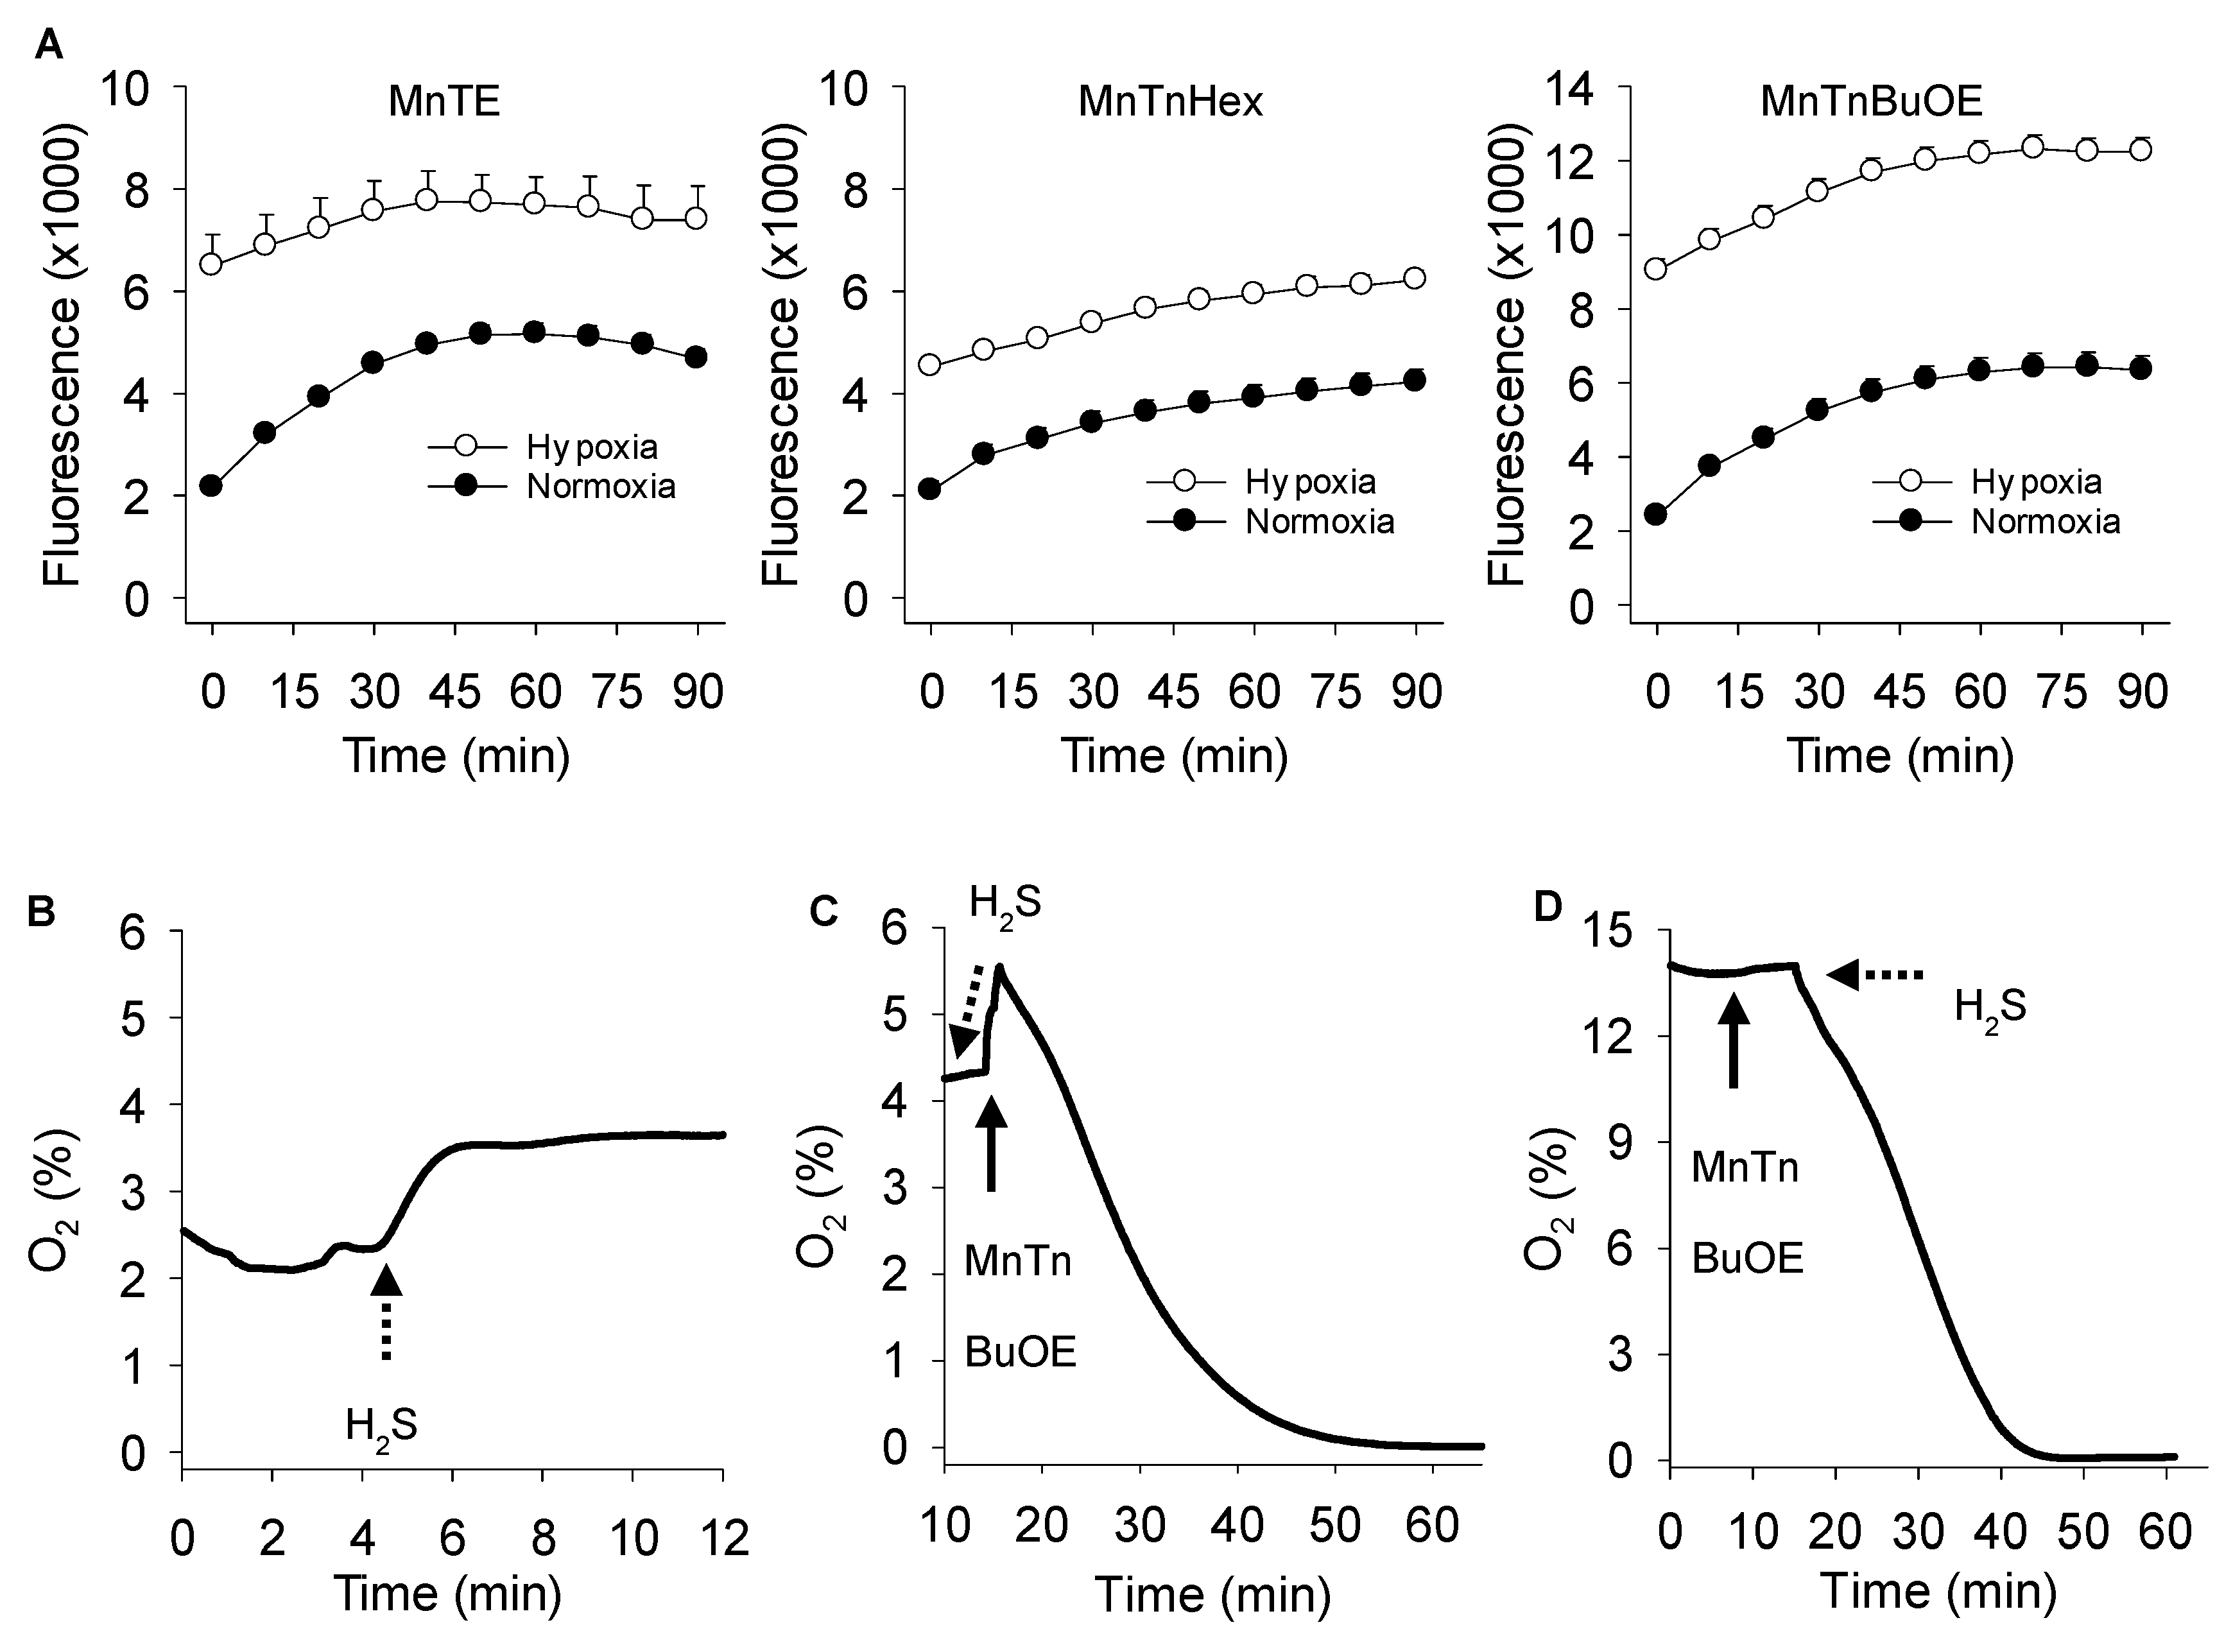
3.4. Effects of Oxygen on MnP Catalyzed Polysulfide Production
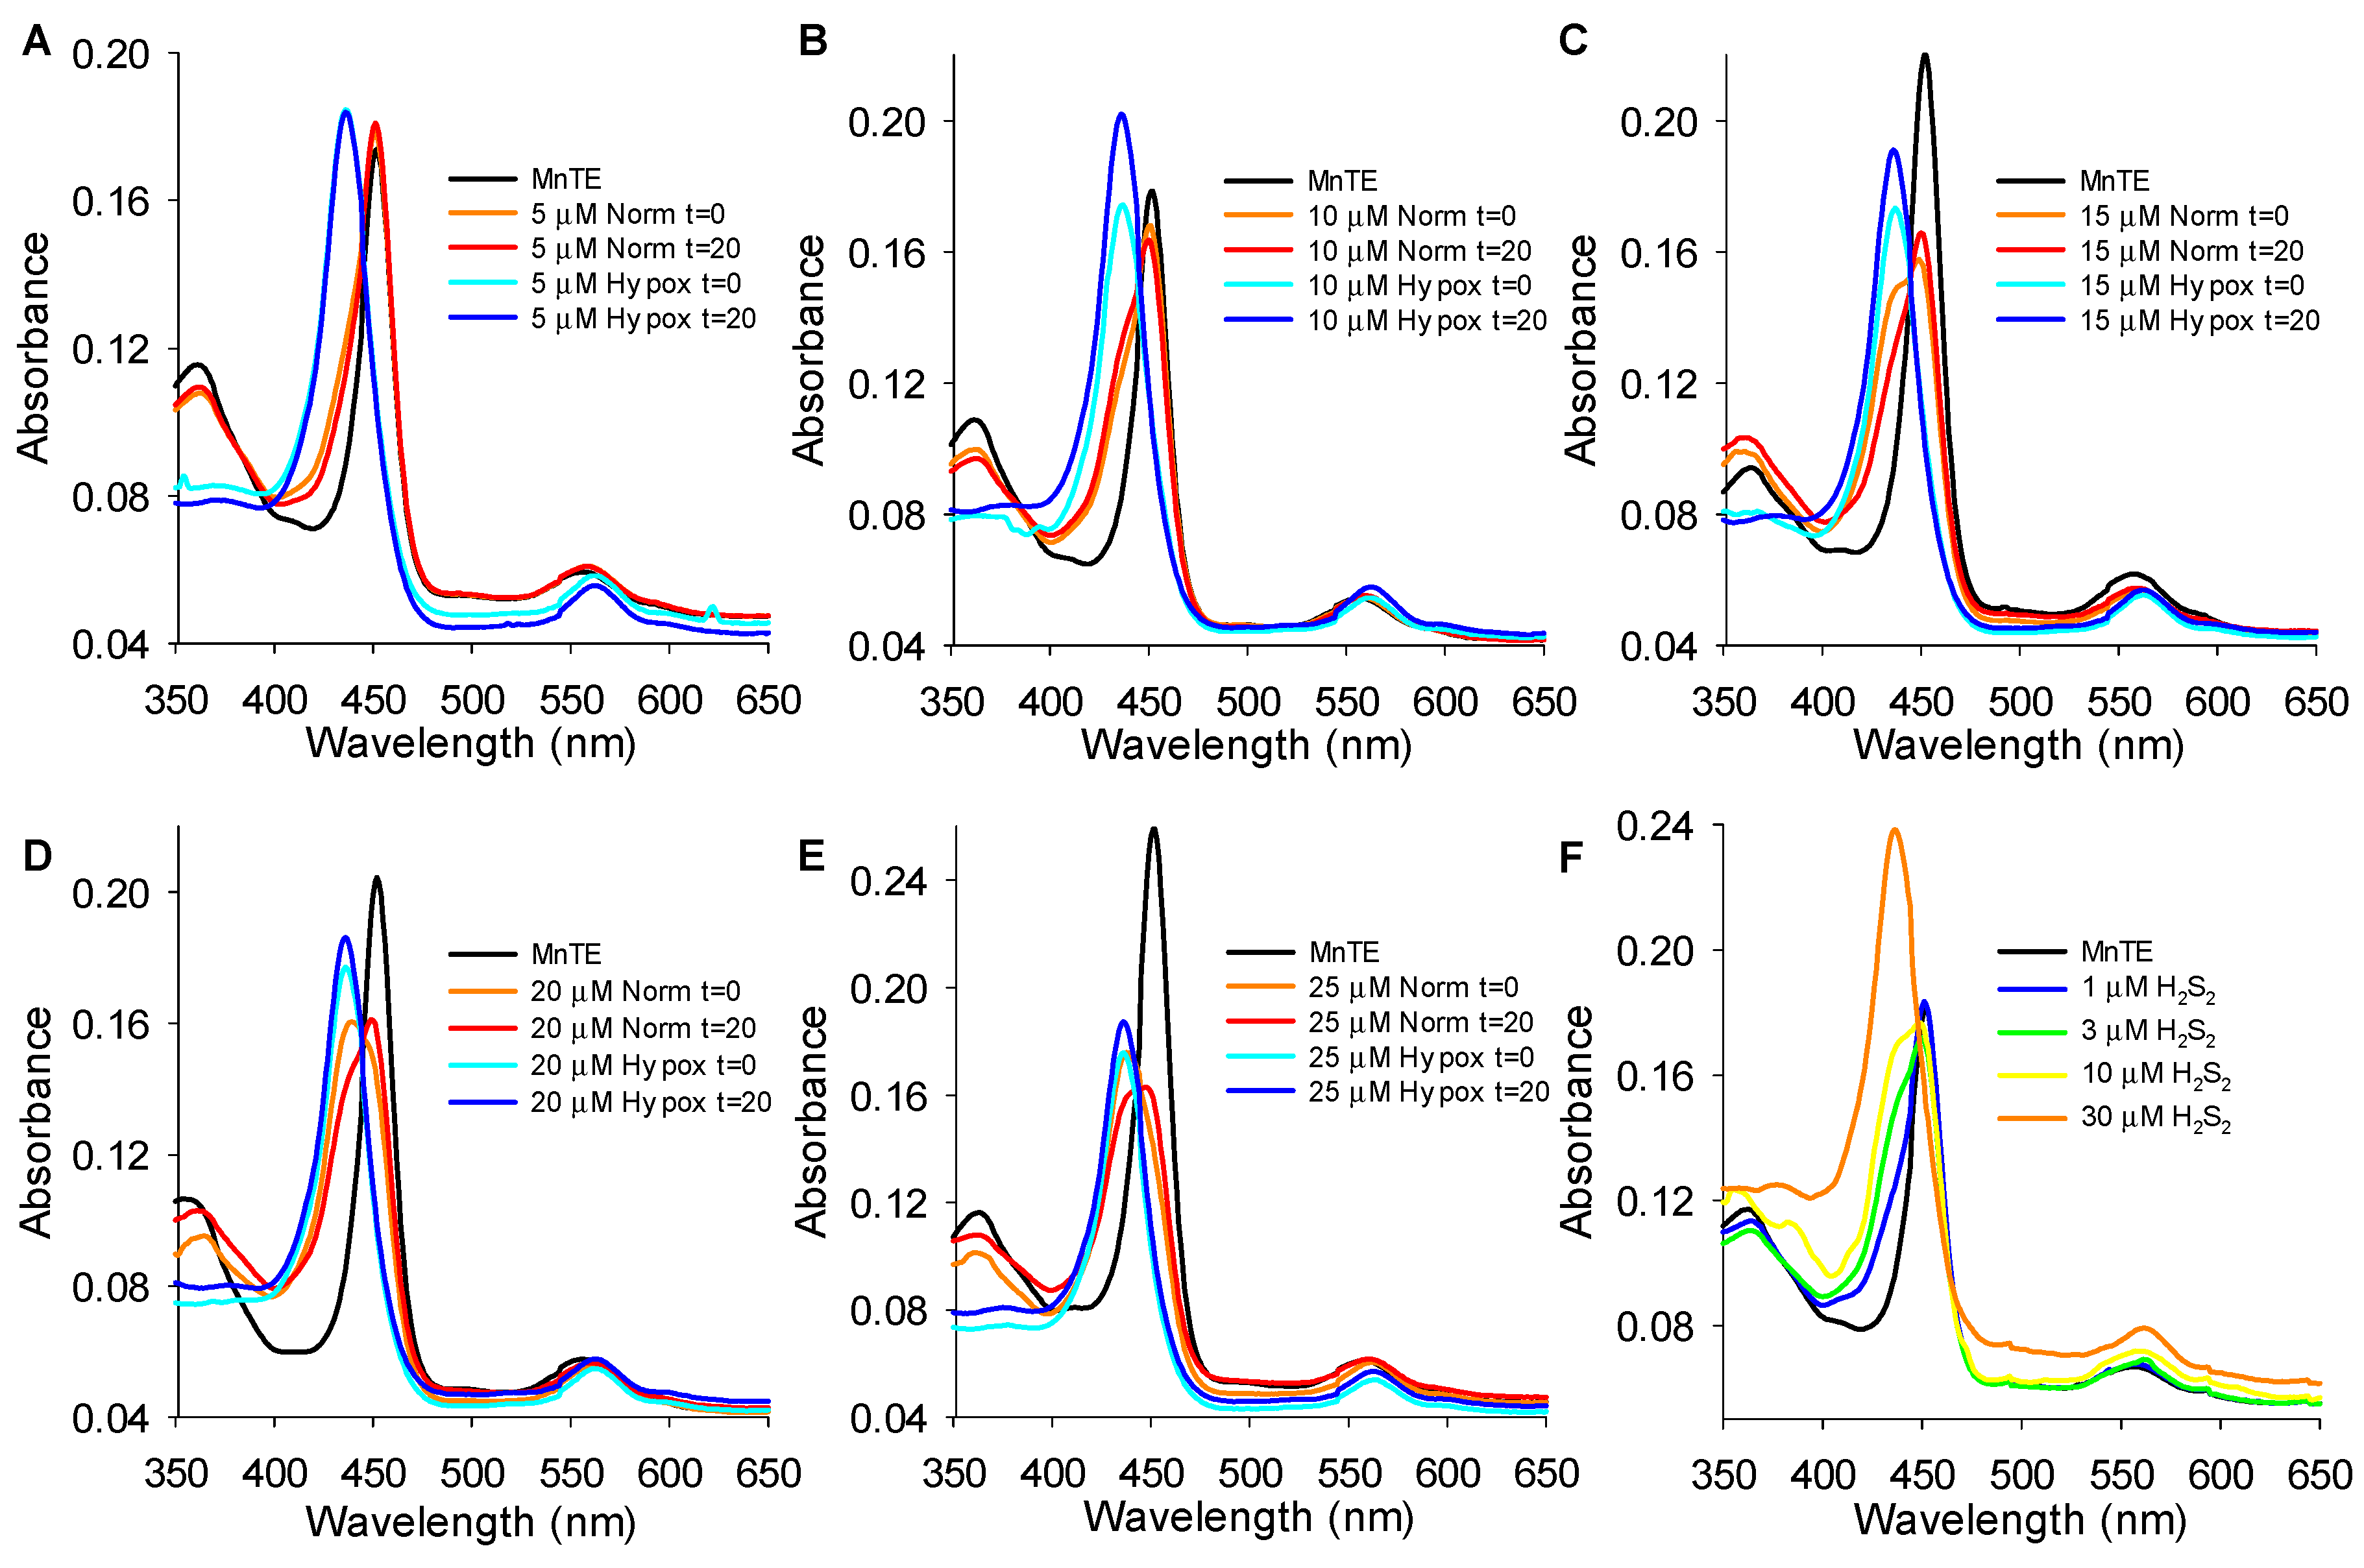
3.5. MnP Absorbance Spectra
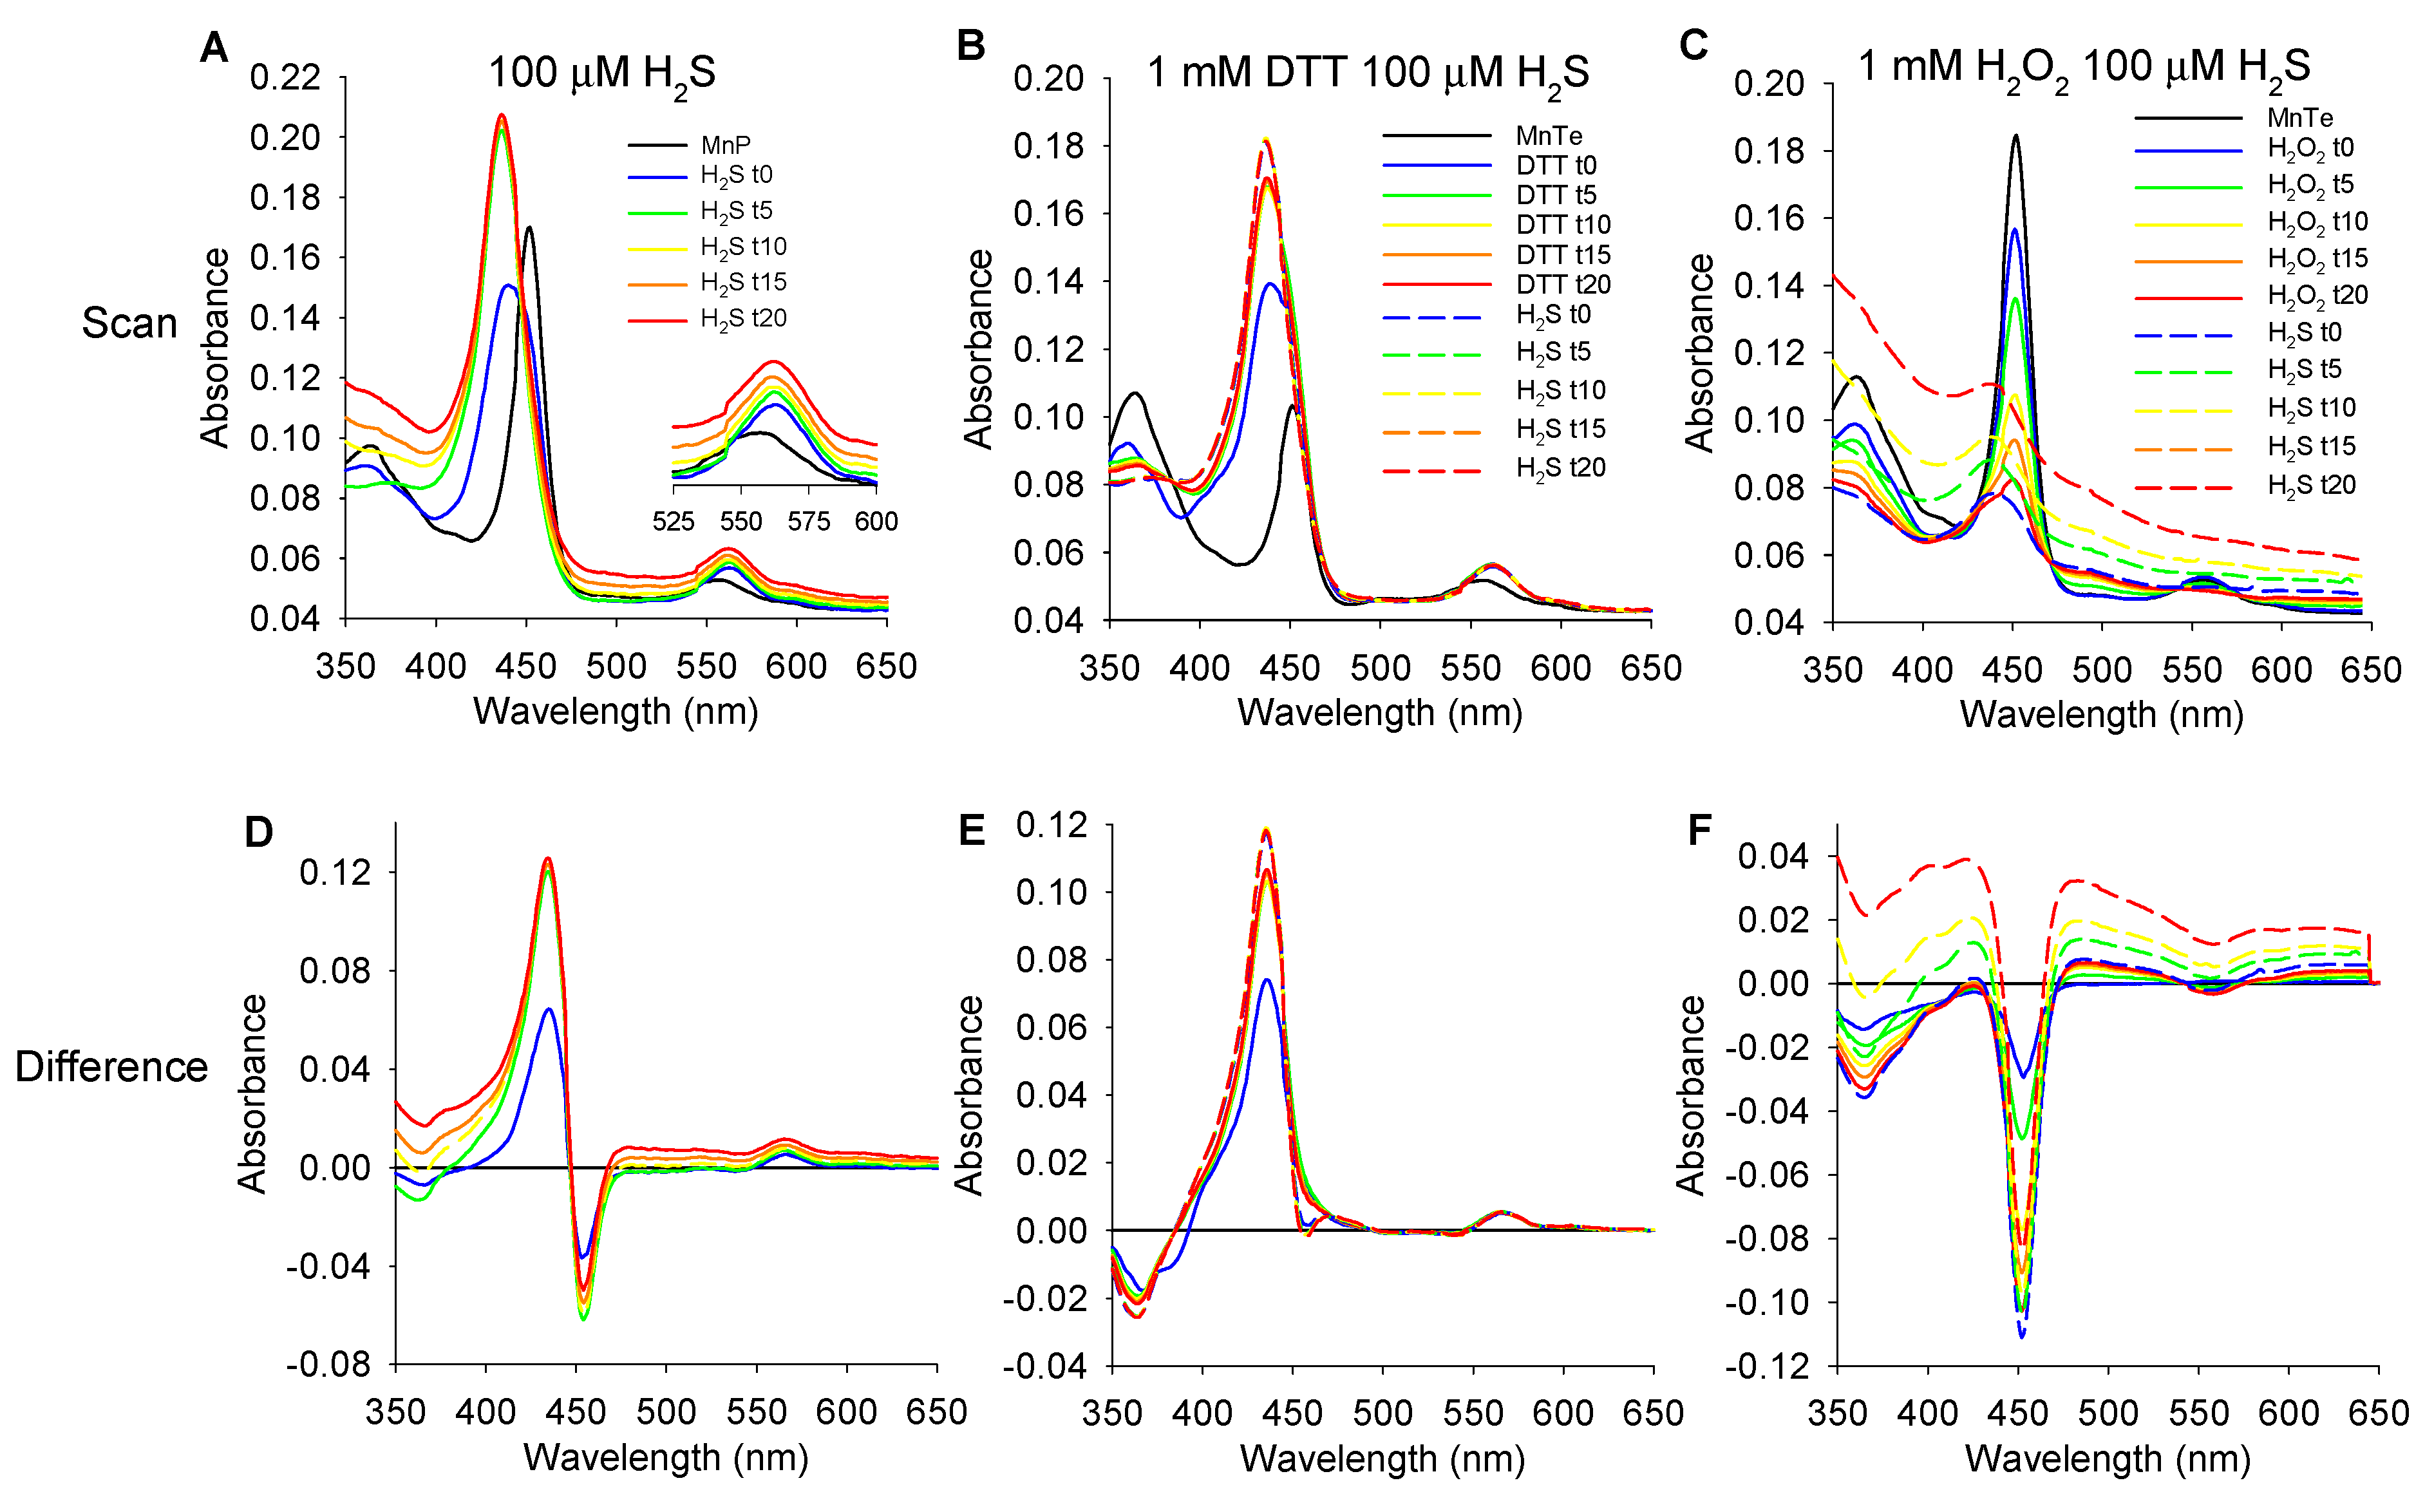
3.5.1. Effects of H2S on MnP Oxidation State
3.5.2. Effects of DTT and H2O2 on MnTE and MnTE/H2S Spectrum
3.5.3. Reversibility of MnTE-H2S Interaction
4. Discussion
4.1. Quantification and Identification of Polysulfides Produced by MnP Catalysis of H2S Oxidation
4.2. H2S and MnP Redox Cycling
4.3. Proposed Mechanism of MnP Oxidation of H2S
5. Conclusions
Author Contributions
Funding
Acknowledgments
Conflicts of Interest
References
- Clanton, T.L.; Hogan, M.C.; Gladden, L.B. Regulation of cellular gas exchange, oxygen sensing, and metabolic control. Compr. Physiol. 2013, 3, 1135–1190. [Google Scholar] [PubMed]
- Desmard, M.; Boczkowski, J.; Poderoso, J.; Motterlini, R. Mitochondrial and cellular heme-dependent proteins as targets for the bioactive function of the heme oxygenase/carbon monoxide system. Antioxid. Redox Signal. 2007, 9, 2139–2155. [Google Scholar] [CrossRef] [PubMed]
- Gladwin, M.T.; Lancaster, J.R., Jr.; Freeman, B.A.; Schechter, A.N. Nitric oxide’s reactions with hemoglobin: A view through the SNO-storm. Nat. Med. 2003, 9, 496–500. [Google Scholar] [CrossRef] [PubMed]
- Kajimura, M.; Nakanishi, T.; Takenouchi, T.; Morikawa, T.; Hishiki, T.; Yukutake, Y.; Suematsu, M. Gas biology: Tiny molecules controlling metabolic systems. Respir. Physiol. Neurobiol. 2012, 184, 139–148. [Google Scholar] [CrossRef] [PubMed] [Green Version]
- Lill, R. Function and biogenesis of iron-sulphur proteins. Nature 2009, 460, 831–838. [Google Scholar] [CrossRef] [PubMed]
- Corti, P.; Tejero, J.; Gladwin, M.T. Evidence mounts that red cells and deoxyhemoglobin can reduce nitrite to bioactive NO to mediate intravascular endocrine NO signaling: Commentary on “Anti-platelet effects of dietary nitrate in healthy volunteers: Involvement of cGMP and influence of sex”. Free Radic. Biol. Med. 2013, 65, 1518–1520. [Google Scholar] [CrossRef] [PubMed]
- Tovmasyan, A.; Carballal, S.; Ghazaryan, R.; Melikyan, L.; Weitner, T.; Maia, C.G.; Reboucas, J.S.; Radi, R.; Spasojevic, I.; Benov, L.; et al. Rational design of superoxide dismutase (SOD) mimics: The evaluation of the therapeutic potential of new cationic Mn porphyrins with linear and cyclic substituents. Inorg. Chem. 2014, 53, 11467–11483. [Google Scholar] [CrossRef] [Green Version]
- Wijayanti, N.; Katz, N.; Immenschuh, S. Biology of heme in health and disease. Curr. Med. Chem. 2004, 11, 981–986. [Google Scholar] [CrossRef]
- Ashcraft, K.A.; Boss, M.K.; Tovmasyan, A.; Choudhury, K.R.; Fontanella, A.N.; Young, K.H.; Palmer, G.M.; Birer, S.R.; Landon, C.D.; Park, W.; et al. Novel Manganese-Porphyrin Superoxide Dismutase-Mimetic Widens the Therapeutic Margin in a Preclinical Head and Neck Cancer Model. Int. J. Radiat. Oncol. Biol. Phys. 2015, 93, 892–900. [Google Scholar] [CrossRef] [Green Version]
- Batinic-Haberle, I.; Tovmasyan, A.; Spasojevic, I. An educational overview of the chemistry, biochemistry and therapeutic aspects of Mn porphyrins—From superoxide dismutation to H2O2-driven pathways. Redox Biol. 2015, 5, 43–65. [Google Scholar] [CrossRef] [Green Version]
- Rajic, Z.; Tovmasyan, A.; de Santana, O.L.; Peixoto, I.N.; Spasojevic, I.; Monte, S.A.D.; Ventura, E.; Reboucas, J.S.; Batinic-Haberle, I. Challenges encountered during development of Mn porphyrin-based, potent redox-active drug and superoxide dismutase mimic, MnTnBuOE-2-PyP5+, and its alkoxyalkyl analogue. J. Inorg. Biochem. 2017, 169, 50–60. [Google Scholar] [CrossRef] [PubMed] [Green Version]
- Batinic-Haberle, I.; Tome, M.E. Thiol regulation by Mn porphyrins, commonly known as SOD mimics. Redox Biol. 2019, 25, 101139. [Google Scholar] [CrossRef] [PubMed]
- Batinic-Haberle, I.; Tovmasyan, A.; Spasojevic, I. Mn porphyrin-based redox-active drugs—Differential effects as cancer therapeutics and protectors of normal tissue against oxidative injury. Antioxid. Redox Signal. 2018, 29, 1691–1724. [Google Scholar] [CrossRef] [PubMed]
- Olson, K.R.; Straub, K.D. The Role of Hydrogen Sulfide in Evolution and the Evolution of Hydrogen Sulfide in Metabolism and Signaling. Physiology 2016, 31, 60–72. [Google Scholar] [CrossRef]
- Jones, D.P.; Sies, H. The redox code. Antioxid. Redox Signal. 2015, 23, 734–746. [Google Scholar] [CrossRef] [Green Version]
- Kuksal, N.; Chalker, J.; Mailloux, R.J. Progress in understanding the molecular oxygen paradox—Function of mitochondrial reactive oxygen species in cell signaling. Biol. Chem. 2017, 398, 1209–1227. [Google Scholar] [CrossRef]
- Leichert, L.I.; Dick, T.P. Incidence and physiological relevance of protein thiol switches. Biol. Chem. 2015, 396, 389–399. [Google Scholar] [CrossRef]
- Reczek, C.R.; Chandel, N.S. ROS-dependent signal transduction. Curr. Opin. Cell Biol. 2015, 33, 8–13. [Google Scholar] [CrossRef] [Green Version]
- Roy, J.; Galano, J.M.; Durand, T.; le Guennec, J.Y.; Lee, J.C. Physiological role of reactive oxygen species as promoters of natural defenses. FASEB J. 2017, 31, 3729–3745. [Google Scholar] [CrossRef] [Green Version]
- Szabo, C.; Papapetropoulos, A. International Union of Basic and Clinical Pharmacology. CII: Pharmacological Modulation of H2S Levels: H2S Donors and H2S Biosynthesis Inhibitors. Pharmacol. Rev. 2017, 69, 497–564. [Google Scholar] [CrossRef] [Green Version]
- Weidinger, A.; Kozlov, A.V. Biological Activities of Reactive Oxygen and Nitrogen Species: Oxidative Stress versus Signal Transduction. Biomolecules 2015, 5, 472–484. [Google Scholar] [CrossRef] [PubMed] [Green Version]
- Zhang, D.; Du, J.; Tang, C.; Huang, Y.; Jin, H. H2S-Induced Sulfhydration: Biological Function and Detection Methodology. Front. Pharmacol. 2017, 8, 608. [Google Scholar] [CrossRef] [PubMed] [Green Version]
- Zuo, L.; Zhou, T.; Pannell, B.K.; Ziegler, A.C.; Best, T.M. Biological and physiological role of reactive oxygen species—The good, the bad and the ugly. Acta Physiol. 2015, 214, 329–348. [Google Scholar] [CrossRef] [PubMed]
- DeLeon, E.R.; Gao, Y.; Huang, E.; Arif, M.; Arora, N.; Divietro, A.; Patel, S.; Olson, K.R. A case of mistaken identity: Are reactive oxygen species actually reactive sulfide species? Am. J. Physiol. Regul. Integr. Comp. Physiol. 2016, 310, R549–R560. [Google Scholar] [CrossRef] [PubMed] [Green Version]
- Olson, K.R.; Gao, Y.; Arif, F.; Arora, K.; Patel, S.; DeLeon, E.R.; Sutton, T.R.; Feelisch, M.; Cortese-Krott, M.M.; Straub, K.D. Metabolism of hydrogen sulfide (H2S) and Production of Reactive Sulfur Species (RSS) by superoxide dismutase. Redox Biol. 2017, 15, 74–85. [Google Scholar] [CrossRef]
- Reboucas, J.S.; Spasojevic, I.; Batinic-Haberle, I. Pure manganese(III) 5,10,15,20-tetrakis(4-benzoic acid)porphyrin (MnTBAP) is not a superoxide dismutase mimic in aqueous systems: A case of structure-activity relationship as a watchdog mechanism in experimental therapeutics and biology. J. Biol. Inorg. Chem. 2008, 13, 289–302. [Google Scholar] [CrossRef]
- Kachadourian, R.; Batinic-Haberle, I.; Fridovich, I. Syntheses and superoxide dismuting activities of partially (1–4) beta-chlorinated derivatives of manganese(III) meso-tetrakis(N-ethylpyridinium-2-yl)porphyrin. Inorg. Chem. 1999, 38, 391–396. [Google Scholar] [CrossRef]
- Rajic, Z.; Tovmasyan, A.; Spasojevic, I.; Sheng, H.X.; Lu, M.M.; Li, A.M.; Gralla, E.B.; Warner, D.S.; Benov, L.; Batinic-Haberle, I. A new SOD mimic, Mn(III) ortho N-butoxyethylpyridylporphyrin, combines superb potency and lipophilicity with low toxicity. Free Radic. Biol. Med. 2012, 52, 1828–1834. [Google Scholar] [CrossRef] [Green Version]
- May, P.M.; Batka, D.; Hefter, G.; Konigsberger, E.; Rowland, D. Goodbye to S2− in aqueous solution. Chem. Commun. 2018, 54, 1980–1983. [Google Scholar] [CrossRef]
- Olson, K.R.; Gao, Y.; Arif, F.; Arora, K.; Patel, S.; DeLeon, E.; Straub, K.D. Fluorescence quenching by metal centered porphyrins and poryphyrin enzymes. Am. J. Physiol. Regul. Integr. Comp. Physiol. 2017, 313, R340–R346. [Google Scholar] [CrossRef] [Green Version]
- Tovmasyan, A.; Maia, C.G.; Weitner, T.; Carballal, S.; Sampaio, R.S.; Lieb, D.; Ghazaryan, R.; Ivanovic-Burmazovic, I.; Ferrer-Sueta, G.; Radi, R.; et al. A comprehensive evaluation of catalase-like activity of different classes of redox-active therapeutics. Free Radic. Biol. Med. 2015, 86, 308–321. [Google Scholar] [CrossRef] [PubMed] [Green Version]
- Batinic-Haberle, I.; Spasojevic, I.; Stevens, R.D.; Hambright, P.; Fridovich, I. Manganese(III) meso-tetrakis(ortho-N-alkylpyridyl)porphyrins. Synthesis, characterization, and catalysis of O2•− dismutation. J. Chem. Soc. Dalton Trans. 2002, 13, 2689–2696. [Google Scholar] [CrossRef]
- Tong, Q.; Zhu, Y.; Galaske, J.W.; Kosmacek, E.A.; Chatterjee, A.; Dickinson, B.C.; Oberley-Deegan, R.E. MnTE-2-PyP modulates thiol oxidation in a hydrogen peroxide-mediated manner in a human prostate cancer cell. Free Radic. Biol. Med. 2016, 101, 32–43. [Google Scholar] [CrossRef] [PubMed] [Green Version]
- Weitner, T.; Kos, I.; Mandic, Z.; Batinic-Haberle, I.; Birus, M. Acid-base and electrochemical properties of manganese meso(ortho- and meta-N-ethylpyridyl)porphyrins: Voltammetric and chronocoulometric study of protolytic and redox equilibria. Dalton Trans. 2013, 42, 14757–14765. [Google Scholar] [CrossRef] [PubMed] [Green Version]
- Spasojevic, I.; Batinic-Haberle, I.; Fridovich, I. Nitrosylation of manganese(II) tetrakis(N-ethylpyridinium-2-yl)porphyrin: A simple and sensitive spectrophotometric assay for nitric oxide. Nitric Oxide 2000, 4, 526–533. [Google Scholar] [CrossRef] [PubMed]
- Tovmasyan, A.; Sampaio, R.S.; Boss, M.K.; Bueno-Janice, J.C.; Bader, B.H.; Thomas, M.; Reboucas, J.S.; Orr, M.; Chandler, J.D.; Go, Y.M.; et al. Anticancer therapeutic potential of Mn porphyrin/ascorbate system. Free Radic. Biol. Med. 2015, 89, 1231–1247. [Google Scholar] [CrossRef] [Green Version]
- DeLeon, E.R.; Stoy, G.F.; Olson, K.R. Passive loss of hydrogen sulfide in biological experiments. Anal. Biochem. 2012, 421, 203–207. [Google Scholar] [CrossRef]
- Fukuto, J.M.; Ignarro, L.J.; Nagy, P.; Wink, D.A.; Kevil, C.G.; Feelisch, M.; Cortese-Krott, M.M.; Bianco, C.L.; Kumagai, Y.; Hobbs, A.J.; et al. Biological hydropersulfides and related polysulfides—A new concept and perspective in redox biology. FEBS Lett. 2018, 592, 2140–2152. [Google Scholar] [CrossRef] [Green Version]
- Brandes, N.; Tienson, H.; Lindemann, A.; Vitvitsky, V.; Reichmann, D.; Banerjee, R.; Jakob, U. Time line of redox events in aging postmitotic cells. Elife 2013, 2, e00306. [Google Scholar] [CrossRef]
- Brown, D.I.; Griendling, K.K. Regulation of signal transduction by reactive oxygen species in the cardiovascular system. Circ. Res. 2015, 116, 531–549. [Google Scholar] [CrossRef] [Green Version]
- Chen, Y.R.; Zweier, J.L. Cardiac mitochondria and reactive oxygen species generation. Circ. Res. 2014, 114, 524–537. [Google Scholar] [CrossRef] [PubMed] [Green Version]
- Chouchani, E.T.; Pell, V.R.; James, A.M.; Work, L.M.; Saeb-Parsy, K.; Frezza, C.; Krieg, T.; Murphy, M.P. A Unifying Mechanism for Mitochondrial Superoxide Production during Ischemia-Reperfusion Injury. Cell Metab. 2016, 23, 254–263. [Google Scholar] [CrossRef] [PubMed] [Green Version]
- Circu, M.L.; Aw, T.Y. Reactive oxygen species, cellular redox systems, and apoptosis. Free Radic. Biol. Med. 2010, 48, 749–762. [Google Scholar] [CrossRef] [PubMed] [Green Version]
- Circu, M.L.; Aw, T.Y. Intestinal redox biology and oxidative stress. Semin. Cell Dev. Biol. 2012, 23, 729–737. [Google Scholar] [CrossRef] [PubMed] [Green Version]
- Gibson, S.B. Investigating the role of reactive oxygen species in regulating autophagy. Methods Enzymol. 2013, 528, 217–235. [Google Scholar]
- Goncalves, R.L.; Quinlan, C.L.; Perevoshchikova, I.V.; Hey-Mogensen, M.; Brand, M.D. Sites of superoxide and hydrogen peroxide production by muscle mitochondria assessed ex vivo under conditions mimicking rest and exercise. J. Biol. Chem. 2015, 290, 209–227. [Google Scholar] [CrossRef] [Green Version]
- Lambeth, J.D.; Neish, A.S. Nox enzymes and new thinking on reactive oxygen: A double-edged sword revisited. Annu. Rev. Pathol. 2014, 9, 119–145. [Google Scholar] [CrossRef]
- Li, X.; Fang, P.; Mai, J.; Choi, E.T.; Wang, H.; Yang, X.F. Targeting mitochondrial reactive oxygen species as novel therapy for inflammatory diseases and cancers. J. Hematol. Oncol. 2013, 6, 19. [Google Scholar] [CrossRef] [Green Version]
- Holmstrom, K.M.; Finkel, T. Cellular mechanisms and physiological consequences of redox-dependent signaling. Nat. Rev. Mol. Cell Biol. 2014, 15, 411–421. [Google Scholar] [CrossRef]
- Olschewski, A.; Weir, E.K. Redox Regulation of Ion Channels in the Pulmonary Circulation. Antioxid. Redox. Signal. 2014, 22, 465–485. [Google Scholar] [CrossRef] [Green Version]
- Radi, E.; Formichi, P.; Battisti, C.; Federico, A. Apoptosis and oxidative stress in neurodegenerative diseases. JAD 2014, 42, S125–S152. [Google Scholar] [CrossRef] [PubMed] [Green Version]
- Schieber, M.; Chandel, N.S. ROS function in redox signaling and oxidative stress. Curr. Biol. 2014, 24, R453–R462. [Google Scholar] [CrossRef] [PubMed] [Green Version]
- Schulz, E.; Wenzel, P.; Munzel, T.; Daiber, A. Mitochondrial redox signaling: Interaction of mitochondrial reactive oxygen species with other sources of oxidative stress. Antioxid. Redox. Signal. 2014, 20, 308–324. [Google Scholar] [CrossRef] [PubMed]
- Sharma, K. Obesity and Diabetic Kidney Disease: Role of Oxidant Stress and Redox Balance. Antioxid. Redox. Signal. 2016, 25, 208–216. [Google Scholar] [CrossRef] [PubMed]
- Sies, H.; Berndt, C.; Jones, D.P. Oxidative Stress. Annu. Rev. Biochem. 2017, 86, 715–748. [Google Scholar] [CrossRef]
- Winterbourn, C.C. Are free radicals involved in thiol-based redox signaling? Free Radic. Biol. Med. 2014, 80, 164–170. [Google Scholar] [CrossRef]


© 2019 by the authors. Licensee MDPI, Basel, Switzerland. This article is an open access article distributed under the terms and conditions of the Creative Commons Attribution (CC BY) license (http://creativecommons.org/licenses/by/4.0/).
Share and Cite
Olson, K.R.; Gao, Y.; Arif, F.; Patel, S.; Yuan, X.; Mannam, V.; Howard, S.; Batinic-Haberle, I.; Fukuto, J.; Minnion, M.; et al. Manganese Porphyrin-Based SOD Mimetics Produce Polysulfides from Hydrogen Sulfide. Antioxidants 2019, 8, 639. https://doi.org/10.3390/antiox8120639
Olson KR, Gao Y, Arif F, Patel S, Yuan X, Mannam V, Howard S, Batinic-Haberle I, Fukuto J, Minnion M, et al. Manganese Porphyrin-Based SOD Mimetics Produce Polysulfides from Hydrogen Sulfide. Antioxidants. 2019; 8(12):639. https://doi.org/10.3390/antiox8120639
Chicago/Turabian StyleOlson, Kenneth R., Yan Gao, Faihaan Arif, Shivali Patel, Xiaotong Yuan, Varun Mannam, Scott Howard, Ines Batinic-Haberle, Jon Fukuto, Magdalena Minnion, and et al. 2019. "Manganese Porphyrin-Based SOD Mimetics Produce Polysulfides from Hydrogen Sulfide" Antioxidants 8, no. 12: 639. https://doi.org/10.3390/antiox8120639