Article

Effect of Alkaline Salts on Pyrolyzed Solid Wastes in Used Edible Oils: An Attenuated Total Reflectance Analysis of Surface Compounds as a Function of the Temperature

by
Francisca Romero-Sarria
1,*,
Concepción Real
2,
José Manuel Córdoba
1,
María Carmen Hidalgo
2 and
María Dolores Alcalá
1
1
Instituto de Ciencia de Materiales de Sevilla and Departamento de Química Inorgánica, Centro Mixto Universidad de Sevilla-CSIC, Av. Américo Vespucio 49, 41092 Sevilla, Spain
2
Instituto de Ciencia de Materiales de Sevilla (CSIC-US), Av. Américo Vespucio 49, 41092 Sevilla, Spain
*
Author to whom correspondence should be addressed.
Spectrosc. J. 2023, 1(2), 98-110; https://doi.org/10.3390/spectroscj1020009
Submission received: 26 June 2023 / Revised: 1 August 2023 / Accepted: 1 September 2023 / Published: 13 September 2023
(This article belongs to the Special Issue Feature Papers in Spectroscopy Journal)

Abstract

:
Biochars obtained via the pyrolysis of biomass are very attractive materials from the point of view of their applications and play key roles in the current energy context. The characterization of these carbonaceous materials is crucial to determine their field of application. In this work, the pyrolysis of a non-conventional biomass (solid wastes in used edible oils) was investigated. The obtained biochars were characterized using conventional techniques (TG, XRD, and SEM-EDX), and a deep analysis via ATR-FTIR was performed. This spectroscopic technique, which is a rapid and powerful tool that is well adapted to study carbon-based materials, was employed to determine the effect of temperature on the nature of functional groups on the surface. Moreover, the water washing of the raw sample (containing important quantities of inorganic salts) before pyrolysis evidenced that the inorganic salts act as catalysts in the biomass degradation and influence the degree of condensation (DOC) of PAH. Moreover, it was observed that these salts contribute to the retention of oxygenated compounds on the surface of the solid.

Graphical Abstract

1. Introduction

Energy crises and environmental problems associated with greenhouse gas emissions have motivated the enactment of new European energy laws [1,2]. Thus, environmental policies impose an increase in the share of the overall production of renewable energies (55–75% in 2050), promote the development of efficient processes, and encourage waste recycling [3]. In this context, the use of biomass wastes to produce energy and/or interesting products is currently taking a relevant role in contributing to the minimization of pollutant emissions [4]. Among the employed methods, pyrolysis, which consists of a thermal treatment of biomass in the absence of oxygen (300–700 °C), produces three fractions: a gas, a liquid called bio-oil, and a carbon-rich solid called biochar. The solid fraction is receiving a lot of interest due to its numerous applications such as its use as a catalyst, catalytic support, adsorbent material, soil amendment, or fertilizer [5,6,7,8]. The required properties of biochars depend on the intended applications [9,10,11]. For example, in the case of using biochars as additives to soils, a pore diameter of <2 nm is the most important requirement [12], and when used as a sorbent material or catalytic support, a high specific surface area is the key property [13]. Biochars, which may be obtained from several biomass wastes such as residues of crops or forestry, sludge, nutshells, or manures, are particularly important in the context of circular economy, promoted by the European Union [14,15].
Pyrolysis conditions (temperature, heating rate, gas flow, and type of reactor employed) and the feedstock composition govern the properties (specific surface area, porosity, functional groups on the surface, or hydrophilicity) of the obtained biochars [16]. Thus, by controlling the pyrolysis conditions for each type of biomass, biochars with the required properties for the target application could be obtained. One drawback, however, is that the pyrolysis of biomass produces polyaromatic hydrocarbons (PAHs), which are condensed aromatic structures that remain on the biochar surface and represent a risk for human health [17]. Consequently, in some applications such as soil remediation, their concentration is limited to values as low as 12 mg/kg [18]. According to the data in the literature, reactions of aromatization occur at temperatures lower than 500 °C, while the condensation of these compounds takes place at higher temperatures via a radical mechanism. Although the temperature of pyrolysis is the most important factor influencing the PAH formation and condensation [19], inorganic salts contained in the feedstock influence the mechanism of PAH condensation [18]. Therefore, it is important to determine the properties of biochars as functions of the pyrolysis conditions and feedstock composition. Besides conventional characterization methods, FTIR spectroscopy is a very useful technique to determine the nature of the functional groups on the surface of biochar. In particular, Attenuated Total Reflectance (ATR) seems to be the most suitable technique for the study of carbon-based materials [20]. Thus, the estimation of the DOC of PAH in biochars may be calculated using ATR-FTIR spectra by dividing the area of bands in the 900–700 cm−1 region (=C-H out of plane vibration) by the area of the band due to ν(C=C) vibration at 1585 cm−1. The resulting DOC value is proportional to the number of aromatic rings constituting the PAH [21].
Although a wide variety of raw materials have already been studied as sources of biochar via pyrolysis, in this work, we used solid wastes contained in used edible oils as feedstock. Used edible oils, whose production reaches 3950 m3 per year in the European Union (2019) [14], are collected, decanted, and filtered, which produces a liquid and a solid fraction. The liquid phase (used oils) is mainly employed in biodiesel production, although studies concerning the valorization of it via pyrolysis are available in the literature [22]. However, the solid fraction (food rests) is sent to landfills to be burned together with municipal organic wastes. The costs associated with the elimination of these residues (transportation and taxes) negatively influences the economic viability of the related processes. Therefore, its revaluation, and transforming it into useful products, such as biochar, becomes a very attractive route from economic and environmental points of view. Considering that this waste is currently underutilized and that, to our knowledge, there are no studies on it, this work analyzes pyrolysis as a possible way of revalorizing this residue.
Since the characteristics of these solids meet the conditions to be considered as “biomass” on the basis of their origin, in this work, the pyrolysis of solid wastes in used edible oils is analyzed. Conventional methods (TG, XRD, microscopy, and chemical analysis) were used to characterize the obtained biochars, and a detailed analysis via ATR-FTIR spectroscopy permitted us to establish the influences of the pyrolysis temperature and the inorganic salts contained in the feedstock on the functional groups on the surface of the biochar and on the DOC of the formed PAH.

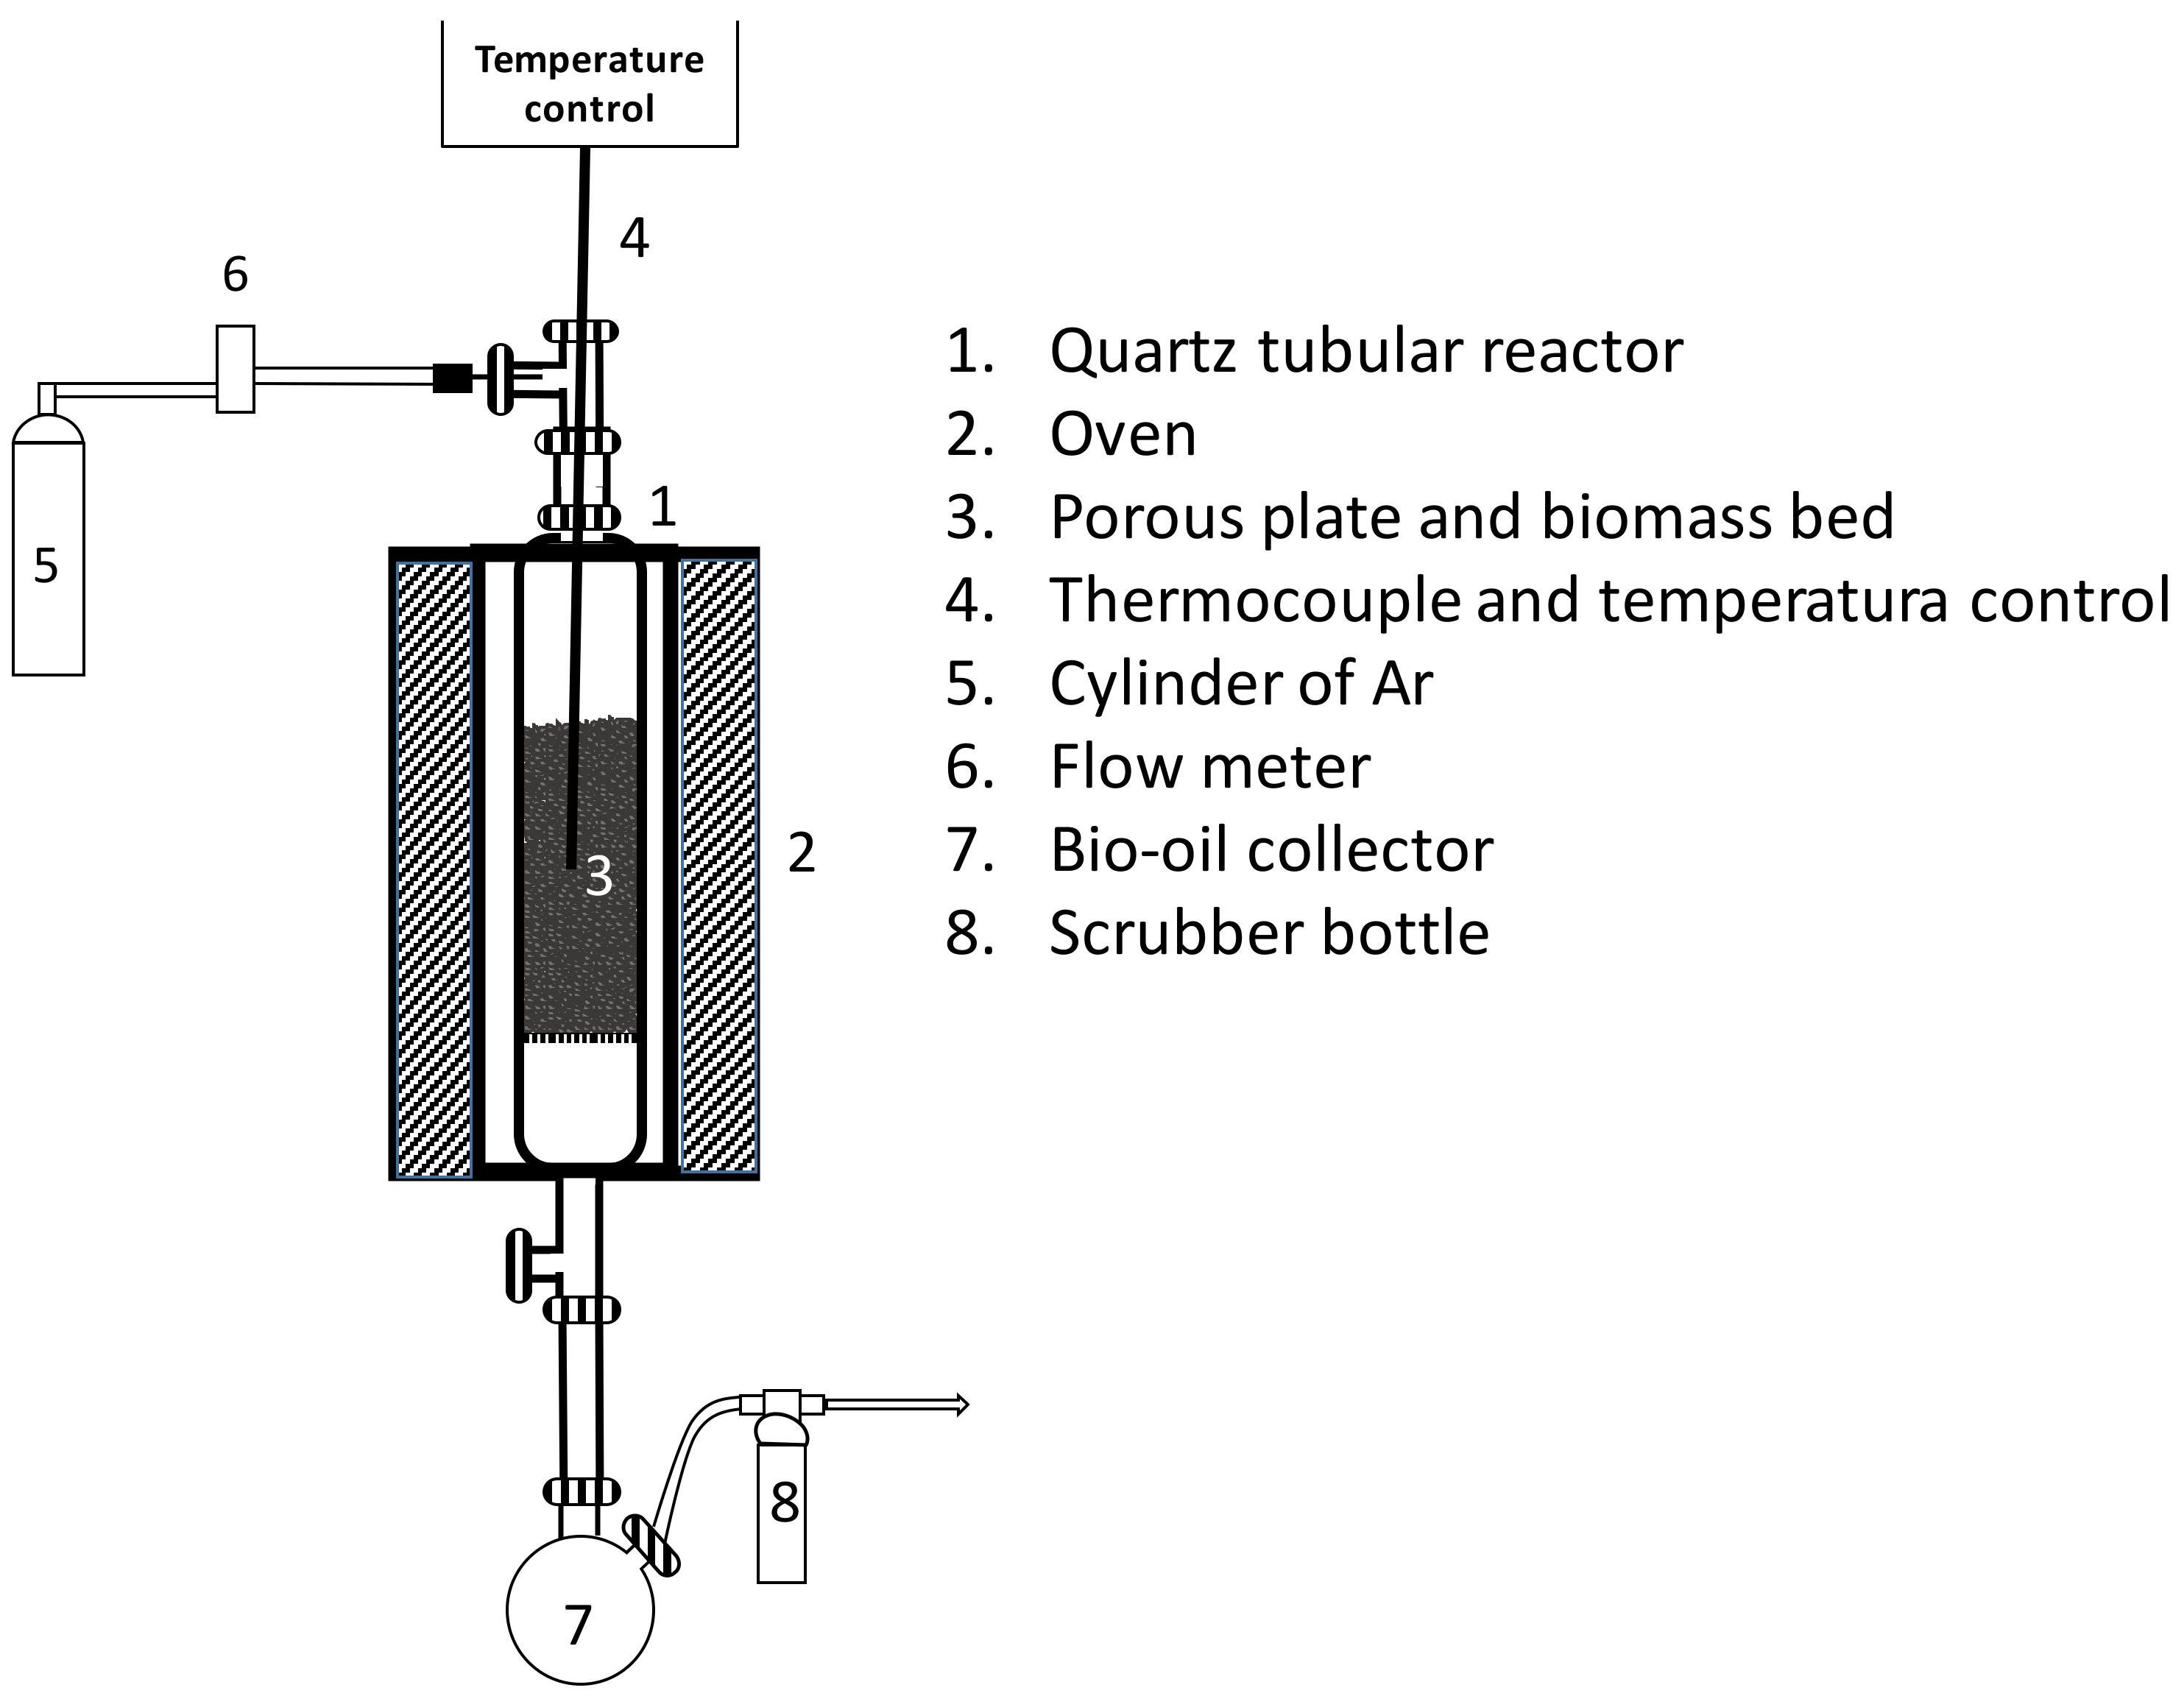
2. Materials and Methods

The solid wastes were provided by SAVISOL, S.L. (Málaga, Spain), a company specialized in the collection of used edible oils. The liquids and solids contained in the collected wastes were separated via filtration. Pyrolysis of the obtained solid fraction was studied in this work. These solids come from the whole of oils collected/stored by the company, and we can assume that the studied samples represent the average composition of this type of waste.
The pyrolysis system (Figure 1) was composed of a quartz tube with a porous plate in the middle, where the biomass was placed inside an oven that is able to heat up to 1000 °C. A thermocouple in contact with the biomass connected to a programmer permitted temperature control. The inlet gas flow (Ar in all the cases) was measured using a flow meter and introduced at the top of the quartz tube. The exit gas flow was passed through a scrubber bottle system containing acetone to retain the condensable hydrocarbons. Also, a bio-oil collector was coupled to the reactor in order to determine the liquid yields.
In a typical experiment, the biomass (~13 g) was placed into the reactor and the Ar flow (200 mL·min−1) was established. Once the flow stabilized, the temperature program was started (heating rate constant at 10 °C/min). The time at the end of the temperature program was 2 h in all of the cases. The obtained biochar samples were named S-XXX, with XXX being the final temperature.
TG analysis of the raw biomass was performed in a thermobalance CI electronics Ltd. (Torce, Bretagne, France). A flow of argon or air gas of 100 mL/min and a heating rate of 5 °C/min from room temperature (20–22 °C) to 800 °C at a pressure of 1 bar were used. Results are presented in Figure 2.
Ultimate analyses of the samples were carried out in an elemental analyzer LECO TRUSPEC CHNS MICRO. The S content was determined via ICP (SpectroBlue T1). In all of the cases, three samples (with 3 analyses for each one) were analyzed.
Biochar was characterized via N2 adsorption, XRD, SEM-EDX, and ATR-FTIR spectroscopy. The N2 adsorption was carried out in a Micromeritics TriStar II, and the samples were previously degassed at 250 °C for 24 h in a N2 flow. The diffraction patterns were obtained with a Panalytical X’Pert Pro instrument from 10 to 90 (2θ) in the step-scan mode at step of 0.05° and a counting time of 300 s/step. Microstructural and energy dispersive X-ray analyses (EDX) were performed with a Hitachi FEG S-4800 scanning electron microscope (SEM), and the images were recorded at 30 kV.
The ATR device (Thermo Fisher, iD7, Waltham, MA, USA) was coupled to a Si5 Thermo Fisher spectrometer with a DTGS detector. Spectra were recorded, accumulating 64 scans at a spectrum of 4 cm−1.
In some experiments, the initial biomass was water washed before pyrolysis. Distilled water was added to the raw biomass and the mixture was stirred. Separation of the solid and aqueous phase was carried out via centrifugation. Then, the solid was dried at 100 °C overnight.

3. Results

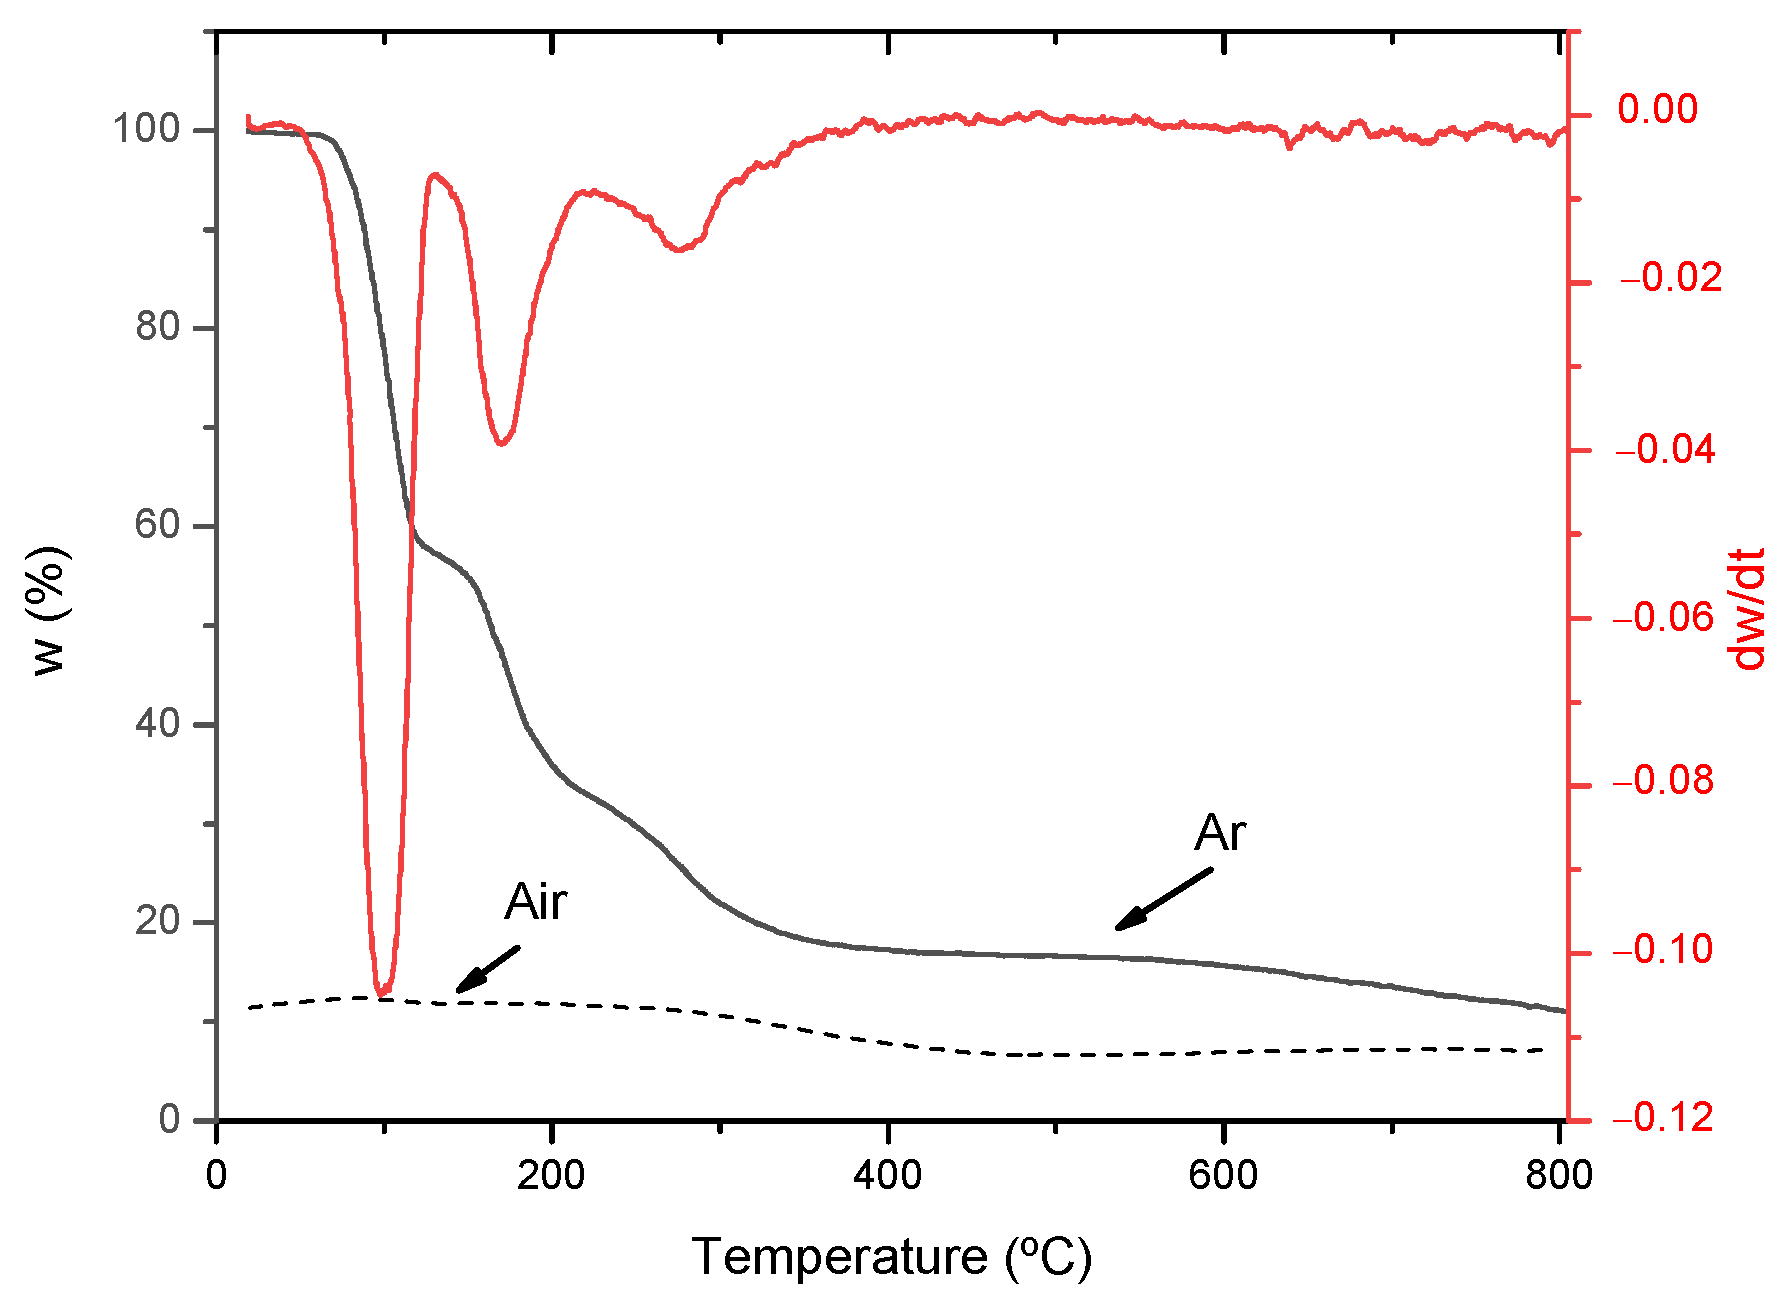
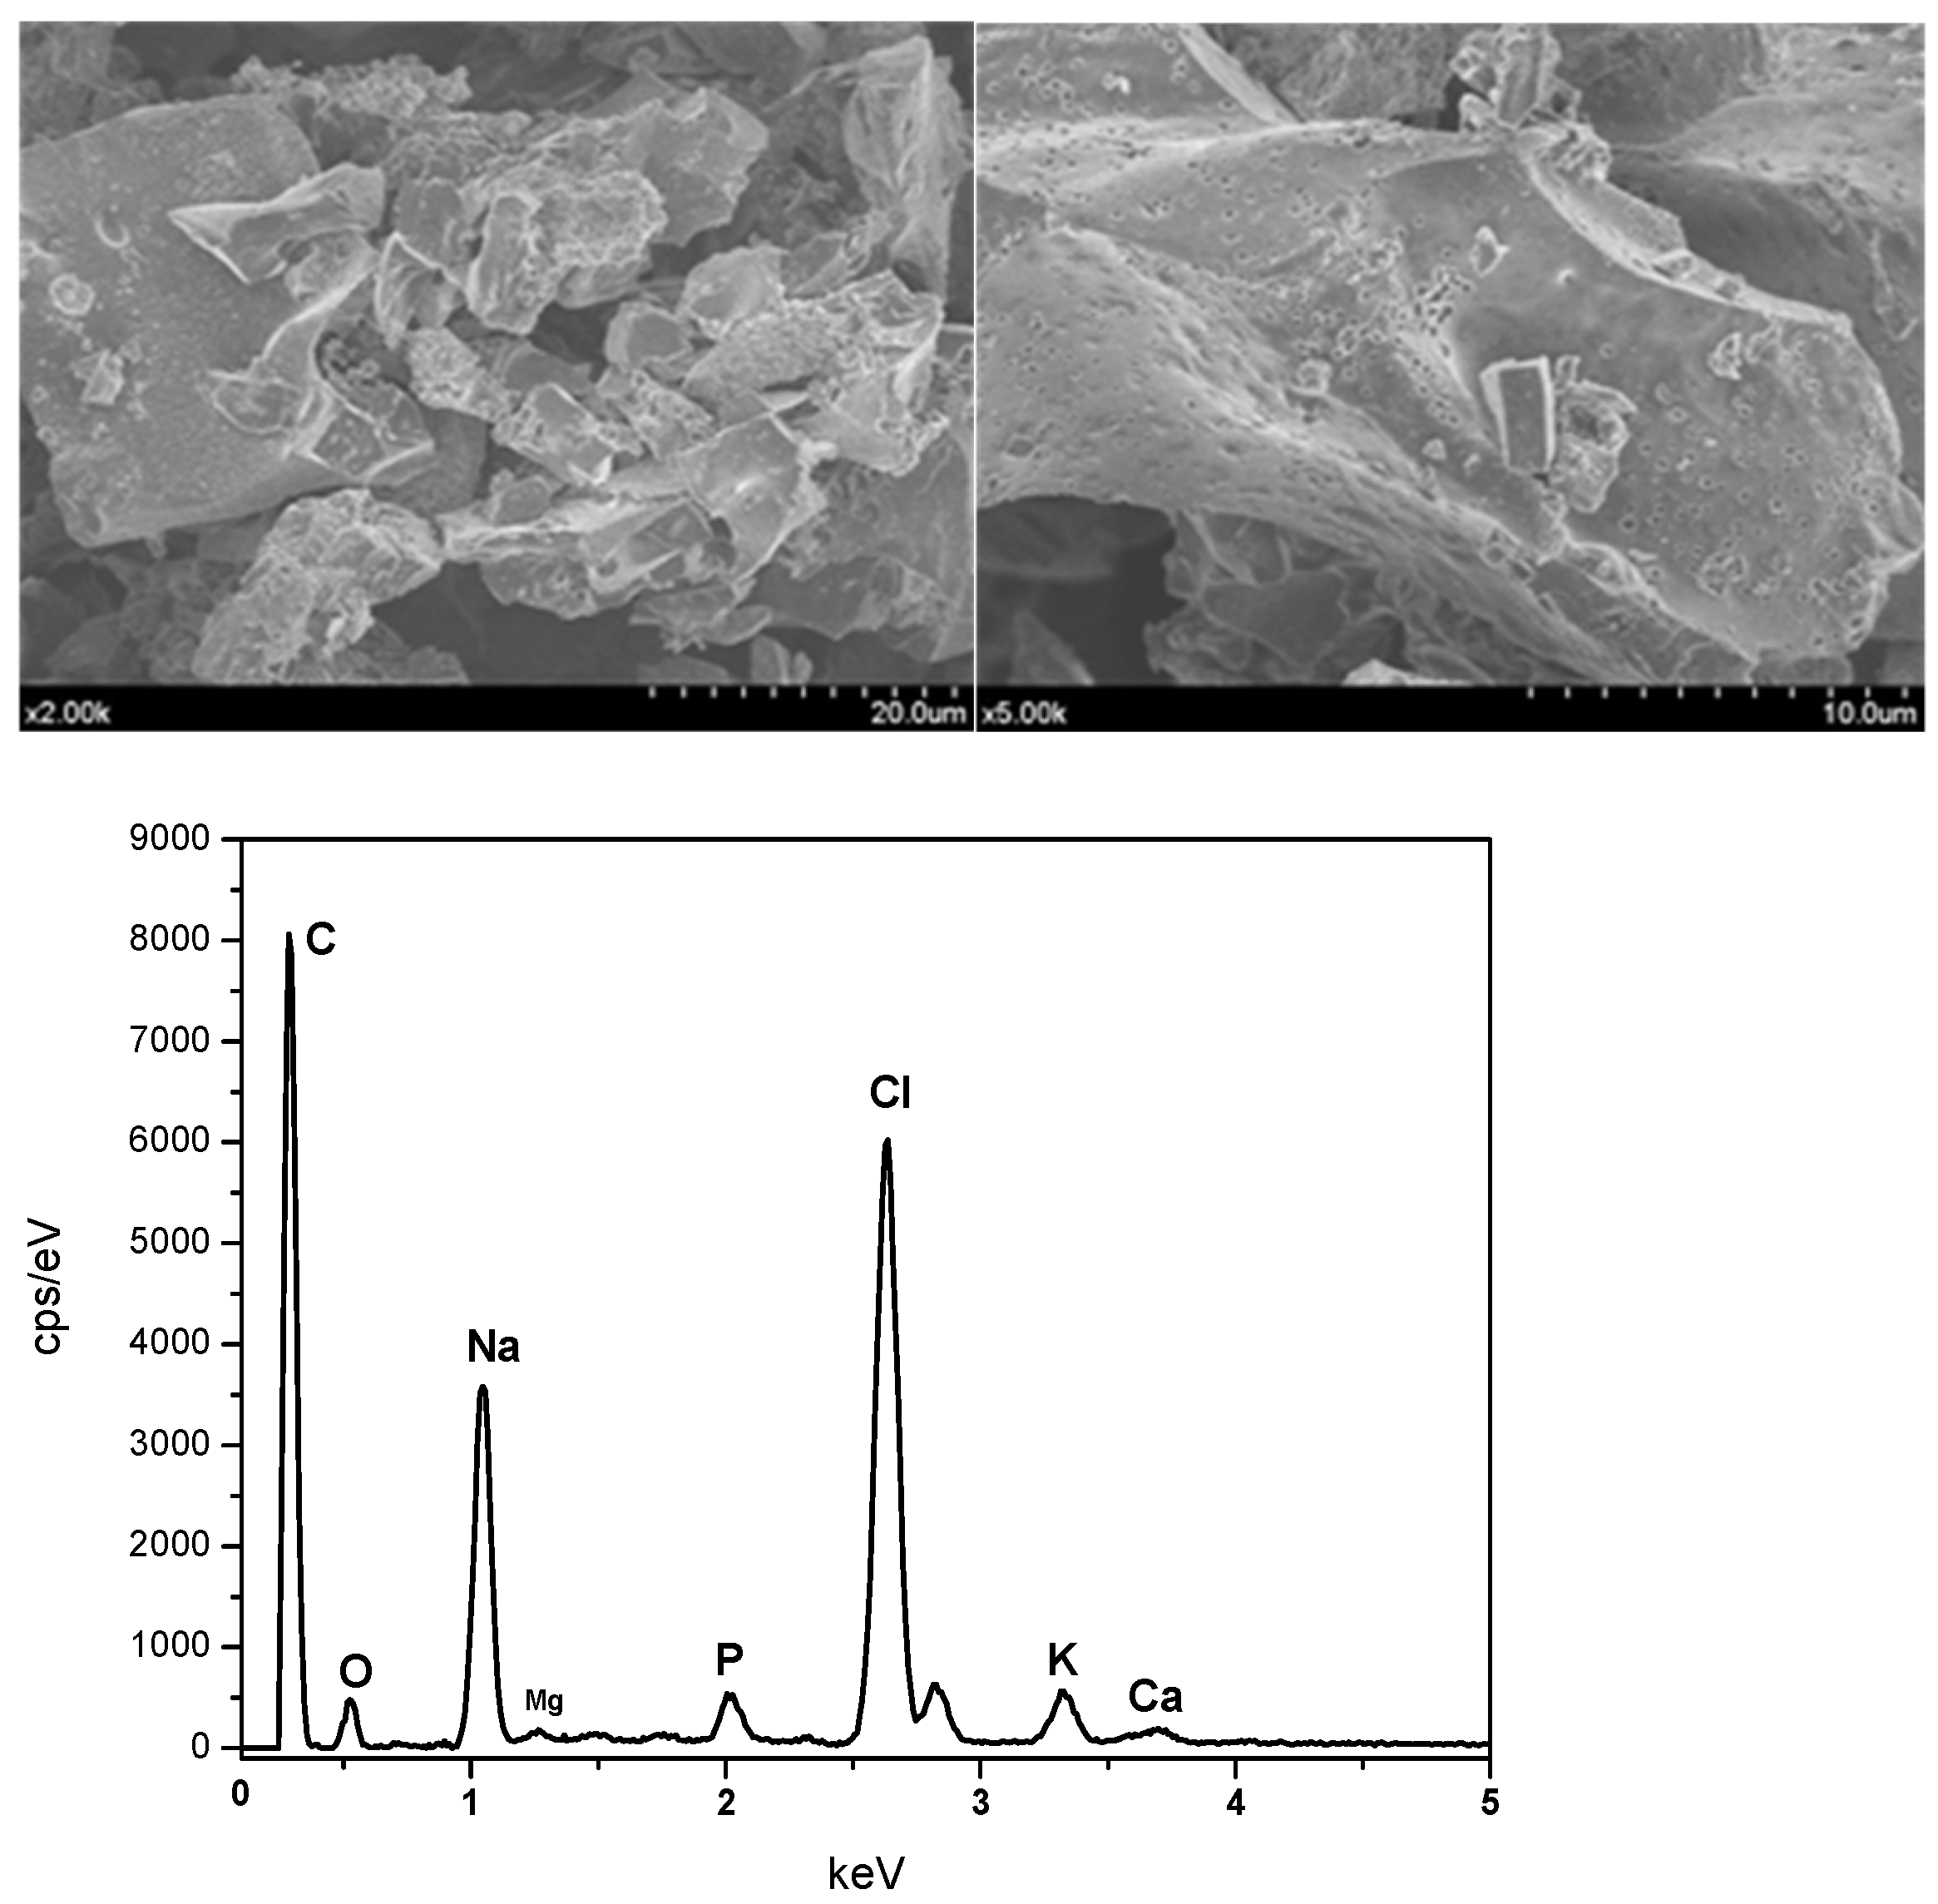
3.1. Characterization of the Raw Biomass

The studied residue is a solid impregnated with significant quantities of vegetable oils (oxidized using thermal treatment during cooking). Table 1 shows the C, H, O, N, and S contents. Moreover, the starting material contains NaCl and KCl (DRX and EDX), the pH value is 6.0, and the electric conductivity is 1.49 mS/cm. Since no data are available on the behavior of this material, the work started with the thermogravimetric analysis (TG) under flows of Ar (continuous line in Figure 2) and O2 (dashed line in Figure 2). Three main mass losses at 100, 170, and 280 °C (DTG, Figure 2), were observed during the thermal treatment under a flow of Ar. Then, a flow of O2 was established, and the temperature increased to 800 °C (dashed line in Figure 2). In these conditions, only one mass loss of about 5 wt.% was observed at 300 °C, with a 6.5 wt.% residue remaining. Accordingly, pyrolysis experiments were carried out by varying the temperature in the range of 300–600 °C (every 50 °C).
As 500 °C seems to be the critical temperature for the PAH condensation, samples obtained in the 450–600 °C range were studied more in detail. An ultimate analysis of the initial sample and those of the biochars obtained via pyrolysis at 450, 500, and 600 °C are presented in Table 1. The repeatability of the results confirm the exact composition of the samples.
The raw sample shows C, H, and O contents similar to those observed in a conventional lignocellulosic biomass [23]. As the initial sample was subjected to several heating cycles, one can think that the frying process would not provoke a strong alteration of the elemental composition (high degree of oxidation), although some modifications of the compound’s structure can be expected.

3.2. Characterization of Biochar Obtained via Pyrolysis

The pyrolysis of the raw samples was performed at different temperatures, and the percentages by the weight of the obtained fractions were 10–15 wt.% of biochar, 40–50 wt.% of bio-oil, and 35–50% of gaseous fraction (calculated by difference). As we focus on the properties of biochar, this product is analyzed in more detail.
In all the cases, the specific surface areas of the biochars were very low (<1 m2/g). The ultimate analyses of the biochars obtained at 450, 500, and 600 °C (Table 1) reveal a decrease in the C and H contents compared with the raw sample, while the O content increases in the samples that were thermally treated. Consequently, the atomic ratio H/C decreases, as expected, but the O/C atomic ratio increases, contrarily to that observed in biochar obtained via the pyrolysis of wood-based biomass [24].
The XRD of the biochars obtained at 450, 500, and 600 °C are shown in Figure 3.
In this figure, peaks of very high intensity corresponding to NaCl (00-005-0628) and other less intense peaks due to KCl (01-072-1540) are evidence of the presence of these compounds in all of the samples irrespective of the pyrolysis temperature. These results are in good agreement with the results of the TG analysis. In order to obtain the average contents of NaCl and KCl, a simulation of XRD as a function of the concentration was performed using the Profex5.2 program (www.profex-xrd.org, open source XRD and Rietveld refinement, accessed on 19 July 2023). The results indicate that there is 0.15% of KCl and the rest of the content comprises NaCl.
The biochars were also characterized via SEM-EDX. As an example, the micrographs and EDX results for the S-600 sample are shown in Figure 4. The images show very large particles of biochar and the EDX analysis confirms the presence of Na, Cl, and K (NaCl and KCl were detected via XRD) in addition to C, P, and O.

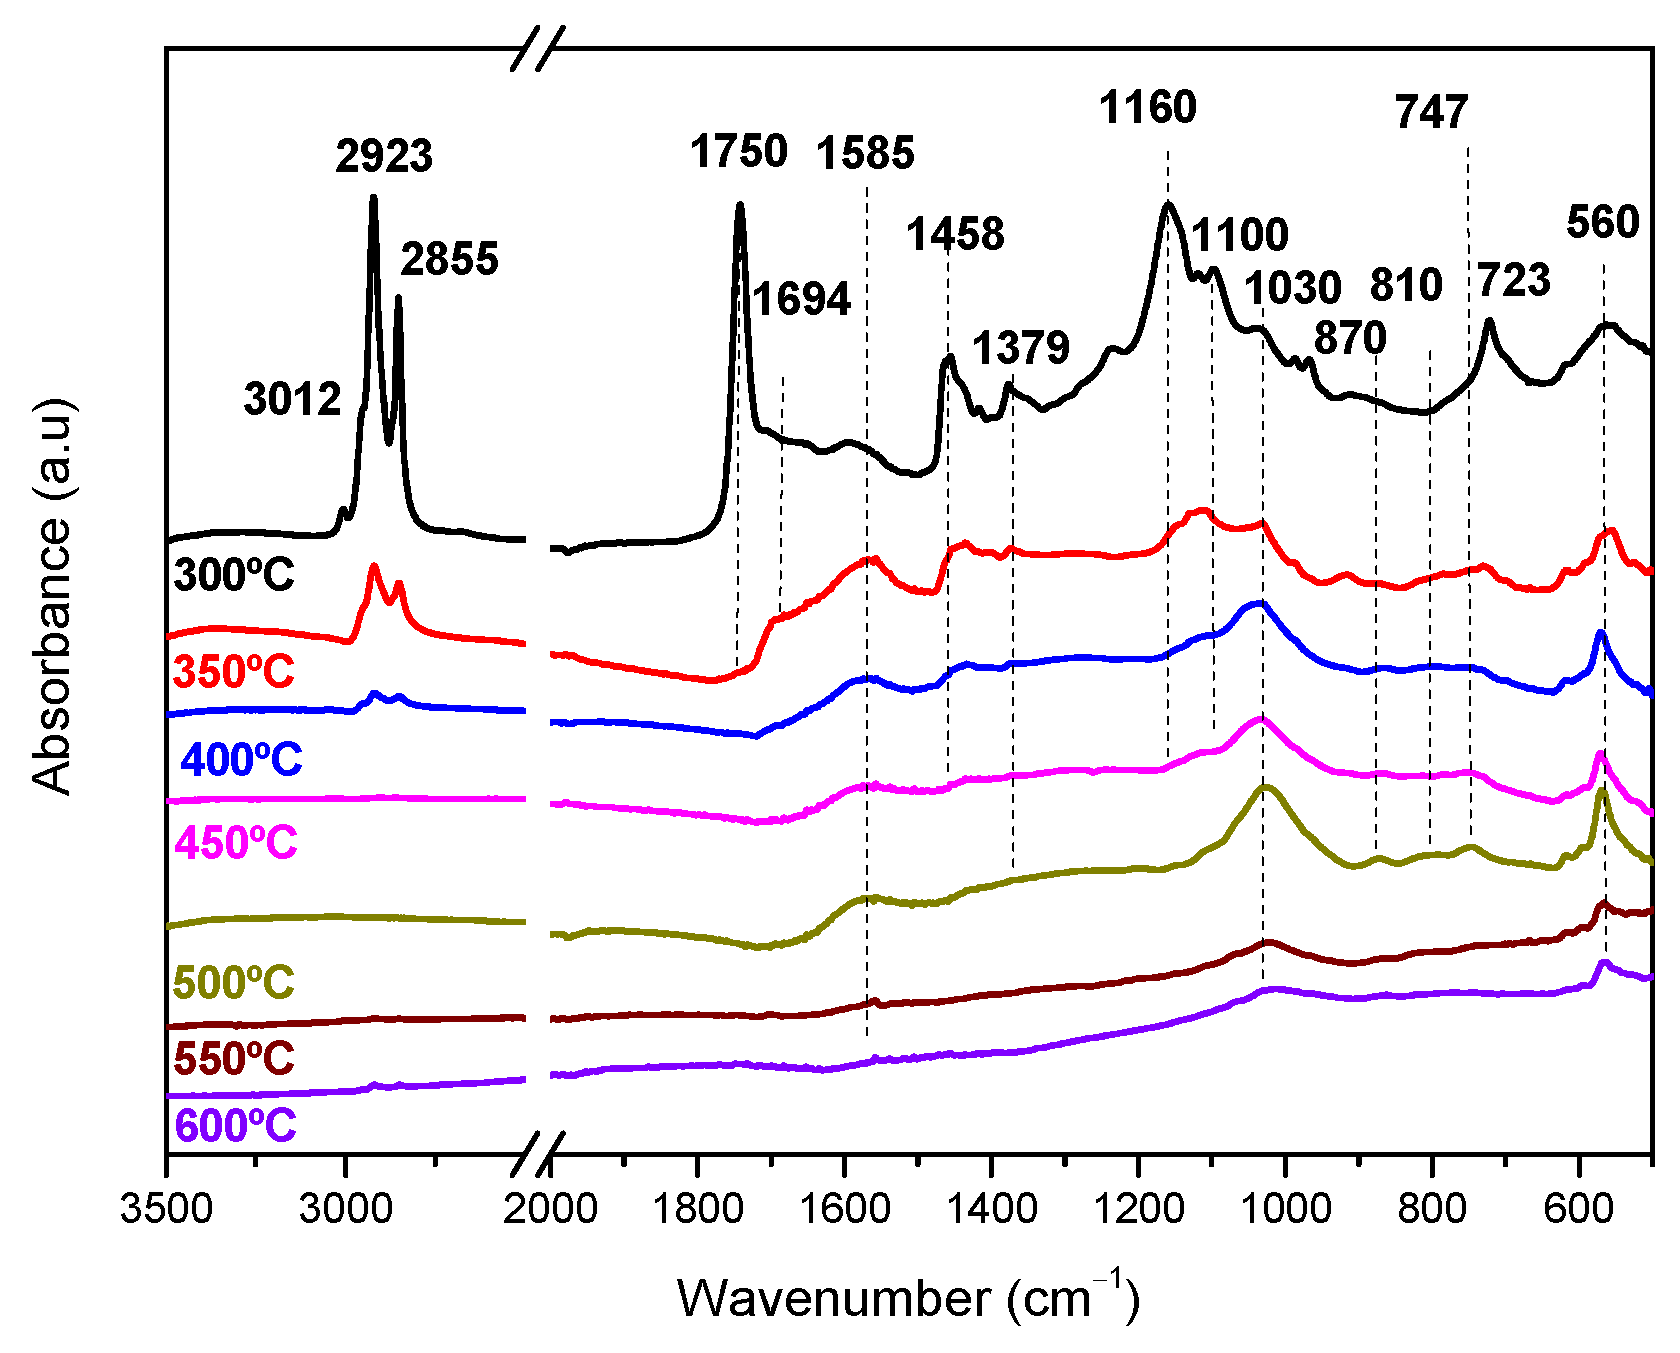
3.3. ATR-FTIR Analysis: The Effect of Temperature

In order to investigate the effect of temperature on the biochars’ properties, an ATR-FTIR study of the solids obtained via pyrolysis at different temperatures was performed. The obtained spectra are shown in Figure 5.
In the spectrum of the S-300 sample, a band of low intensity at 3012 cm−1 due to the C-H vibrations of alkenes [24] and other bands at 2923 and 2855 cm−1 attributed to asymmetric and symmetric ν(C-H) vibrations of aliphatic hydrocarbons, respectively, are observed. The bending modes of these species appear at 1379 cm−1 [25,26]. The intense bands at 1750 cm−1 and 1694 cm−1 evidence the presence of oxygenate compounds formed during cooking (aldehydes and ketones) [26,27]. Zhang et al. [28] assigned the band at the highest wavenumber (1750 cm−1) to aldehydes and assigned the other one, at 1694 cm−1, to ketones.
Also, the vibration modes of C=C bonds and =C-H in the plane of aromatic compounds are observed at 1585 cm−1 and 1458 cm−1, respectively [28]. The =C-H out-of-plane vibrations of aromatics are detected in the 900–700 cm−1 region, and the number of bands and their relative intensity depend on the degree of substitution of aromatic hydrocarbons. At 300 °C, bands in this region are of very low intensity and overlap with a band at 723 cm−1, which is related to the hydrocarbon chain vibrations, δ(CH2)n, with n > 4 [29,30]. As the temperature increases, bands between 900 and 700 cm−1 develop, and the bands at 723 cm−1 vanishes.
The intense band observed at 1160 cm−1 and that at 1100 cm−1 are assigned to the asymmetric and symmetric C-O vibrations. The band detected at 1030 cm−1 is representative of oxygenated functional groups [31], which confirms the presence of an oxygenated compound on the biochar obtained at 300 °C. Finally, the band observed at 560 cm−1 may be attributed to P-O vibrations. The presence of P in the sample that was confirmed via EDX analyses; the high thermal stability of this band, which is still observed at 600 °C (Figure 5); and the data in the literature [30] support the made attribution.
As the temperature of pyrolysis increases to 350 °C, the intense band at 1750 cm−1 completely vanishes, the intensity of the band at 1585 cm−1 (C=C) increases (band height is 0.028 a.u. at 300 °C and 0.046 a.u. at 350 °C), and bands in the 900–700 cm−1 region become visible. Moreover, bands associated with the C-O chain and CH2 vibrations (1160 and 723 cm−1, respectively) decrease at this temperature. This trend continues up to 500 °C, where bands at 1585, 1030 and 723 and those in the 900–700 cm−1 region are mainly observed in the spectrum.
At 600 °C, most of bands are not visible due to organic functional groups, suggesting the complete degradation of these species. However, at this temperature, the band at 1030 cm−1, due to C-O vibrations, is still detected, revealing the presence of very stable oxygenated species.
In this work, the total concentration of PAH in the obtained biochars was not determined because the band’s intensity is not directly correlated with the PAH concentration when the ATR technique is used. In this case, a discussion in terms of relative intensities is more appropriate. Considering this fact and according to the data in the literature (see Introduction), the DOC of the PAH may be estimated from the ATR-FTIR spectra [21]. The evolution of the DOC with the pyrolysis temperature is depicted in Figure 6.
It needs to be noted that the low intensity of the bands in the 900–700 cm−1 region and the overlap with that at 723 cm−1 for the S-300 sample made it impossible to estimate the DOC, and therefore, this solid is not considered in Figure 6. It is observed that the DOC of the PAH increases up to ~500 °C, which is in good agreement with the data in the literature [18,32], but at T > 500 °C, the DOC strongly decreases, contrarily to what was expected. It was supposed that this effect was caused by the presence of inorganic salts in the raw material, and experiments that were designed to confirm this point were carried out.

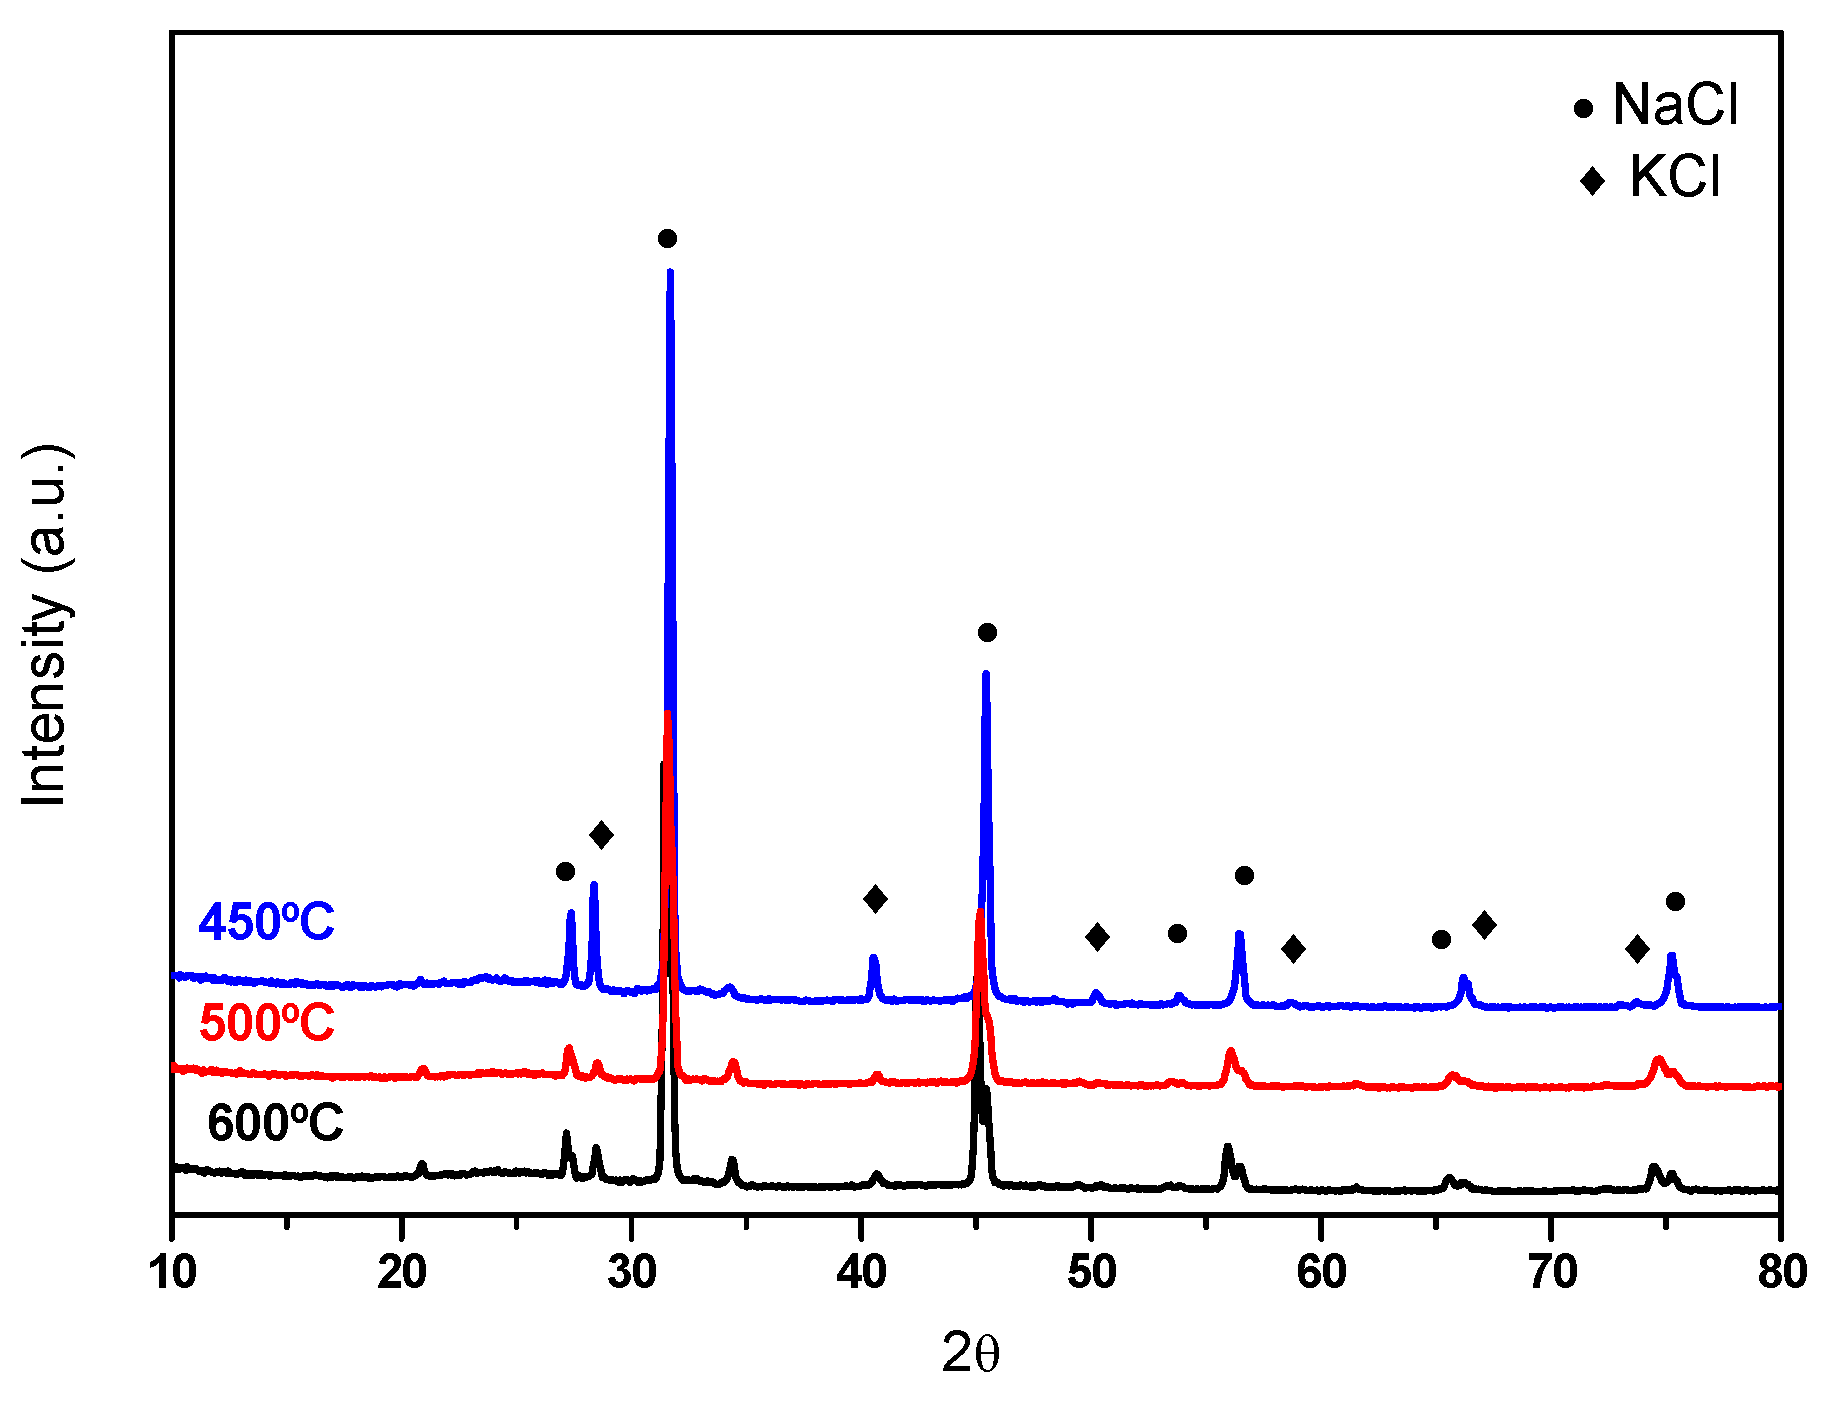
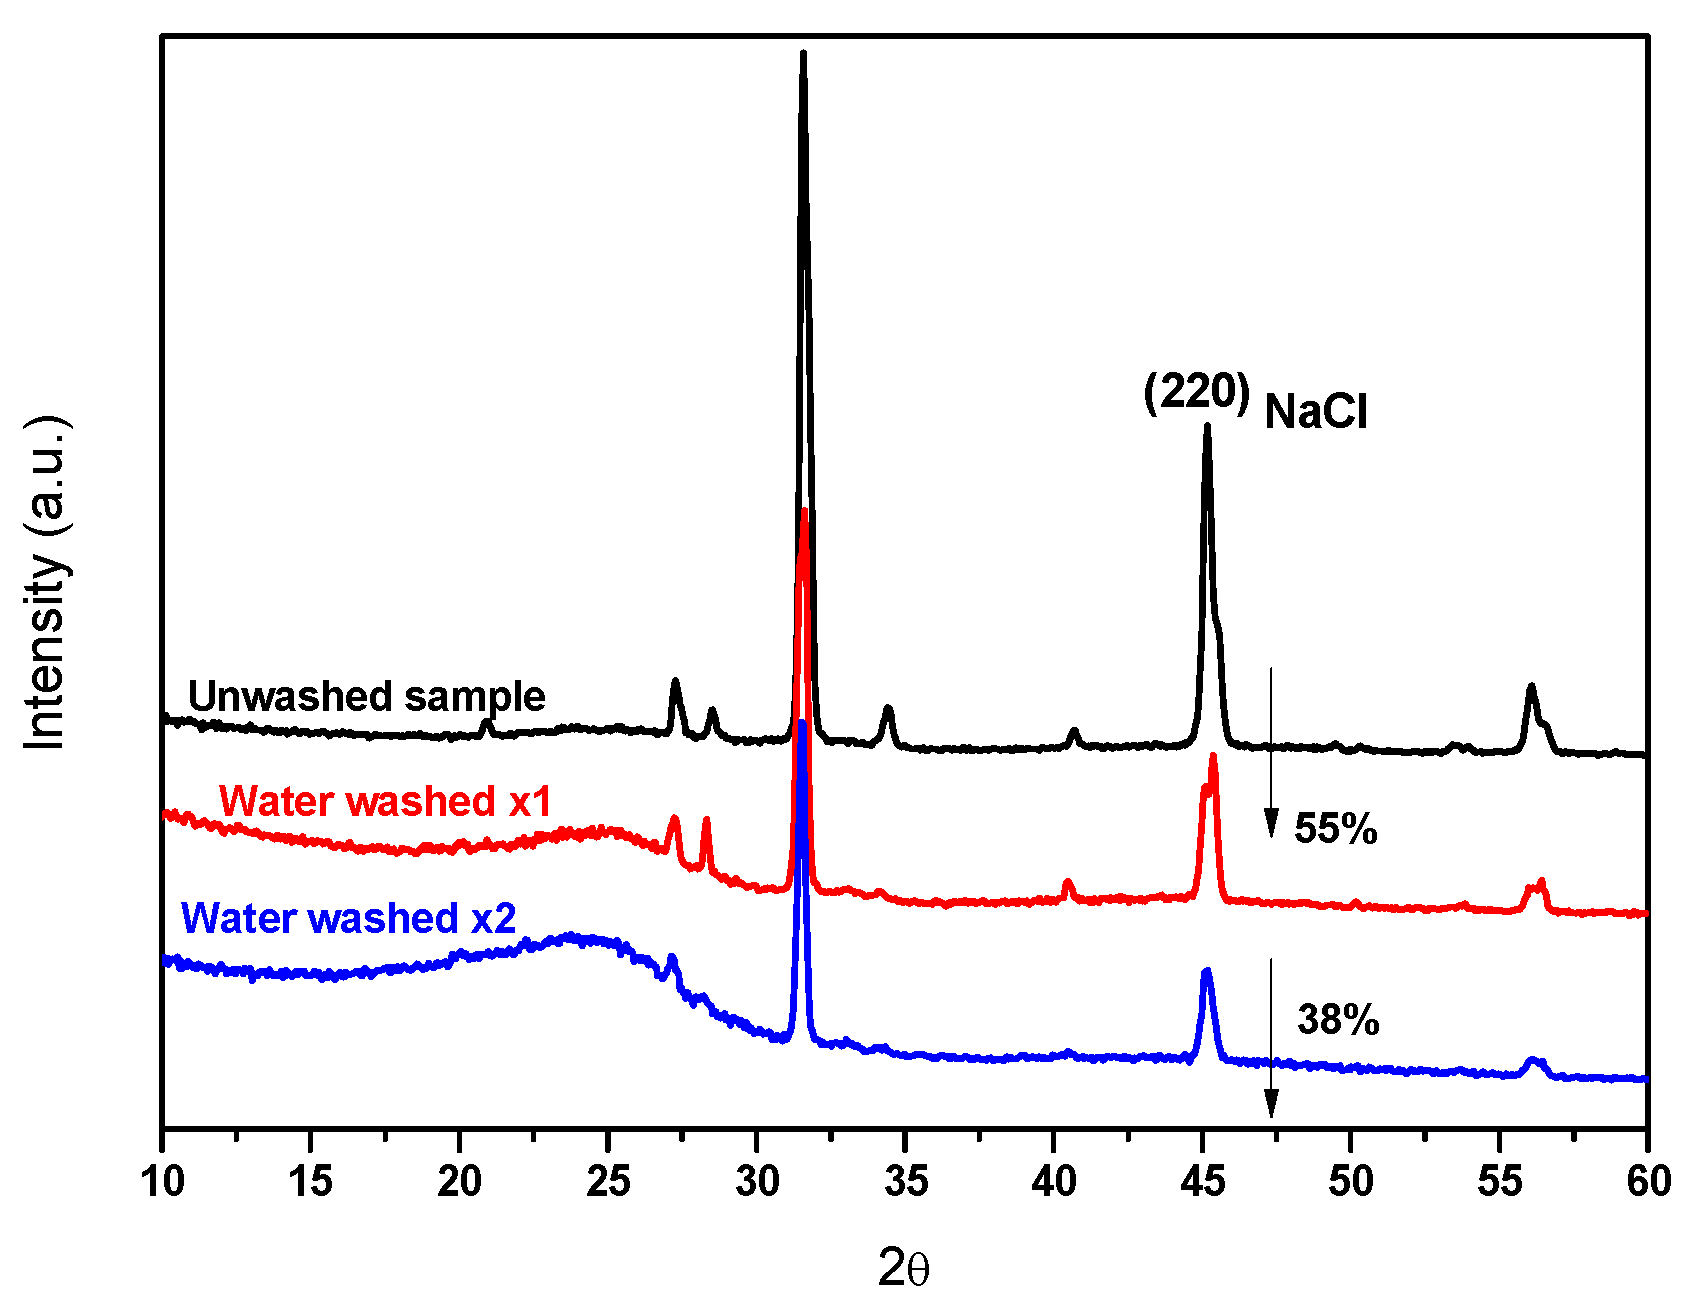
3.4. Influence of the Inorganic Salts on the Pyrolysis

In order to determine the effect of inorganic salts on the pyrolysis mechanism, the raw sample was water washed (1 or 2 times) before pyrolysis at 500 °C (similar conditions to those that were used previously). The obtained biochars were characterized via XRD (Figure 7) and ATR-FTIR spectroscopy (Figure 8). In these figures, the results for the biochar obtained from the unwashed sample (also at 500 °C) are included for comparison.
Figure 7 evidences the decrease in the intensity of the diffraction peaks corresponding to NaCl (KCl) with water washing: there were 55% and 38% reductions after water washing once and twice, respectively. The decreased intensity of these peaks permits us to observe a broad peak at around 24.2° that indicates the presence of graphite-like structures [26]. A comparison with an XRD diagram of commercial graphite (Figure 7) evidences the presence of these structures in the obtained biochars. Therefore, pre-treatment with water is an adequate method to remove, at least partially, the inorganic salts in the raw sample and may be used to analyze their effect on the biochar properties.
In Figure 8, bands around 3000 cm−1 (C-H vibrations of hydrocarbons) in the biochars obtained from the water-washed samples at 500 °C, which were not detected in the sample obtained from the unwashed biomass, are detected. However, the band at 723 cm−1 (chain vibrations) is not observed in the spectra of biochars obtained from the water-washed samples, evidencing the thermal degradation of the initial sample in the absence of inorganic salts. Also, a clear decrease in the band at 1030 cm1 (representative of oxygenated compounds) is observed for the water-washed samples. The estimated DOC for the samples obtained at 500 °C is similar for all the samples (1.8 for the unwashed biomass and 1.5 and 1.8 for the water-washed ones).
The evolution of the DOC with the temperature of pyrolysis for the water-washed samples is shown in Figure 6 (blue trace). The observed trend evidences the participation of inorganic salts in the mechanism of condensation of the PAH.

4. Discussion

The ultimate analysis of the raw sample reveals that the sample, despite having been subjected to repeated heating processes in the presence of oxygen during cooking, did not undergo severe modifications in its elemental composition, being similar to that of a conventional biomass.
The TG analyses indicate that there are three main processes in the thermal decomposition of the sample under an Ar flow (Figure 2). Firstly, the sample was dehydrated at 100 °C, with a calculated moisture content of 58%. The process observed at 170 °C was due to the organic matter decomposition (30.5%), and finally, a third mass loss (11.6%) was detected at 280 °C. In order to attribute the last mass loss, a new thermal treatment, now under an O2 flow, was conducted. In this, only a 5% mass loss, attributed to the biochar oxidation, was observed at around 300 °C. The remaining 6.5%, which did not produce volatile compounds via oxidation even when the sample was treated in an oxygen flow at 800 °C, suggests the presence of stable inorganic species in the initial material.
After pyrolysis, the decrease in the H and C contents in the solid reflect the elimination of these elements, probably in the form of light hydrocarbons, into liquid or gas phases (Table 1). This trend is similar to that observed after the pyrolysis of a conventional lignocellulosic biomass [24]. Contrary to what was expected, the O content in the biochar increases with respect to the initial material. This fact is explained by the formation of stable oxygenated compounds during the thermal treatment, as evidenced by the ATR-FTIR results (Figure 5). Thus, as the temperature increases, H and C are removed from the solid in the form of hydrocarbons with low molecular weights, while O remains on the surface, probably due to the interaction with alkali.
The XRD of the biochars reveals the presence of inorganic salts (NaCl and KCl) in the samples irrespective of the temperature of pyrolysis, which is in good agreement with the TG results (Figure 2). Therefore, we can affirm that the 6.5 wt.% detected in the TG as a residue after thermal treatment under an O2 flow corresponds to NaCl and KCl. The high thermal stability and low reactivity in the solid state of these salts explain their presence on the biochar surface after heating at 600 °C. As mentioned previously, these inorganic salts are usually used as seasonings for fried foods, and considering the origin of this waste, their presence is not surprising. We have to stress that the lower intensity of the peaks attributed to KCl compared to those due to NaCl and the analysis performed via XRD simulation reflect a lower concentration of the first one, which is in good agreement with the table salt composition [33]. Also, the EDX analysis corroborates the presence of Na, K, and Cl in the biochar, as well as certain amounts of P (component of edible oils), O, and C.
The SEM micrographs (Figure 4) show very big particles of biochar, which is in relation to the low specific surface area of these samples. The origin of this low specific surface area may be in the repeated cycles of heating suffered by the sample during cooking, since it is well stablished that temperature affects the specific surface area of solid materials [34].
In Figure 5, it is observed that the most complex spectrum is that corresponding to the biochar obtained a 300 °C, named S-300, in which the number of bands and the intensity of them evidence the presence of fatty acids or derivatives formed via oxidation, and suggest that the oil impregnating the raw sample is not completely degraded at this temperature. However, the oxidative process suffered by the sample is confirmed by the presence of aldehydes and ketones, which undoubtedly formed during the frying process. It is interesting to note the presence of a band at 723 cm−1 (chain vibrations) in the sample obtained at 300 °C. The intensity of this band is used to evaluate the quality of edible oils [31]. Since the oil oxidation processes cause the breakdown of the hydrocarbon chains, a high degree of oxidation (oil degradation) is reflected by a low intensity of the band at 723 cm−1. Therefore, its presence in the S-300 sample confirms that used oils are not completely degraded at this temperature.
As the pyrolysis temperature increases to 350 °C, oxygenated compounds are transformed into aromatics, as indicated by the decrease in the band of aldehydes and the increase in those due to ν(C=C) vibrations and out-of-plane =C-H (900–700 cm−1 region). This is in line with the data in the literature reporting that aromatization reactions occur in the early steps of pyrolysis [18,19], increasing the PAH yields. Moreover, bands due to chain C-O and CH2 vibrations together with the band at 723 cm−1 decrease, evidencing the breakdown of the hydrocarbon chains via a thermal effect or a reaction [31,32]. This decomposition can result in the formation of small hydrocarbons that pass to the gas phase, which explains the low H/C ratio measured for biochars (Table 1). For higher temperatures, a continuous decrease in the bands’ intensities is observed. At the highest temperature studied, 600 °C, the band at 1030 cm−1 attributed to C-O vibrations is still observed, confirming the presence of very stable oxygenated species, for example, pyrone-like compounds that are stable up to 900–1200 °C [26]. This fact explains the unexpected high value of the O/C ratio obtained from the ultimate analysis (Table 1).
In relation to the DOC of the PAH, the mechanism proposed in the literature is summarized in Scheme 1. At temperatures higher than 500 °C, PAHs partially crack to form unstable radicals that, through condensation reactions, produce PAHs with a higher number of aromatic rings in their structure, that is, a higher DOC [32].
The DOC calculated as a function of the temperature (black line in Figure 6) increases to 500 °C and decreases for higher temperatures, contrarily to the data reported in the literature [32]. The observed trend suggests that the cracking reaction (1) occurs at T > 500 °C, but the condensation reactions seem to be limited. As the initial biomass composition is similar to that of a conventional biomass, the unexpected evolution of the DOC with the temperature should be caused by the presence of inorganic salts, such as NaCl (and KCl), in the initial material [35,36].
In order to determine its effect, these salts were removed from the raw sample (at least partially), and pyrolysis was carried out in similar conditions to those previously used. In some works, samples initially containing alkali and earth alkali were treated in an acid media in order to remove the inorganic salts and observe their effect, but the deep modification of the initial sample via the acid treatment impeded a proper analysis. In our case, as the alkali are in the forms of NaCl and KCl, which are both soluble in water, the raw sample was water washed (one or two times), and then pyrolysis was performed in similar conditions to those previously used. The diagrams of the XRD of the biochars obtained at 500 °C show a lower intensity of the NaCl and KCl peaks in the water-washed samples, evidencing that this is a suitable method to remove, at least partially, the inorganic salts from the feedstock (Figure 7). A broad peak at 24.2° becomes visible as the salts are removed (water washed samples). By comparing those diagrams with the XRD diagram of commercial graphite, we can attribute this peak to graphite-like structures.
A comparison of the ATR-FTIR spectra of the biochar obtained from the unwashed and water-washed samples obtained at 500 °C (Figure 8) reveals the following:
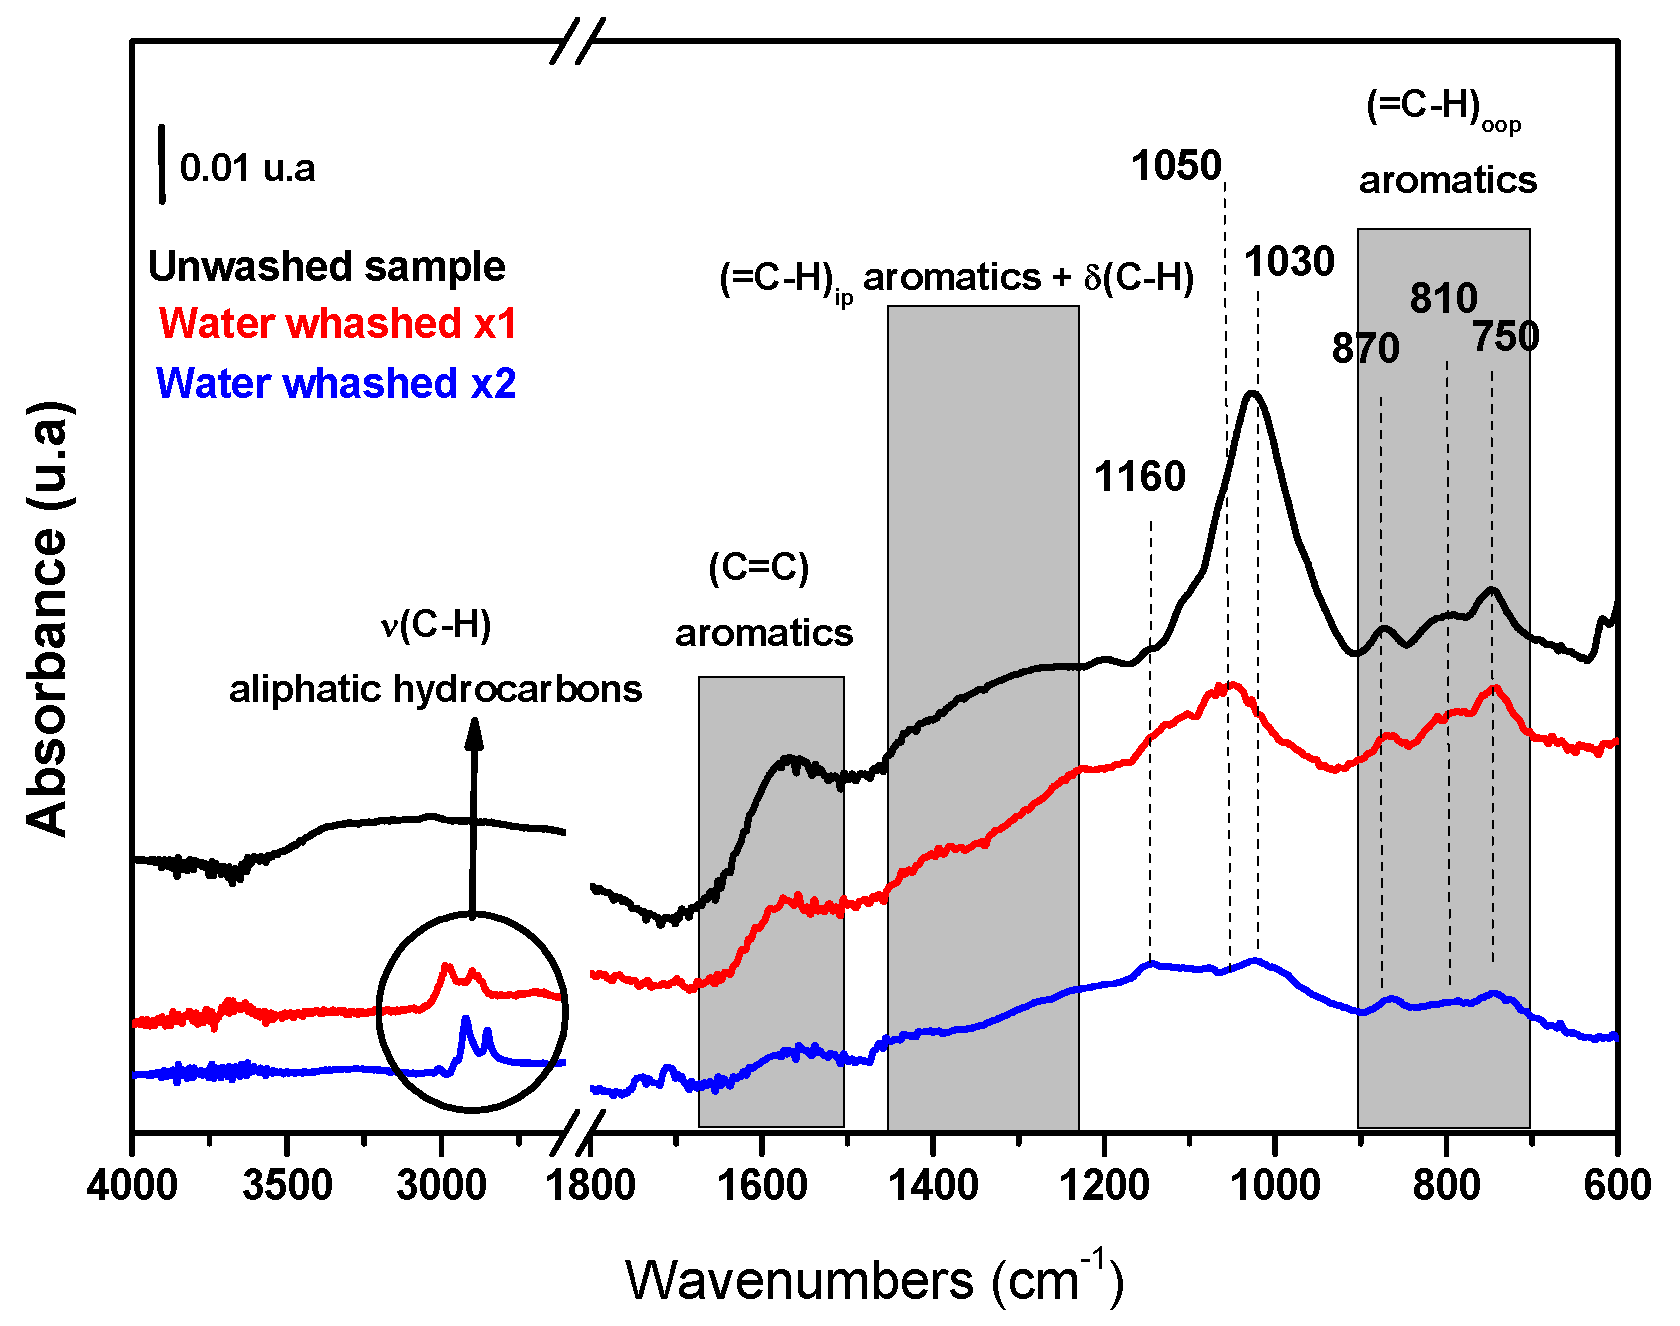
  • The presence of bands around 3000 cm−1, due to aliphatic hydrocarbons in the biochars obtained from the water-washed samples (not detected in the unwashed sample), evidences the incomplete decomposition of the initial material. Given that in similar conditions of pyrolysis, the degree of decomposition is lower when inorganic salts are eliminated, we can think that this is a catalytic effect of these salts, as previously reported in the literature [35,36].
  • There is a strong decrease in the band at 1030 cm−1 in the biochar obtained from the water-washed samples, evidencing that inorganic salts stabilize oxygenated compounds on the biochar surface. The retention of oxygenated compounds on the solid surface will influence the O/C ratio in the other products (bio-oil and gas), which is a very interesting factor from the point of view of the utilization of these fractions in the energy field [37].
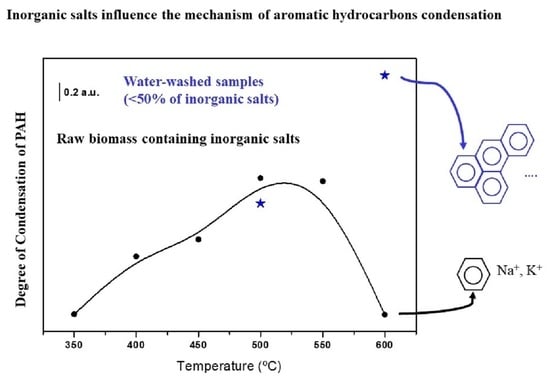
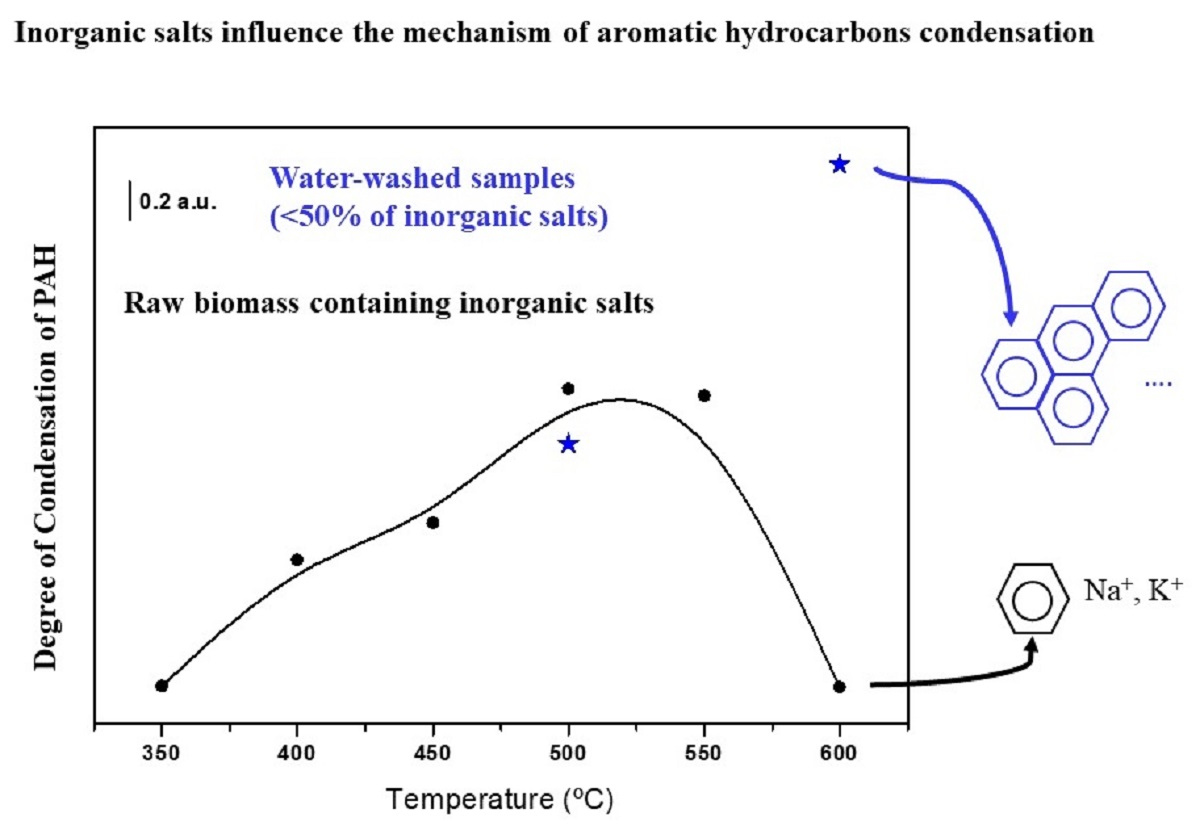
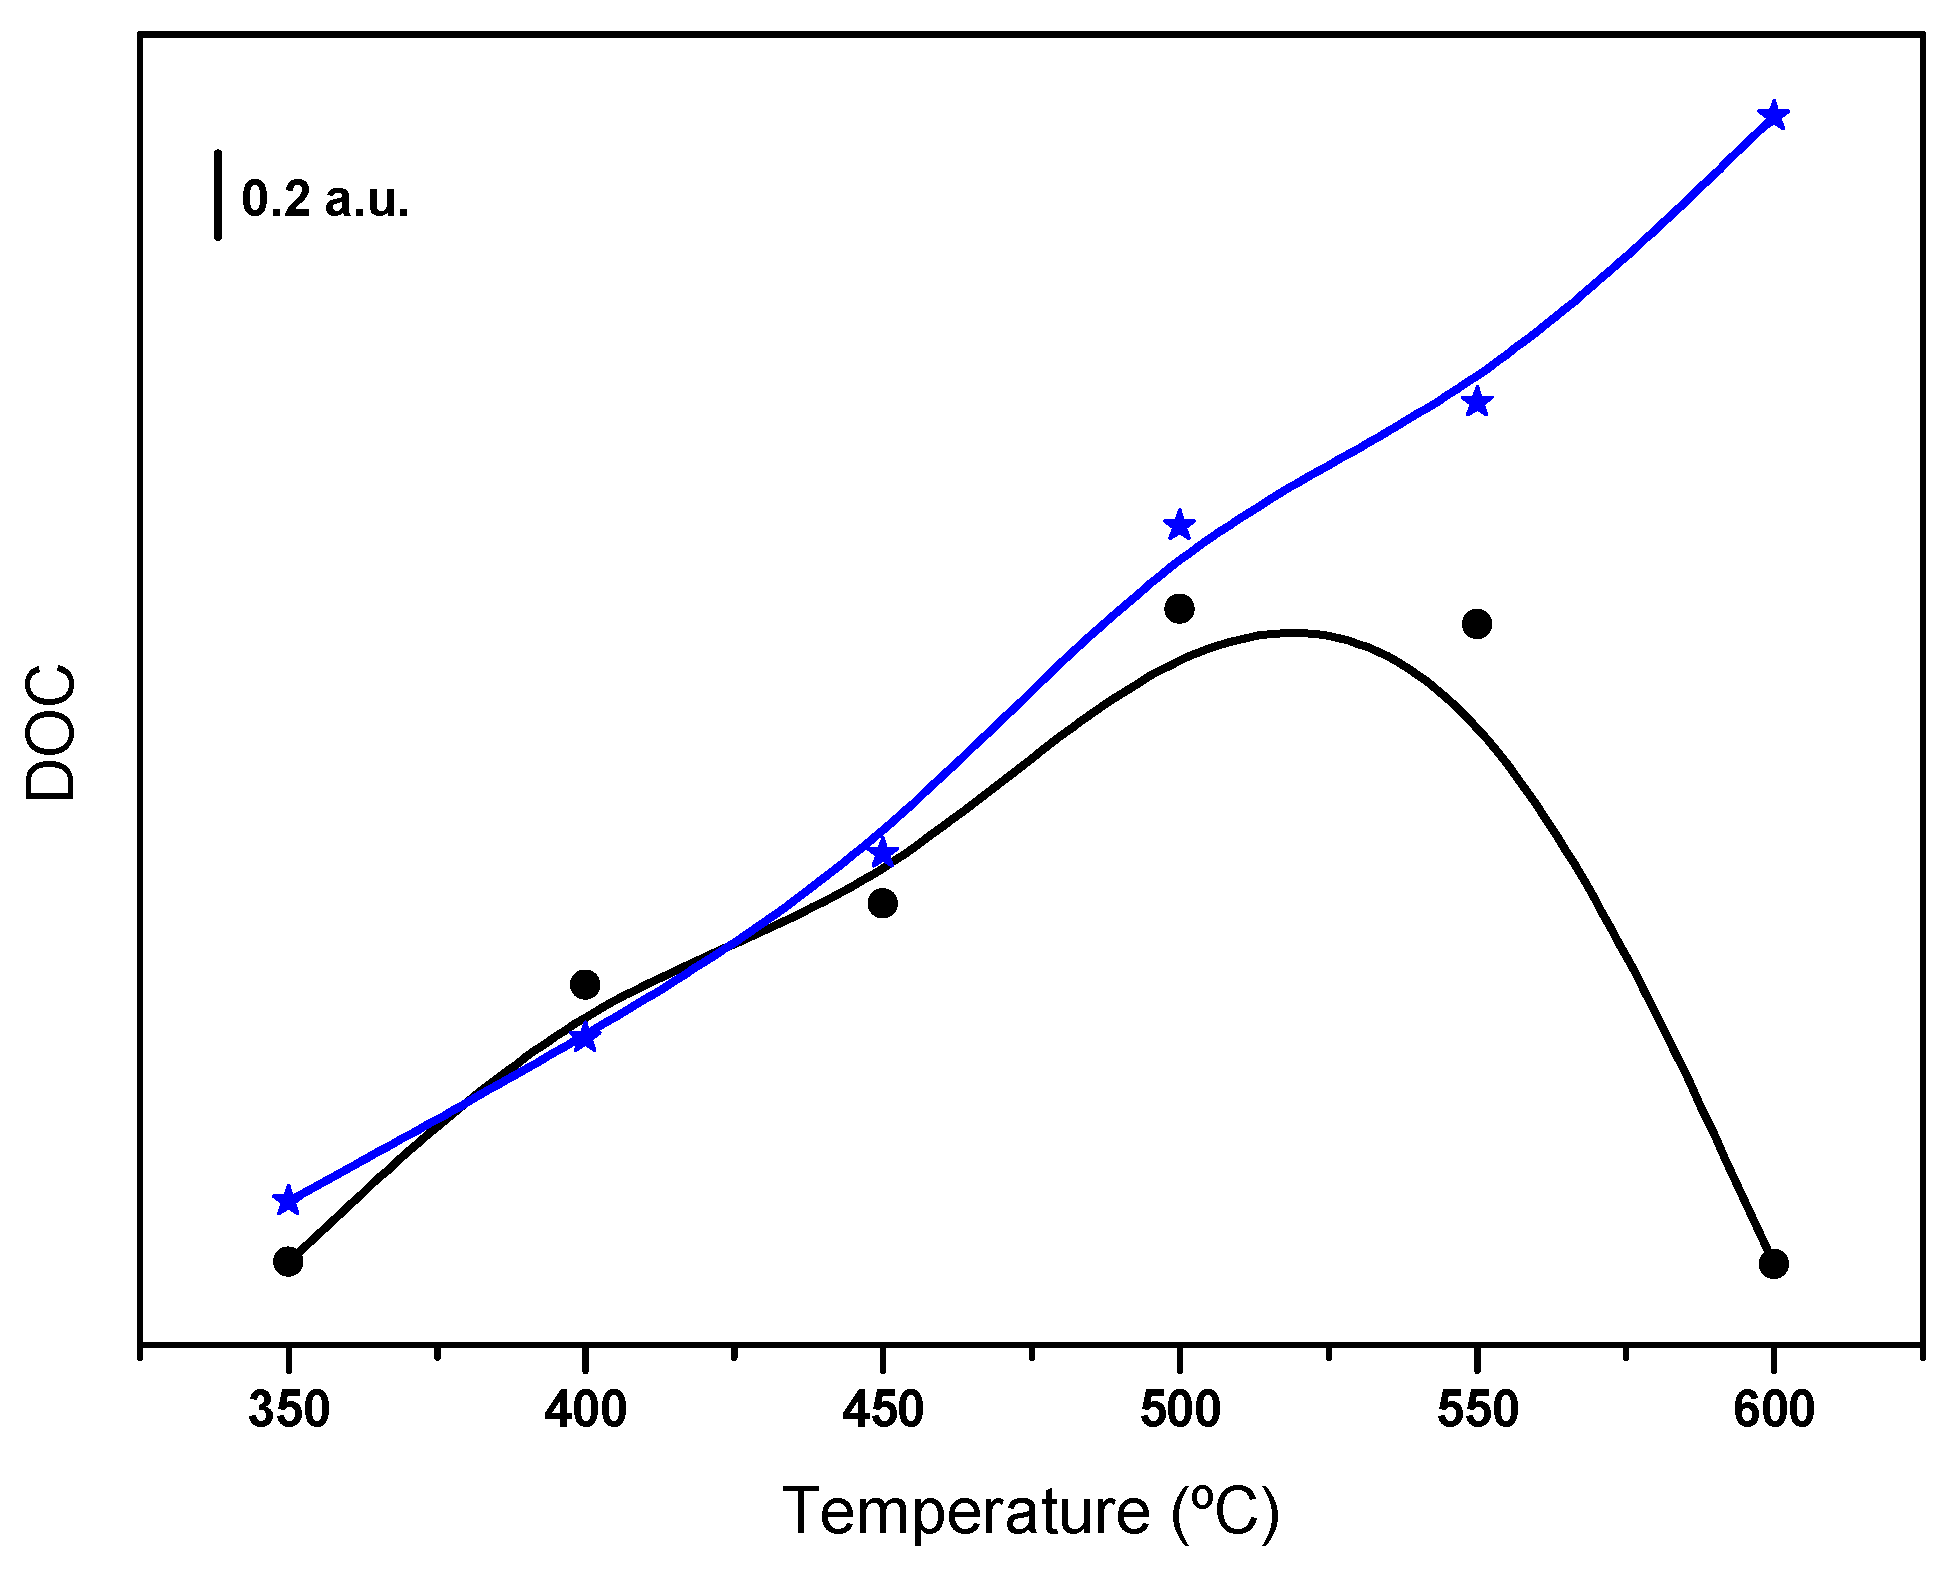
  • The DOC calculated for the biochar obtained from the water-washed samples at T > 500 °C (Figure 6, blue trace) is much higher in the absence of inorganic salts. This fact clearly evidences the participation of NaCl (KCl) in the mechanism of PAH condensation, probably stabilizing the free radicals, intermediate of the condensation process, as indicated in schema 1. This fact was previously discussed in the literature [38].
These data open up a way to exploit a highly polluting waste that is currently underutilized. Taking into account the catalytic effect of the inorganic salts contained in this residue on the thermal degradation of the initial sample and their influence on the condensation mechanism of PAH, its use as an additive in the pyrolysis of conventional biomass should be considered for study. Moreover, the stabilization of oxygenated compounds on the biochar surface could modify the liquid and/or gas compositions, which is very interesting from the point of view of the energetic exploitation of these fractions.

5. Conclusions

In this study, biochars obtained via pyrolysis of a non-conventional biomass, which are the solid wastes in used edible oils, were studied. The XRD evidenced the presence of NaCl (KCl) in all the samples irrespective of the pyrolysis temperature. A deep analysis via ATR-FTIR spectroscopy of samples with different inorganic salt contents permitted us to analyze their effect on the biochar properties. The main aspects detected are the following:
  • Inorganic salts have a catalytic effect on the sample thermal degradation at temperatures lower than 500 °C, but the DOC of the PAH is not strongly affected at these temperatures.
  • In their presence, oxygenated groups are stabilized on the biochar surface. This aspect may affect the composition of gas and liquid fractions obtained via pyrolysis.
  • These salts participate in the mechanism of PAH condensation at temperatures higher than 500 °C, causing a decrease in the DOC of PAHs in their presence.

Author Contributions

Conceptualization, F.R.-S. and M.D.A.; methodology, F.R.-S., M.D.A. and M.C.H.; formal analysis, F.R.-S. and M.D.A.; investigation, C.R., M.C.H. and J.M.C.; data curation, F.R.-S.; writing—original draft preparation, F.R.-S.; writing—review and editing, M.C.H., C.R. and J.M.C.; funding acquisition, M.C.H. and F.R.-S. All authors have read and agreed to the published version of the manuscript.

Funding

This work received financial support from “Ministerio de Ciencia e Innovación and Agencia Estatal de Investigación” (PID2021-122413NB-I00) and the grant TED2021-129267B-I00, which was funded by MCIN/AEI/10.13039/501100011033 and by the “European Union NextGenerationEU/PRTR”.

Institutional Review Board Statement

Not applicable.

Informed Consent Statement

Not applicable.

Data Availability Statement

The data will be available on demand.

Acknowledgments

The authors would like to acknowledge the support of SAVISOL, S. L.

Conflicts of Interest

The authors declare no conflict of interest.

References

  1. Gromada, A.; Trebska, P.; Wysokinski, P. Use of energy in Polish agriculture. In Proceedings of the 19th International Scientific Conference on Economic Science for Rural Development, Jelgava, Latvia, 9–11 May 2018. [Google Scholar] [CrossRef]
  2. Herc, L.; Pfeifer, A.; Duic, N. Optimization of the possible pathways for gradual energy system decarbonization. Renew. Energy 2022, 193, 617–633. [Google Scholar] [CrossRef]
  3. Din, M.I.; Ameen, S.; Hussain, Z.; Khalid, R.; Hussain, T.; Mujahid, A. A review on biomass selection criteria and its preliminary test for pyrolysis technique. Int. J. Environ. Anal. Chem. 2021, 101, 1–12. [Google Scholar] [CrossRef]
  4. Shukla, P.; Giri, B.S.; Mishra, R.K.; Pandey, A.; Chaturvedi, P. Lignocellulosic biomass-based engineered biochar composites: A facile strategy for abatement of emerging pollutants and utilization in industrial applications. Renew. Sustain. Energy Rev. 2021, 152, 111643. [Google Scholar] [CrossRef]
  5. Kan, T.; Strezov, V.; Evans, T.J. Lignocellulosic biomass pyrolysis: A review of product properties and effects of pyrolysis parameters. Renew. Sustain. Energy Rev. 2016, 57, 1126–1140. [Google Scholar] [CrossRef]
  6. Agegnehu, G.; Srivastava, A.K.; Bird, M. The role of biochar and biochar-compost in improving soil quality and crop performance: A review. Appl. Soil Ecol. 2017, 119, 156–170. [Google Scholar] [CrossRef]
  7. Laird, D.A. The Charcoal Vision: A Win–Win–Win Scenario for Simultaneously Producing Bioenergy, Permanently Sequestering Carbon, while Improving Soil and Water Quality. Agron. J. 2008, 100, 178–181. [Google Scholar] [CrossRef]
  8. Wang, S.; Wang, N.; Yao, K.; Fan, Y.; Li, W.; Han, W.; Yin, X.; Chen, D. Characterization and Interpretation of Cd (II) Adsorption by Different Modified Rice Straws under Contrasting Conditions. Sci. Rep. 2019, 9, 17868. [Google Scholar] [CrossRef]
  9. Shan, R.; Shi, Y.; Gu, J.; Wang, Y.; Yuan, H. Single and competitive adsorption affinity of heavy metals toward peanut shell-derived biochar and its mechanisms in aqueous systems. Chin. J. Chem. Eng. 2020, 28, 1375–1383. [Google Scholar] [CrossRef]
  10. Lee, J.; Kim, K.H.; Kwon, E.E. Biochar as a Catalyst. Renew. Sustain. Energy Rev. 2017, 77, 70–79. [Google Scholar] [CrossRef]
  11. Peterson, S.C.; Jackson, M.A.; Kim, S.; Palmquist, D.E. Increasing biochar surface area: Optimization of ball milling parameters. Powder Technol. 2012, 228, 115–120. [Google Scholar] [CrossRef]
  12. Liu, Y.R.; Paskevicius, M.; Wang, H.Q.; Parkinson, G.; Wei, J.T.; Akhtar, M.A.; Li, C.Z. Insights into the mechanism of tar reforming using biochar as a catalyst. Fuel 2021, 296, 120672. [Google Scholar]
  13. Koutcheiko, S.; Monreal, C.M.; Kodama, H.; McCracken, T.; Kotlyar, L. Preparation and characterization of activated carbon derived from the thermo-chemical conversion of chicken manure. Bioresour. Technol. 2007, 98, 2459–2464. [Google Scholar] [CrossRef]
  14. Tsoutsos, T.; Tournaki, S.; Gkouskos, Z.; Paraíba, O.; Giglio, F.; Quero García, P.; Braga, J.; Adrianos, H.; Filice, M. Quality Characteristics of Biodiesel Produced from Used Cooking Oil in Southern Europe. ChemEngineering 2019, 3, 19. [Google Scholar]
  15. Singh, E.; Mishra, R.; Kumar, A.; Shukla, S.K.; Lo, S.-L.; Kumar, S. Circular economy-based environmental management using biochar: Driving towards sustainability. Process. Saf. Environ. Prot. 2022, 163, 585–600. [Google Scholar]
  16. Muzyka, R.; Misztal, E.; Hrabak, J.; Banks, S.W.; Sajdak, M. Various biomass pyrolysis conditions influence the porosity and pore size distribution of biochar. Energy 2023, 263, 126128. [Google Scholar]
  17. Greco, G.; Videgain, M.; Di Stasi, C.; Pires, E.; Manya, J.J. Importance of pyrolysis temperature and pressure in the concentration of polycyclic aromatic hydrocarbons in wood waste-derived biochars. J. Anal. Appl. Pyrolysis 2021, 159, 105337. [Google Scholar]
  18. Palade, L.M.; Negoit, M.; Adascălului, A.C.; Mihai, A.L. Polycyclic Aromatic Hydrocarbon Occurrence and Formation in Processed Meat, Edible Oils, and Cereal-Derived Products: A Review. Appl. Sci. 2023, 13, 7877. [Google Scholar]
  19. Keiluweit, M.; Nico, P.S.; Johnson, M.G.; Kleber, M. Dynamic Molecular Structure of Plant Biomass-Derived Black Carbon (Biochar). Environ. Sci. Technol. 2010, 44, 1247–1253. [Google Scholar]
  20. Pasieczna-Patkwoska, S.; Madej, J. Comparison of photoacoustic, diffuse reflectance, attenuated total reflectance and transmission spectroscopy for the study of biochars. Pol. J. Chem. Technol. 2018, 20, 75–83. [Google Scholar]
  21. Montiano, M.G.; Fernández, A.M.; Díaz-Faes, E.; Barriocanal, C. Tar from biomass/coal-containing briquettes. Evaluation of PAHs. Fuel 2015, 154, 261–267. [Google Scholar]
  22. Billaud, F.; Gornay, J.; Coniglio, L. Pyrolysis of secondary raw material from used frying oils. Récents Progrès Génie Procédés 2007, 94, 1–8. [Google Scholar]
  23. Yang, H.; Huan, B.; Chen, Y.; Gao, Y.; Li, J.; Chen, H. Biomass-based pyrolytic polygeneration system for bamboo industry waste: Evolution of the char structure and the pyrolysis mechanism. Energy Fuels 2016, 30, 6430–6439. [Google Scholar]
  24. Zhao, Y.; Feng, D.; Zhang, Y.; Huang, Y.; Sun, S. Effect of pyrolysis temperature on char structure and chemical speciation of alkali and alkaline earth metallic species in biochar. Fuel Process. Technol. 2016, 141, 54–60. [Google Scholar]
  25. Mishra, R.K.; Mohanty, K. Pyrolysis characteristics, fuel properties, and compositional study of Madhuca longifoliaseeds over metal oxide catalysts. Biomass Convers. Biorefin. 2020, 10, 621–637. [Google Scholar]
  26. Uchimiya, M.; Wartelle, L.H.; Klasson, K.T.; Fortier, C.A.; Lima, I.M. Influence of Pyrolysis Temperature on Biochar Property and Function as a Heavy Metal Sorbent in Soil. J. Agric. Food. Chem. 2011, 59, 2501–2510. [Google Scholar]
  27. Choe, E.; Min, D.B. Mechanisms and Factors for Edible Oil Oxidation. Compr. Rev. Food Sci. Food Saf. 2006, 5, 169–186. [Google Scholar]
  28. Zhang, C.; Zhang, L.; Gao, J.; Zhang, S.; Liu, Q.; Duan, P. Evolution of the functional groups/structures of biochar and heteroatoms during the pyrolysis of seaweed. Algal Res. 2020, 48, 101900. [Google Scholar]
  29. Hernández, S.A.; Zacconi, F.C.M. Sweet almond oil: Extraction, characterization and application. Quim. Nova 2009, 35, 1342–1345. [Google Scholar] [CrossRef]
  30. Yoshikawa, N.; Sato, H.; Ohya, H. A Method for Determining the Composition of Aqueous Highly Concentrated Salt Mixture Solutions by Attenuated Total-Reflectance IR Spectrometry. Anal. Sci. 1998, 14, 803–808. [Google Scholar]
  31. Chen, H.; Zhang, J.; Tang, L.; Su, M.; Tian, D.; Zhang, L.; Li, Z.; Hu, S. Enhanced Pb Immobilization via the combination of biochar and phosphate solubilizing bacteria. Environ. Int. 2019, 127, 395–401. [Google Scholar]
  32. Wang, M.; Chen, J.; Jing, B.; Zhang, L.; Dong, Y.; Yu, X. Analysis of Reaction Kinetics of Edible Oil Oxidation at Ambient Temperature by FTIR Spectroscopy. Eur. J. Lipid Sci. Technol. 2020, 122, 1900302. [Google Scholar] [CrossRef]
  33. Nor Azman, N.A.N.M.; Asmadi, M.; Amin, N.A.S.; Shamjuddin, A.; Zainol, M.M.; Phaiboonsilpa, N.; Kawamoto, H. Polycyclic Aromatic Hydrocarbons Occurrences in BiomassChar and Its Mitigation Approaches: A Mini Review. ChemBioEng Rev. 2023, 10, 462–479. [Google Scholar] [CrossRef]
  34. Obradovic, N.; Stevanovic, S.; Zeljkovic, V.; Ristic, M.M. Influence of ZnO specific surface area on its sintering kinetics. Powder Metall. Met. Ceram. 2009, 48, 182–185. [Google Scholar] [CrossRef]
  35. Wang, W.; Lemaire, R.; Bensakhria, A.; Luart, D. Analysis of the Catalytic Effects Induced by Alkali and Alkaline Earth Metals (AAEMs) on the Pyrolysis of Beech Wood and Corncob. Catalysts 2022, 12, 1505. [Google Scholar]
  36. He, J.J.; Li, J.Y.; Wang, R.P.; Fang, X.D.; Huang, Q.X.; Wang, S.K.; Long, J.S. Effect of Potassium Chloride on the Nanostructure and Reactivity of Soot Particles from Combustion of Solid Waste. Energy Fuels 2023, 37, 1247–1256. [Google Scholar] [CrossRef]
  37. Marinescu, M.; Popovici, D.R.; Bombos, D.; Vasilievici, G.; Rosca, P.; Oprescu, E.E.; Bolocan, I. Hydrodeoxygenation and hydrocracking of oxygenated compounds over CuPd/γ-Al2O3–ZSM-5 catalyst. React. Kinet. Mech. Catal. 2021, 133, 1013–1026. [Google Scholar]
  38. Feng, D.; Shang, Q.; Dong, H.; Zhang, Y.; Wang, Z.; Li, D.; Xie, M.; Wei, Q.; Zhao, Y.; Sun, S. Catalytic mechanism of Na on coal pyrolysis-derived carbon black formation: Experiment and DFT simulation. Fuel Process. Technol. 2021, 224, 107011. [Google Scholar]
Figure 1. Schematic representation of the pyrolysis system.
Spectroscj 01 00009 g001
Figure 2. Thermogravimetric analysis of the initial biomass.
Spectroscj 01 00009 g002
Figure 3. XRD of the S-450, S-500, and S-600 samples.
Spectroscj 01 00009 g003
Figure 4. SEM micrographs of the S-600 sample and EDX analysis.
Spectroscj 01 00009 g004
Figure 5. ATR-FTIR spectra of biochars obtained via pyrolysis at different temperatures.
Spectroscj 01 00009 g005
Figure 6. DOC of PAH as a function of the temperature of pyrolysis of the raw (black trace) and water-washed feedstocks (blue trace).
Spectroscj 01 00009 g006
Figure 7. XRD of biochars obtained from the unwashed biomass (black), biomass water washed once via pyrolysis (red), and biomass water washed twice (blue) via pyrolysis at 500 °C. Commercial graphite (magenta).
Spectroscj 01 00009 g007
Figure 8. ATR-FTIR spectra of biochars obtained via pyrolysis at 500 °C from the unwashed biomass (black), biomass water washed once (red), and biomass water washed twice (blue).
Spectroscj 01 00009 g008
Scheme 1. Summary of PAH condensation mechanism at T > 500 °C [30].
Spectroscj 01 00009 sch001
Table 1. Ultimate analysis (wt.%) of the raw sample and biochars obtained at 450, 500, and 600 °C.
SampleTemperature (°C)CHO 1NSH/C 2O/C 2
S-Initial-50.667.1539.732.360.111.690.56
S-45045043.241.9552.232.430.080.540.92
S-50050041.311.2854.642.680.090.370.99
S-60060042.310.9853.652.940.120.280.97
1 Calculated by difference; 2 molar ratios.
Disclaimer/Publisher’s Note: The statements, opinions and data contained in all publications are solely those of the individual author(s) and contributor(s) and not of MDPI and/or the editor(s). MDPI and/or the editor(s) disclaim responsibility for any injury to people or property resulting from any ideas, methods, instructions or products referred to in the content.

