
Improvements in the Robustness of Mid-Infrared Spectroscopy Models against Chemical Interferences: Application to Monitoring of Anaerobic Digestion Processes

 ,
, 
Abstract
:1. Introduction
2. Materials and Methods
2.1. Experimental Procedure
2.1.1. Process
2.1.2. Addition of Ammonia in the Reactor
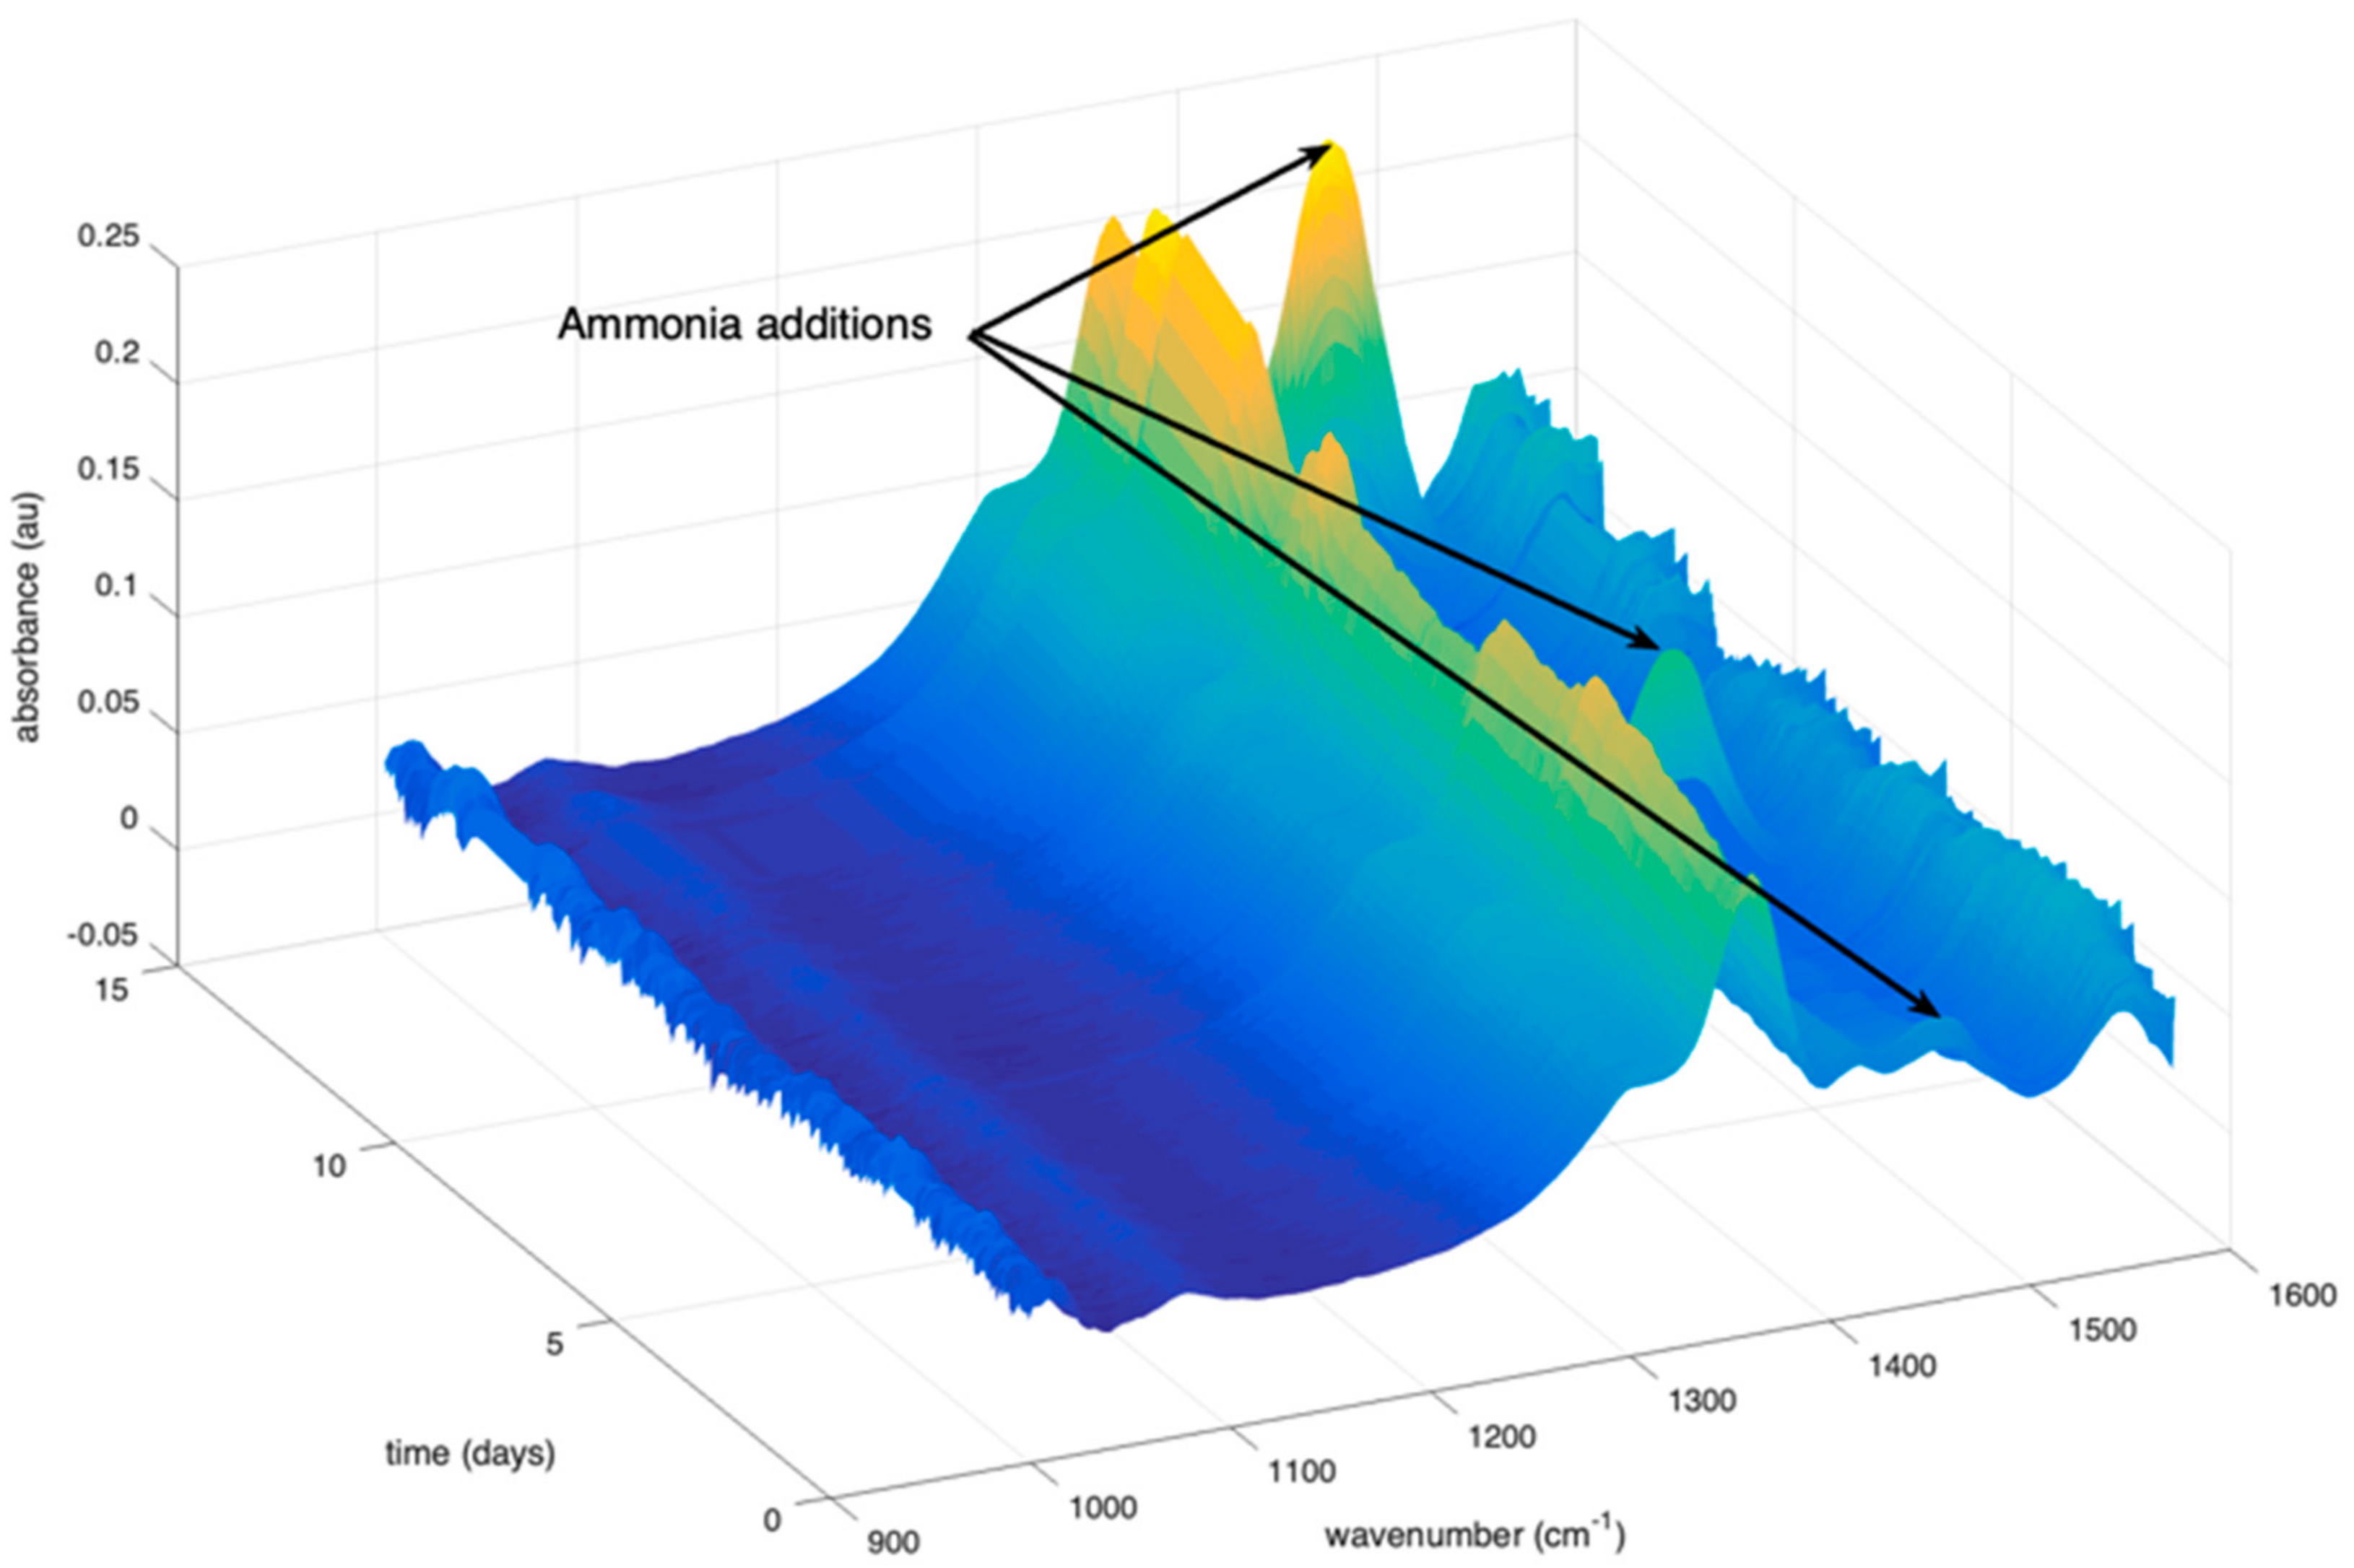
2.1.3. MIR Spectra Collected on the Bioreactor
2.2. Chemometrics
2.2.1. Notations
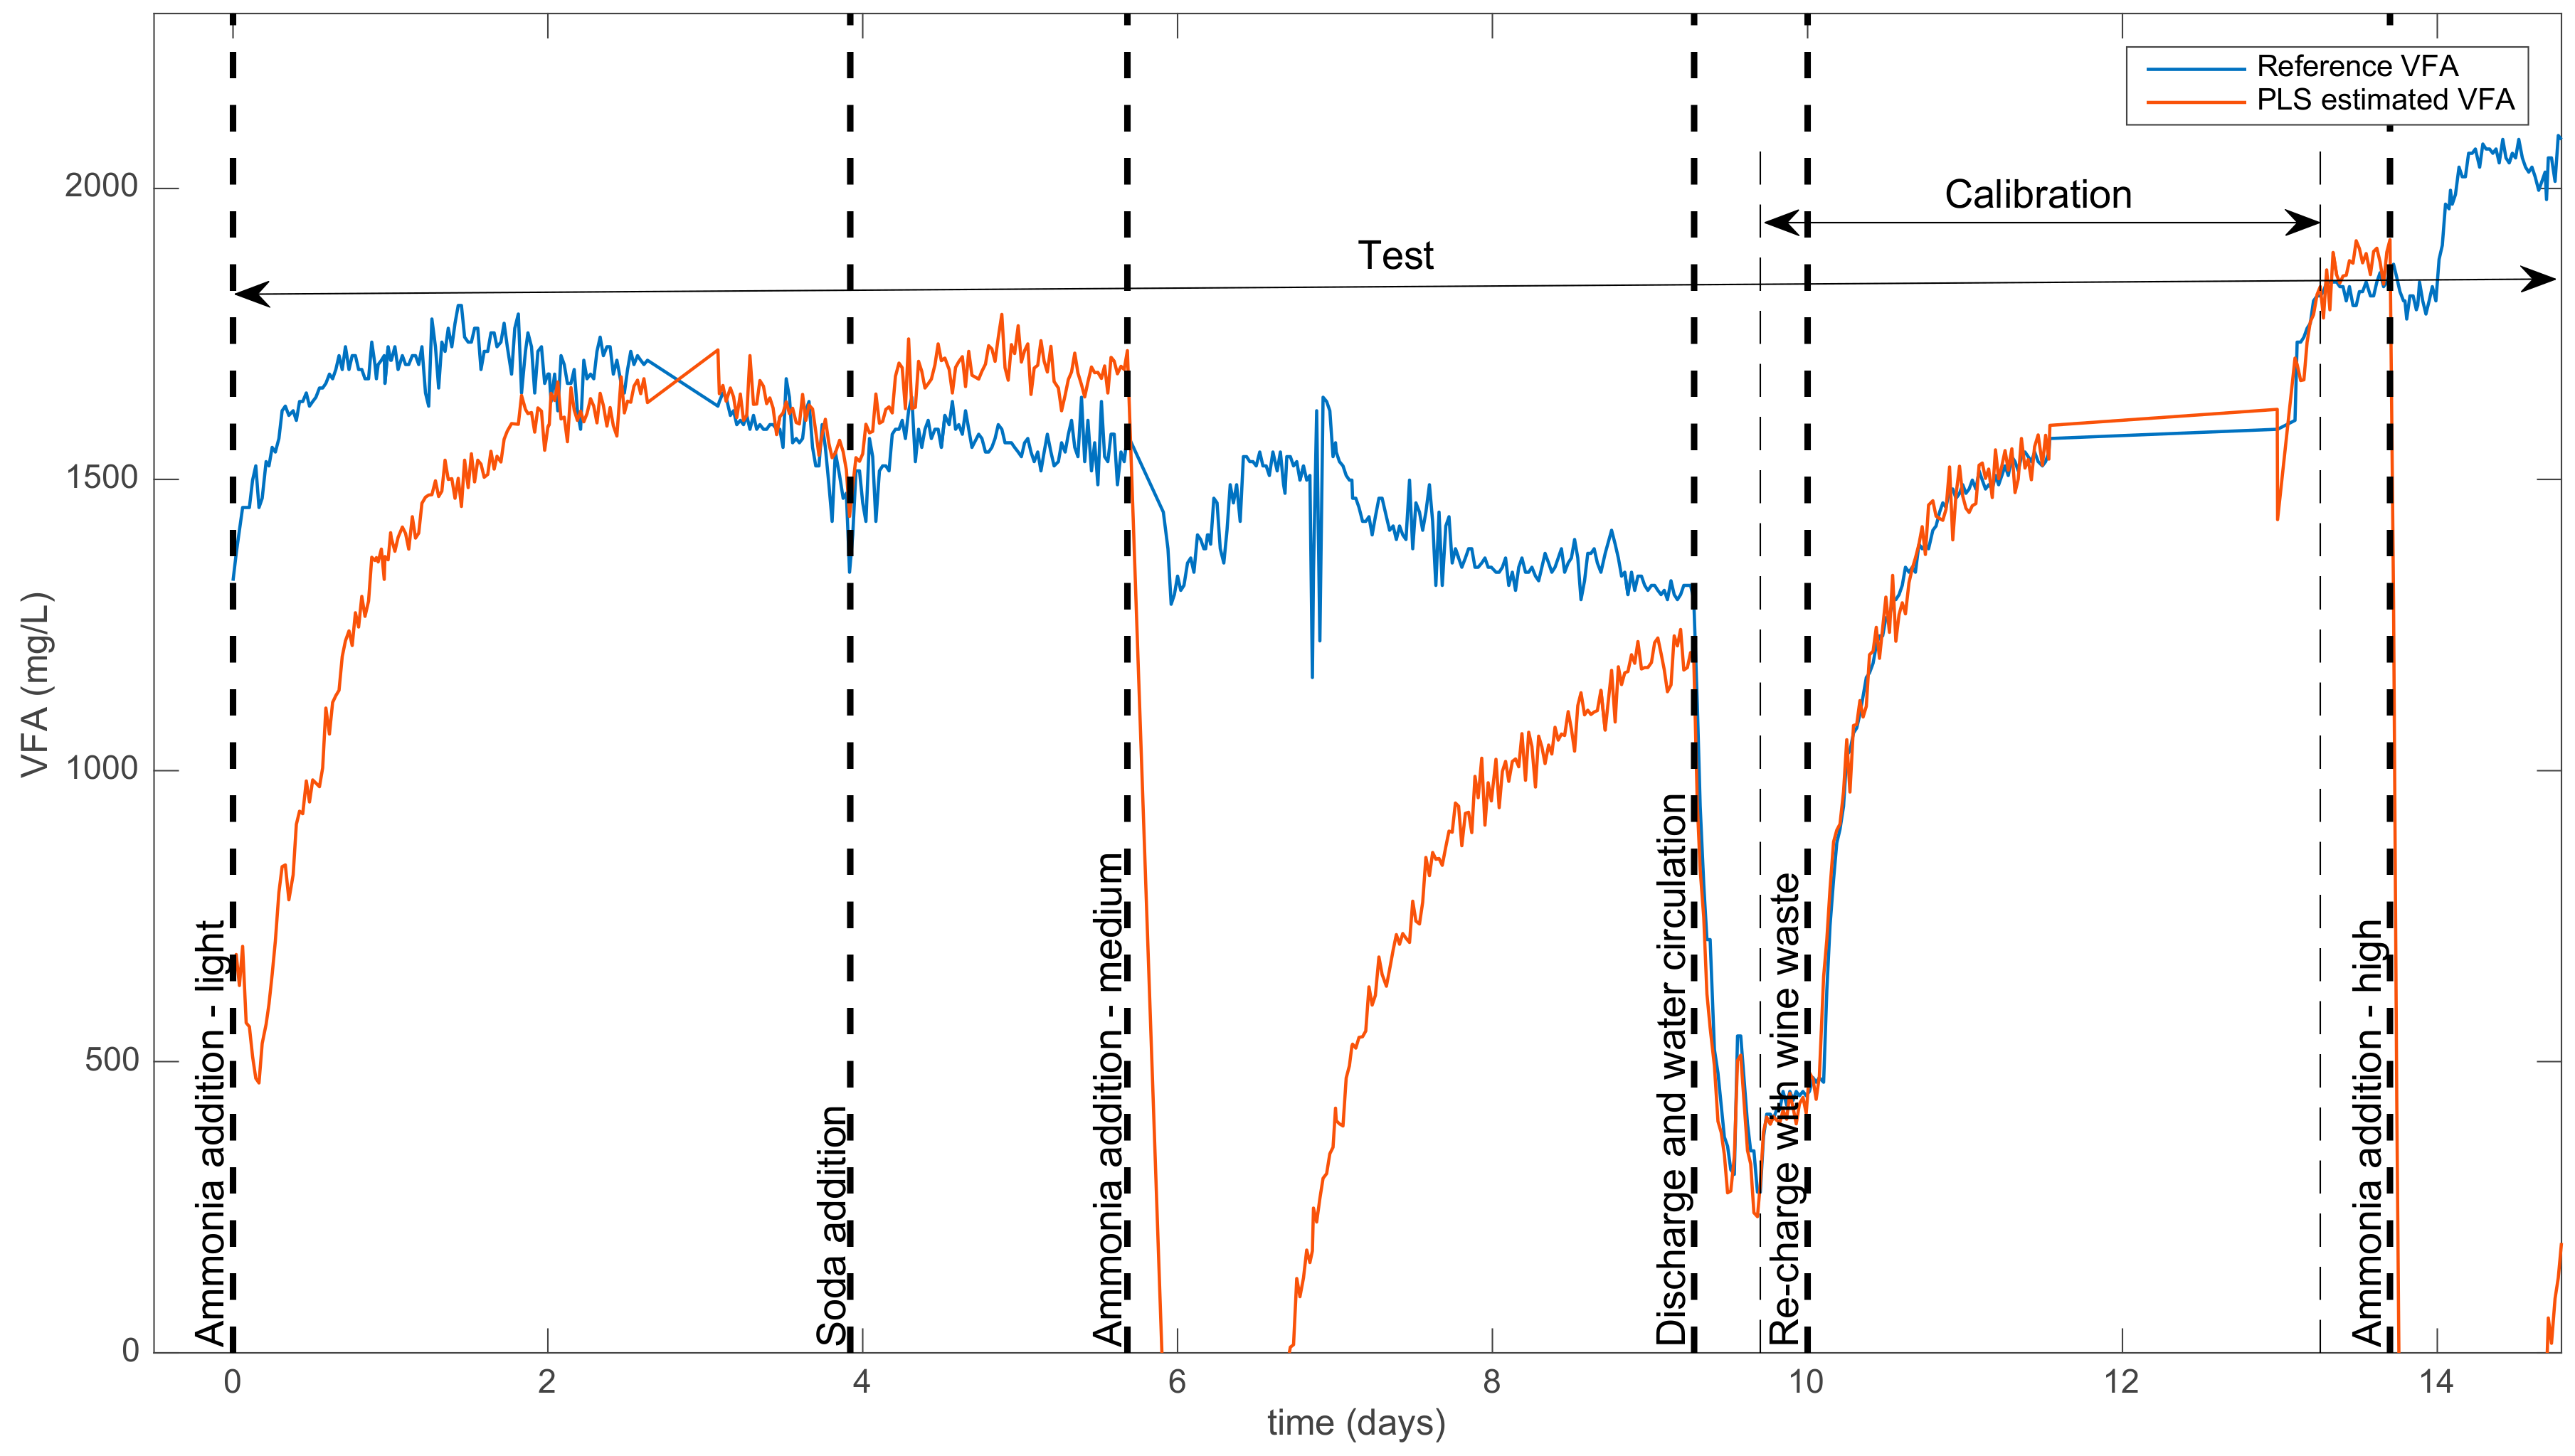
- A calibration set made up of 100 spectra and VFA concentrations obtained during a sequence where the process was in a standard mode, i.e., between approx. days 9 and 13 (see Table 1 and Figure 1). This period corresponded to the restart of the reactor, so that the y0 values covered a wide range of VFA concentrations.
- A test set was made up of all the acquired samples, containing 616 couples of spectra and VFA concentrations. This test set included various states of functioning, including normal states and ammonia-addition events.
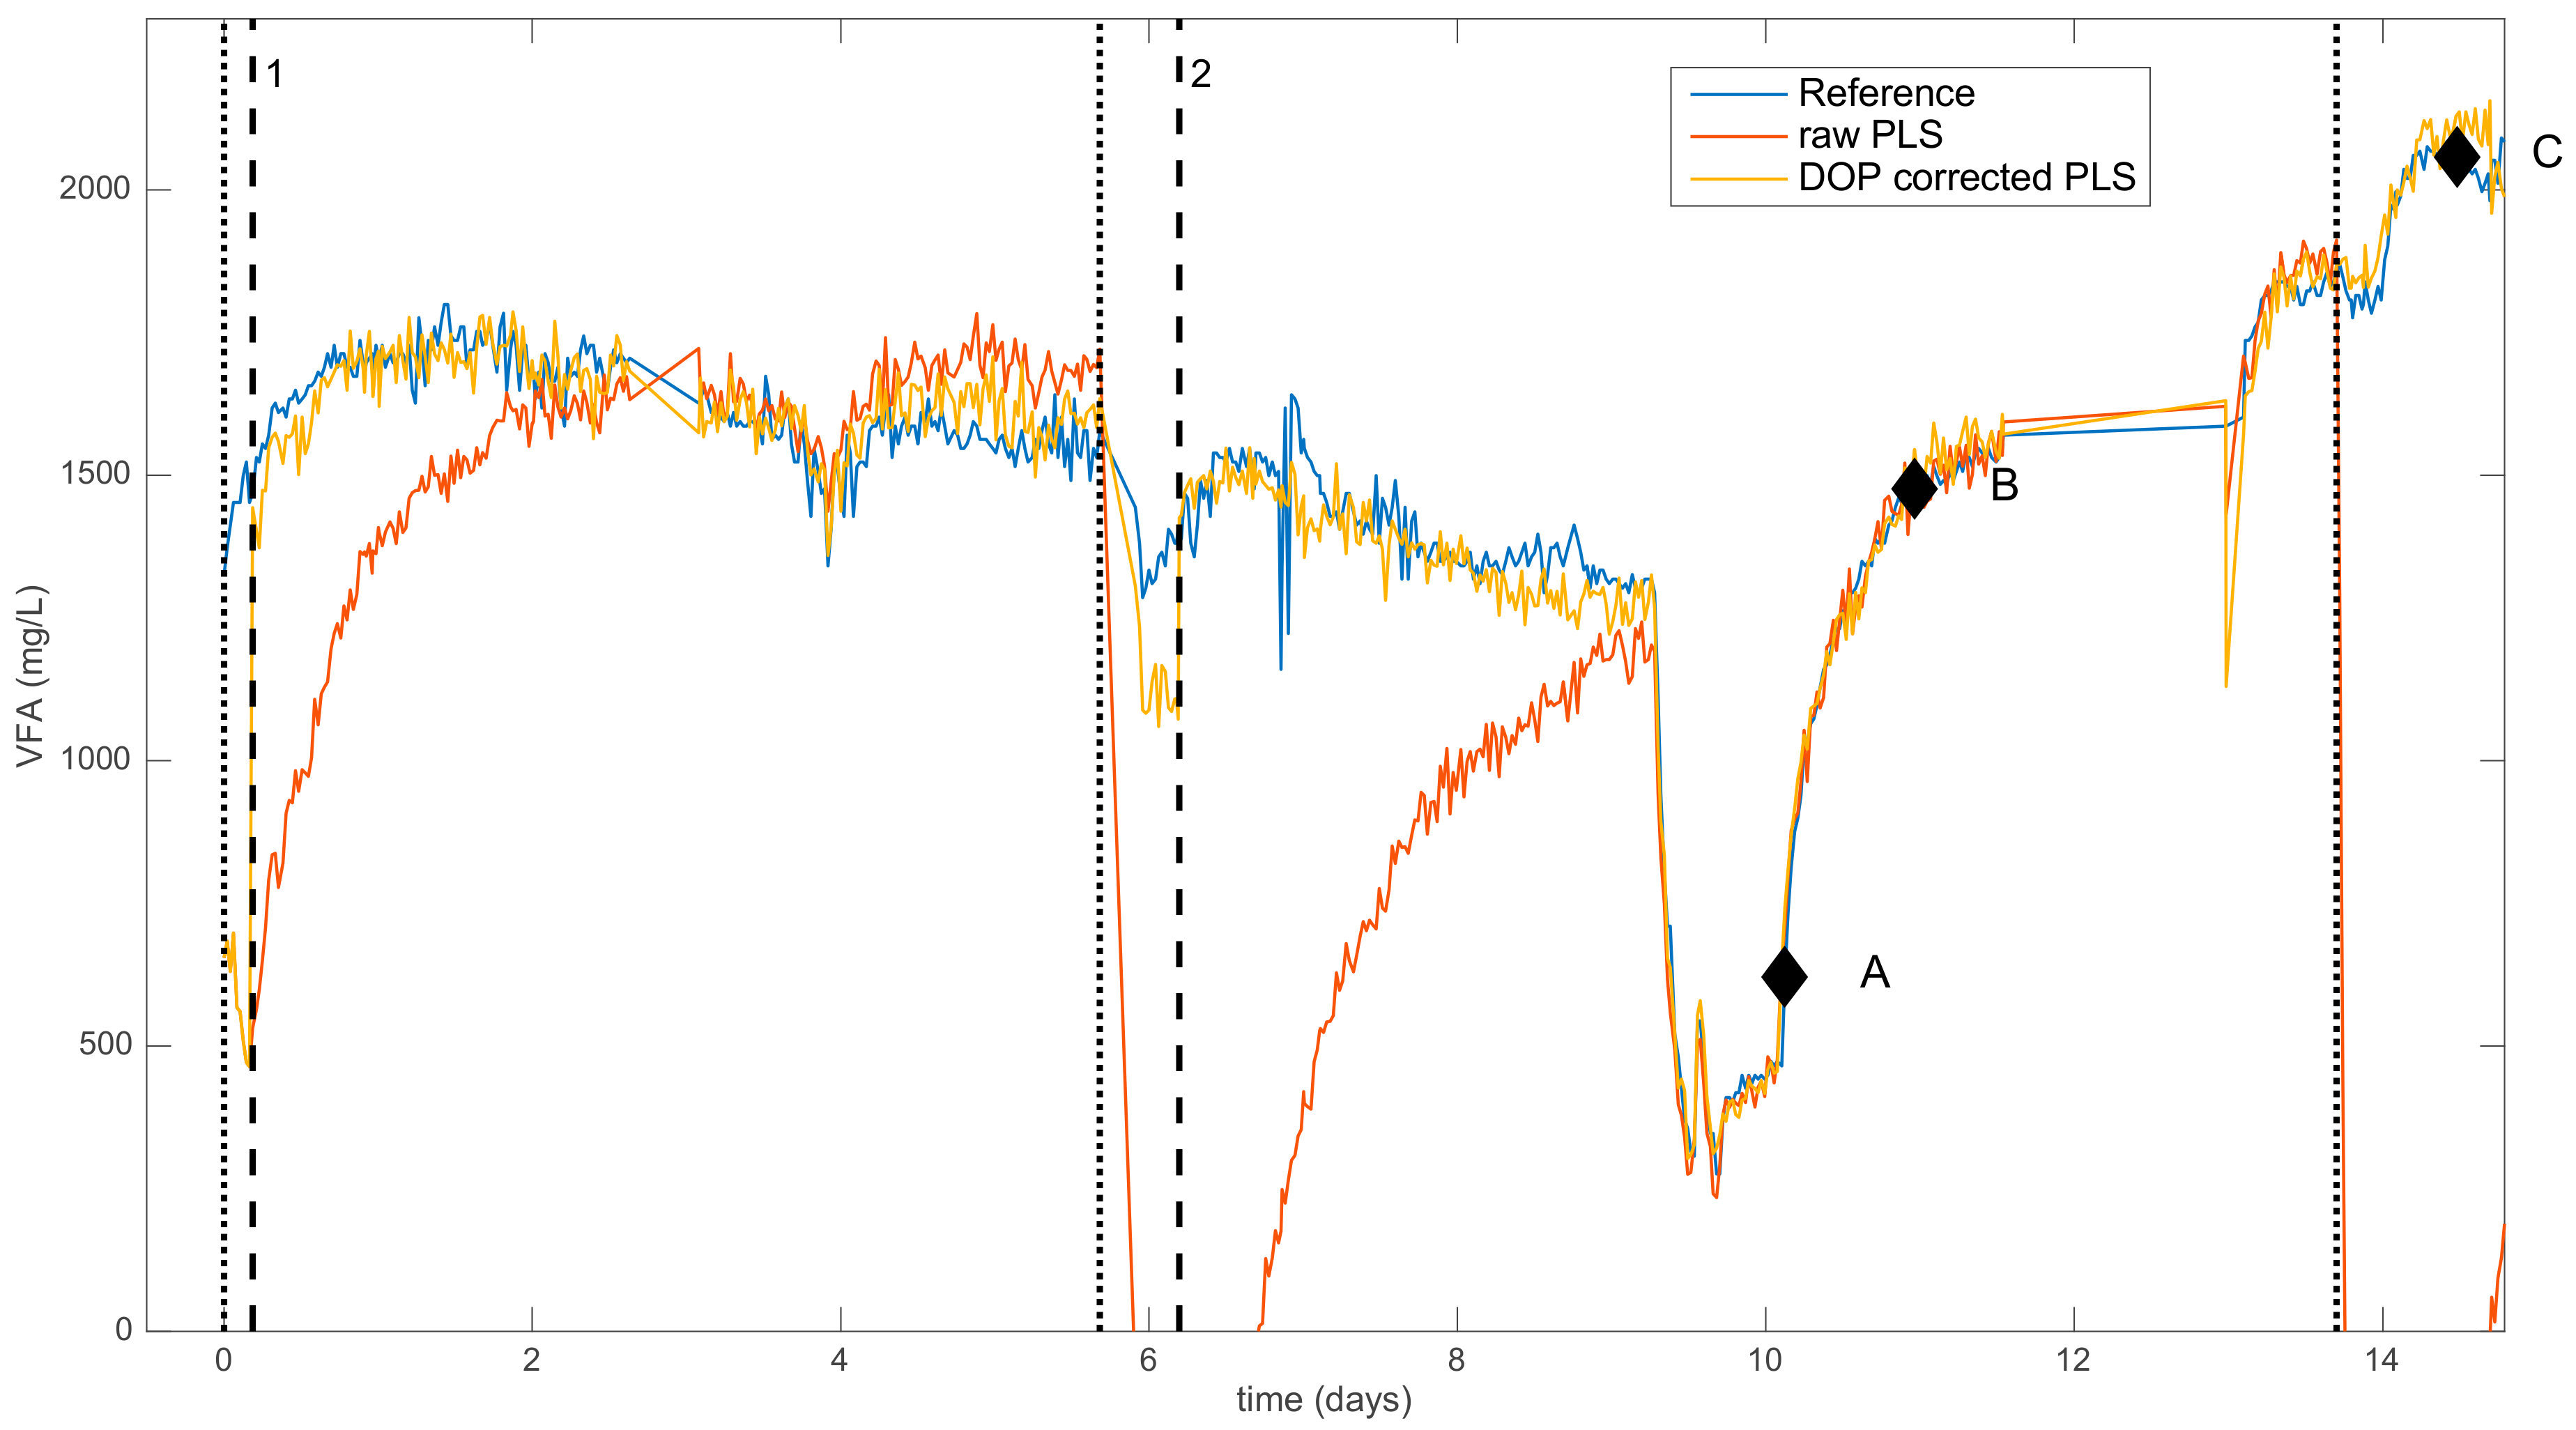
2.2.2. Dynamic Orthogonal Projection
- First, estimate the ideal spectra , which should be measured in the absence of influencing factors. This produces two matrices similar to those measured in the case of standard samples used for calibration transfer or calibration qualification test, except that these samples are rarely available for online applications.
- Second, compute the D matrix as the difference between the measured spectra and the ideal spectra:
- Third, extract the k first loadings of a PCA computed on D and insert them in P.
- Project orthogonal to P and recalibrate the model.
- Calculate A so that:
- Apply A on :
2.2.3. Figures of Merit
- Root Mean Square Error of Calibration:
- Root Mean Square Error of Cross-Validation:
- Root Mean Square Error of Prediction:
- Bias:
3. Results and Discussion
4. Conclusions
Author Contributions
Funding
Institutional Review Board Statement
Informed Consent Statement
Data Availability Statement
Conflicts of Interest
References
- Wang, L.; Sun, D.W.; Pu, H.; Cheng, J.H. Quality analysis, classification, and authentication of liquid foods by near-infrared spectroscopy: A review of recent research developments. Crit. Rev. Food Sci. Nutr. 2017, 57, 1524–1538. [Google Scholar] [CrossRef] [PubMed]
- Karoui, R.; Downey, G.; Blecker, C. Mid-infrared spectroscopy coupled with chemometrics: A tool for the analysis of intact food systems and the exploration of their molecular Structure–Quality relationships—A review. Chem. Rev. 2010, 110, 6144–6168. [Google Scholar] [CrossRef] [PubMed]
- Kornmann, H.; Valentinotti, S.; Duboc, P.; Marison, I.; Von Stockar, U. Monitoring and control of Gluconacetobacter xylinus fed-batch cultures using in situ mid-IR spectroscopy. J. Biotechnol. 2004, 113, 231–245. [Google Scholar] [CrossRef] [PubMed]
- Amrhein, M. Reaction and Flow Variants/Invariants for the Analysis of Chemical Reaction Data (No. THESIS); EPFL: Lausanne, Switzerland, 1998. [Google Scholar]
- Amrhein, M.; Srinivasan, B.; Bonvin, D.; Schumacher, M.M. Calibration of spectral reaction data. Chemom. Intell. Lab. Syst. 1999, 46, 249–264. [Google Scholar] [CrossRef]
- Chung, H.; Arnold, M.A.; Rhiel, M.; Murhammer, D.W. Simultaneous measurements of glucose, glutamine, ammonia, lactate, and glutamate in aqueous solutions by near-infrared spectroscopy. Appl. Spectrosc. 1996, 50, 270–276. [Google Scholar] [CrossRef]
- Rhiel, M.; Cannizzaro, C.; Valentinotti, S.; Marison, I.; von Stockar, U. Comprehensive In-Situ Bioreactor Monitoring and Control Based on a Mid-Infrared Spectroscopic Sensor System; EPFL Scientific Publications: Lausanne, Switzerland, 2000. [Google Scholar]
- Brown, S.D.; Huwei, T.; Feudale, R. Improving the robustness of multivariate calibrations. In ACS Symposium Series; Oxford University Press: Oxford, UK, 2005; Volume 894, pp. 15–30. [Google Scholar]
- Dabros, M. Robust Model Development and Enhancement Techniques for Improved On-Line Spectroscopic Monitoring of Bioprocesses. Ph.D. Thesis, EPFL Scientific Publications, Lausanne, Switzerland, 2008. [Google Scholar]
- Zeaiter, M.; Roger, J.M.; Bellon-Maurel, V.; Rutledge, D.N. Robustness of models developed by multivariate calibration. Part I: The assessment of robustness. TrAC Trends Anal. Chem. 2004, 23, 157–170. [Google Scholar] [CrossRef]
- Zeaiter, M.; Roger, J.M.; Bellon-Maurel, V. Robustness of models developed by multivariate calibration. Part II: The influence of pre-processing methods. TrAC Trends Anal. Chem. 2005, 24, 437–445. [Google Scholar] [CrossRef]
- Roger, J.M.; Chauchard, F.; Bellon-Maurel, V. EPO–PLS external parameter orthogonalisation of PLS application to temperature-independent measurement of sugar content of intact fruits. Chemom. Intell. Lab. Syst. 2003, 66, 191–204. [Google Scholar] [CrossRef] [Green Version]
- Chauchard, F.; Roger, J.M.; Bellon-Maurel, V. Correction of the temperature effect on near infrared calibration—Application to soluble solid content prediction. J. Near Infrared Spectrosc. 2004, 12, 199–205. [Google Scholar] [CrossRef]
- Boulet, J.C.; Roger, J.M. Pretreatments by means of orthogonal projections. Chemom. Intell. Lab. Syst. 2012, 117, 61–69. [Google Scholar] [CrossRef] [Green Version]
- Roger, J.M.; Boulet, J.C. A review of orthogonal projections for calibration. J. Chemom. 2018, 32, e3045. [Google Scholar] [CrossRef]
- Brémond, U.; de Buyer, R.; Steyer, J.P.; Bernet, N.; Carrere, H. Biological pretreatments of biomass for improving biogas production: An overview from lab scale to full-scale. Renew. Sustain. Energy Rev. 2018, 90, 583–604. [Google Scholar] [CrossRef]
- Weiland, P. Biogas production: Current state and perspectives. Appl. Microbiol. Biotechnol. 2010, 85, 849–860. [Google Scholar] [CrossRef] [PubMed]
- Brémond, U.; Bertrandias, A.; Steyer, J.P.; Bernet, N.; Carrere, H. A vision of European biogas sector development towards 2030: Trends and challenges. J. Clean. Prod. 2021, 287, 125065. [Google Scholar] [CrossRef]
- Jimenez, J.; Latrille, E.; Harmand, J.; Robles, A.; Ferrer, J.; Gaida, D.; Wolf, C.; Mairet, F.; Bernard, O.; Alcaraz-Gonzalez, V.; et al. Instrumentation and control of anaerobic digestion processes: A review and some research challenges. Rev. Environ. Sci. Bio/Technol. 2015, 14, 615–648. [Google Scholar] [CrossRef]
- Zeaiter, M.; Roger, J.M.; Bellon-Maurel, V. Dynamic orthogonal projection. A new method to maintain the on-line robustness of multivariate calibrations. Application to NIR-based monitoring of wine fermentations. Chemom. Intell. Lab. Syst. 2006, 80, 227–235. [Google Scholar] [CrossRef]
- Batstone, D.J.; Steyer, J.P. Use of modelling to evaluate best control practice for winery-type wastewaters. Water Sci. Technol. 2007, 56, 147–152. [Google Scholar] [CrossRef]
- Steyer, J.P.; Bouvier, J.C.; Conte, T.; Gras, P.; Sousbie, P. Evaluation of a four year experience with a fully instrumented anaerobic digestion process. Water Sci. Technol. 2002, 45, 495–502. [Google Scholar] [CrossRef]
- Steyer, J.P.; Bouvier, J.C.; Conte, T.; Gras, P.; Harmand, J.; Delgenes, J.P. On-line measurements of COD, TOC, VFA, total and partial alkalinity in anaerobic digestion processes using infra-red spectrometry. Water Sci. Technol. 2002, 45, 133–138. [Google Scholar] [CrossRef]
- Koster, I.W.; Lettinga, G. The influence of ammonium-nitrogen on the specific activity of pelletized methanogenic sludge. Agric. Wastes 1984, 9, 205–216. [Google Scholar] [CrossRef]
- Koster, I.W.; Lettinga, G. Anaerobic digestion at extreme ammonia concentrations. Biol. Wastes 1988, 25, 51–59. [Google Scholar] [CrossRef]
- Hansen, K.H.; Angelidaki, I.; Ahring, B.K. Anaerobic digestion of swine manure: Inhibition by ammonia. Water Res. 1998, 32, 5–12. [Google Scholar] [CrossRef]
- Geladi, P.; Kowalski, B.R. Partial least-squares regression: A tutorial. Anal. Chim. Acta 1986, 185, 1–17. [Google Scholar] [CrossRef]
- Hansen, P.W. Pre-processing method minimizing the need for reference analyses. J. Chemom. A J. Chemom. Soc. 2001, 15, 123–131. [Google Scholar] [CrossRef]
- Falk, H.M.; Reichling, P.; Andersen, C.; Benz, R. Online monitoring of concentration and dynamics of volatile fatty acids in anaerobic digestion processes with mid-infrared spectroscopy. Bioprocess Biosyst. Eng. 2015, 38, 237–249. [Google Scholar] [CrossRef]
- Wolf, C.; Gaida, D.; Rehorek, A.; Bongards, M. Online monitoring of AD processes using a fully automated, low maintenance middle-infrared (MIR) measurement system. In Proceeding of the 2nd International Conference Biogas Science 2014, Vienna, Austria, 26–30 October 2014; Volume 2014, pp. 24–25. [Google Scholar]
- Max, J.J.; Chapados, C. Aqueous ammonia and ammonium chloride hydrates: Principal infrared spectra. J. Mol. Struct. 2013, 1046, 124–135. [Google Scholar] [CrossRef]
- de Noord, O.E. The influence of data preprocessing on the robustness and parsimony of multivariate calibration models. Chemom. Intell. Lab. Syst. 1994, 23, 65–70. [Google Scholar] [CrossRef]
- Challa, S.; Potumarthi, R. Chemometrics-based process analytical technology (PAT) tools: Applications and adaptation in pharmaceutical and biopharmaceutical industries. Appl. Biochem. Biotechnol. 2013, 169, 66–76. [Google Scholar] [CrossRef]

| Time (Days) | Addition of Chemicals | Impact on the Predictions |
|---|---|---|
| 0 | Addition of NH4Cl (low conc.) | Moderate negative bias |
| 4.0 | Addition of NaOH | Weak positive bias |
| 5.7 | Addition of NH4Cl (medium conc.) | Strong negative bias |
| 9.3 | Discharge and water circulation | None |
| 10.0 | Re-charge with wine waste | None |
| 11.5 | Stopping of the reactor | None |
| 13.0 | Restart of the reactor | None |
| 13.7 | Addition of NH4Cl (high conc.) | Strong negative bias |
Publisher’s Note: MDPI stays neutral with regard to jurisdictional claims in published maps and institutional affiliations. |
© 2022 by the authors. Licensee MDPI, Basel, Switzerland. This article is an open access article distributed under the terms and conditions of the Creative Commons Attribution (CC BY) license (https://creativecommons.org/licenses/by/4.0/).
Share and Cite
Zeaiter, M.; Latrille, É.; Gras, P.; Steyer, J.-P.; Bellon-Maurel, V.; Roger, J.-M. Improvements in the Robustness of Mid-Infrared Spectroscopy Models against Chemical Interferences: Application to Monitoring of Anaerobic Digestion Processes. AppliedChem 2022, 2, 117-127. https://doi.org/10.3390/appliedchem2020008
Zeaiter M, Latrille É, Gras P, Steyer J-P, Bellon-Maurel V, Roger J-M. Improvements in the Robustness of Mid-Infrared Spectroscopy Models against Chemical Interferences: Application to Monitoring of Anaerobic Digestion Processes. AppliedChem. 2022; 2(2):117-127. https://doi.org/10.3390/appliedchem2020008
Chicago/Turabian StyleZeaiter, Magida, Éric Latrille, Pascal Gras, Jean-Philippe Steyer, Véronique Bellon-Maurel, and Jean-Michel Roger. 2022. "Improvements in the Robustness of Mid-Infrared Spectroscopy Models against Chemical Interferences: Application to Monitoring of Anaerobic Digestion Processes" AppliedChem 2, no. 2: 117-127. https://doi.org/10.3390/appliedchem2020008
APA StyleZeaiter, M., Latrille, É., Gras, P., Steyer, J.-P., Bellon-Maurel, V., & Roger, J.-M. (2022). Improvements in the Robustness of Mid-Infrared Spectroscopy Models against Chemical Interferences: Application to Monitoring of Anaerobic Digestion Processes. AppliedChem, 2(2), 117-127. https://doi.org/10.3390/appliedchem2020008