
On the Use of a Non-Constant Non-Affine or Slip Parameter in Polymer Rheology Constitutive Modeling


1
Department of Chemical Engineering, Cyprus University of Technology, P.O. Box 50329, 3603 Limassol, Cyprus
2
Department of Chemical Engineering, University of Patras & FORTH/ICE-HT, 26504 Patras, Greece
*
Author to whom correspondence should be addressed.
Dynamics 2022, 2(4), 380-398; https://doi.org/10.3390/dynamics2040022
Submission received: 13 September 2022
/
Revised: 24 October 2022
/
Accepted: 25 October 2022
/
Published: 29 October 2022
Abstract
:Since its introduction in the late 1970s, the non-affine or slip parameter, , has been routinely employed by numerous constitutive models as a constant parameter. However, the evidence seems to imply that it should be a function of polymer deformation. In the present work, we phenomenologically modify a constitutive model for the rheology of unentangled polymer melts [P. S. Stephanou et al. J. Rheol. 53, 309 (2009)] to account for a non-constant slip parameter. The revised model predictions are compared against newly accumulated rheological data for a C48 polyethylene melt obtained via direct non-equilibrium molecular dynamics simulations in shear. We find that the conformation tensor data are very well predicted; however, the predictions of the material functions are noted to deviate from the NEMD data, especially at large shear rates.
1. Introduction
A fundamental understanding of the rheological and microstructural behavior of polymeric fluids under flow is essential in practical polymer processing operations [1,2,3]. Polymers are fluids that exhibit a non-Newtonian rheological character, which stems from their internal microstructure. The dynamical behavior of the microstructure is usually challenging to obtain experimentally, leaving ample space for computational simulations. Nowadays, due to the growth of computational power and the advent of sophisticated computational algorithms, computationally executed experiments offer the only alternative to experiments that cannot be conducted physically [4], such as quantifying the key role of threading events in linear-ring blends [5,6,7,8]. This is particularly true for polymeric materials, even the simplest of all, i.e., linear polyethylene (PE) chains, since one must span a spectrum of orders of magnitude in both time and space [4]. Today, simulations, particularly atomistic ones (i.e., simulations in which individual atoms of ensembles of molecules are tracked in phase space), offer the best avenue to validate theories without hypotheses. Two such examples are the Rouse theory for cyclic polymers (rings) [9] and the tube notion in entangled polymeric systems (i.e., systems whose molecular weights exceed the entanglement molecular weight, and whose dynamics is dictated by a slithering or snake-like motion within a confining mean-field tube produced by the surrounding chain molecules) [10]. However, similar success has not been accomplished yet in non-equilibrium systems, i.e., systems that are perturbed away from equilibrium, such as those under flow, which is more complicated to simulate [4].
Still, non-equilibrium molecular dynamics simulations (NEMD) have provided invaluable insight into the dynamical behavior of polymer chains under flow. Experimentally, it has been possible to directly visualize individual polymer chains when subjected to flow. For example, we mention the work of Smith et al. [11] and LeDuc et al. [12], who used video microscopy to study the dynamics of individual, tagged chains under shear in dilute solutions of DNA and noted that these chains exhibit both deformation and tumbling motions. These experiments, however, can only track a small number of molecules at any given time. This void has recently been filled by atomistic NEMD simulations since every single chain can be accurately tracked. Indeed, the rotation or tumbling of polymer chains has been noted through the execution of NEMD to occur for both unentangled and entangled chains if the flow field possesses a rotational contribution, such as simple shear flow [13,14,15,16,17,18,19,20,21,22]. Recent research has unambiguously clarified that the tumbling of polymer chains leads to the appearance of a transient stress undershoot (following the overshoot) at high shear rates [23,24]. However, how this tumbling behavior can be considered in constitutive modeling remains unclear.
Since its introduction in the late 1970s by Gordon and Schowalter (GS) [25] and Johnson and Segalman (JS) [26], the non-affine or slip parameter, , has been routinely employed by numerous constitutive models. This parameter allows for the slippage of polymer chains relative to the surrounding medium (either solvent in polymer solutions or surrounding polymer chains in polymer melts) [27]. This slippage allows for a rotation of the polymer chain when subjected to shear. When = 0, the chain deforms affinely, thus no rotation is allowed, whereas when , the chain is completely rigid and does not allow deformation [27]. Note that in general, is considered to be : when , the mixed derivative found in the GS-JS model reduces to the upper-convected Maxwell derivative, to the corotational derivative when , whereas when , to the lower-convected Maxwell derivative. However, as pointed out by Öttinger [28], the inverse of a lower-convected tensor is of an upper-convected type, explaining why the thermodynamic admissibility condition, i.e., the second law of thermodynamics, limits the range of to only the first subdomain [29]. This can further be justified by noting that the choice describes the affine motion of either a flexible polymer chain or infinite aspect ratio solid ellipsoid, whereas as the aspect ratio decreases, the choice describes the limit of spherical solid particles, with the elastic contribution to the stress decreasing to zero [30].
The slip parameter has long been considered a constant, despite numerous indications that it should increase as the flow field intensifies. Since the rotational contribution in shear intensifies as the shear rate increases, this rotational or dumping behavior of polymer chains also intensifies, meaning that the slip parameter should also increase. Furthermore, since close to equilibrium the field is not strong enough to force chain tumbling (thereby not resulting in the exhibition of an undershoot in the transient shear viscosity at low shear rates as noted experimentally [23,24]), we should expect the slip parameter to vanish. Additionally, since this slip is typically observed with rigid particles due to flow-induced torque, slip can be considered as a measure of molecular rigidity [27]. This is a strong function of the particle’s aspect ratio, as can be deduced from the fact that the evolution equation for the trace-constrained orientation tensor of the rigid ellipsoid includes a mixed-convected derivative similar to the GS derivative with , where is the particle’s aspect ratio [27,31].
Possibly the first to consider a variable slip parameter were Hinch [32] and Rallison and Hinch [33]. They considered a modification of the finite-extensible non-linear elastic (FENE) dumbbell model by considering a slip parameter given via, using our nomenclature, , where is the dimensional conformation tensor, is the trace of , and is the average squared end-to-end polymer distance at equilibrium (see the next section) [33]. However, as the polymer aspect ratio increases due to deformation, one would expect that should also be time dependent. Such a consideration has not been cogitated in the past, with the sole exception being the work of Beris et al. [34], that introduced a phenomenological kinetic equation for the slip parameter. They also introduced a limiting value for the non-affine parameter at high shear rates. However, in their model, the slip parameter was only coupled to the shear rate and not the structure itself. To the best of our knowledge, there has not been any other work wherein a (shear-rate- or time-) dependent slip parameter was considered.
Although other constitutive models have considered a variety of mechanisms to accommodate the tumbling of polymer chains under shear, such as the use of a tumbling function by Costanzo et al. [24] or the explicit consideration of rotational diffusion by Stephanou et al. [23], the necessity of having a variable slip parameter remains. In this work, we generalize the constitutive model for unentangled polymer melts of Stephanou et al. [29] to accommodate a varying slip parameter by including an additional evolution equation for , following our recent work on the use of a scalar structural variable [35].
This paper is structured as follows: in Section 2, the new model is introduced, whereas Section 3 presents the details concerning the simulated system and technical information regarding the MD and NEMD performed. Then, in Section 4, we offer the model predictions along with a comparison with the accumulated simulation data. The paper concludes with Section 5, where we elaborate on the significance of our work and discuss future plans.
2. Model Modification
Following previous work [29,30], we define the conformation tensor as the second moment of the distribution function for the chain end-to-end vector R, with its center-of-mass at position r, i.e., with the brackets denoting a configurational average. The evolution equation for the dimensionless conformation tensor , as derived by Stephanou et al. [29], is:
where:
denotes the GS or JS mixed derivative, with being the rate-of-deformation tensor ( is the transpose of ), and is the velocity gradient tensor. Additionally, is the unit tensor, is the anisotropic Giesekus parameter,
is the effective spring constant, accounting for FENE effects, with b the FENE parameter, and the function:
with , which ensures that the entropy density remains bounded even at high deformation rates [36], with the dimensionless unbounded free energy [29] given as:
and the relaxation, or Rouse, time:
with the Phan–Thien Tanner parameter, and the equilibrium Rouse time (note that the Rouse time in Stephanou et al. [29] was defined as _. Note that other expressions could also be employed, such as the extended White–Metzner expression [30,35,37]. Finally, the corresponding expression relating the stress tensor with the conformation tensor is given as:
where is the elastic modulus.
We now proceed to modify the Stephanou et al. [29] model by considering a variable slip parameter. To this end, we simply propose an expression for the evolution equation of bearing in mind our previous work concerning the scalar structural variable [35]:
where , is the characteristic time for the increase in the slip parameter, and is the upper bound of the slip parameter at high shear rates. The first term in Equation (3) is a relaxation term returning the slip parameter to its equilibrium, null, value when the flow is ceased. In contrast, whereas the second is a term that increases the slip parameter as a result of the applied flow. In the following, we define .
Asymptotic Behavior of the Model for Steady-State and Transient Shear Flow
Here, we analyze the asymptotic behavior of the revised model in the limits of low deformation rates for both steady-state and transient simple shear flow (SSF), described by the kinematics , where is the shear rate, and uniaxial elongation flow (UEF) described by the kinematics, where is the elongation rate (x is the flow direction, y is the velocity gradient direction, and z is the neutral direction). The material functions to analyze are the shear viscosity, , and the two normal stress coefficients, and , respectively, in the case of shear, and the extensional viscosity, , in the case of uniaxial elongation. By expanding the conformation tensor and the slip parameter up to second-order terms in the dimensionless shear rate, , we arrive at the following expressions for the conformation tensor and the slip parameter (when considering a finite value of ):
and for the zero-shear-rate shear viscosity and normal stress coefficients:
These are the same as the ones presented by Stephanou et al. [29] by considering in their Equations (41) and (42). On the other hand, at large shear rates, the slip parameter will approach the upper bound value ; see the next section.
Upon inception of the simple shear flow, the explicit solutions for the time-dependent viscometric functions in the linear viscoelastic (LVE) limit, following the methodology of Stephanou et al. [38], are given as:
In steady-state uniaxial elongation, by expanding the conformation tensor and the slip parameter up to first-order terms in the dimensionless elongation rate, , we obtain:
and for the zero-elongation-rate elongation viscosity:
meaning that Trouton’s law holds.
Upon inception of elongation flow, the explicit solutions for the time-dependent elongation viscosity in the linear viscoelastic limit, again following the methodology of Stephanou et al. [38], is given as:
3. Molecular Model and System Studied
In this work, we conducted equilibrium molecular dynamics (MD) simulations, and NEMD simulations of PE oligomer C48H98 melts. Equilibrium MD simulations were performed in the NPT ensemble to fully relax the initial PE configurations at temperature T = 450 K and pressure P = 1 atm using the united-atom potential model of Siepmann et al. [39]. The simulations were carried out using the LAMMPS simulation engine [40], employing the Nosé–Hoover thermostat [41,42] and the Parrinello–Rahman barostat [43] to preserve the temperature and pressure, respectively, at their prescribed values. Subsequently, several fully relaxed configurations from the MD runs were selected as input for the NEMD simulations under shear. The NEMD runs were performed again with LAMMPS in the NVT ensemble at T = 450 K, using the SLLOD algorithm [44], together with the Nosé–Hoover thermostat to control the temperature. The microscopic set of equations of motion was integrated numerically using the reversible Reference System Propagator Algorithm (r-RESPA) [45], with 2 different time steps: (a) a large one (dt = 4 fs) for the integration of the slowest varying forces arising from non-bonded interactions at long interatomic distances, and (b) a small one (dt = 0.5 fs) for the integration of the fast-varying forces corresponding to the bonded (i.e., bonds, angles, and dihedrals) interactions.
All simulations were conducted using large cells containing 16,000 chain molecules of C48H98 and were subjected to periodic boundary conditions in all three directions (x, y, and z). In the course of the NEMD simulations, the x- and y-directions were selected as the flow and the shear gradient directions, respectively, whereas z was the neutral direction. The simulation cell had dimensions (462 Å) × (231 Å) × (231 Å) along the x-, y-, and z-directions. The cell was purposefully enlarged in the (x-) flow direction to ensure minimal system size effects, particularly with the NEMD runs at high shear rates, where the polymer chains tend to stretch and orient towards the flow direction. To this end, for the C48H98 chains, the equilibrium root-mean-square of the chain end-to-end vector and the theoretical maximum chain extension of were calculated to be equal to and , respectively. Compared to the simulation cell dimensions, the maximum chain length is 7.3 times shorter than the dimension in the x-direction and 3.6 times shorter than the dimension in the y-direction. Thus, we can safely expect that the simulation cell is sufficiently large to ensure the absence of system size effects due to chain alignment in the flow direction or tumbling motion in the shear gradient direction.
In the course of the equilibrium MD simulations, the equilibrium orientational relaxation time of the simulated C48H98 PE chains at T = 450 K and P = 1 atm was found to be equal to , as estimated by integrating the stretched–exponential curve [46] over time, describing the time autocorrelation function of the chain end-to-end unit vector. The MD simulations were conducted for a total of 6 ns, which is 10 times larger than the chain relaxation time to ensure that the PE chains were fully equilibrated. The NEMD simulations were executed over a broad range of shear rates spanning the range from the linear up to the highly non-linear viscoelastic regime, corresponding to Weissenberg numbers (with ) in the interval [0.1, 285].
4. Results and Discussion
4.1. Model Predictions in Steady-State Shear Flow
In this section, we present the predictions of the new model in the case of steady-state shear flow. The results were obtained numerically by solving the constitutive model, Equation (1), under steady-state conditions using MATLAB [47] and then calculating the stress tensor using Equation (2).
In Figure 1, we depict the model prediction for the slip parameter as a function of Wi and its dependence on the parameters , and while keeping the constant (panel (a)), and (b) the parameters and b while maintaining the constant (panel (b)). As noted in Figure 1a, at large values of , the slip parameter steeply reaches its limiting value, which is unaltered as the shear rate increases further. This situation resembles the previous version of the model [29], where the slip parameter was considered a constant. However, as is reduced to unity, the slip parameter increases with the shear rate and reaches its limiting value at about Wi = 10. As the parameter increases, the curve shifts upwards, whereas by increasing , we note a slight shift upwards at higher shear rates. This is because when the slip parameter does not fully reach its limiting value since delays its reduction with the shear rate, as shown in Figure 2b. On the other hand, the slip parameter seems insensitive to the precise values of and b (panel (b)). Note that analytical expression Equation (4e) is accurate in all cases until about Wi = 1.
Next, in Figure 2, we depict the model predictions for the conformation tensor as a function of Wi whilst keeping constant, whereas, in Figure 3, we depict the same comparison whilst keeping constant. Irrespective of the values of the parameters (see both Figure 2 and Figure 3), we note that cxx is reported to increase from its equilibrium value after about ≈Wi = 0.3 and eventually reach its limiting value, which, however, differs from the value of the parameter b. On the other hand, cxy is noted to increase linearly with the shear rate at low shear rates, as dictated by Equation (4b), reaching a maximum value, and then decreasing inversely proportional to the shear rate. Finally, the two remaining diagonal elements of the conformation tensor in the shear gradient direction and neutral direction (cyy and czz, respectively), are observed to be mirrors of the noted behavior of cxx: they initially decrease from their equilibrium value, eventually reaching a finite asymptotic value at high shear rates. We note, in Figure 2, that the value of plays only a very modest role for all elements, since the value of is small; note that one would expect such small values to be used since larger values would lead to very intense oscillations in the time-dependent material functions (see the next section). On the other hand, by increasing the parameter , we note the predictions at low shear rates to be insensitive. Still, the limiting asymptotic values at high shear rates are pointed out to decrease for cxx and increase for both cyy and czz, whereas the cxy curve shifts to lower shear rates at higher shear rates whilst keeping the power-law unaffected. This is a direct result of allowing tumbling to occur sooner, since the slip parameter is larger, thus refraining the flow to deform the chain further. Finally, when we increase the value of while keeping the same and values (Figure 3), we note that the asymptotic values of the diagonal elements remain the same, but the curves are shifted to the right, a direct result of the steeper decrease in the relaxation time, cf. Equation (1g). As the anisotropic (or Giesekus) parameter, , is increased, we observe that the curve of cxx shifts downwards and the one of czz shifts upwards (see Figure 3). In constrast, when the FENE parameter is increased (from 20 to 50, meaning that the chain is now longer or its molecular weight is larger), we observe the reverse behavior, which is the expected outcome. However, note that during these parameter value changes, the predictions of the other elements, cxy (panel (b)) and cyy (panel (c)) are only modestly affected. As in Figure 2, the value of controls the rate at which the asymptotic values, in the case of the diagonal elements, are reached, whereas the cxy curve shifts rightwards.
In Figure 4 and Figure 5, we depict the same comparison as in Figure 2 and Figure 3, respectively, but for the three dimensionless material functions: the shear viscosity, (panel (a)), and the first, (panel (b)), and negative second, (panel (c)), normal stress coefficients. We again note, in Figure 4, that the predictions are insensitive to the value of the slip parameter due to the small value of . By increasing the value of , both and are noted to shift to lower shear rates, which is much more intense for the shear viscosity, whereas when increasing , we note that the shear viscosity curve shifts to higher shear rates, and unaltered at large shear rates but shifts rightwards at intermediate Wi. On the contrary, is noted to be almost completely unaffected. Finally, Figure 5 shows that both and are invariant to changes in the values of and b. On the other hand, the zero-shear-rate negative second normal stress coefficient increases as the Giesekus parameter increases, cf. Equation (5c), but again remains invariant at higher shear rates.
4.2. Model Predictions in Start-Up Shear Flow
In this section, we present the predictions of the new model in the case of start-up shear flow. The results were obtained numerically by solving the system of differential equations, Equations (1), using MATLAB [47] and then calculating the stress tensor, Equation (2). Here, we consider only the case with , since the case of large is identical to the predictions presented in Stephanou et al. [29].
Ιn Figure 6, we depict the growth of the slip parameter under start-up shear flow at two different values of the dimensionless shear rate equal to and 10 and various values of the model parameters. We note that irrespective of the model parameter, it increased exponentially, reaching its steady-state value. A modest dumping behavior is noted wherein the time-dependent prediction is observed to oscillate around the steady-state value before reaching it. The overall behavior of is seen not to depend heavily on the values of the parameters , and b.
Next, in Figure 7 and Figure 8, we depict the growth of the conformation tensor under start-up shear flow at two different values of the dimensionless shear rate equal to and 10. We observe that the predictions for cxx, cxy, and cyy also present a dumping behavior, which is much more intense relative to the one noted in the slip parameter (Figure 6). It intensifies as the parameter increases and becomes less intense when the parameter increases. Such a behavior is obtained only when . On the other hand, czz seems not to present such a behavior, although a small saddle point is noted when . The time-dependent behavior of the conformation tensor is seen in Figure 8 to be insensitive to the value of the parameters and .
Finally, in Figure 9 and Figure 10, we depict the growth of the three dimensionless materials functions: the shear viscosity, (panel (a)), and the first, (panel (b)), and negative second, (panel (c)), normal stress coefficients under start-up shear flow. Note that the dotted dark yellow and light grey lines in Figure 10c in each panel depict the LVE envelope given by Equations (6). We again note that the predictions for the shear viscosity present a dumping behavior for both shear rates when , which intensifies as the shear rates increases; such a behavior can also be noted when is a constant () [29,38]. It also intensifies when increases and is less intense when increases (Figure 9a), following the behavior noted in the case of the conformation tensor. A similar behavior is also noted in (panel (b)), although the dumping behavior seems to be less intense. On the other hand, seems not to exhibit such a behavior (Figure 9c). As either the parameter or the FENE parameter b is increased, the time-dependent behavior is unaffected (Figure 10). However, when increasing , the overshoot is noted to decrease and shift to shorter times for both (panel (a)) and (panel (b)). On the other hand, as the parameter increases, the curve is noted to go over its LVE envelope at short times, which is never the case for both and .
4.3. Comparison with NEMD Simulation Data for an Unentangled PE Melt
In this section, we aim to compare the predictions of the revised model against rheological data obtained through newly accumulated, fully atomistic NEMD simulations of a short unentangled C48 PE melt over a broad spectrum of shear rates. We only analyze the steady-state data of these NEMD simulations. To fit the simulation data, following Stephanou et al. [29], we first identify the asymptotes of the diagonal elements of the conformation tensor in the limit of high shear rates. Additionally, the equilibrium relaxation (Rouse) time, as mentioned in Section 3, is equal to , whereas the zero-shear-rate viscosity can be obtained from the shear viscosity NEMD data, which is equal to . Note that as small shear rates, the NEMD data of the viscometric functions come with large error bars, and it is difficult, particularly for the normal stress coefficients, to accurately estimate their zero-shear-rate values. Then, the value of is obtained by using the first equation of Equation (45) of Stephanou et al. [29]. Next, the value of the Giesekus parameter can be obtained by fitting the NEMD data at low shear rates and using Equation (4c) (the value of is easily calculated from Equation (4b)). Note that this value differs from the value obtained using the second equation of Equation (45) of Stephanou et al. [29]; however, the fitting of is much improved when using the former value, and the comparison against the conformation tensor data is only mildly worsened. Next, the value of beff=5.78 can be obtained from Equation (48) of Stephanou et al. [29], which differs from the value . The remaining two parameters, and , can be obtained by simply fitting the NEMD data, since they do not affect the values; we obtain and . Figure 11 shows how well the new model can fit the simulation data for the , and elements of the dimensionless conformation tensor for the C48 PE system in steady shear. We observe that the predictions of the revised model are in remarkable agreement with the NEMD extracted simulation results over the entire wide range of shear rates considered, especially for the diagonal elements. To quantify how well the model predicts the simulation data, we calculated the sum of the squares of the residuals (i.e., the residual between the simulation value and the one obtained by the model); this turns out to be ≈0.2474. The corresponding comparison for the material functions , and is presented in Figure 12. Contrary to the very good agreement between the refined model predictions and the NEMD simulation data for the dimensionless conformation tensor, the comparison against the viscometric functions is less satisfactory. Deviations from the NEMD data are mainly observed at large shear rates in the case of the shear viscosity (panel (a)) and the second normal stress coefficient (panel (c)). As also mentioned by Stephanou et al. [29], this disaccord should be related to the postulated relation between the stress and conformation tensors, Equation (2), which stems from the assumption of purely entropic elasticity [48]. As such, a more accurate expression for the free energy needs to be invoked in the future [29].
5. Conclusions
Today, it is well established, both experimentally [11,12] and computationally [13,14,15,16,17,18,19,20,21,22], that polymer chains subjected to flow fields that possess a rotational contribution exhibit, in addition to deformation, a tumbling/rotational behavior, which has been shown to be unambiguously responsible for the appearance of a transient stress undershoot (following the overshoot) at high shear rates [23,24,38]. This rotational behavior has been related to the slippage of polymer chains, relative to their surrounding, which in constitutive models is considered, among other methodologies, via the use of a non-affine or slip parameter, [25,26,27,29,38]. Although this parameter has been exclusively considered a constant, evidence suggests it should be a function of the chain’s aspect ratio [27]. Probably, with the sole exception of the works of Rallison and Hinch [32,33] and Beris et al. [34], no other constitutive model has considered a shear-rate- (and time-) dependent slip parameter.
In our present work, we modified a constitutive model [29] that has been quite successful in predicting the data (both on the level of the conformation tensor but also the viscometric functions, albeit not accurately enough) obtained from detailed atomistic NEMD simulations of unentangled polymer systems over a wide molecular weight span to accommodate a variable slip parameter. The central idea is that the increase of the slip parameter from its equilibrium (null) value should be both shear-rate- and time-dependent due to the increasing rotational contribution of the imposed shear flow as the shear rate increases. The revised model still accounts for the most significant effects realized in physical systems, such as anisotropic drag, finite extensibility, non-affine motion, variable chain relaxation, and a bounded non-equilibrium free energy, all together as introduced in its predecessor [29]. We compared the predictions of the revised model against newly executed atomistic NEMD simulations of a short unentangled PE melt with a molecular length equal to C48. Although the predictions at large shear rates were not significantly modified, the revision amended the problems associated with having -dependent zero-shear-rate viscometric functions [29,38], cf. Equations (4), and linear-viscoelastic properties [38], cf. Equations (5). It should be emphasized that although the revised model was not derived through the use of a non-equilibrium thermodynamics formalism [28,30], its thermodynamic admissibility still holds, since (provided ). Additionally, it is a straightforward exercise to extend the model to entangled systems by following our recent work [38]. We expect that the future use of the refined model will allow for more reliable prediction of macroscopic viscoelastic behavior and, therefore, for the development of more reliable computational tools, aiming to tailor-design large-molecular-weight polymeric systems.
Author Contributions
Conceptualization, P.S.S.; Data curation, V.-M.N.; Formal analysis, V.-M.N.; Funding acquisition, P.S.S.; Investigation, V.-M.N.; Methodology, P.S.S.; Project administration, P.S.S.; Resources, V.-M.N. and D.G.T.; Software, V.-M.N., D.G.T., and P.S.S.; Supervision, D.G.T. and P.S.S.; Validation, V.-M.N. and D.G.T.; Visualization, V.-M.N.; Writing—original draft, V.-M.N.; Writing—review and editing, D.G.T. and P.S.S. All authors have read and agreed to the published version of the manuscript.
Funding
This work was funded by the Cyprus University of Technology through the Starting grant of P.S.S. (Project Acronym.: NET-CST).
Institutional Review Board Statement
Not applicable.
Informed Consent Statement
Not applicable.
Data Availability Statement
The data are contained within the article.
Acknowledgments
The work was also supported by computational time granted from the Greek Research & Technology Network (GRNET) in the National HPC facility ARIS under project pr012033_thin.
Conflicts of Interest
The author declares no conflict of interest.
References
- Pedro, J.; Ramôa, B.; Nóbrega, J.M.; Fernandes, C. Verification and Validation of OpenInjMoldSim, an Open-Source Solver to Model the Filling Stage of Thermoplastic Injection Molding. Fluids 2020, 5, 84. [Google Scholar] [CrossRef]
- Fernandes, C.; Fakhari, A.; Tukovic, Ž. Non-Isothermal Free-Surface Viscous Flow of Polymer Melts in Pipe Extrusion Using an Open-Source Interface Tracking Finite Volume Method. Polymers 2021, 13, 4454. [Google Scholar] [CrossRef]
- Viana, J.C.; Cunha, A.M.; Billon, N. The Thermomechanical Environment and the Microstructure of an Injection Moulded Polypropylene Copolymer. Polymers 2002, 43, 4185–4196. [Google Scholar] [CrossRef]
- Edwards, B.J.; Sefiddashti, M.H.N.; Khomami, B. Atomistic Simulation of Shear Flow of Linear Alkane and Polyethylene Liquids: A 50-Year Retrospective. J. Rheol. 2022, 66, 415. [Google Scholar] [CrossRef]
- Katsarou, A.F.; Tsamopoulos, A.J.; Tsalikis, D.G.; Mavrantzas, V.G. Dynamic Heterogeneity in Ring-Linear Polymer Blends. Polymers 2020, 12, 752. [Google Scholar] [CrossRef] [PubMed] [Green Version]
- Tsalikis, D.G.; Mavrantzas, V.G.; Vlassopoulos, D. Analysis of Slow Modes in Ring Polymers: Threading of Rings Controls Long-Time Relaxation. ACS Macro Lett. 2016, 5, 755–760. [Google Scholar] [CrossRef]
- Tsalikis, D.G.; Mavrantzas, V.G. Size and Diffusivity of Polymer Rings in Linear Polymer Matrices: The Key Role of Threading Events. Macromolecules 2020, 53, 803–820. [Google Scholar] [CrossRef]
- Papadopoulos, G.D.; Tsalikis, D.G.; Mavrantzas, V.G. Microscopic Dynamics and Topology of Polymer Rings Immersed in a Host Matrix of Longer Linear Polymers: Results from a Detailed Molecular Dynamics Simulation Study and Comparison with Experimental Data. Polymers 2016, 8, 283. [Google Scholar] [CrossRef]
- Tsolou, G.; Stratikis, N.; Baig, C.; Stephanou, P.S.; Mavrantzas, V.G. Melt Structure and Dynamics of Unentangled Polyethylene Rings: Rouse Theory, Atomistic Molecular Dynamics Simulation, and Comparison with the Linear Analogues. Macromolecules 2010, 43, 10692–10713. [Google Scholar] [CrossRef]
- Stephanou, P.S.; Mavrantzas, V.G. Accurate Prediction of the Linear Viscoelastic Properties of Highly Entangled Mono and Bidisperse Polymer Melts. J. Chem. Phys. 2014, 140, 214903. [Google Scholar] [CrossRef]
- Smith, D.E.; Babcock, H.P.; Chu, S. Single-Polymer Dynamics in Steady Shear Flow. Science 1999, 283, 1724–1727. [Google Scholar] [CrossRef] [PubMed] [Green Version]
- LeDuc, P.; Haber, C.; Bao, G.; Wirtz, D. Dynamics of Individual Flexible Polymers in a Shear Flow. Nature 1999, 399, 564–566. [Google Scholar] [CrossRef]
- Sefiddashti, M.H.N.; Edwards, B.J.; Khomami, B. Individual Chain Dynamics of a Polyethylene Melt Undergoing Steady Shear Flow. J. Rheol. 2015, 59, 119–153. [Google Scholar] [CrossRef] [Green Version]
- Edwards, C.N.; Sefiddashti, M.H.N.; Edwards, B.J.; Khomami, B. In-Plane and out-of-Plane Rotational Motion of Individual Chain Molecules in Steady Shear Flow of Polymer Melts and Solutions. J. Mol. Graph. Model. 2018, 81, 184–196. [Google Scholar] [CrossRef] [Green Version]
- Batchelor, G.K.; Green, J.T. The Determination of the Bulk Stress in a Suspension of Spherical Particles to Order C2. J. Fluid Mech. 1972, 56, 401–427. [Google Scholar] [CrossRef]
- Sefiddashti, M.H.N.; Edwards, B.J.; Khomami, B. Steady Shearing Flow of a Moderately Entangled Polyethylene Liquid. J. Rheol. 2016, 60, 1227–1244. [Google Scholar] [CrossRef]
- Kim, J.M.; Baig, C. Precise Analysis of Polymer Rotational Dynamics. Sci. Rep. 2016, 6, 19127. [Google Scholar] [CrossRef] [Green Version]
- Tsamopoulos, A.J.; Katsarou, A.F.; Tsalikis, D.G.; Mavrantzas, V.G. Shear Rheology of Unentangled and Marginally Entangled Ring Polymer Melts from Large-Scale Nonequilibrium Molecular Dynamics Simulations. Polymers 2019, 11, 1194. [Google Scholar] [CrossRef] [Green Version]
- Schroeder, C.M.; Teixeira, R.E.; Shaqfeh, E.S.G.; Chu, S. Dynamics of DNA in the Flow-Gradient Plane of Steady Shear Flow: Observations and Simulations. Macromolecules 2005, 38, 1967–1978. [Google Scholar] [CrossRef]
- Schroeder, C.M.; Teixeira, R.E.; Shaqfeh, E.S.G.; Chu, S. Characteristic Periodic Motion of Polymers in Shear Flow. Phys. Rev. Lett. 2005, 95, 018301. [Google Scholar] [CrossRef]
- Huang, C.C.; Sutmann, G.; Gompper, G.; Winkler, R.G. Tumbling of Polymers in Semidilute Solution under Shear Flow. EPL 2011, 93, 54004. [Google Scholar] [CrossRef] [Green Version]
- Xu, X.; Chen, J.; An, L. Shear Thinning Behavior of Linear Polymer Melts under Shear Flow via Nonequilibrium Molecular Dynamics. J. Chem. Phys. 2014, 140, 174902. [Google Scholar] [CrossRef] [PubMed]
- Stephanou, P.S.; Kröger, M. Non-Constant Link Tension Coefficient in the Tumbling-Snake Model Subjected to Simple Shear. J. Chem. Phys. 2017, 147, 174903. [Google Scholar] [CrossRef]
- Costanzo, S.; Huang, Q.; Ianniruberto, G.; Marrucci, G.; Hassager, O.; Vlassopoulos, D. Shear and Extensional Rheology of Polystyrene Melts and Solutions with the Same Number of Entanglements. Macromolecules 2016, 49, 3925–3935. [Google Scholar] [CrossRef] [Green Version]
- Gordon, R.J.; Schowalter, W.R. Anisotropic Fluid Theory: A Different Approach to the Dumbbell Theory of Dilute Polymer Solutions. Trans. Soc. Rheol. 1972, 16, 79–97. [Google Scholar] [CrossRef]
- Johnson, M.W.; Segalman, D. A Model for Viscoelastic Fluid Behavior Which Allows Non-Affine Deformation. J. Nonnewton. Fluid Mech. 1977, 2, 255–270. [Google Scholar] [CrossRef]
- Larson, R.G. Constitutive Equations for Polymer Melts and Solutions, 1st ed.; Butterworth-Heinemann: Oxford, UK, 1988; ISBN 978-0-409-90119-1. [Google Scholar]
- Öttinger, H.C. Beyond Equilibrium Thermodynamics; John Wiley and Sons: Hoboken, NJ, USA, 2005; ISBN 0471666580. [Google Scholar]
- Stephanou, P.S.; Baig, C.; Mavrantzas, V.G. A Generalized Differential Constitutive Equation for Polymer Melts Based on Principles of Nonequilibrium Thermodynamics. J. Rheol. 2009, 53, 309–337. [Google Scholar] [CrossRef]
- Beris, A.N.; Edwards, B.J. Thermodynamics of Flowing Systems: With Internal Microstructure; Oxford University Press: New York, NY, USA, 1994; ISBN 019507694X. [Google Scholar]
- Stephanou, P.S. The Rheology of Drilling Fluids from a Non-Equilibrium Thermodynamics Perspective. J. Pet. Sci. Eng. 2018, 165, 1010–1020. [Google Scholar] [CrossRef]
- Hinch, E.J. Mechanical Models of Dilute Polymer Solutions in Strong Flows. Phys. Fluids 1977, 20, S22–S30. [Google Scholar] [CrossRef]
- Rallison, J.M.; Hinch, E.J. Do We Understand the Physics in the Constitutive Equation? J. Nonnewton. Fluid Mech. 1988, 29, 37–55. [Google Scholar] [CrossRef]
- Beris, A.N.; Stiakakis, E.; Vlassopoulos, D. A Thermodynamically Consistent Model for the Thixotropic Behavior of Concentrated Star Polymer Suspensions. J. Nonnewton. Fluid Mech. 2008, 152, 76–85. [Google Scholar] [CrossRef]
- Stephanou, P.S.; Georgiou, G.G. A Nonequilibrium Thermodynamics Perspective of Thixotropy. J. Chem. Phys. 2018, 149, 244902. [Google Scholar] [CrossRef] [PubMed] [Green Version]
- Housiadas, K.D.; Beris, A.N. Extensional Behavior Influence on Viscoelastic Turbulent Channel Flow. J. Nonnewton. Fluid Mech. 2006, 140, 41–56. [Google Scholar] [CrossRef]
- Souvaliotis, A.; Beris, A.N. An Extended White–Metzner Viscoelastic Fluid Model Based on an Internal Structural Parameter. J. Rheol. 1992, 36, 241–271. [Google Scholar] [CrossRef]
- Stephanou, P.S.; Tsimouri, I.C.; Mavrantzas, V.G. Simple, Accurate and User-Friendly Differential Constitutive Model for the Rheology of Entangled Polymer Melts and Solutions from Nonequilibrium Thermodynamics. Mater. 2020, 13, 2867. [Google Scholar] [CrossRef]
- Siepmann, J.I.; Karaborni, S.; Smit, B. Simulating the Critical Behaviour of Complex Fluids. Nature 1993, 365, 330–332. [Google Scholar] [CrossRef] [Green Version]
- Plimpton, S. Fast Parallel Algorithms for Short-Range Molecular Dynamics. J. Comput. Phys. 1995, 117, 1–19. [Google Scholar] [CrossRef] [Green Version]
- Nosé, S. Constant Temperature Molecular Dynamics Methods. Prog. Theor. Phys. Suppl. 1991, 103, 1–46. [Google Scholar] [CrossRef] [Green Version]
- Hoover, W.G. Canonical Dynamics: Equilibrium Phase-Space Distributions. Phys. Rev. A 1985, 31, 1695. [Google Scholar] [CrossRef] [Green Version]
- Parrinello, M.; Rahman, A. Polymorphic Transitions in Single Crystals: A New Molecular Dynamics Method. J. Appl. Phys. 1981, 52, 7182–7190. [Google Scholar] [CrossRef]
- Todd, B.D.; Daivis, P.J. Nonequilibrium Molecular Dynamics: Theory, Algorithms and Applications; Cambridge University Press: Cambridge, UK, 2017. [Google Scholar]
- Tuckerman, M.; Berne, B.J.; Martyna, G.J. Reversible Multiple Time Scale Molecular Dynamics. J. Chem. Phys. 1992, 97, 1990–2001. [Google Scholar] [CrossRef] [Green Version]
- Williams, G.; Watts, D.C. Non-Symmetrical Dielectric Relaxation Behaviour Arising from a Simple Empirical Decay Function. Trans. Faraday Soc. 1970, 66, 80–85. [Google Scholar] [CrossRef]
- MathWorks, T. MATLAB (R2020b); MathWorks Inc.: Portola Valley, CA, USA, 2020. [Google Scholar]
- Grmela, M. Stress Tensor in Generalized Hydrodynamics. Phys. Lett. A 1985, 111, 41–44. [Google Scholar] [CrossRef]
Figure 1.
Model predictions for the slip parameter as a function of Wi and dependence on: (a) the parameters , and for , and (b) the parameters and b for and . The dark yellow dotted lines depict the analytical expression Equation (4e) for each case.
Figure 1.
Model predictions for the slip parameter as a function of Wi and dependence on: (a) the parameters , and for , and (b) the parameters and b for and . The dark yellow dotted lines depict the analytical expression Equation (4e) for each case.
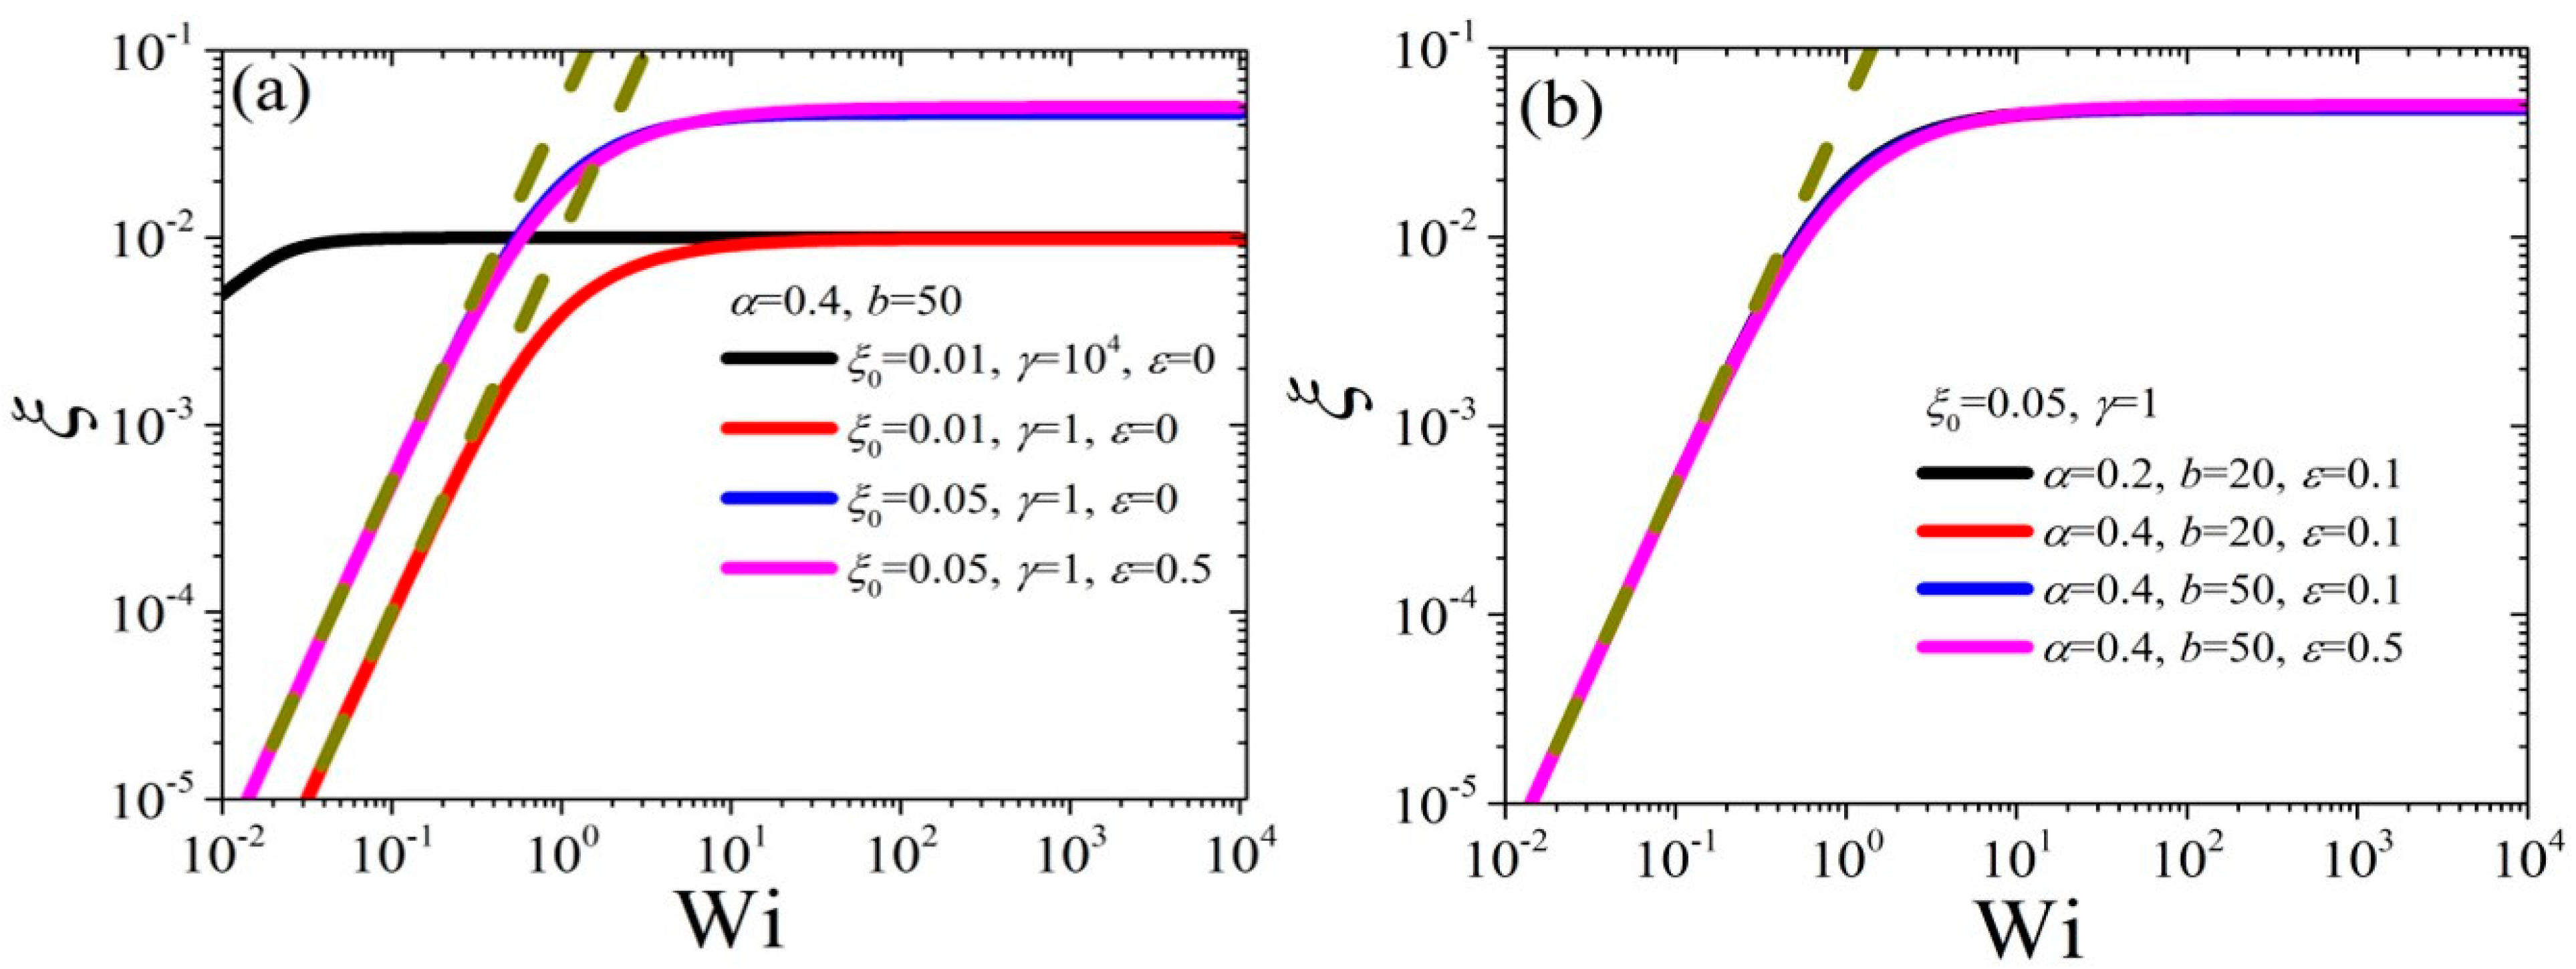
Figure 2.
Variation of the conformation tensor elements (a) cxx, (b) cxy, (c) cyy, and (d) czz with Wi and dependence on the parameters , and for . The dark yellow dashed line depicts the asymptotic behavior at small shear rates given by Equations (4).
Figure 2.
Variation of the conformation tensor elements (a) cxx, (b) cxy, (c) cyy, and (d) czz with Wi and dependence on the parameters , and for . The dark yellow dashed line depicts the asymptotic behavior at small shear rates given by Equations (4).
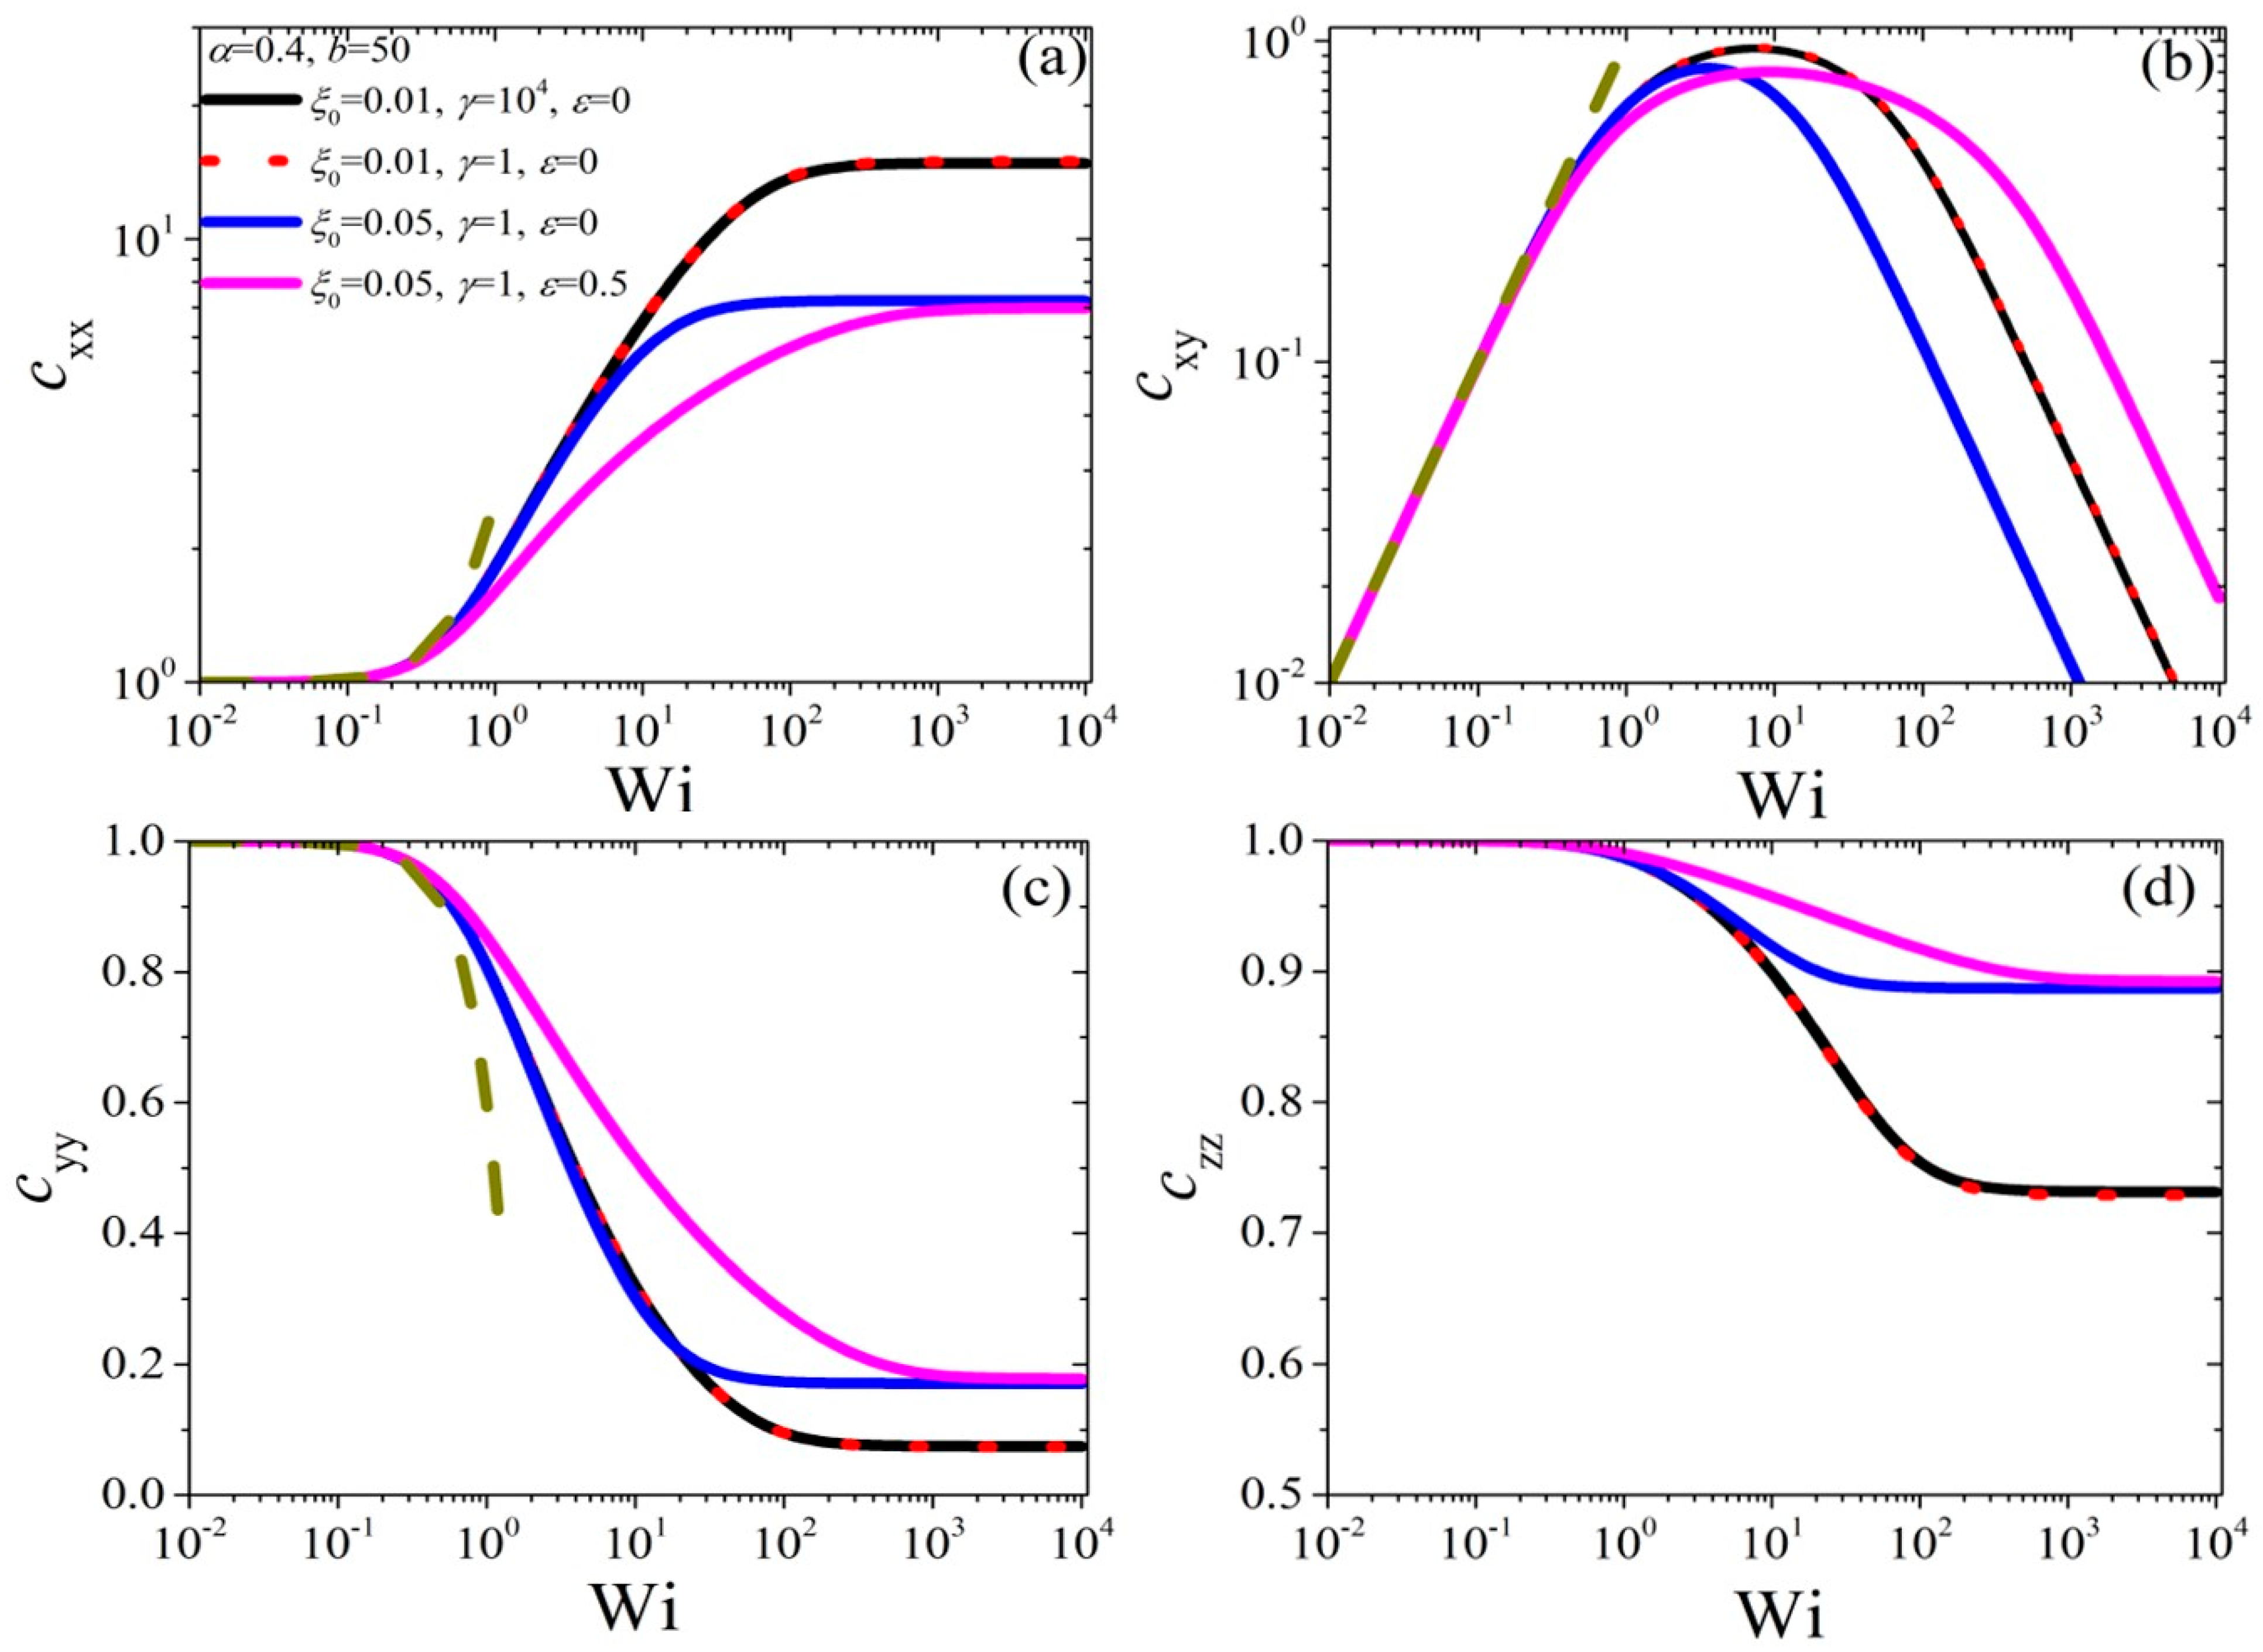
Figure 3.
Variation of the conformation tensor elements (a) cxx, (b) cxy, (c) cyy, and (d) czz with Wi and dependence on the parameters and b for and .
Figure 3.
Variation of the conformation tensor elements (a) cxx, (b) cxy, (c) cyy, and (d) czz with Wi and dependence on the parameters and b for and .
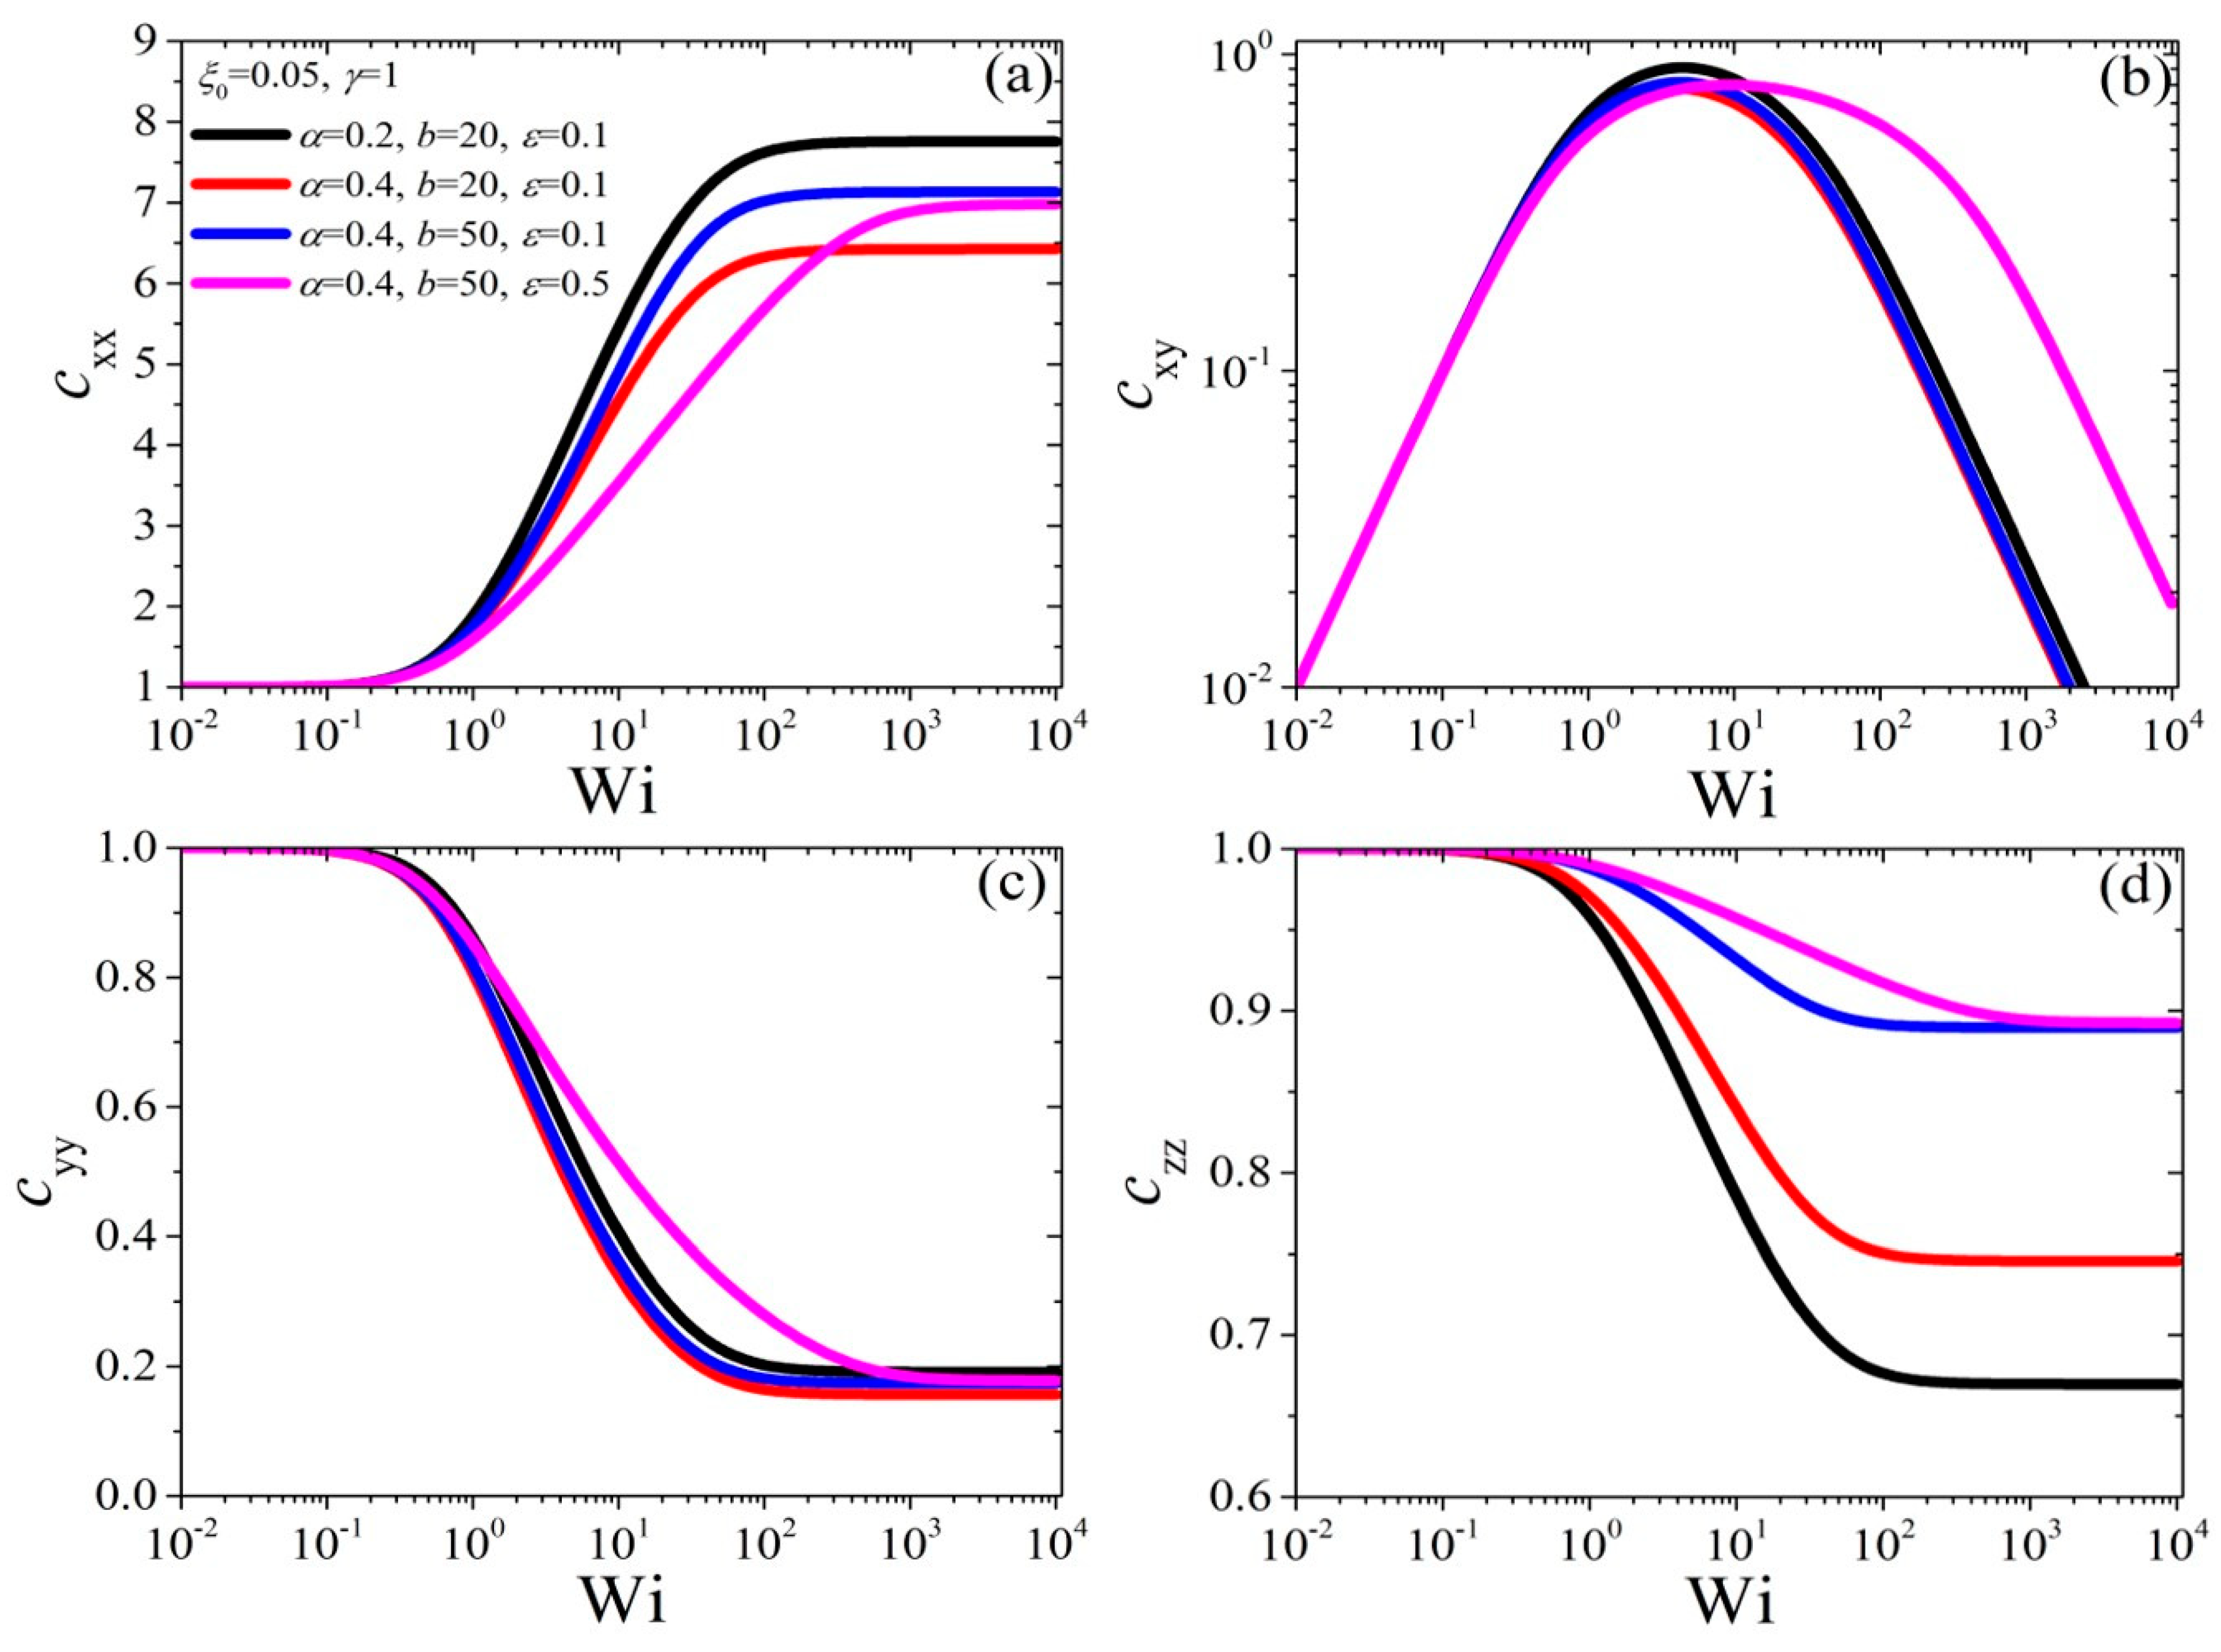
Figure 4.
Variation of the (a) shear viscosity, (b) the first normal stress coefficient, and (c) the negative second normal stress coefficient as a function of Wi and dependence on the parameters , and for .
Figure 4.
Variation of the (a) shear viscosity, (b) the first normal stress coefficient, and (c) the negative second normal stress coefficient as a function of Wi and dependence on the parameters , and for .

Figure 5.
Variation of the (a) shear viscosity, (b) the first normal stress coefficient, and (c) the negative second normal stress coefficient as a function of Wi and dependence on the parameters , and b for of and .
Figure 5.
Variation of the (a) shear viscosity, (b) the first normal stress coefficient, and (c) the negative second normal stress coefficient as a function of Wi and dependence on the parameters , and b for of and .

Figure 6.
Variation of the slip parameter upon the inception of shear flow as a function of at two different values of the dimensionless shear rate , and dependence on: (a) the parameters and for ; and (b) the parameters and b for and . In all cases, .
Figure 6.
Variation of the slip parameter upon the inception of shear flow as a function of at two different values of the dimensionless shear rate , and dependence on: (a) the parameters and for ; and (b) the parameters and b for and . In all cases, .
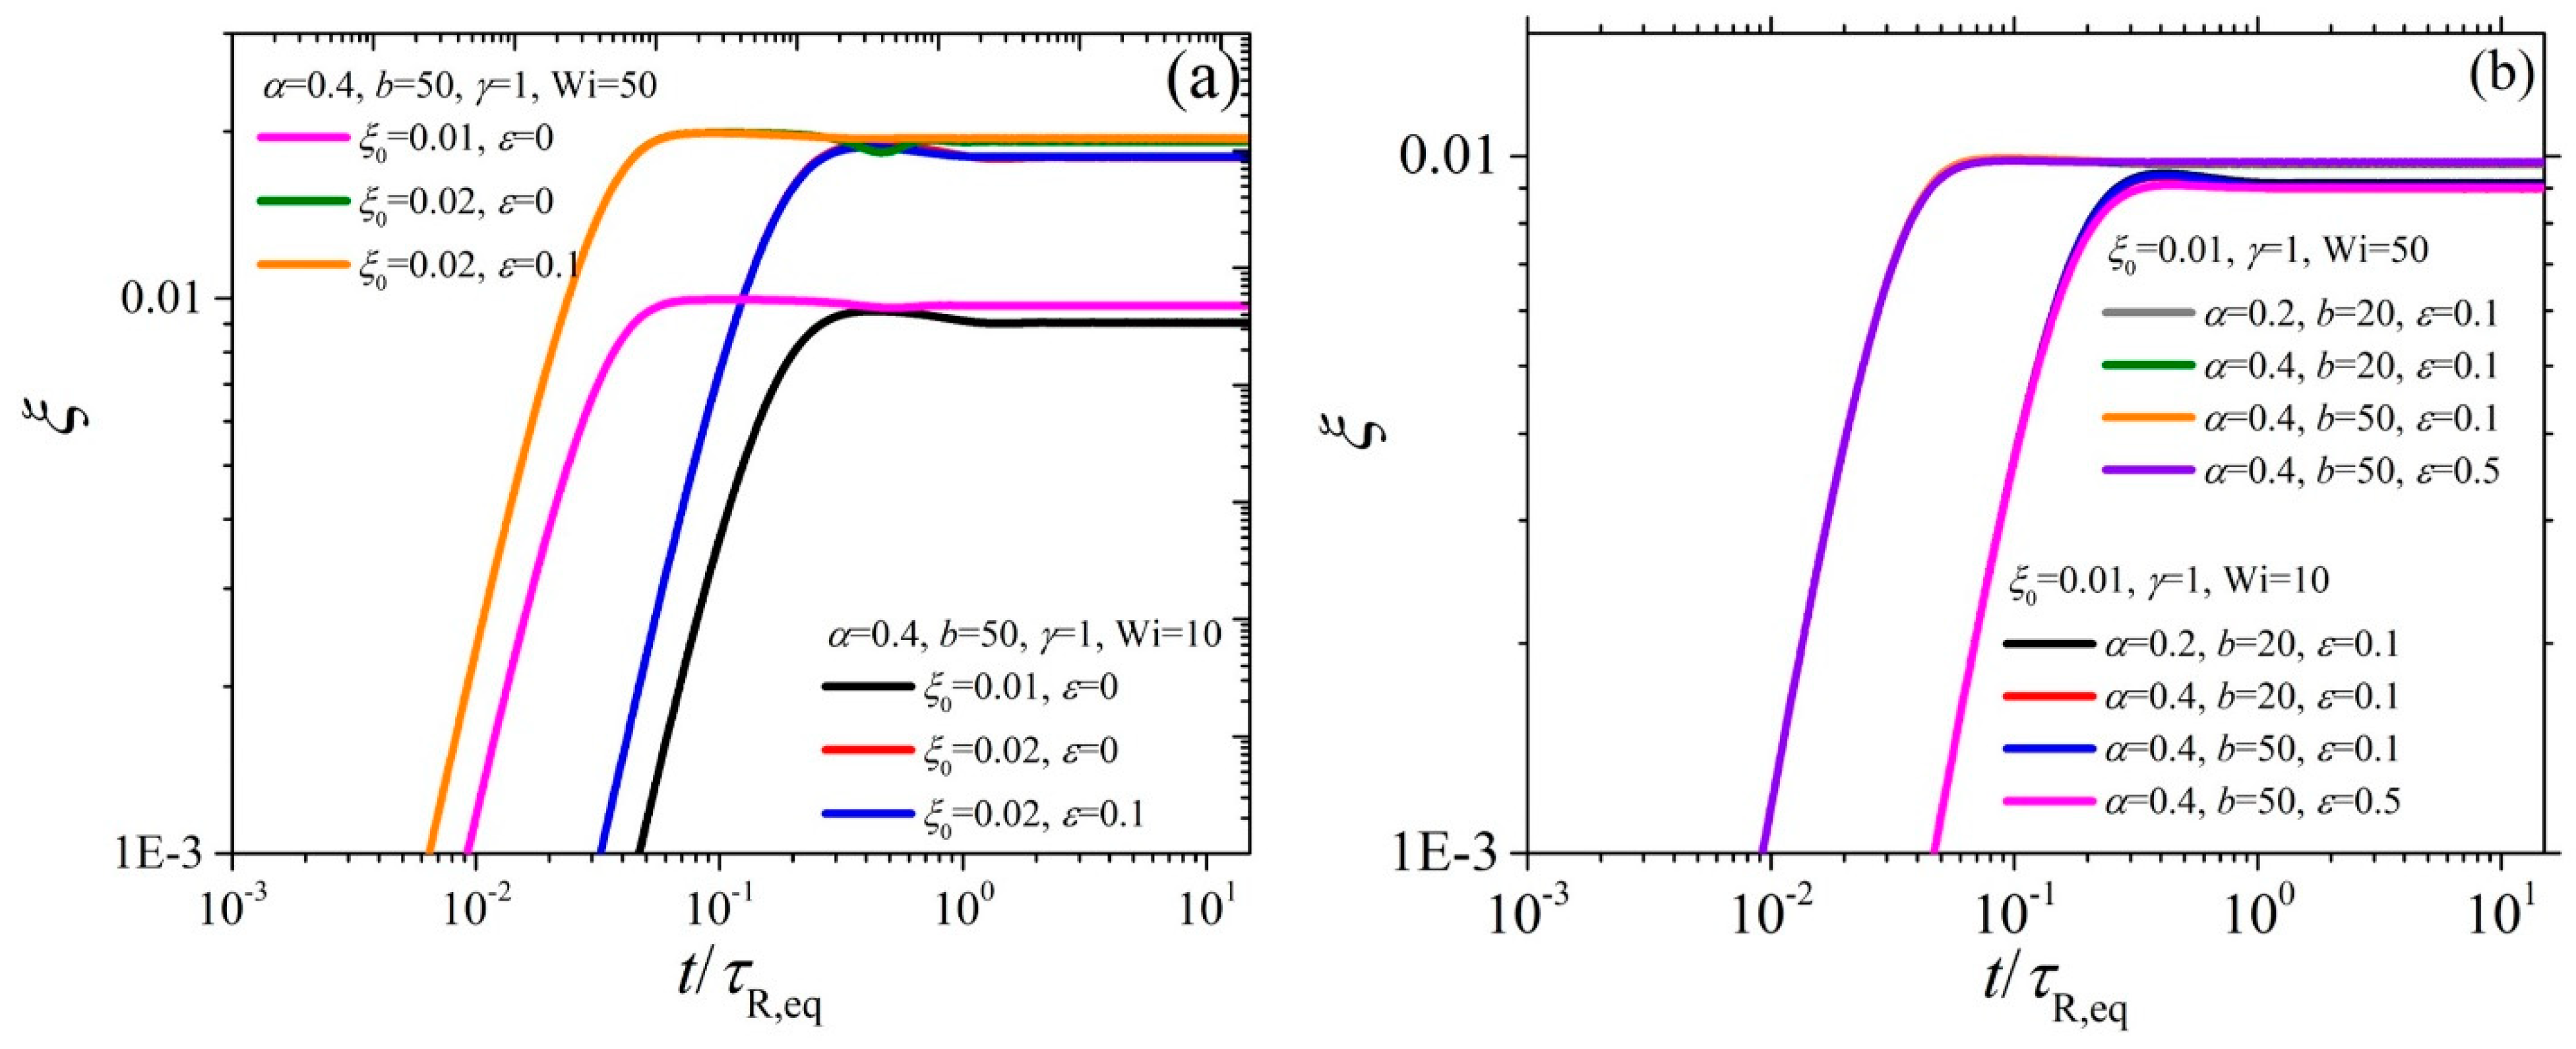
Figure 7.
Variation of the growth of the conformation tensor elements (a) cxx, (b) cxy, (c) cyy, and (d) czz upon the inception of shear flow as a function of at two different values of the dimensionless shear rate , and dependence on the parameters , and for .
Figure 7.
Variation of the growth of the conformation tensor elements (a) cxx, (b) cxy, (c) cyy, and (d) czz upon the inception of shear flow as a function of at two different values of the dimensionless shear rate , and dependence on the parameters , and for .
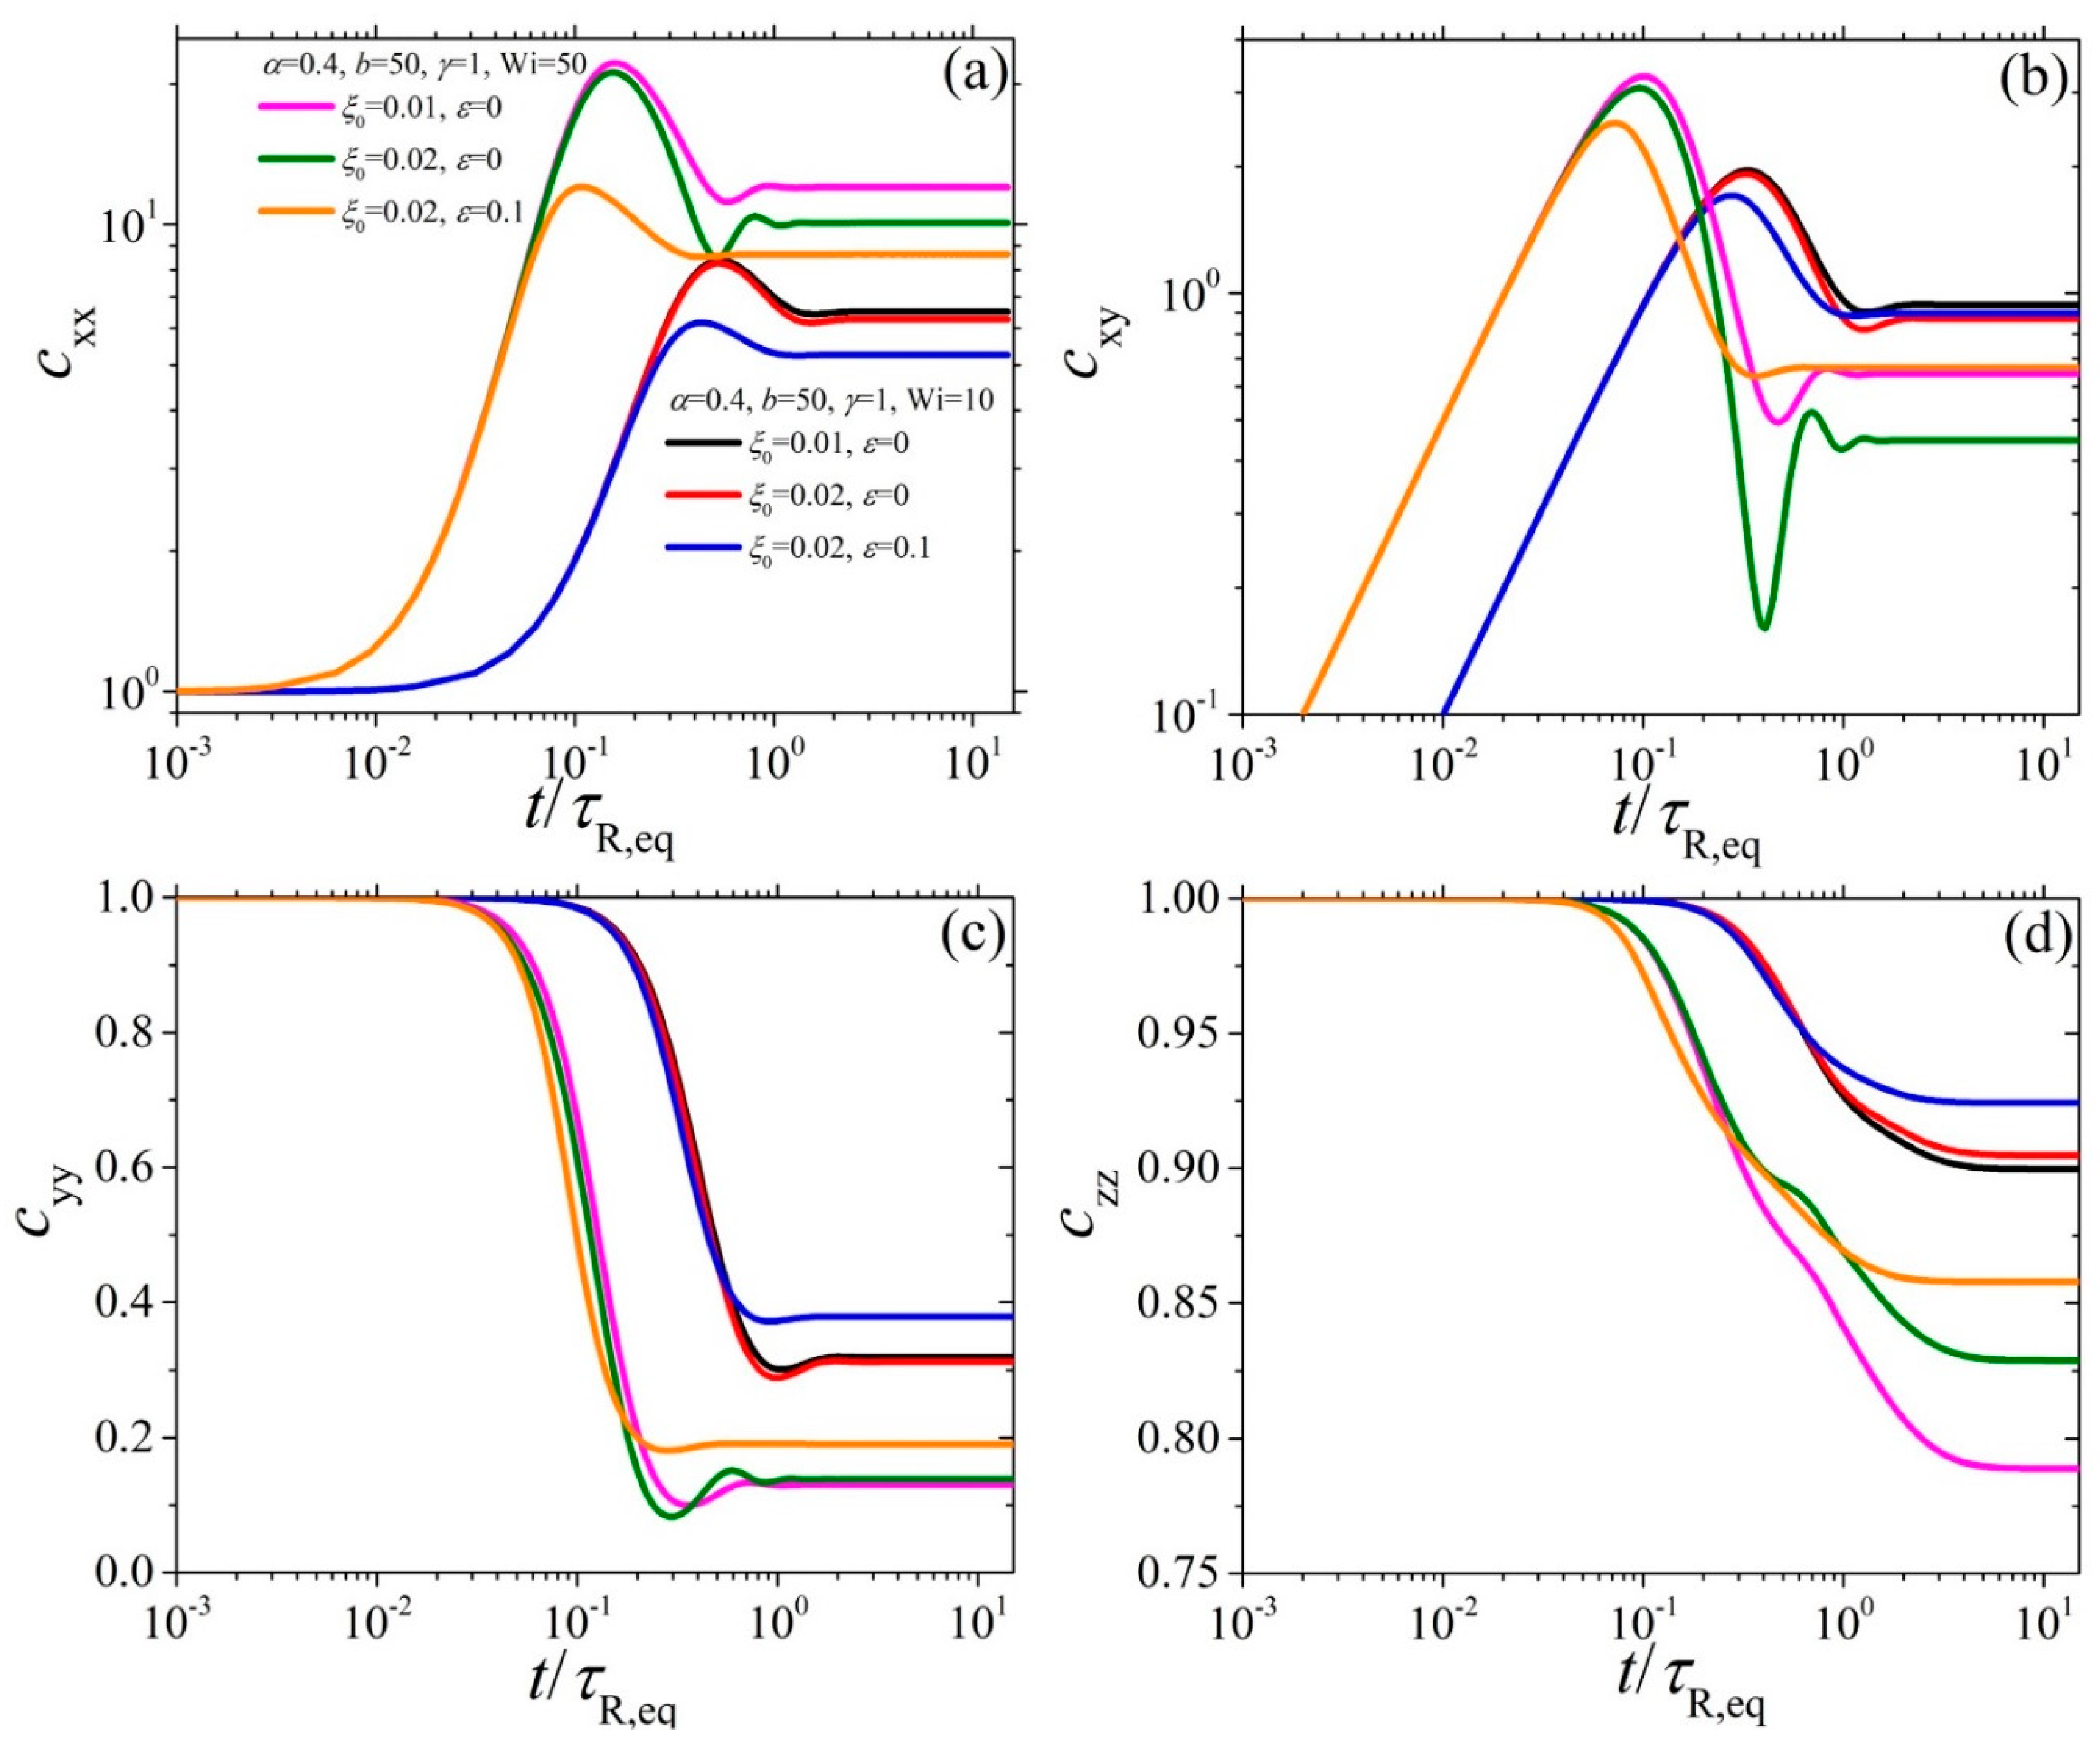
Figure 8.
Variation of the growth of the conformation tensor elements (a) cxx, (b) cxy, (c) cyy, and (d) czz upon the inception of shear flow as a function of at two different values of the dimensionless shear rate , and dependence on the parameters , and b for of and .
Figure 8.
Variation of the growth of the conformation tensor elements (a) cxx, (b) cxy, (c) cyy, and (d) czz upon the inception of shear flow as a function of at two different values of the dimensionless shear rate , and dependence on the parameters , and b for of and .
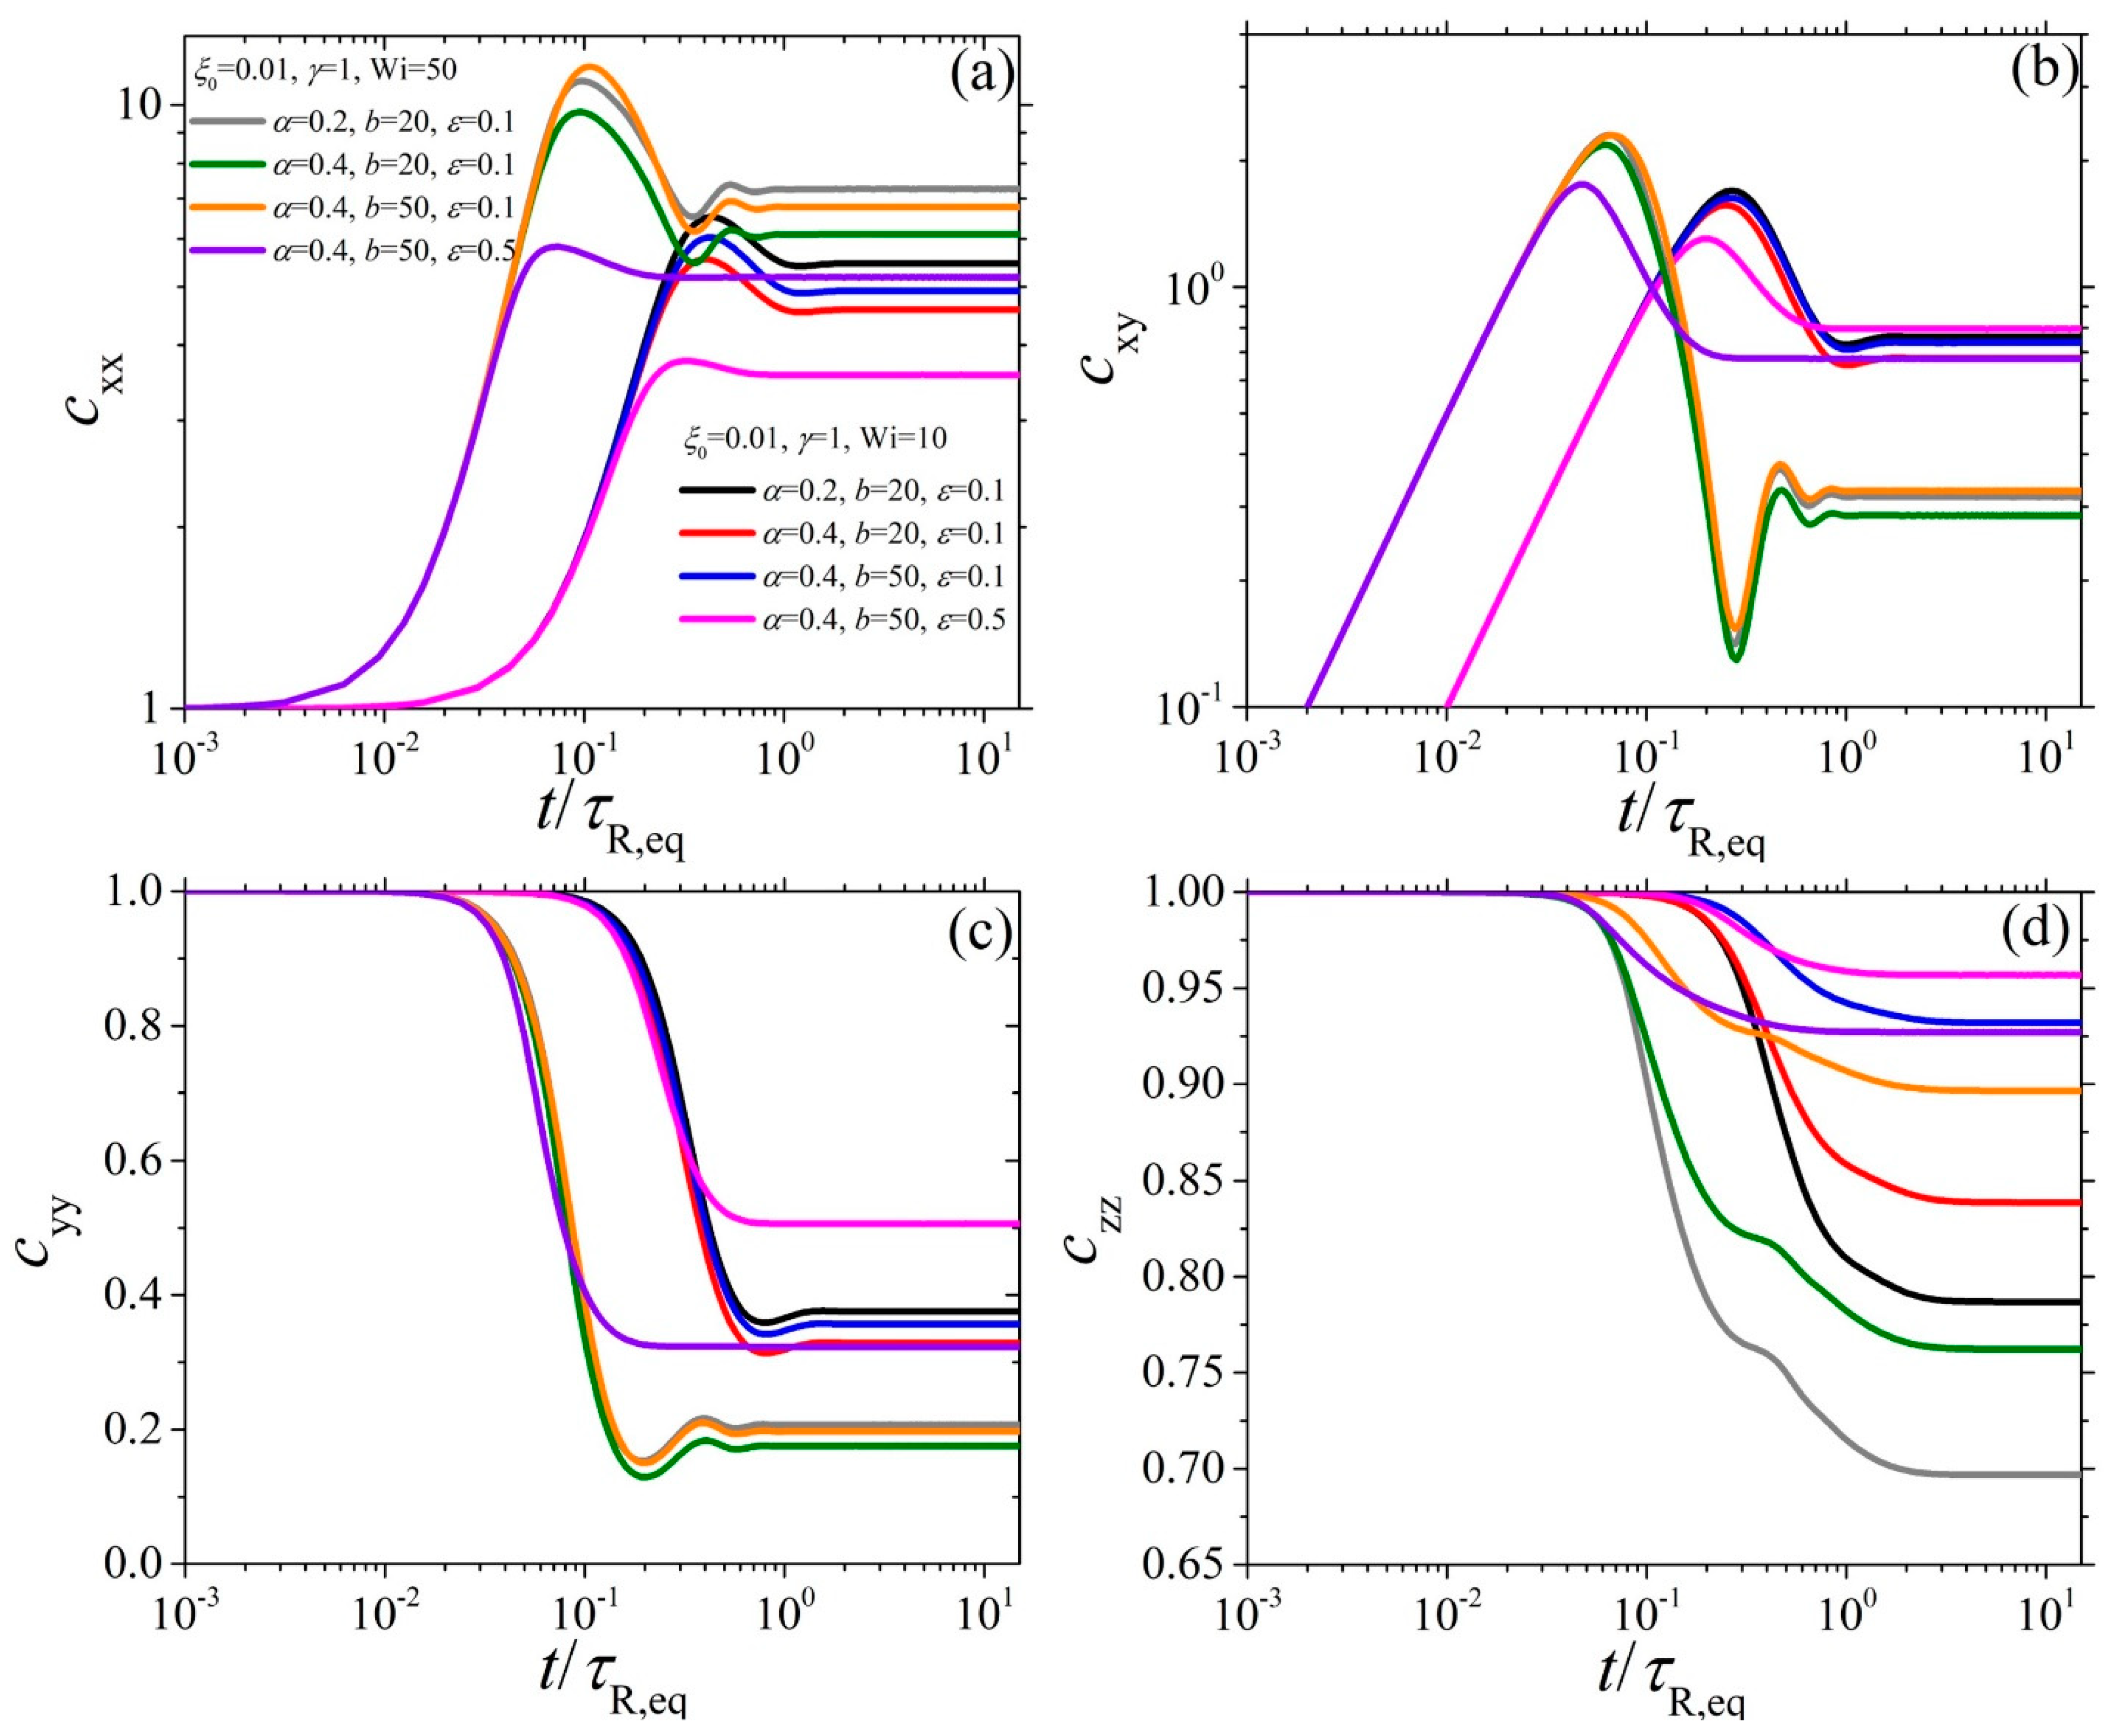
Figure 9.
Variation of the growth of the (a) shear viscosity, (b) the first normal stress coefficient, and (c) the negative second normal stress coefficient upon the inception of shear flow as a function of at two different values of the dimensionless shear rate , and dependence on the parameters , and for . The dotted dark yellow line in each panel depicts the LVE envelope given by Equation (6).
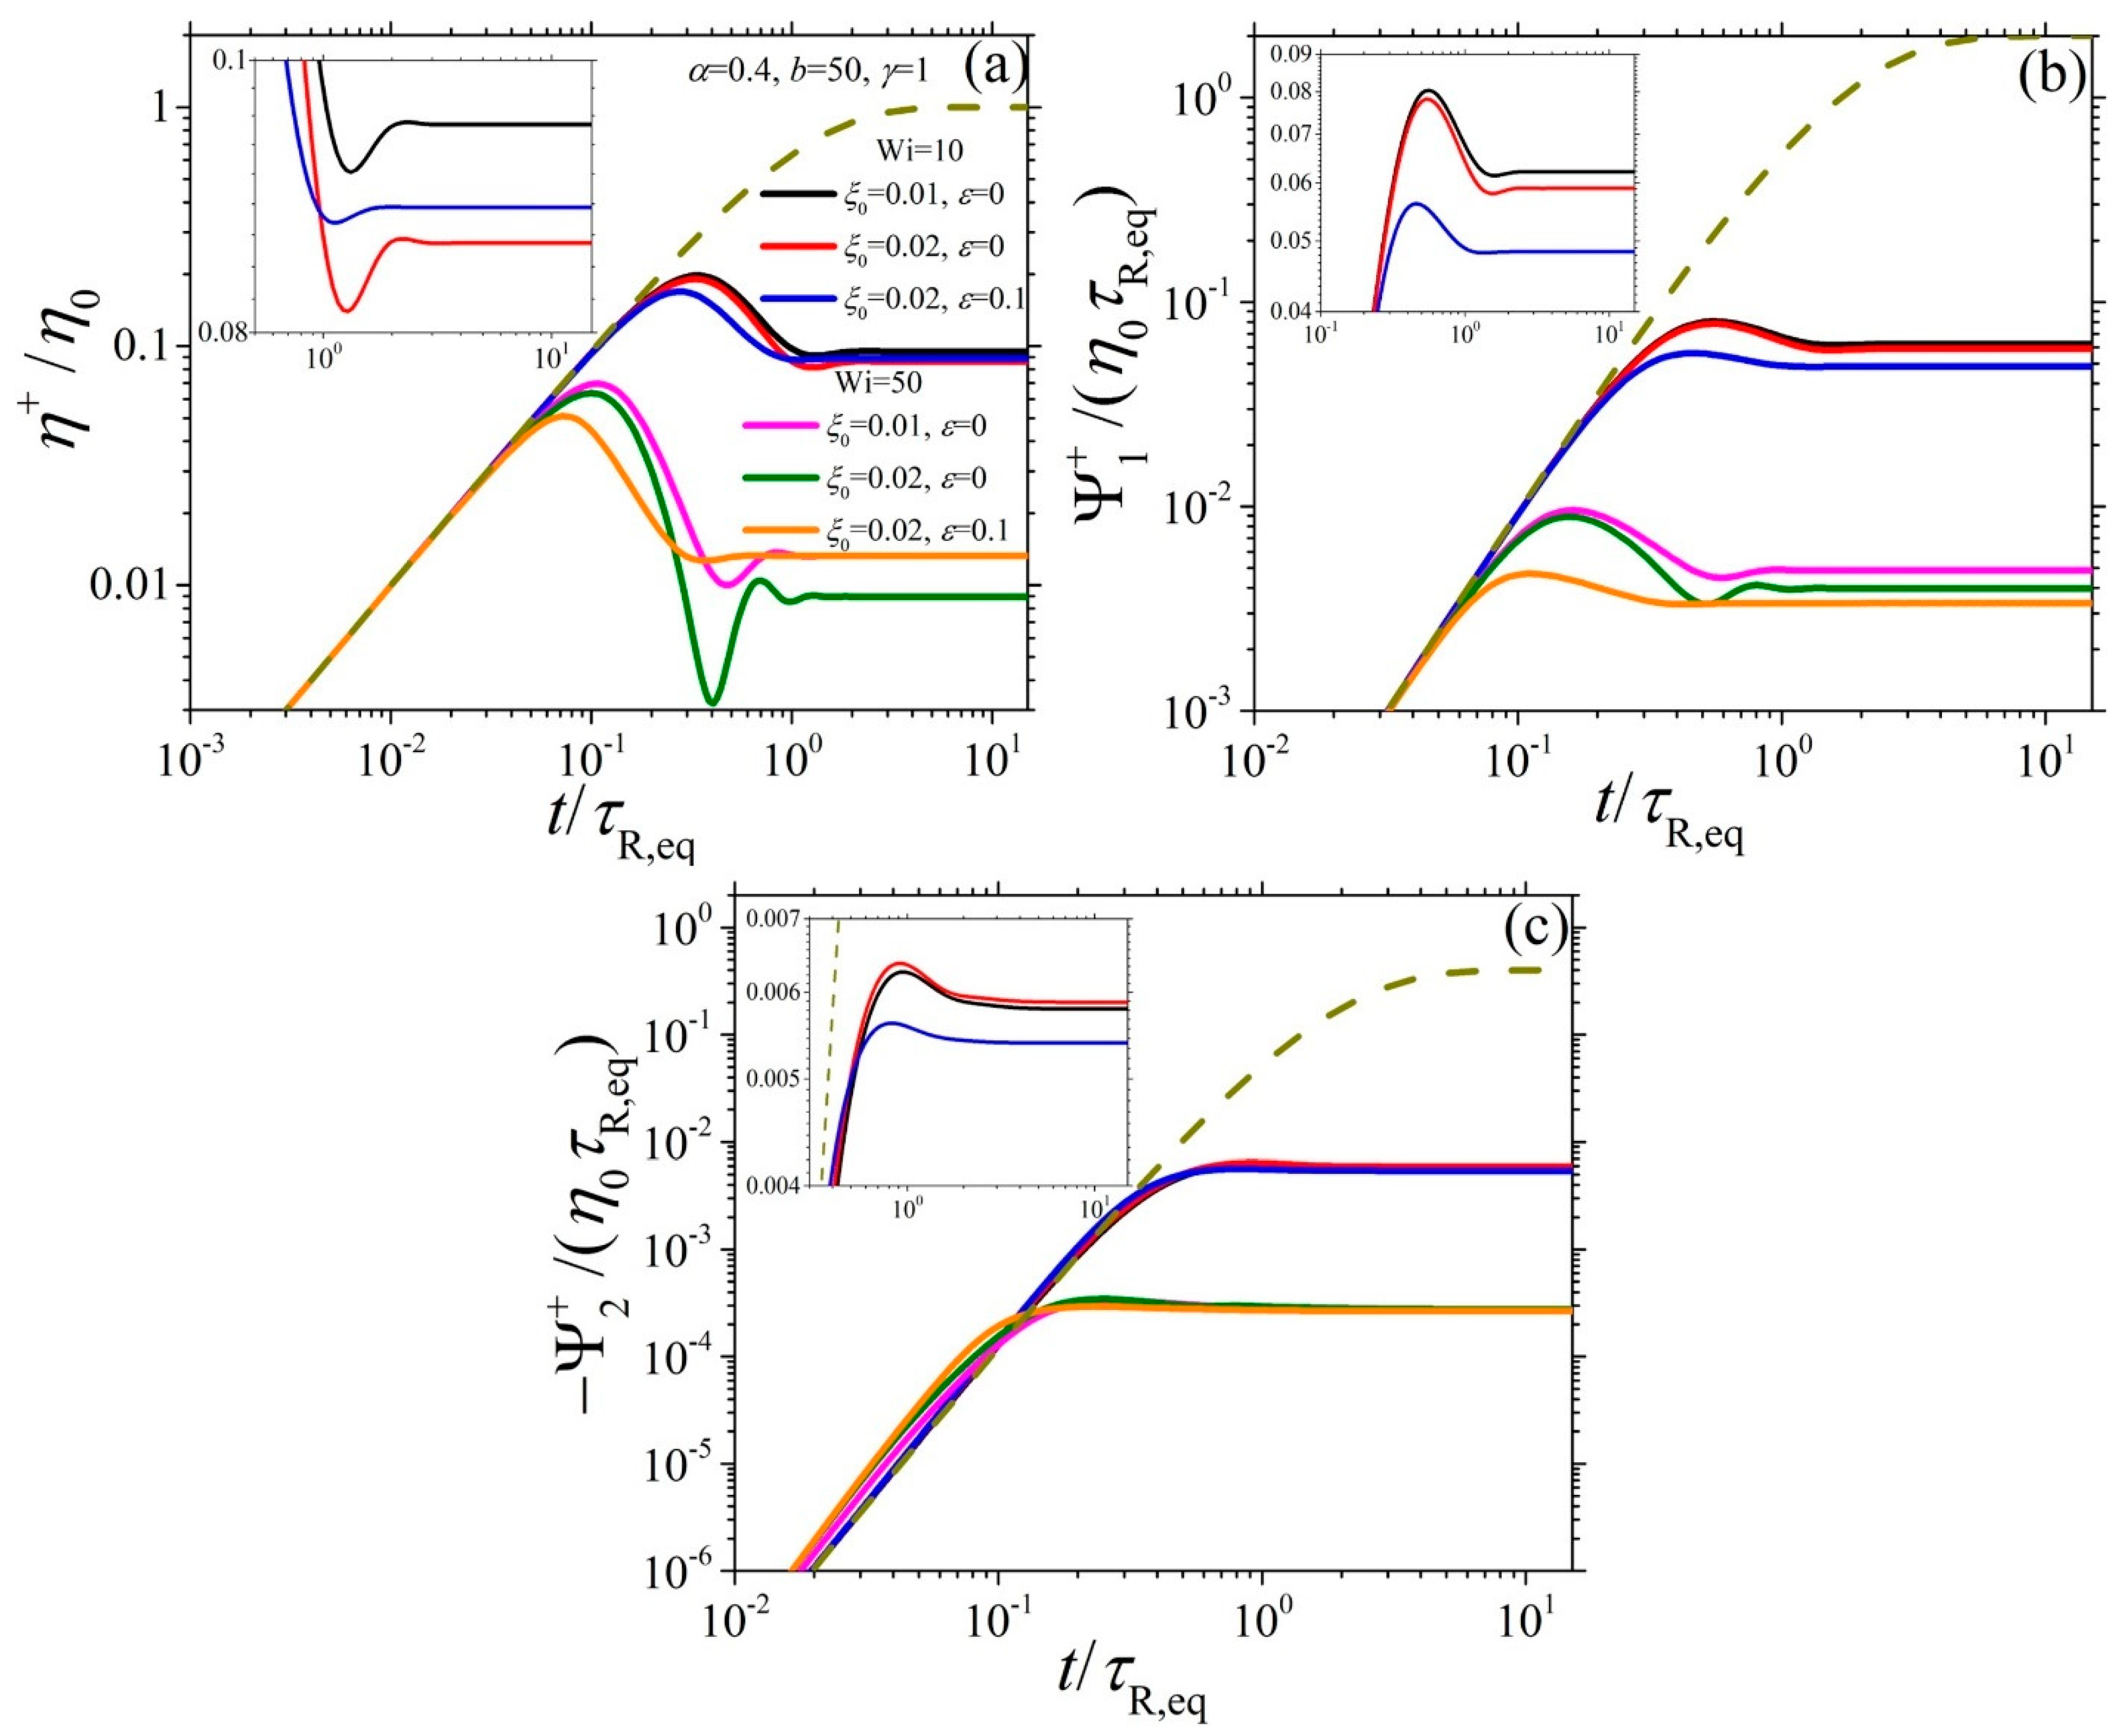
Figure 10.
Variation of the growth of the (a) shear viscosity, (b) the first normal stress coefficient, and (c) the negative second normal stress coefficient upon the inception of shear flow as a function of at two different values of the dimensionless shear rate , and dependence on the parameters , and b for of and . Note that two LVE envelopes are provided for , one for each value.

Figure 11.
Model predictions (blue line) for the conformation tensor elements (a) cxx, (b) cxy, (c) cyy, and (d) czz in steady shear for the C48 PE melt along with comparison with the NEMD simulation results (red squares).
Figure 11.
Model predictions (blue line) for the conformation tensor elements (a) cxx, (b) cxy, (c) cyy, and (d) czz in steady shear for the C48 PE melt along with comparison with the NEMD simulation results (red squares).

Figure 12.
Model predictions (blue line) for the (a) shear viscosity, (b) first normal stress coefficient, and (c) negative second normal stress coefficient in steady shear for the C48 PE melt along with comparison with the NEMD simulation results (red squares).
Figure 12.
Model predictions (blue line) for the (a) shear viscosity, (b) first normal stress coefficient, and (c) negative second normal stress coefficient in steady shear for the C48 PE melt along with comparison with the NEMD simulation results (red squares).

Publisher’s Note: MDPI stays neutral with regard to jurisdictional claims in published maps and institutional affiliations. |
© 2022 by the authors. Licensee MDPI, Basel, Switzerland. This article is an open access article distributed under the terms and conditions of the Creative Commons Attribution (CC BY) license (https://creativecommons.org/licenses/by/4.0/).
Share and Cite
MDPI and ACS Style
Nikiforidis, V.-M.; Tsalikis, D.G.; Stephanou, P.S. On the Use of a Non-Constant Non-Affine or Slip Parameter in Polymer Rheology Constitutive Modeling. Dynamics 2022, 2, 380-398. https://doi.org/10.3390/dynamics2040022
AMA Style
Nikiforidis V-M, Tsalikis DG, Stephanou PS. On the Use of a Non-Constant Non-Affine or Slip Parameter in Polymer Rheology Constitutive Modeling. Dynamics. 2022; 2(4):380-398. https://doi.org/10.3390/dynamics2040022
Chicago/Turabian StyleNikiforidis, Vasileios-Martin, Dimitrios G. Tsalikis, and Pavlos S. Stephanou. 2022. "On the Use of a Non-Constant Non-Affine or Slip Parameter in Polymer Rheology Constitutive Modeling" Dynamics 2, no. 4: 380-398. https://doi.org/10.3390/dynamics2040022