Dose-Dependency of the Glycemic Response to Polyphenol-Rich Sugarcane Extract (PRSE)


TPM Bioactives Division, The Product Makers, Pty, Ltd., Melbourne, VIC 3173, Australia
*
Author to whom correspondence should be addressed.
Biologics 2023, 3(4), 308-320; https://doi.org/10.3390/biologics3040016
Submission received: 26 July 2023
/
Revised: 21 September 2023
/
Accepted: 27 September 2023
/
Published: 10 October 2023
(This article belongs to the Section Natural Products)
Abstract
:Foods high in available carbohydrates, such as plain white sugar or sucrose, increase the postprandial blood glucose levels that may aggravate the risk of developing Type 2 Diabetes. One class of compounds that is gaining popularity due to its potential application in reducing the release of sugars for absorption into the body is polyphenols. The study aimed to investigate the effect of adding different doses of polyphenol-rich sugarcane extract (PRSE) to sucrose to lower the postprandial glycemia of the participants in a non-randomized study. The four test samples’ Glycemic Index (GI) values were calculated based on the standardized recommended methodology by comparing the area under the curve (AUC) of the test samples against the glucose standard. The glucose concentration curves were similar for the four test foods. The glucose response curves, and GI values were decreased in a dose-dependent manner. The results of this study indicate that PRSE-coated sugar can lower postprandial glycemia in normal individuals. Additionally, decreasing GI values with an increasing concentration of polyphenols suggests a dose-dependent effect between polyphenol levels and GI.
1. Introduction
The rising number of patients developing Type 2 diabetes and obesity worldwide has become a global public health challenge [1,2,3]. WHO recorded a 3% increase in diabetes mortality cases by age between 2000–2019 and an estimated 2 million deaths in 2019. There are two forms of diabetes, Type 1 and Type 2, and type 2 accounts for over 90% of diabetes cases worldwide. Factors such as environmental, lifestyle and genetic predisposition have been implicated to be the primary causes of Type 2 diabetes [4]. Type 2 Diabetes is often characterized by abnormal glucose metabolism due to insufficient insulin secretion dysfunction in carbohydrate and sugar metabolism [5]. The concept of Glycemic index (GI) has been introduced to quantify the impact of carbohydrate consumption on the changes in the postprandial glucose measurement [6,7]. Research has shown that consumption of low GI foods has beneficial health effects in managing Type 2 diabetes by slow and controlled glucose metabolism after consumption.
Growing evidence shows that plant-based bioactive compounds have long-term health-protective functions against various chronic diseases. A large heterogeneous group of phytochemicals called polyphenols is becoming an emerging field of interest due to its association with reducing risks of cancer [8,9,10,11,12,13], cardiovascular diseases [14,15,16,17], neurodegenerative diseases [18,19,20,21] and glycemic control [22,23]. Dietary polyphenols are classified into different subgroups: flavonoids, phenolic acids, stilbenes and lignans [24]. Due to the complexity and differences of the chemical structure, each subclass of polyphenols undergo different metabolic pathways once consumed. Most of the polyphenol intake is metabolized in the colon, and a smaller fraction is absorbed directly into the upper gastrointestinal tract [11]. The study by Calderón-Pérez et al. estimated that 90–95% of the ingested polyphenol accumulates in the colon and gets converted into active metabolites by the gut microbiota [25,26].
Epidemiological studies have shown that dietary polyphenols affect fasting glucose [27], and postprandial glycemic response [23,28,29] and support favorable effects in preventing and managing diabetes mellitus [30,31,32]. The hypoglycemic reduction effects of polyphenols are attributed to a few potential mechanisms of action. Firstly, there is evidence that certain polyphenols are involved in carbohydrate digestion and glucose absorption in the body. Few In-vitro studies demonstrated that dietary polyphenols from berries [33], legumes [34,35], black and green teas [36,37], vegetables [38,39], black rice and red wine [27] have demonstrated an in-vitro inhibitory effects on two key enzymes involved in the digestion of carbohydrate digestion: α-amylase and α-glucosidase. Several flavonoids and phenolic acids have shown enhanced insulin-mediated glucose uptake that is related to the glucose transport system of the body [28,40,41,42]. There are also in-vitro studies that showed the effects of polyphenols on glucose metabolism in the liver. Kurimoto et al. reported that Black soybean seed coat reduced blood glucose levels and enhanced insulin sensitivity by activating the adenosine monophosphate (AMP)-activated protein kinase (AMPK) in the skeletal muscle and liver of type 2 diabetic mice. More recently, the scientific community pivoted its attention to the different bioactive compounds found in the by-products of the sugarcane(Saccharum officinarum) refining processes. In one of our previous studies, we showed that the different combinations of polyphenols present in polyphenol-rich sugarcane extract (PRSE) induced inhibition in sodium-dependent and independent glucose uptake. Some evidences suggests PRSE has a restoration capability of insulin production in insulin dysfunctional β-cells. The combination of the inhibitory activity against glucose uptake, fructose uptake, transporter expression and insulin restoration ability in cell cultures suggests that polyphenols in sugarcane have modulatory effects on the body’s glycemic response.
Some studies support the connection between excessive oxidative stress, insulin resistance, and diabetes mellitus. Lowering oxidative stress by managing postprandial hyperglycemia through food intake that induces smaller blood glucose fluctuations is an effective way to counteract type 2 diabetes. An International consensus in classifying foods according to their effect on blood glucose levels was agreed by experts in 2015 [7]. Glycemic Index (GI) values were approved as a valid method to rank glycemic carbohydrates in different food categories. Few human clinical studies have shown that low GI diets effectively improve glycemic control in diabetic patients [43,44].
In previous studies, (PRSE) has shown potential activities in carbohydrate digestion and regulation [45]. The active compounds in PRSE involved in carbohydrate digestion are still being investigated; possible candidates are phenolic compounds and organic acids. Preliminary liquid chromatography-mass spectrometry (LCMS) characterization has identified polyphenols related to carbohydrate metabolism. In the paper by Wright et al., eight polyphenols were identified: orientin (340 µg/g), cyanidin-3-O glucoside (330 µg/g), ferulic acid (250 µg/g), malvidin-glycoside (180 µg/g), diosmin (140 µg/g), epigallocatechin (100 µg/g), p-coumaric (90 µg/g), vitexin (40 µg/g) [46]. In a more recent paper, the methanolic extracts of PRSE were analysed using LCMS. They found additional polyphenols: syringic acid (10.90 ± 0.024 µg/g) chlorogenic acid (6.53 ± 0.004 µg/g), swertisin (0.69 ± 0.01 µg/g), caffeic acid (0.29 ± 0.01 µg/g), sinapic acid (0.18 ± 0.02 µg/g), vanillin (0.15 ± 0.05 µg/g), diosmetin (0.15 ± 0.01 µg/g), homoorientin (0.04 ± 0.000 µg/g), tricin (0.029 ± 0.001 µg/g), apigenin (0.001 ± 0.000 µg/g) [47]. Previous clinical trials showed that the consumption of PRSE before consumption of carbohydrate-rich foods decreased the postprandial measurement in a dose-dependent manner. The dose tested in the mentioned study involves polyphenol content levels ranging from 20–40 mg/100 g [46]. To further increase our understanding of how the polyphenols in PRSEs affect glucose levels in the body when added to a carbohydrate-rich food, we investigated its dose-response effect on the GI values.
2. Results
Studies have shown that the naturally concentrated polyphenols from sugarcane extract have an inhibitive effect on glucose and fructose uptake, transporter expression, and insulin restoration ability in cell cultures. In the present study, we investigated the postprandial glycemic effects of PRSE-coated sugar in varying dosages.
2.1. Postprandial Glucose Measurement of One Dose of Sugar Sample
Initially, we were interested in the glycemic reduction effect of PRSE when added to sucrose. In our previous paper, we have shown that the addition of PRSE to different food products reduced the postprandial glucose measurement in a dose-dependent manner that is directly proportional to the ratio of the sugarcane polyphenols added to the amount of available carbohydrates in the test foods [46]. Similarly, a linear and inversely proportional relationship between the PRSE doses and the reduction in the postprandial glucose measurements was reported in a separate study [46]. The participants were asked to consume the sugarcane extract as a supplement before meals. In this current study, we are interested to see if the addition of PRSE to sucrose can reduce postprandial glucose measurements. We initially tested two test foods: a sugar sample with 0 mg/100 g polyphenols (negative control) and a sugar sample that contains 25 mg/100 g polyphenols (Sample 1). Additional dosages were tested in the trial extension to confirm the dose-response effect of PRSE.
The calculated average two-hour plasma glucose response curves of the reference food and the two test foods are shown in Figure 1. The two test foods and the reference food samples exhibited a rapid change in the blood glucose level from t = 15 min. The tmax was recorded at t = 30 min. The highest change in the reference food’s blood glucose measurement (ΔCmax) was observed at 4.4 mmol/L (t = 30 min). For sample 1, ΔCmax was observed at 3.6 mmol/L, and for sample 2, it is in 3.1 mmol/L. The rapid increase in the blood glucose measurements in t = 15 to 60 min was also observed in the previous studies, suggesting that the PRSE’s mechanism of action in lowering the postprandial glucose measurement is due to less glucose being transported across the intestinal layer [48]. All three products showed a steady decline until the end of the two-hour testing period. The glucose measurements of the reference food and the two test foods of this trial are summarized in Table S1 of the Supplementary material. Visually, both test foods exhibited similar response curves as the reference food. This similarity is because both the test foods and the reference foods belong to the same food category, which was observed in the study published by Brand-Miller et al. [6].
2.2. Trial Extension: Additional Dosages
Based on the glycemic reduction observed in Sample 1 (25 mg/100 g polyphenols), two additional dosages were tested to determine the dose-dependent relationship between the polyphenol content of PRSE added to sucrose and its glycemic response. The two additional dosages were Sample 2, a sugar sample with 19 mg/100 g polyphenol and Sample 3, a sugar sample with 32 mg/100 g polyphenols. Similar to the initial trial, there was a steady increase in the average glucose measurement of the participants in the first thirty minutes of the test session after the consumption of the reference food and the two test foods. The highest average glucose measurement of the reference food was recorded at t = 30 min with a value of 8.8 mmol/L, translated to 2.8 mmol/L as the change in the plasma glucose concentration. The two-hour postprandial glucose measurements for this trial are summarized according to Table S2 of the Supplementary material. Figure 2 shows an observed decrease in the measurement at t = 45 mins, which continued until t = 120 min.
Samples 2 and 3 showed similar trends in both average glucose measurement and the change in the plasma glucose measurements; both samples showed a steady increase and peaked at t = 30 min after consuming the test food. After this, there was a slow decrease in the average glucose measurement, which came back to baseline after t = 60 min. The two test foods involved in the trial extension are significantly lower than the reference food. Sample 2 provided an AUC of 141.8, which is significantly lower (p = 0.03) than the AUC of the reference food (AUC = 195.4). Similarly, the PRSE-coated sugar sample with 32 mg/100 g polyphenol, Sample 3, also provided a statistically significant lower AUC value (AUC = 112.8, p = 0.04) than the reference food. In calculating the % reduction of samples 2 and 3 based on the AUC value of the reference food, sample 2 showed a 27.4% reduction, and sample 3 showed a 42.3% reduction. Considering the amount of polyphenol content of the sugar test food samples, it’s worth noting that there is a dose dependency decrease in the calculated AUC of the postprandial glucose measurements of the participants as the polyphenol content of the sugar increases.
2.3. Glycemic Index
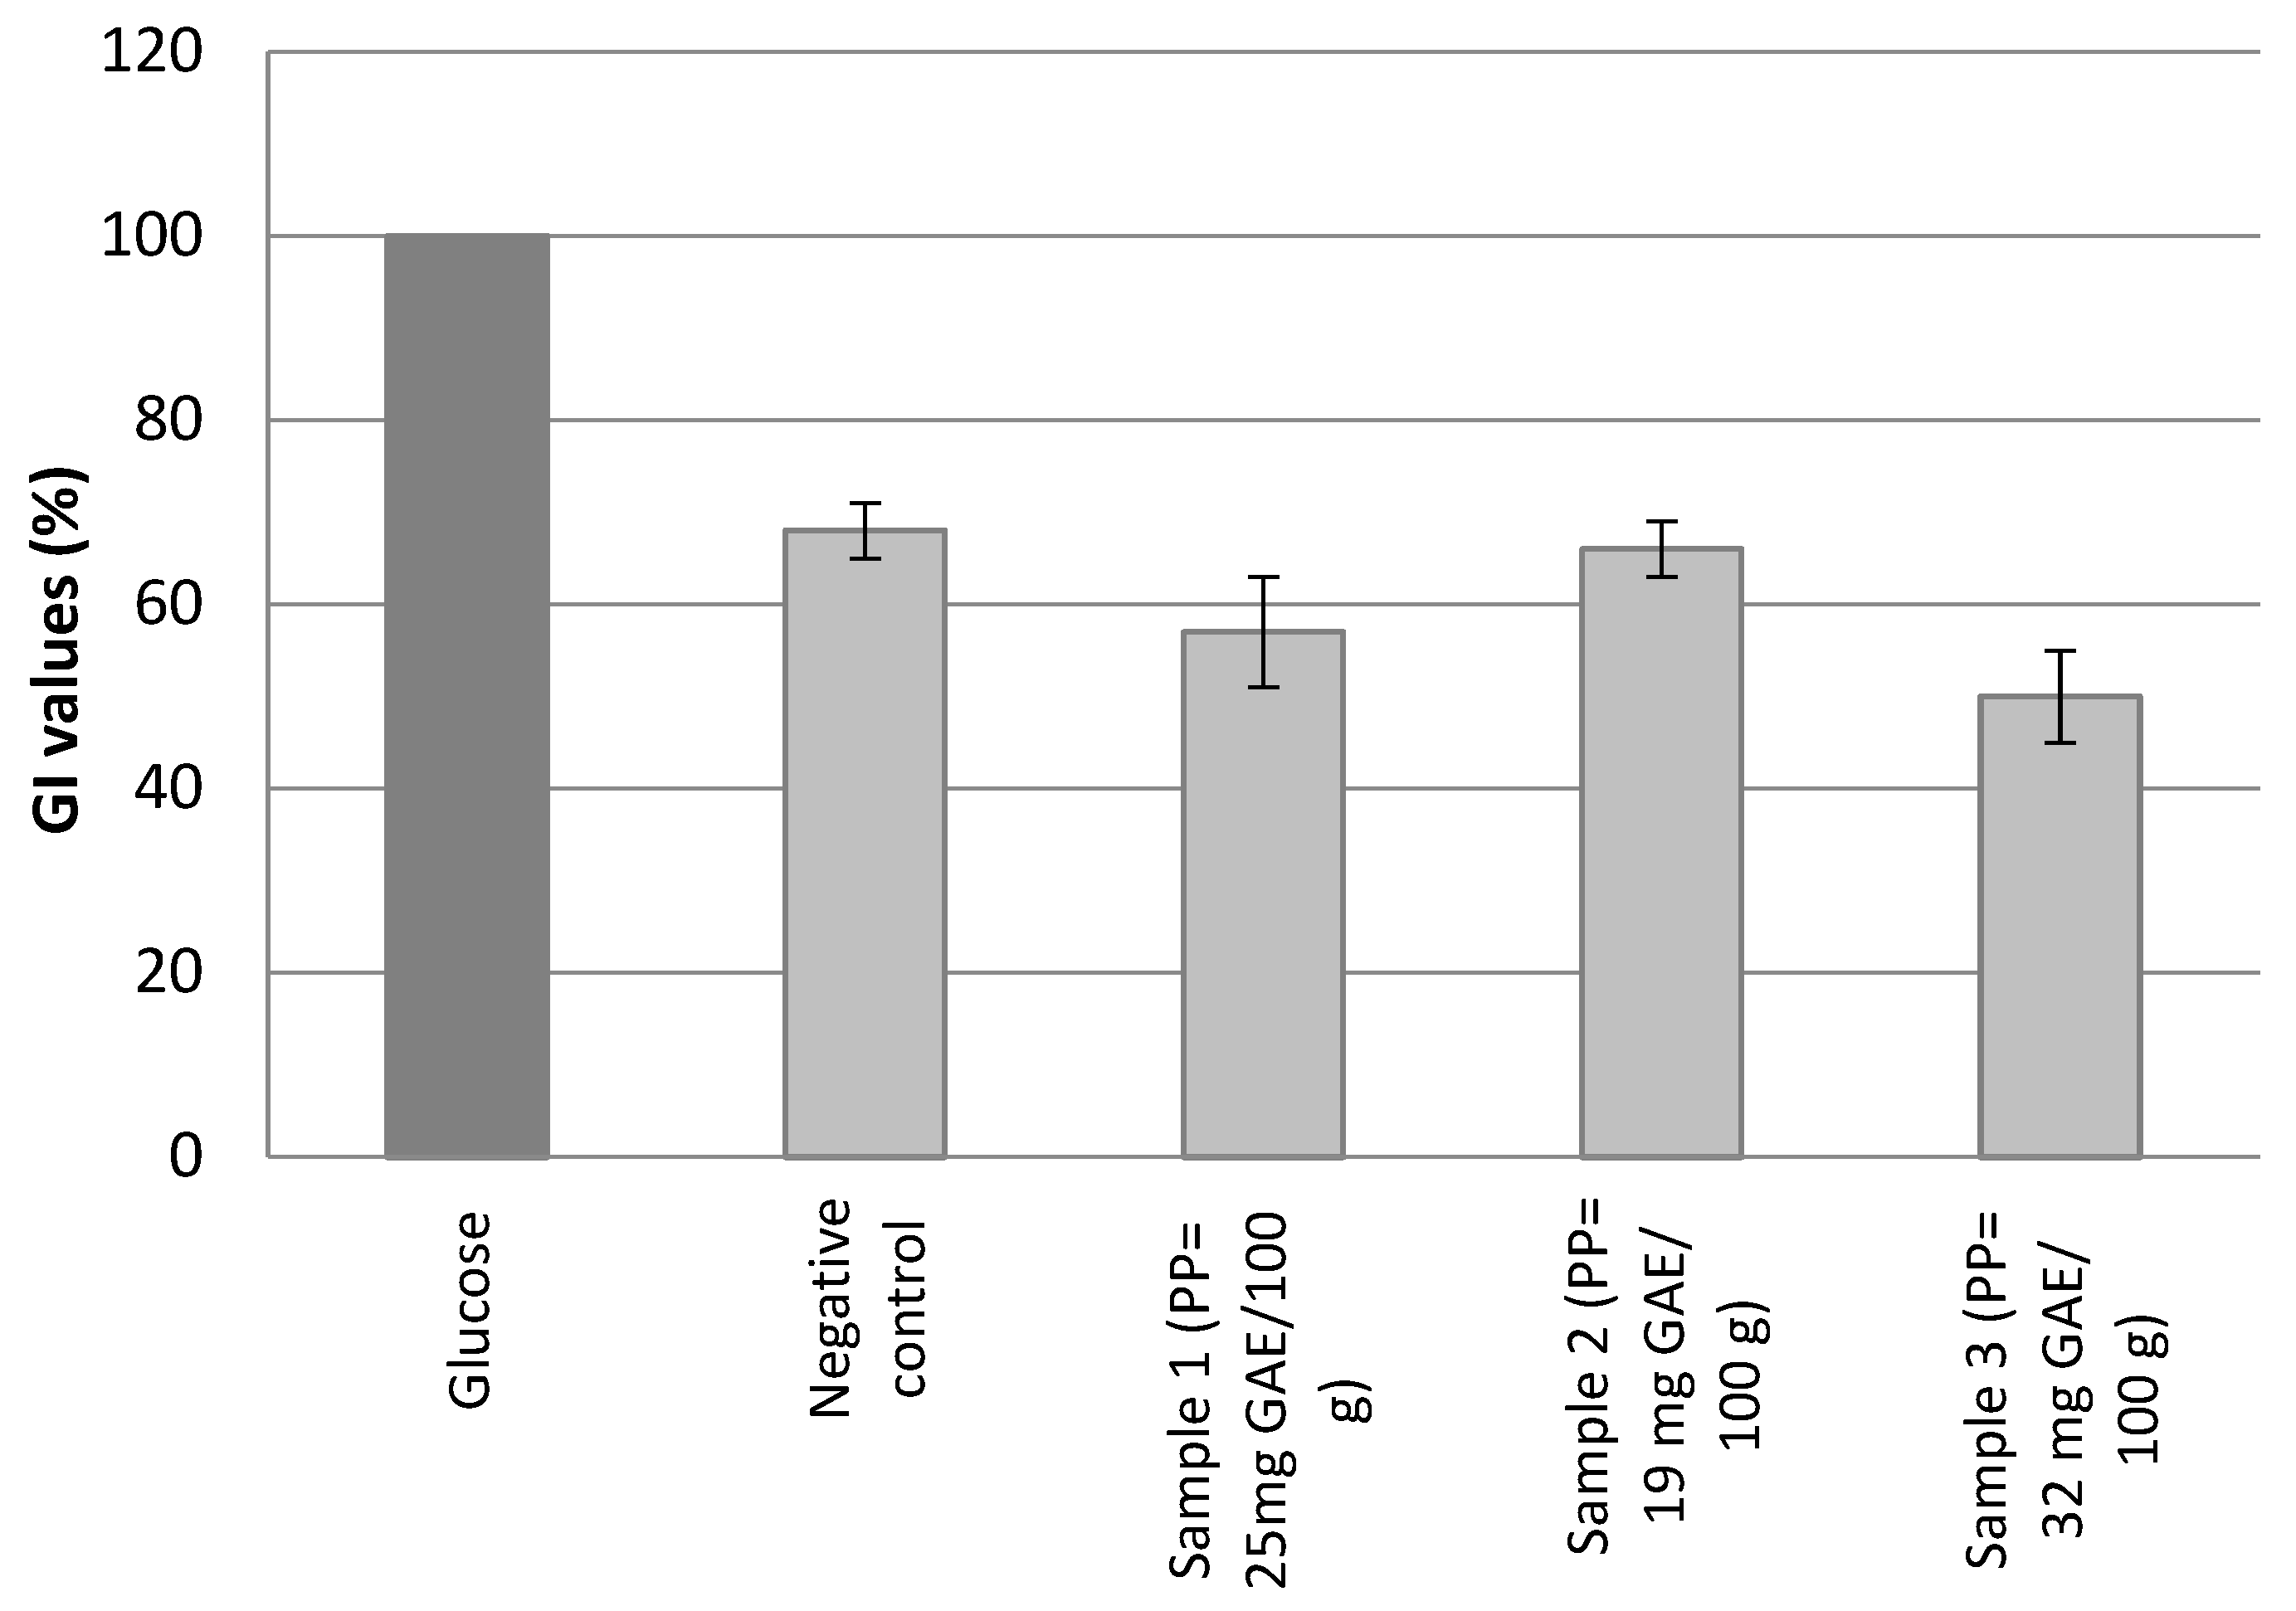
Table 1 outlines the GI value of the four samples tested. The glycemic index of the four test foods is statistically significant compared to the GI of the glucose/reference food (assigned a GI value of 100): negative control (68.3 ± 8.2, p = 0.003), Sample 1 (57.2 ± 5.6, p = 0.002), Sample 2 (65.0 ± 7.2, p = 0.02) and Sample 3 (51.2 ± 7.3, p = 0.001).
In the first set of trials, adding PRSE to sucrose (Sample 1) decreased the GI value from 68.3 ± 8.2 to 57.15 ± 5.6. Further increasing the polyphenol level of the sugar sample from 25 mg/100 g GAE to 32 mg/100 g GAE reduced the observed GI value to 51.2 ± 7.3. Figure 3 shows the graphical comparison of the GI values obtained for various test foods of this study with glucose as the reference food which has an assigned GI value of 100.
3. Discussion
3.1. Postprandial Glucose Measurement of Sugar Samples
One of the limitations of this study is that the AUCs of the three test food samples couldn’t be compared to each other since there are two different study groups involved. However, the AUCs of the test foods are always compared to the AUC of the reference food in the trial. It is observed that the AUCs of the test samples that contain PRSE lowered the postprandial glucose responses of the study group. This is not the first study that recorded the lowering effect of polyphenol on postprandial glucose measurements. In a series of studies by Törrönen, berries rich in polyphenols decreased the postprandial glucose response of sucrose [49,50] and carbohydrate-rich foods [51]. Johnston et al. showed that the phenolics found in apple juice significantly reduced the plasma glucose concentrations at t = 15 and 30 min time point measurement [52].
Few studies have explored the hyperglycemic application of the polyphenols found in different by-products of sugar processing. A published article has shown that the total phenolic and antioxidant content of the sugar by-products increases with the downstream process applications [53]. Molasses is the most commonly explored sugar refining by-product due to its high content of bioactive compounds [53,54]. Kong et al. investigated the enzyme inhibition activities of concentrated molasses extract against α-glucosidase and α–amylase. The group reported inhibitory activities of 4.693 mg/mL (Km = 1.099 mL/mg) and 4.254 mg/mL (Km = 0.238 mL/mg) for α-glucosidase and α–amylase, respectively [55]. In the same study, the group concluded that the phenolic extracts exhibited a non-competitive inhibition for both α-glucosidase and α–amylase [55]. The observed inhibitory activity against α-glucosidase and α–amylase can be attributed to the unique combination of wide varieties and sub-varieties of sugarcane polyphenols, as stated in published reports. Cinnamic acid and hydroxycinnamic acid derivatives were found to be potent inhibitors based on the molecular docking experiments by Malunga et al.
It was suggested that the inhibitory activity of sugarcane by-products is possibly dependent on the number of the hydroxyl and methoxy constituent attached to the phenyl ring of the molecule [56]. Among this long list of compounds are cinnamic acid derivatives, such as p-coumaric and ferulic acid. The two previously mentioned compounds are the most cited due to their abundance and potential hypoglycemic applications [56,57,58]. The hypoglycemic activity of cinnamic acid derivatives was attributed to its capability to bind to both the active and allosteric sites of the enzyme [59,60,61]. These findings coincide with the reported results of two other research groups, citing that the number of available methoxy groups in flavonoids influences the inhibitory activity of the molecule due to its binding capacity to the enzyme [59,62,63]. Other compounds identified and correlated to a medium inhibitory activity are apigenin, vitexin, isovitexin, luteolin, orientin, and isoorientin. The activity recorded for the C-glycosylflavone compounds mentioned is 19–60%, with luteolin showing the highest activity [62]. Research has shown that PRSE contains a mixture of both the cinnamic acid derivatives and C-glycosylflavone groups, both of which have been proven to exhibit hypoglycemic properties. Aside from cinnamic acid derivatives and C-glycosylflavone groups, seven apigenin-C-glycosides, three methoxyuteolin-C-glycosides and three tricin-O-glycosides [47] were identified that have a potential antidiabetic properties [45,64,65,66].
In another study, another possible mechanism of action of PRSE polyphenols on glucose absorption was investigated. It was shown that both sugarcane extracts inhibit intestinal glucose uptake with both facilitated and active glucose transport pathways [45]. The published reports suggest that the polyphenols found in PRSE intervene in the combination of the three pathways in glucose absorption.
Increasing evidence reveals that oxidative stress is vital in developing vascular complications in Type 2 diabetes [67,68,69]. In recent years, polyphenols have gained significant interest from the scientific and medical community because of their potential applications in managing oxidative stress due to their antioxidant activity [70,71,72]. Research suggests that polyphenols owe their strong antioxidant power to their molecular structure. The configuration and number of hydroxyl groups that can react with radicals strongly dictate the antioxidant power of polyphenols [72]. Zheng et al. analysed the different alcoholic extracts in sugarcane bagasse. They reported a positive correlation between the molecular structure of the different polyphenols and their antioxidant properties and antihyperglycemic activities [73]. The combination of the high antioxidant power and a mixture of a wide variety of polyphenols in PRSE is potentially assisting in lowering the postprandial glucose measurement observed in this study.
3.2. Glycemic Index
The linear and inversed correlation between the polyphenol content of the food and the resulting GI was observed in a study by Xu et al. Their group investigated the postprandial glucose levels of various fruits and correlated them to their polyphenol content [74]. The dose-dependency GI reduction action of polyphenols from sugarcane was also noted in a previously published report. Wright et al. investigated the postprandial glucose-lowering effects of the addition of various amounts of PRSE to different test foods. The study reported a linear relationship between glycemic index reduction and the amount of added PRSE in different test foods. It was also observed that the lowering effect of PRSE added is independent of the carbohydrate and fiber type in the test food [46]. Similar findings were observed when PRSE was consumed as a supplement before a standardized meal. In this study, participants were asked to take various amounts of PRSE mixed with water before consumption of a standardized meal. There was a significant increase at t = 15 min for the two highest dosages of PRSE tested. This suggests that PRSE polyphenols do not extensively participate in enzyme inhibition but in the glucose transport system pathway [48].
Statistical analyses of the GI values exhibited by the samples revealed that the observed difference between the GI values of Samples 1 and 2 was not statistically significant (paired t-test, t = 1.172, p > 0.05). Similarly, the sample which contains the highest amount of polyphenol that demonstrated the lowest GI value (51.19 ± 7.3) did not show a significant difference when compared with the sample that has the lowest polyphenol content (Sample 3, paired t-test, t = 1.63, p > 0.05). The results of Pearson correlation analysis showed a negative correlation between the glycemic index and polyphenol content of the samples, although this was not significant at p value = 0.05 (r = −0.9, p > 0.05).
4. Materials and Methods
4.1. Preparation of PRSE
A PRSE sample was developed and prepared according to a novel methodology by The Product Makers Pty Ltd. that uses an aqueous filtration process from unrefined sugarcane molasses described in previous literature [46,48]. Briefly, the sugarcane molasses was diluted to 20 °Brix with distilled water. °Brix measures the grams of soluble solids per 100 g of solution. One degree °Brix represents 1 g of sucrose in 100 g of solution. 100 mL of 20 °Brix sugarcane extract was filtered using a 30 kDa filter and was subsequently concentrated at 45 °C to reach a final °Brix of 70. The laboratory batch of the sugar samples with varying polyphenol levels was prepared by mixing the 70 °Brix PRSE sample with commercially available white sugar.
The commercial sample used in this study was manufactured using a blend of sugarcane (Saccharum officinarum) molasses sourced in various sugarcane refineries in the Burdekin region of Queensland, Australia. All mentioned preparation and polyphenol testing described in Section 4.2 were completed in the manufacturing site of The Product Makers.
4.2. Determination of the Polyphenol Content in the PRSE
The total polyphenol content of the sugar samples was calculated using the Folin Ciocalteu colorimetric method with gallic acid as a reference standard, as described by Kim et al. [75]. All the chemicals were purchased from Sigma Aldrich (St. Louis, MO, USA) unless otherwise stated. Briefly, 5 g of the sugar sample was dissolved in 10 mL distilled water to give a total volume of 13 mL. A 0.2 mL aliquot of the sample was made up to 2 mL with distilled water and vortexed for 5 s. Folin-Ciocalteu Reagent (0.2 mL) was then added to the sample and mixed thoroughly for 5 s. Subsequently, 2 mL of 7% sodium carbonate was added, followed by 0.8 mL of distilled water. The solution was vortexed for 5 s and was allowed to stand at room temperature for 90 min for color development. Samples were analysed in one replicate. The standard curve for the total polyphenols was made using gallic acid standard solution (40–200 mg/L) under the same procedure as above. The blank reagent using deionized water was prepared. 0.2 mL of Folin-Ciocalteu reagent was added to the mixture and was vortexed for 5 s. After which, 2 mL of 7% sodium carbonate, followed by 0.8 mL of distilled water, was added to the solution. The resulting solution was vortexed for 5 seconds, and the absorbance was read against the prepared blank after 90 min. The absorbance was measured at 750 nm on a Varian Cary® 50 UV-Vis Spectrophotometer. Total polyphenol content was expressed in mg of gallic acid equivalents (GAE) per 100 g of the sugar sample.
4.3. Determination of Glycemic Index
The methodology and procedure used in this study are according to the internationally recognized GI methodology [76] and in accordance with the international standards for conducting ethical research with humans. It has approval from the Human Research Ethics Committee of Sydney University, ethics approval number 08-2005/7958.
4.4. Test Subjects
This study was separated into two parts, and a separate group of participants was recruited for each part. Two groups of healthy, non-smoking people between the ages of 18–45 years were recruited from the student and staff population of the University of Sydney. Exclusion criteria included those who were overweight or underweight (BMI values between 18–25.0 kg/m2), were dieting, had impaired glucose tolerance, were suffering from any illness or food allergy, or were regularly taking medications other than standard contraceptive medication.
The first group of participants has an average age of 26.0 years (range 22.0–39.7 years) and an average body mass index (BMI) score of 23.2 kg/m2. For the second group, the average age of the participants was 25.8 years and an average BMI value of 22.8 kg/m2.
4.5. Test Foods
Fixed portions of reference food and sugar samples were served to the participants containing 50 g of digestible or available carbohydrates. The reference food, glucose sugar (Glucodin® powder, Boots Health Care Company, North Ryde, NSW, Australia), was prepared a day before the test by dissolving 51.4 g in 250 g of warm water in a heatproof glass. The glucose solution was stored in a fridge, covered in an airtight plastic wrap. On the morning of the test day, the reference food was served to the participants together with 250 g of water.
The sugar test samples were prepared a day before the test by dissolving the pre-weighed portions in 250 g of warm water, covered with airtight plastic wrap, labeled and stored in the fridge overnight. On the morning of the test day, the portions of the sugar samples were served to the participants with 250 g of water.
4.6. Measurement of Plasma Glucose Concentrations and GI Values
Duplicate readings of the glucose concentration in the plasma samples of the participants were obtained using a glucose hexokinase enzymatic assay (Roche Diagnostic Systems, Sydney, Australia) and an automatic centrifugal spectrophotometric analyser (Roche/Hitachi 912®, Boehringer Manheim Gmbh, Mannheim, Germany) with internal controls. A two-hour blood response curve was constructed for each test session using the average plasma glucose concentrations for each of the participants’ eight blood samples. The average of the two fasting glucose measurements was considered and served as the baseline glucose concentration for the blood response curve of each participant. The total increase in the plasma glucose concentration after the consumption of the reference or the test food was calculated based on the area under the curve (AUC) of the blood response curve. The glycemic index value for each test food was calculated according to Equation (1) below.
Comparing the AUC values of the test foods and the reference food reduces the variation between the participants’ blood glucose results to the same food arising from natural differences due to the body weight and metabolism, blood glucose responses to the same food.
4.7. Statistical Analysis
Statistical analysis was performed using Analysis ToolPak in-built function in Microsoft Excel. The paired student t-test was used to compare the mean of the IAUC of the standard food with each of the test foods. Statistical significance was set at p < 0.05.
4.8. Experimental Procedure
The testing procedure was conducted in accordance with the recommendations given in the International Organization for Standardization article [77,78]. The methodology involves feeding the healthy test participants a food portion containing 50 g of available carbohydrates after fasting for 10–12 h overnight. Fasting blood glucose samples were taken, followed by the consumption of the reference food/product. Glucose levels were measured at regular intervals (15, 30, 45, 60, 90 and 120 min) during the two hours. Three separate glucose tolerance tests were conducted on different occasions, wherein the participants were asked to consume 50 g of glucose in water. A similar procedure was repeated in the same group of participants on another day after consuming a reference food portion containing an equal amount of available carbohydrates.
Both cohorts of participants consumed the reference food on three separate occasions, and each of the two test sugar samples was consumed on only one occasion. Each participant in the first cohort has completed five separate test sessions.
The participants were advised to avoid alcohol, unusual food intake, and strenuous physical activity the day before any test session. In addition, on the night before each session, the participants had an evening meal based on carbohydrate-rich food and then fasted for at least 10 h.
On the day of the test session, the investigators checked that the participants were well and had complied with the preceding experimental conditions. The participants were asked to warm a hand in hot water for one minute, after which two fasting blood samples were obtained by finger prick using an automatic, non-reusable lancet device (Safe-T-Pro®, Boehringer Manheim Gmbh, Germany) and the reference food or test food was given immediately afterwards which was consumed with 250 g of water within 12 Further Glucose measurements were obtained in time intervals; t = 15, 30, 45, 90 and 120 min. A total of eight blood samples were collected from each participant. The participants were advised to remain seated; only minimal movements were allowed.
Blood sample was centrifuged for 30 seconds immediately after collection. The plasma layer of the samples was then collected and kept in the freezer until the glucose concentration was analysed.
5. Conclusions
In conclusion, the present study’s findings raise the possibility that the addition of PRSE to sucrose could help suppress postprandial blood glucose levels at 19–32 mg/100 g polyphenols. The correlation of the GI values and the polyphenol content of the test foods suggest a pattern of a classical dose response effect of the PRSE in the body. However, the dose-response results should be further investigated as this study has a trial design limitation because the results are from two different sets of participants. Overall, the findings presented in this paper suggest that the addition of polyphenols can be a beneficial strategy to lower postprandial glycemia to higher GI sugars, such as sucrose.
Supplementary Materials
The following supporting information can be downloaded at: https://www.mdpi.com/article/10.3390/biologics3040016/s1, Table S1: Summary of the average glucose measurements and change in the plasma glucose (mmol/L) of the reference food and two test foods of Part A. Test foods for Part A are negative control = zero polyphenols, and sugar sample 1 = 25 mg/100 g polyphenols. Table S2: Summary of the average glucose measurements and change in the plasma glucose (mmol/L) of the reference food and two test foods of Part B. Test foods for Part A are sugar sample 2 = 19 mg/100 g polyphenols, and sugar sample 3 = 32 mg/100 g polyphenols.
Author Contributions
Statistical analysis, K.F.L.; writing—original draft preparation, K.F.L.; writing—review and editing, M.F. and J.N. All authors have read and agreed to the published version of the manuscript.
Funding
This research was fully funded by The Product Makers, Pty, Ltd.
Institutional Review Board Statement
All subjects gave their informed consent for inclusion before they participated in the study. The study was conducted in accordance with the Declaration of Helsinki, and the protocol was approved by the Human Research Ethics Committee of Sydney University, ethics approval number 08-2005/7958.
Informed Consent Statement
Informed consent was obtained from all subjects involved in the study.
Data Availability Statement
The data presented in this study are available in Supplementary materials.
Acknowledgments
The authors would like to thank Sydney University’s Glycemic Index Research Service (SUGiRS) for conducting the trials under the supervision of Jennie Brand-Miller and Fiona Atkinson. Lastly, thank you to Roya Afshari for assisting in reviewing the manuscript and the statistical analysis of the glycemic indices.
Conflicts of Interest
This research is sponsored by The Product Makers Pty Ltd. (50–60 Popes Road, Keysborough, VIC, Australia) and may lead to the development of products which may be licensed to the mentioned company, in which the authors have a business and/or financial interest. Mathew Flavel, Julian Neoh and Kosta Fremielle Lim are all employees of The Product Makers. The authors have disclosed those interests fully to MDPI.
References
- Sharma, M.; Nazareth, I.; Petersen, I. Trends in Incidence, Prevalence and Prescribing in Type 2 Diabetes Mellitus between 2000 and 2013 in Primary Care: A Retrospective Cohort Study. BMJ Open 2016, 6, e010210. [Google Scholar] [CrossRef] [PubMed]
- Zghebi, S.S.; Steinke, D.T.; Carr, M.J.; Rutter, M.K.; Emsley, R.A.; Ashcroft, D.M. Examining Trends in Type 2 Diabetes Incidence, Prevalence and Mortality in the UK between 2004 and 2014. Diabetes Obes. Metab. 2017, 19, 1537–1545. [Google Scholar] [CrossRef] [PubMed]
- Hermansen, M.L.; Eriksen, N.M.; Mortensen, L.S.; Holm, L.; Hermansen, K. Can the Glycemic Index (GI) Be Used as a Tool in the Prevention and Management of Type 2 Diabetes? Rev. Diabet. Stud. 2006, 3, 61–71. [Google Scholar] [CrossRef] [PubMed]
- National Collaborating Centre for Chronic Conditions. Type 2 Diabetes: National Clinical Guideline for Management in Primary and Secondary Care (Update); Royal College of Physicians: London, UK, 2008. [Google Scholar]
- Stanhope, K.L. Sugar Consumption, Metabolic Disease and Obesity: The State of the Controversy. Crit. Rev. Clin. Lab. Sci. 2016, 53, 52–67. [Google Scholar] [CrossRef]
- Brand-Miller, J.C.; Stockmann, K.; Atkinson, F.; Petocz, P.; Denyer, G. Glycemic Index, Postprandial Glycemia, and the Shape of the Curve in Healthy Subjects: Analysis of a Database of More than 1000 Foods. Am. J. Clin. Nutr. 2009, 89, 97–105. [Google Scholar] [CrossRef]
- Augustin, L.S.A.; Kendall, C.W.C.; Jenkins, D.J.A.; Willett, W.C.; Astrup, A.; Barclay, A.W.; Björck, I.; Brand-Miller, J.C.; Brighenti, F.; Buyken, A.E.; et al. Glycemic Index, Glycemic Load and Glycemic Response: An International Scientific Consensus Summit from the International Carbohydrate Quality Consortium (ICQC). Nutr. Metab. Cardiovasc. Dis. 2015, 25, 795–815. [Google Scholar] [CrossRef]
- D’Archivio, M.; Santangelo, C.; Scazzocchio, B.; Varì, R.; Filesi, C.; Masella, R.; Giovannini, C. Modulatory Effects of Polyphenols on Apoptosis Induction: Relevance for Cancer Prevention. Int. J. Mol. Sci. 2008, 9, 213–228. [Google Scholar] [CrossRef]
- Guo, W.; Kong, E.; Meydani, M. Dietary Polyphenols, Inflammation, and Cancer. Nutr. Cancer 2009, 61, 807–810. [Google Scholar] [CrossRef]
- Kampa, M.; Nifli, A.-P.; Notas, G.; Castanas, E. Polyphenols and Cancer Cell Growth. In Reviews of Physiology, Biochemistry and Pharmacology; Amara, S.G., Bamberg, E., Fleischmann, B., Gudermann, T., Hebert, S.C., Jahn, R., Lederer, W.J., Lill, R., Miyajima, A., Offermanns, S., et al., Eds.; Springer: Berlin/Heidelberg, Germany, 2007; pp. 79–113. ISBN 978-3-540-73800-8. [Google Scholar]
- Stoner, G.D.; Mukhtar, H. Polyphenols as Cancer Chemopreventive Agents. J. Cell. Biochem. 1995, 59, 169–180. [Google Scholar] [CrossRef]
- Khan, N.; Afaq, F.; Saleem, M.; Ahmad, N.; Mukhtar, H. Targeting Multiple Signaling Pathways by Green Tea Polyphenol (−)-Epigallocatechin-3-Gallate. Cancer Res. 2006, 66, 2500–2505. [Google Scholar] [CrossRef]
- Corona, G.; Deiana, M.; Incani, A.; Vauzour, D.; Assunta Dessì, M.; Spencer, J.P.E. Inhibition of P38/CREB Phosphorylation and COX-2 Expression by Olive Oil Polyphenols Underlies Their Anti-Proliferative Effects. Biochem. Biophys. Res. Commun. 2007, 362, 606–611. [Google Scholar] [CrossRef]
- Hooper, L.; Kroon, P.A.; Rimm, E.B.; Cohn, J.S.; Harvey, I.; Le Cornu, K.A.; Ryder, J.J.; Hall, W.L.; Cassidy, A. Flavonoids, Flavonoid-Rich Foods, and Cardiovascular Risk: A Meta-Analysis of Randomized Controlled Trials. Am. J. Clin. Nutr. 2008, 88, 38–50. [Google Scholar] [CrossRef] [PubMed]
- Desch, S.; Schmidt, J.; Kobler, D.; Sonnabend, M.; Eitel, I.; Sareban, M.; Rahimi, K.; Schuler, G.; Thiele, H. Effect of Cocoa Products on Blood Pressure: Systematic Review and Meta-Analysis. Am. J. Hypertens. 2010, 23, 97–103. [Google Scholar] [CrossRef] [PubMed]
- Erlund, I.; Koli, R.; Alfthan, G.; Marniemi, J.; Puukka, P.J.; Mustonen, P.; Mattila, P.H.; Jula, A.M. Favorable Effects of Berry Consumption on Platelet Function, Blood Pressure, and HDL Cholesterol. Am. J. Clin. Nutr. 2008, 87, 323–331. [Google Scholar] [CrossRef] [PubMed]
- Osman, H.E.; Maalej, N.; Shanmuganayagam, D.; Folts, J.D. Grape Juice but Not Orange or Grapefruit Juice Inhibits Platelet Activity in Dogs and Monkeys (Macaca Fasciularis)1,2. J. Nutr. 1998, 128, 2307–2312. [Google Scholar] [CrossRef]
- Youdim, K.A.; Joseph, J.A. A Possible Emerging Role of Phytochemicals in Improving Age-Related Neurological Dysfunctions: A Multiplicity of Effects. Free Radic. Biol. Med. 2001, 30, 583–594. [Google Scholar] [CrossRef]
- Spencer, J.P.E. Food for Thought: The Role of Dietary Flavonoids in Enhancing Human Memory, Learning and Neuro-Cognitive Performance: Symposium on ‘Diet and Mental Health’. Proc. Nutr. Soc. 2008, 67, 238–252. [Google Scholar] [CrossRef]
- Rendeiro, C.; Spencer, J.P.E.; Vauzour, D.; Butler, L.T.; Ellis, J.A.; Williams, C.M. The Impact of Flavonoids on Spatial Memory in Rodents: From Behaviour to Underlying Hippocampal Mechanisms. Genes Nutr. 2009, 4, 251–270. [Google Scholar] [CrossRef]
- Vauzour, D.; Vafeiadou, K.; Rice-Evans, C.; Williams, R.J.; Spencer, J.P.E. Activation of Pro-Survival Akt and ERK1/2 Signalling Pathways Underlie the Anti-Apoptotic Effects of Flavanones in Cortical Neurons. J. Neurochem. 2007, 103, 1355–1367. [Google Scholar] [CrossRef]
- Rizvi, S.I.; Zaid, M.A. Insulin-Like Effect of (–)Epicatechin on Erythrocyte Membrane Acetylcholinesterase Activity in Type 2 Diabetes Mellitus. Clin. Exp. Pharmacol. Physiol. 2001, 28, 776–778. [Google Scholar] [CrossRef]
- Matsui, T.; Ebuchi, S.; Kobayashi, M.; Fukui, K.; Sugita, K.; Terahara, N.; Matsumoto, K. Anti-Hyperglycemic Effect of Diacylated Anthocyanin Derived from Ipomoea Batatas Cultivar Ayamurasaki Can Be Achieved through the α-Glucosidase Inhibitory Action. J. Agric. Food Chem. 2002, 50, 7244–7248. [Google Scholar] [CrossRef] [PubMed]
- Kim, Y.; Keogh, J.B.; Clifton, P.M. Polyphenols and Glycemic Control. Nutrients 2016, 8, 17. [Google Scholar] [CrossRef]
- Calderón-Pérez, L.; Llauradó, E.; Companys, J.; Pla-Pagà, L.; Pedret, A.; Rubió, L.; Gosalbes, M.J.; Yuste, S.; Solà, R.; Valls, R.M. Interplay between Dietary Phenolic Compound Intake and the Human Gut Microbiome in Hypertension: A Cross-Sectional Study. Food Chem. 2021, 344, 128567. [Google Scholar] [CrossRef] [PubMed]
- Cassidy, A.; Minihane, A.-M. The Role of Metabolism (and the Microbiome) in Defining the Clinical Efficacy of Dietary Flavonoids1. Am. J. Clin. Nutr. 2017, 105, 10–22. [Google Scholar] [CrossRef]
- Asgary, S.; Karimi, R.; Momtaz, S.; Naseri, R.; Farzaei, M.H. Effect of Resveratrol on Metabolic Syndrome Components: A Systematic Review and Meta-Analysis. Rev. Endocr. Metab. Disord. 2019, 20, 173–186. [Google Scholar] [CrossRef] [PubMed]
- Hanamura, T.; Mayama, C.; Aoki, H.; Hirayama, Y.; Shimizu, M. Antihyperglycemic Effect of Polyphenols from Acerola (Malpighia emarginata DC.) Fruit. Biosci. Biotechnol. Biochem. 2006, 70, 1813–1820. [Google Scholar] [CrossRef]
- Matsui, T.; Tanaka, T.; Tamura, S.; Toshima, A.; Tamaya, K.; Miyata, Y.; Tanaka, K.; Matsumoto, K. α-Glucosidase Inhibitory Profile of Catechins and Theaflavins. J. Agric. Food Chem. 2007, 55, 99–105. [Google Scholar] [CrossRef]
- Song, Y.; Manson, J.E.; Buring, J.E.; Sesso, H.D.; Liu, S. Associations of Dietary Flavonoids with Risk of Type 2 Diabetes, and Markers of Insulin Resistance and Systemic Inflammation in Women: A Prospective Study and Cross-Sectional Analysis. J. Am. Coll. Nutr. 2005, 24, 376–384. [Google Scholar] [CrossRef]
- Chen, W.-P.; Chi, T.-C.; Chuang, L.-M.; Su, M.-J. Resveratrol Enhances Insulin Secretion by Blocking KATP and KV Channels of Beta Cells. Eur. J. Pharmacol. 2007, 568, 269–277. [Google Scholar] [CrossRef]
- Rizvi, S.I.; Mishra, N. Anti-Oxidant Effect of Quercetin on Type 2 Diabetic Erythrocytes. J. Food Biochem. 2009, 33, 404–415. [Google Scholar] [CrossRef]
- McDougall, G.J.; Shpiro, F.; Dobson, P.; Smith, P.; Blake, A.; Stewart, D. Different Polyphenolic Components of Soft Fruits Inhibit α-Amylase and α-Glucosidase. J. Agric. Food Chem. 2005, 53, 2760–2766. [Google Scholar] [CrossRef]
- Ademiluyi, A.O.; Oboh, G. Phenolic-Rich Extracts from Selected Tropical Underutilized Legumes Inhibit α-Amylase, α-Glucosidase, and Angiotensin I Converting Enzyme in Vitro. J. Basic Clin. Physiol. Pharmacol. 2012, 23, 17–25. [Google Scholar] [CrossRef]
- Ademiluyi, A.O.; Oboh, G. Soybean Phenolic-Rich Extracts Inhibit Key-Enzymes Linked to Type 2 Diabetes (α-Amylase and α-Glucosidase) and Hypertension (Angiotensin I Converting Enzyme) in Vitro. Exp. Toxicol. Pathol. 2013, 65, 305–309. [Google Scholar] [CrossRef]
- Koh, L.W.; Wong, L.L.; Loo, Y.Y.; Kasapis, S.; Huang, D. Evaluation of Different Teas against Starch Digestibility by Mammalian Glycosidases. J. Agric. Food Chem. 2010, 58, 148–154. [Google Scholar] [CrossRef] [PubMed]
- Hara, Y.; Honda, M. The Inhibition of α-Amylase by Tea Polyphenols. Agric. Biol. Chem. 1990, 54, 1939–1945. [Google Scholar] [CrossRef]
- Kwon, Y.-I.; Apostolidis, E.; Kim, Y.-C.; Shetty, K. Health Benefits of Traditional Corn, Beans, and Pumpkin: In Vitro Studies for Hyperglycemia and Hypertension Management. J. Med. Food 2007, 10, 266–275. [Google Scholar] [CrossRef] [PubMed]
- Kwon, Y.-I.; Apostolidis, E.; Shetty, K. In Vitro Studies of Eggplant (Solanum melongena) Phenolics as Inhibitors of Key Enzymes Relevant for Type 2 Diabetes and Hypertension. Bioresour. Technol. 2008, 99, 2981–2988. [Google Scholar] [CrossRef]
- Cermak, R.; Landgraf, S.; Wolffram, S. Quercetin Glucosides Inhibit Glucose Uptake into Brush-Border-Membrane Vesicles of Porcine Jejunum. Br. J. Nutr. 2004, 91, 849–855. [Google Scholar] [CrossRef]
- Johnston, K.; Sharp, P.; Clifford, M.; Morgan, L. Dietary Polyphenols Decrease Glucose Uptake by Human Intestinal Caco-2 Cells. FEBS Lett. 2005, 579, 1653–1657. [Google Scholar] [CrossRef]
- Manzano, S.; Williamson, G. Polyphenols and Phenolic Acids from Strawberry and Apple Decrease Glucose Uptake and Transport by Human Intestinal Caco-2 Cells. Mol. Nutr. Food Res. 2010, 54, 1773–1780. [Google Scholar] [CrossRef]
- Jenkins, D.J.A.; Kendall, C.W.C.; Augustin, L.S.A.; Mitchell, S.; Sahye-Pudaruth, S.; Blanco Mejia, S.; Chiavaroli, L.; Mirrahimi, A.; Ireland, C.; Bashyam, B.; et al. Effect of Legumes as Part of a Low Glycemic Index Diet on Glycemic Control and Cardiovascular Risk Factors in Type 2 Diabetes Mellitus: A Randomized Controlled Trial. Arch. Intern. Med. 2012, 172, 1653–1660. [Google Scholar] [CrossRef]
- Larsen, T.M.; Dalskov, S.-M.; van Baak, M.; Jebb, S.A.; Papadaki, A.; Pfeiffer, A.F.H.; Martinez, J.A.; Handjieva-Darlenska, T.; Kunešová, M.; Pihlsgård, M.; et al. Diets with High or Low Protein Content and Glycemic Index for Weight-Loss Maintenance. N. Engl. J. Med. 2010, 363, 2102–2113. [Google Scholar] [CrossRef] [PubMed]
- Ji, J.; Yang, X.; Flavel, M.; Shields, Z.P.-I.; Kitchen, B. Antioxidant and Anti-Diabetic Functions of a Polyphenol-Rich Sugarcane Extract. J. Am. Coll. Nutr. 2019, 38, 670–680. [Google Scholar] [CrossRef]
- Wright, A.G.; Ellis, T.P.; Ilag, L.L. Filtered Molasses Concentrate from Sugar Cane: Natural Functional Ingredient Effective in Lowering the Glycaemic Index and Insulin Response of High Carbohydrate Foods. Plant Foods Hum. Nutr. 2014, 69, 310–316. [Google Scholar] [CrossRef] [PubMed]
- Deseo, M.A.; Elkins, A.; Rochfort, S.; Kitchen, B. Antioxidant Activity and Polyphenol Composition of Sugarcane Molasses Extract. Food Chem. 2020, 314, 126180. [Google Scholar] [CrossRef]
- Ellis, T.P.; Wright, A.G.; Clifton, P.M.; Ilag, L.L. Postprandial Insulin and Glucose Levels Are Reduced in Healthy Subjects When a Standardised Breakfast Meal Is Supplemented with a Filtered Sugarcane Molasses Concentrate. Eur. J. Nutr. 2016, 55, 2365–2376. [Google Scholar] [CrossRef]
- Törrönen, R.; Sarkkinen, E.; Tapola, N.; Hautaniemi, E.; Kilpi, K.; Niskanen, L. Berries Modify the Postprandial Plasma Glucose Response to Sucrose in Healthy Subjects. Br. J. Nutr. 2010, 103, 1094–1097. [Google Scholar] [CrossRef] [PubMed]
- Törrönen, R.; Kolehmainen, M.; Sarkkinen, E.; Mykkänen, H.; Niskanen, L. Postprandial Glucose, Insulin, and Free Fatty Acid Responses to Sucrose Consumed with Blackcurrants and Lingonberries in Healthy Women. Am. J. Clin. Nutr. 2012, 96, 527–533. [Google Scholar] [CrossRef]
- Törrönen, R.; Kolehmainen, M.; Sarkkinen, E.; Poutanen, K.; Mykkänen, H.; Niskanen, L. Berries Reduce Postprandial Insulin Responses to Wheat and Rye Breads in Healthy Women. J. Nutr. 2013, 143, 430–436. [Google Scholar] [CrossRef]
- Johnston, K.L.; Clifford, M.N.; Morgan, L.M. Possible Role for Apple Juice Phenolic Compounds in the Acute Modification of Glucose Tolerance and Gastrointestinal Hormone Secretion in Humans. J. Sci. Food Agric. 2002, 82, 1800–1805. [Google Scholar] [CrossRef]
- Payet, B.; Shum Cheong Sing, A.; Smadja, J. Comparison of the Concentrations of Phenolic Constituents in Cane Sugar Manufacturing Products with Their Antioxidant Activities. J. Agric. Food Chem. 2006, 54, 7270–7276. [Google Scholar] [CrossRef] [PubMed]
- Molina-Cortés, A.; Sánchez-Motta, T.; Tobar-Tosse, F.; Quimbaya, M. Spectrophotometric Estimation of Total Phenolic Content and Antioxidant Capacity of Molasses and Vinasses Generated from the Sugarcane Industry. Waste Biomass Valorization 2020, 11, 3453–3463. [Google Scholar] [CrossRef]
- Kong, F.; Yu, S.; Zeng, F.; Wu, X. Phenolics Content and Inhibitory Effect of Sugarcane Molasses on α-Glucosidase and α-Amylase In Vitro. Sugar Tech 2016, 18, 333–339. [Google Scholar] [CrossRef]
- Malunga, L.N.; Joseph Thandapilly, S.; Ames, N. Cereal-Derived Phenolic Acids and Intestinal Alpha Glucosidase Activity Inhibition: Structural Activity Relationship. J. Food Biochem. 2018, 42, e12635. [Google Scholar] [CrossRef]
- Zhang, M.; Xu, Y.; Xiang, J.; Zheng, B.; Yuan, Y.; Luo, D.; Fan, J. Comparative Evaluation on Phenolic Profiles, Antioxidant Properties and α-Glucosidase Inhibitory Effects of Different Milling Fractions of Foxtail Millet. J. Cereal Sci. 2021, 99, 103217. [Google Scholar] [CrossRef]
- Adisakwattana, S.; Chantarasinlapin, P.; Thammarat, H.; Yibchok-Anun, S. A Series of Cinnamic Acid Derivatives and Their Inhibitory Activity on Intestinal α-Glucosidase. J. Enzyme Inhib. Med. Chem. 2009, 24, 1194–1200. [Google Scholar] [CrossRef]
- Di Stefano, E.; Oliviero, T.; Udenigwe, C.C. Functional Significance and Structure–Activity Relationship of Food-Derived α-Glucosidase Inhibitors. Food Microbiol. Funct. Foods Nutr. 2018, 20, 7–12. [Google Scholar] [CrossRef]
- Martinez-Gonzalez, A.I.; Díaz-Sánchez, Á.G.; de la Rosa, L.A.; Bustos-Jaimes, I.; Alvarez-Parrilla, E. Inhibition of α-Amylase by Flavonoids: Structure Activity Relationship (SAR). Spectrochim. Acta A Mol. Biomol. Spectrosc. 2019, 206, 437–447. [Google Scholar] [CrossRef]
- Zeng, L.; Zhang, G.; Lin, S.; Gong, D. Inhibitory Mechanism of Apigenin on α-Glucosidase and Synergy Analysis of Flavonoids. J. Agric. Food Chem. 2016, 64, 6939–6949. [Google Scholar] [CrossRef]
- Zhu, J.; Chen, C.; Zhang, B.; Huang, Q. The Inhibitory Effects of Flavonoids on α-Amylase and α-Glucosidase. Crit. Rev. Food Sci. Nutr. 2020, 60, 695–708. [Google Scholar] [CrossRef]
- Şöhretoğlu, D.; Sari, S. Flavonoids as Alpha-Glucosidase Inhibitors: Mechanistic Approaches Merged with Enzyme Kinetics and Molecular Modelling. Phytochem. Rev. 2020, 19, 1081–1092. [Google Scholar] [CrossRef]
- Özgen, A.G.; Hamulu, F.; Bayraktar, F.; Cetínkalp, S.; Yilmaz, C.; Túzún, M.; Kabalak, T. Long-Term Treatment with Acarbose for the Treatment of Reactive Hypoglycemia. Eat. Weight Disord.-Stud. Anorex. Bulim. Obes. 1998, 3, 136–140. [Google Scholar] [CrossRef] [PubMed]
- Pałasz, A.; Cież, D.; Trzewik, B.; Miszczak, K.; Tynor, G.; Bazan, B. In the Search of Glycoside-Based Molecules as Antidiabetic Agents. Top. Curr. Chem. 2019, 377, 19. [Google Scholar] [CrossRef] [PubMed]
- Liu, C.-F. Recent Advances on Natural Aryl-C-Glycoside Scaffolds: Structure, Bioactivities, and Synthesis—A Comprehensive Review. Molecules 2022, 27, 7439. [Google Scholar] [CrossRef] [PubMed]
- Johansen, J.S.; Harris, A.K.; Rychly, D.J.; Ergul, A. Oxidative Stress and the Use of Antioxidants in Diabetes: Linking Basic Science to Clinical Practice. Cardiovasc. Diabetol. 2005, 4, 5. [Google Scholar] [CrossRef]
- Giacco, F.; Brownlee, M.; Schmidt, A.M. Oxidative Stress and Diabetic Complications. Circ. Res. 2010, 107, 1058–1070. [Google Scholar] [CrossRef]
- Weseler, A.R.; Bast, A. Oxidative Stress and Vascular Function: Implications for Pharmacologic Treatments. Curr. Hypertens. Rep. 2010, 12, 154–161. [Google Scholar] [CrossRef]
- Rudrapal, M.; Khairnar, S.J.; Khan, J.; Dukhyil, A.B.; Ansari, M.A.; Alomary, M.N.; Alshabrmi, F.M.; Palai, S.; Deb, P.K.; Devi, R. Dietary Polyphenols and Their Role in Oxidative Stress-Induced Human Diseases: Insights Into Protective Effects, Antioxidant Potentials and Mechanism(s) of Action. Front. Pharmacol. 2022, 13, 806470. [Google Scholar] [CrossRef]
- Hussain, T.; Tan, B.; Yin, Y.; Blachier, F.; Tossou, M.C.B.; Rahu, N. Oxidative Stress and Inflammation: What Polyphenols Can Do for Us? Oxid. Med. Cell. Longev. 2016, 2016, 7432797. [Google Scholar] [CrossRef]
- Kumar, S.; Pandey, A.K. Chemistry and Biological Activities of Flavonoids: An Overview. Sci. World J. 2013, 2013, 162750. [Google Scholar] [CrossRef]
- Zheng, R.; Su, S.; Zhou, H.; Yan, H.; Ye, J.; Zhao, Z.; You, L.; Fu, X. Antioxidant/Antihyperglycemic Activity of Phenolics from Sugarcane (Saccharum officinarum L.) Bagasse and Identification by UHPLC-HR-TOFMS. Ind. Crops Prod. 2017, 101, 104–114. [Google Scholar] [CrossRef]
- Xu, J.; Jönsson, T.; Plaza, M.; Håkansson, Å.; Antonsson, M.; Ahrén, I.L.; Turner, C.; Spégel, P.; Granfeldt, Y. Probiotic Fruit Beverages with Different Polyphenol Profiles Attenuated Early Insulin Response. Nutr. J. 2018, 17, 34. [Google Scholar] [CrossRef] [PubMed]
- Kim, D.-O.; Chun, O.K.; Kim, Y.J.; Moon, H.-Y.; Lee, C.Y. Quantification of Polyphenolics and Their Antioxidant Capacity in Fresh Plums. J. Agric. Food Chem. 2003, 51, 6509–6515. [Google Scholar] [CrossRef] [PubMed]
- Jenkins, D.J.; Wolever, T.M.; Taylor, R.H.; Barker, H.; Fielden, H.; Baldwin, J.M.; Bowling, A.C.; Newman, H.C.; Jenkins, A.L.; Goff, D.V. Glycemic Index of Foods: A Physiological Basis for Carbohydrate Exchange. Am. J. Clin. Nutr. 1981, 34, 362–366. [Google Scholar] [CrossRef] [PubMed]
- ISO 26642:2010; International Standard-Food Products—Determination of the Glycaemic Index (GI) and Recommendation for Food Classification. International Organization for Standardization: Geneva, Switzerland, 2010. Available online: https://www.iso.org/obp/ui/#iso:std:iso:26642:ed-1:v1:en (accessed on 25 July 2023).
- Brouns, F.; Bjorck, I.; Frayn, K.N.; Gibbs, A.L.; Lang, V.; Slama, G.; Wolever, T.M.S. Glycaemic Index Methodology. Nutr. Res. Rev. 2005, 18, 145–171. [Google Scholar] [CrossRef] [PubMed]
Figure 1.
Mean 120 min plasma glucose response curves for the reference food (glucose) and the two test foods in Part A of the study. Test foods are negative control, sugar sample with zero polyphenols and Sample 1, sugar sample with 25 mg/100 g polyphenols. Data are shown as mean ± standard error of the mean (SEM) for the three repeated glucose solution tests.
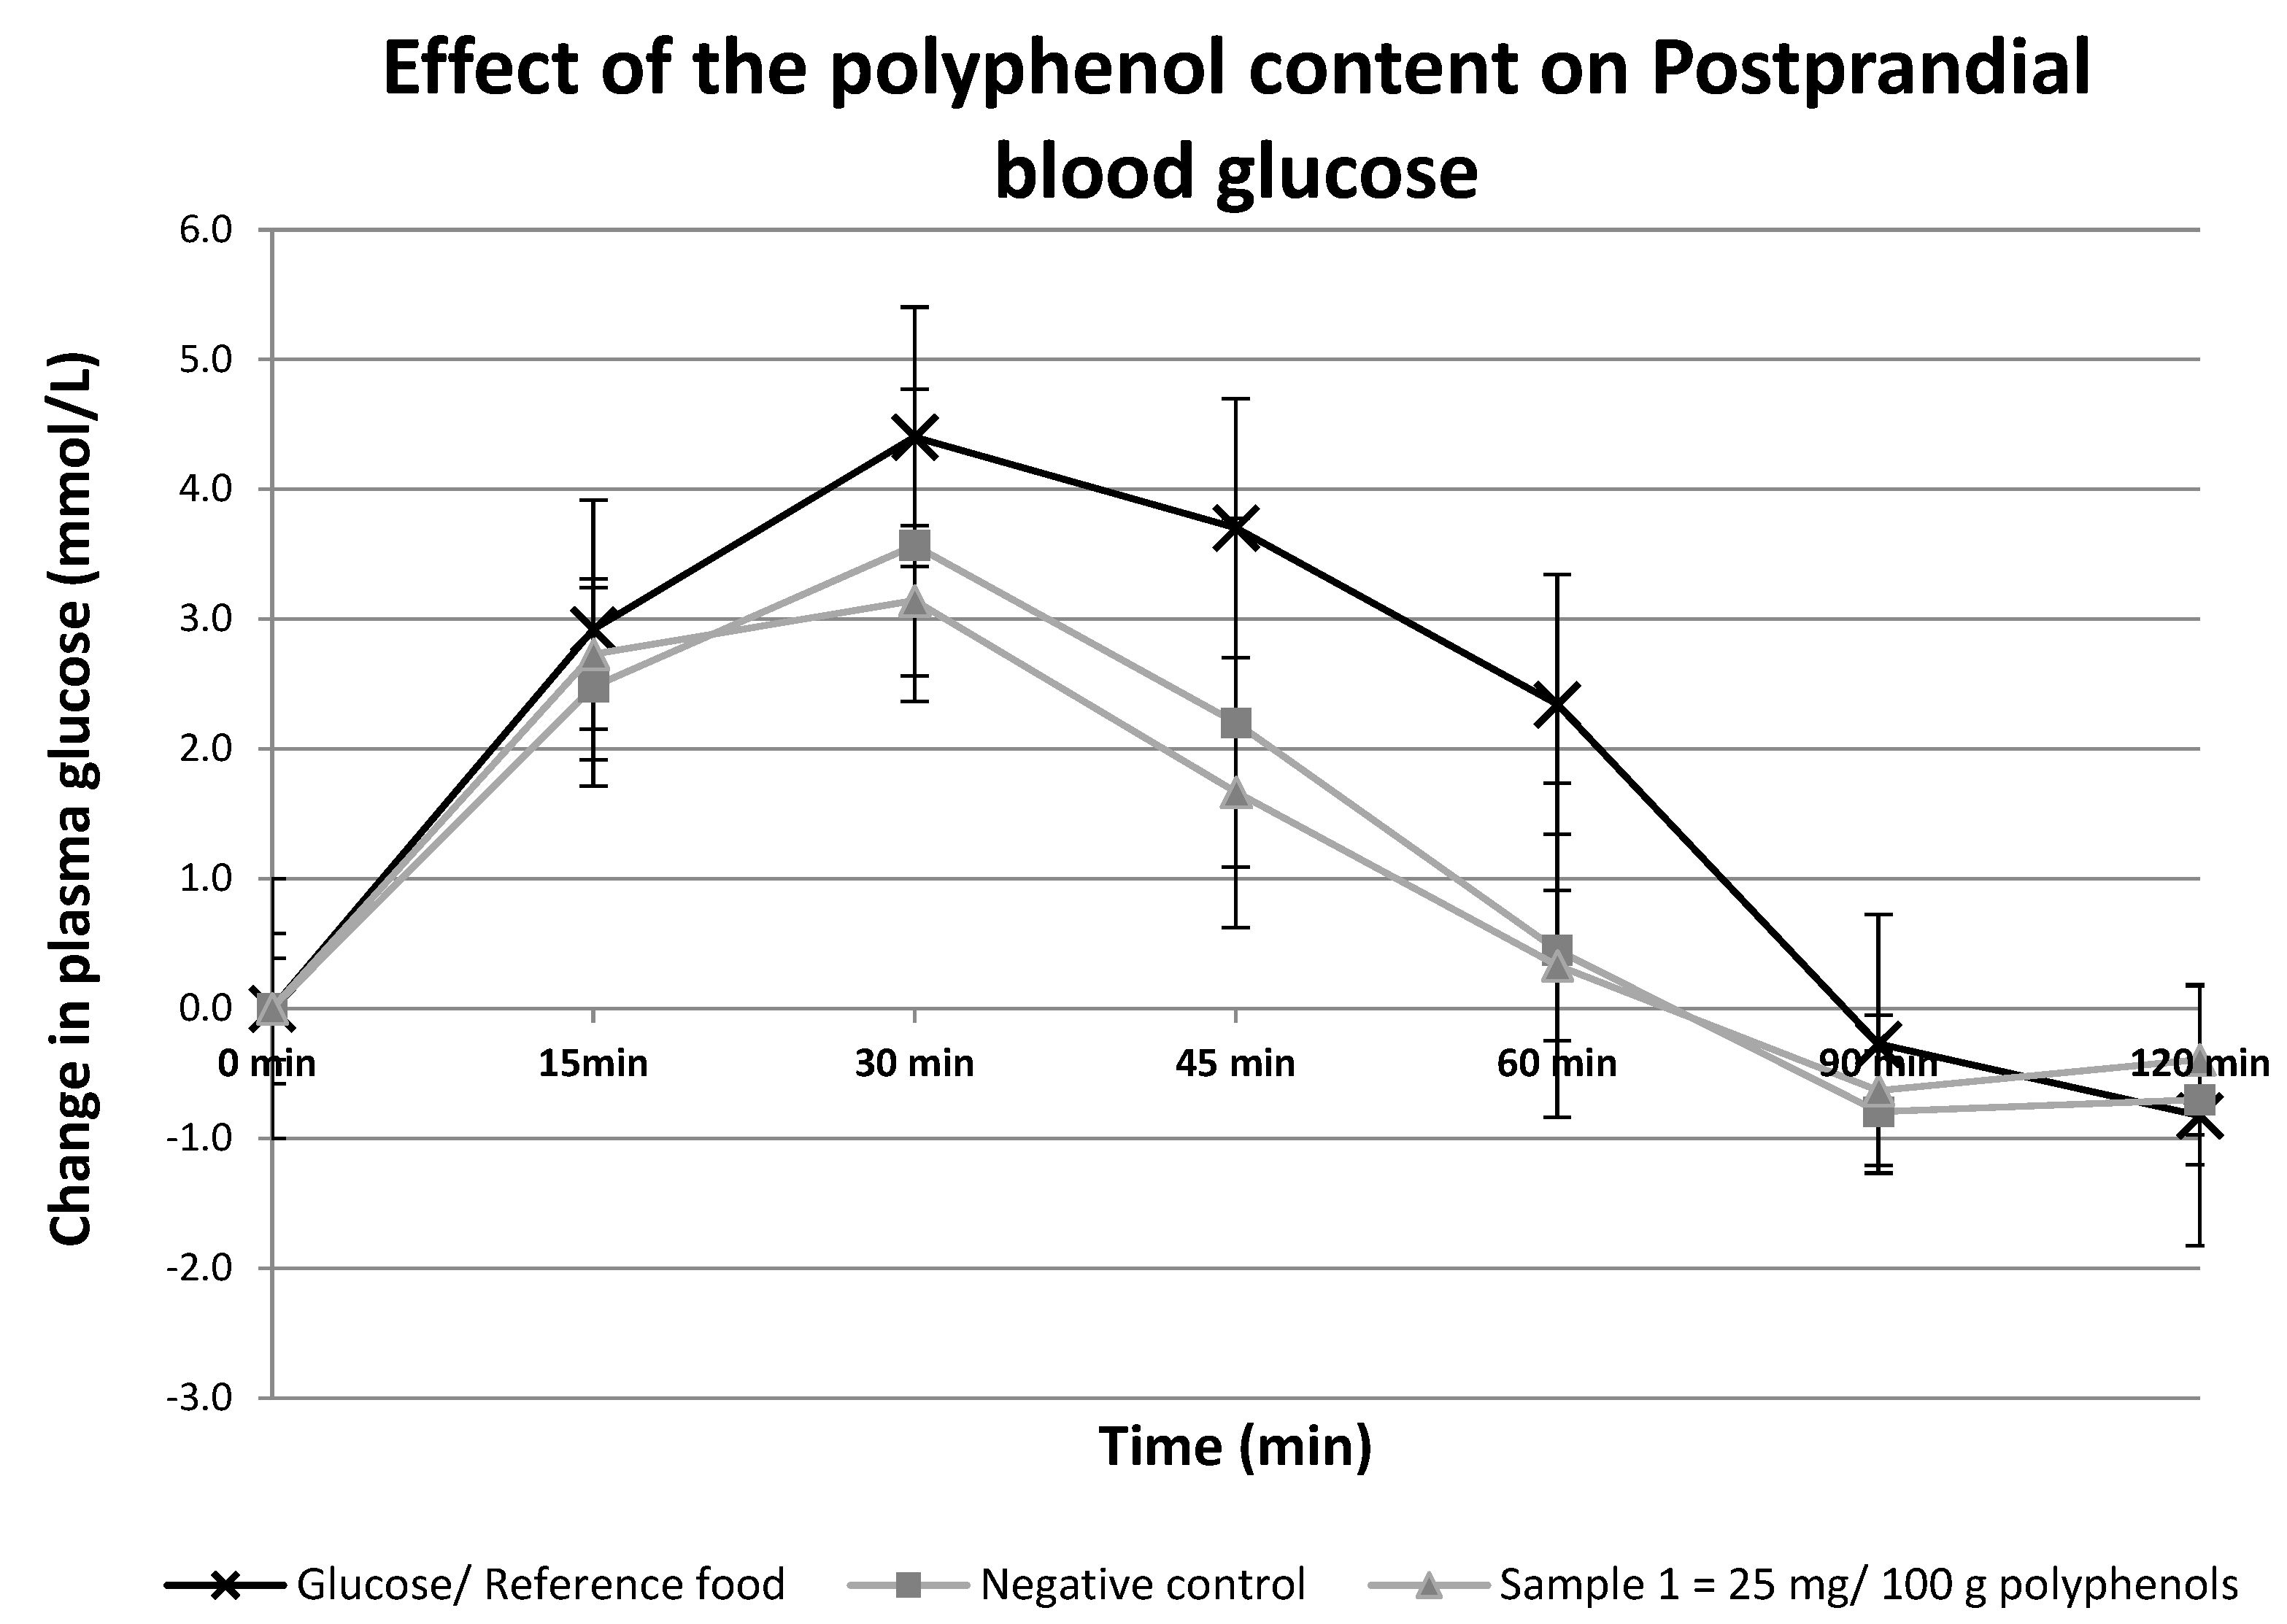
Figure 2.
Mean 120 min plasma glucose response curves for the reference food (glucose) and the two test foods with different polyphenol content in Part B of the study. Test foods are Sample 2, a sugar sample with 19 mg/100 g polyphenols and Sample 3, a sugar sample with 32 mg/100 g polyphenols. Data are shown as mean ± standard error of the mean (SEM) for the three repeated glucose solution tests.

Figure 3.
Comparison of the GI values of the four test foods in this study (including their polyphenol concentrations) and the reference food, glucose. The GI value of glucose is assigned as GI = 100. As the amount of polyphenol in the test food increases, the GI value is reduced. Data are shown as mean ± standard error of the mean (SEM) for the three repeated glucose solution tests.

Table 1.
GI values (Mean ± Standard deviation) of the four test foods with their corresponding polyphenol content. Test foods are negative control sucrose, Sample 1 = a sugar sample with polyphenol content of 25 mg/100 g polyphenols, Sample 2 = a sugar sample with 19 mg/100 g polyphenols and Sample 3 = a sugar sample with 32 mg/100 g polyphenols.
| Polyphenol Content (mg GAE/100 g) | Glycemic Index | |
|---|---|---|
| Negative control | 0 | 68.3 ± 8.2 |
| Sample 1 | 25 | 57.2 ± 5.6 |
| Sample 2 | 19 | 65.0 ± 7.2 |
| Sample 3 | 32 | 51.2 ± 7.3 |
t-test comparing sample 1 and sample 2, t = 1.71; p > 0.05. Paired t test comparing samples 3 and 4, t = 1.63, p > 0.05.
Disclaimer/Publisher’s Note: The statements, opinions and data contained in all publications are solely those of the individual author(s) and contributor(s) and not of MDPI and/or the editor(s). MDPI and/or the editor(s) disclaim responsibility for any injury to people or property resulting from any ideas, methods, instructions or products referred to in the content. |
© 2023 by the authors. Licensee MDPI, Basel, Switzerland. This article is an open access article distributed under the terms and conditions of the Creative Commons Attribution (CC BY) license (https://creativecommons.org/licenses/by/4.0/).
Share and Cite
MDPI and ACS Style
Flavel, M.; Neoh, J.; Lim, K.F. Dose-Dependency of the Glycemic Response to Polyphenol-Rich Sugarcane Extract (PRSE). Biologics 2023, 3, 308-320. https://doi.org/10.3390/biologics3040016
AMA Style
Flavel M, Neoh J, Lim KF. Dose-Dependency of the Glycemic Response to Polyphenol-Rich Sugarcane Extract (PRSE). Biologics. 2023; 3(4):308-320. https://doi.org/10.3390/biologics3040016
Chicago/Turabian StyleFlavel, Matthew, Julian Neoh, and Kosta Fremielle Lim. 2023. "Dose-Dependency of the Glycemic Response to Polyphenol-Rich Sugarcane Extract (PRSE)" Biologics 3, no. 4: 308-320. https://doi.org/10.3390/biologics3040016