
The Importance of Dimensional Traceability in Microfluidic Systems
by
 , , , , and
Elsa Batista
1,*,
João Alves e Sousa
1,
Fernanda Saraiva
1,
André Lopes
2,
Vania Silverio
3,4,
Rui F. Martins
2 and
and
Luis Martins
5
1
Metrology Department, Instituto Português da Qualidade, 2829-513 Caparica, Portugal
2
UNIDEMI, Department of Mechanical and Industrial Engineering, NOVA School of Science and Technology, Universidade NOVA de Lisboa, 2829-516 Caparica, Portugal
3
INESC Microsistemas e Nanotecnologias, INESC MN, 1000-029 Lisboa, Portugal
4
Department of Physics, Instituto Superior Técnico, Universidade de Lisboa, 1049-001 Lisboa, Portugal
5
LNEC—Laboratório Nacional de Engenharia Civil, 1700-066 Lisboa, Portugal
*
Author to whom correspondence should be addressed.
Metrology 2024, 4(2), 240-253; https://doi.org/10.3390/metrology4020015
Submission received: 31 January 2024
/
Revised: 22 April 2024
/
Accepted: 29 April 2024
/
Published: 6 May 2024
(This article belongs to the Topic Measurement Strategies and Standardization in Manufacturing)
Abstract
:Dimensional measurements are fundamental in microfluidic device manufacturing and performance. The main focus of this study is the measurement of the connection port sizes in microfluidic devices and components and, accordingly, the possible existence of fluid leaks determined using the flow rate error. The sizes associated with three different microfluidic systems were determined using laser interferometry and through an optical measuring instrument, with metrological traceability to national length standards. It was possible to infer the method with the greatest accuracy and lowest measurement uncertainty for characterizing this kind of system. In conclusion, the results of this work directly address the current lack of dimensions measuring methods of microfluidic components by providing a comprehensive comparison of different protocols, ultimately suggesting a preferred option for immediate application within the microfluidic industry.
1. Introduction
Microfluidics is the science that studies the behavior of fluids through paths with micrometric sizes (microchannels, microchambers, microvalves, etc.), and the technology for manufacturing them [1]. Microfluidic devices are small, simple, portable, and can be used in several emerging applications such as drug development, micro implantology, lab-on-a-chip (LOC), organs-on-chip (OoC), and organ-level physiology. LOCs are integrated systems used in various areas of biomedical and life science including diagnostics, therapeutics, drug delivery, biosensors, and tissue engineering [2,3]. OoCs are microfluidic cell culture devices used to mimic tissue [4,5]. Organ-level physiology consists of portable and cost-effective biomedical tools for pharmaceutical research [6] and personalized medicine [7], etc.
In several fields, including biomedical research and chemical analysis, microfluidic devices make it possible to accurately operate with and regulate small fluidic volumes and flow. The first microfluidic devices were developed in the 1990s [8] and had the main objective to miniaturizing analytical and chemical methods. Since then, manufacture techniques [9,10] and manipulation of the devices [11] have become more accessible. Microfluidic devices enabled the integration of different functional modules (or operational units) on a single platform and the building of a microsystem for total analysis [12,13], as it was envisioned in the early days of microfluidics [14]. However, it is essential to comprehend and take care of the key parameters that control the operation and performance of microfluidic devices, such has connecting components, as they are crucial links between the microworld and the macroworld. To successfully integrate these parameters that affect the performance of the microfluidic systems, the following criteria should be considered: easy handling, overall compatibility of materials, adequate dimensions [1], no leakage, among others.
The EMPIR MFMET project—Establishing Metrology Standards in Microfluidic Devices, coordinated by the Portuguese Quality Institute (IPQ), has the following main objectives: (1) the development of transfer standards for miniaturized fluidic devices to be used in quality control of manufacturing processes, and (2) the development of protocols for measuring quantities, properties, dimensions, and positioning of interfaces between different materials [15].
In the scope of the EMPIR MFMET project, the present work consists of verifying the connectivity compatibility in three different microfluidic systems, which include chips of different materials, several components such as tubes, connectors, and reservoirs, etc. This components and chips were chosen due to their large applicability and current use in microfluidic systems. Also, both polydimethylsiloxane (PDMS) and polymer chips—Cyclic Olefin Copolymer (COC), tradename TOPAS©—are used as measuring substrates to identify the influence of material on the repeatability of the results. The flow rates of the systems and associated measurement errors were studied at the IPQ Volume and Flow Laboratory using the gravimetric method [16,17] and the front tracking method [18,19]. Its main focus was to measure the connection port sizes in the microfluidic devices and components, and, accordingly, the possible existence of fluid leaks in these systems. The dimensions associated with three microfluidic systems were determined using laser interferometry and an optical measuring instrument, with measurement results which were traced to national length standards. Indeed, the dimensions and tight fit between connectors and the chips are used to relate to the existence of fluid leaks in the microfluidic path.
As a collateral consequence, the comparison between the manufacturers’ specifications of the three microfluidic systems and the measured dimensions of the latter enabled us to infer which method provides the greatest measurement accuracy and the lowest uncertainty for characterizing this kind of systems.
This work also highlighted the need for components manufacturing harmonization with metrological dimension quantity values traced to SI units. The knowledge gathered by this study will be included in a regulatory framework in order to improve the manufacturing process and quality control of this kind of microfluidic components.
2. Materials and Methods
2.1. Dimensional Measurement Methods
Optical metrology is the science and technology of making measurements with the use of light as standards or information carriers [20] and is being increasingly adopted in many applications where reliable data about the distance, displacement, dimensions, shape, roughness, surface properties, strain, and stress state of the object under test are required [21], mainly in manufacturing, fundamental research, and engineering applications, such as quality control, nondestructive testing, experimental mechanics, and biomedicine [22]. Interferometry is one of the most used optical techniques in fields like metrology, astronomy, fiber optics, engineering metrology, optical metrology, spectroscopy (and its applications to chemistry), quantum mechanics, surface profiling, and microfluidics [23].
Laser interferometry is used to measure the intensity of a wave resulting from the overlapping of two or more waves that have travelled over different distances and are superimposed on a single point [24]. On the broader sense, an interferometer is an optical arrangement in which two or more light waves are caused to interfere. This is often referred to as single-wavelength interferometry, and this phenomenon can be observed with a Michelson-type interferometer. In this case, the two vibrations (waves) that produce the interference signal have the same wavelength or the same frequency.
In this work, the laser measurement system, model 5528A, manufactured by Hewlett-Packard (HP), that follows the optical principle of interference at two wavelengths or heterodyne, was used. This HP system consists of the measurement display HP control unit, the laser head, the sensors for acquiring environmental conditions and measurement optics components. To carry out distance measurements, a linear interferometer is configured with a fixed polarizing beam splitter, a retroreflector, and a moveable retroreflector. The HP laser outputs two beams at 633 nm that changes whenever the measurement optics components move relative to each other. The processor weights the pulse difference and displays the indication. An integrated and automated computer with a LabVIEW-based IPQ-made application (Figure 1) was used to process the resulting indications.
This HP laser interferometer was one of the optical technologies used in this work to measure the dimensions of connectors and tubes used in microfluidic systems. The setup includes a 3 m bench made by the Société Genevoise d’Instruments de Physique (SIP) that was used as support for fixing and align the HP laser head and a carriage. The HP mobile retroreflector was also fixed to the carriage, equipped with a stereomicroscope, namely the Zeiss Stemi 2000-C Stereo Microscope 10×–23× that has a vertical optical axis for focusing the plane of the artefact (in this case, the top of the chip). Inside the stereomicroscope display, a cross-shaped reticle is used to align the carriage movement with the distance to be measured in the microfluidic component and to define the points between which the distance is intended to be measured. Thanks to a camera attached to the top of the stereomicroscope, the planes of the viewed artifacts can be photographed. In this way, photos of the PDMS chips were made.
The measurement principle is based on the movement of the carriage fitted with the stereomicroscope and the HP mobile retroreflector (Figure 1), measured with the HP laser interferometer unit. With the help of the stereomicroscope reticle, the starting and ending points are defined on the plane of the microfluidic component. The internal (or external) diameter of the microfluidic component is determined based on the interferometer measurement of the carriage displacement, corresponding exactly to the distance between the internal (or external) diameter of the chip, visualized through the stereomicroscope.
The field of optical 3D metrology is gaining significant interest in recent years. Indeed, optical sensors can probe the geometry of workpieces and biological samples very fast, high accurately, and without any tactile physical contact to the surface object [25,26]. This 3D technology is the base of the other optical device used in this work, a three-dimensional optical measuring instrument, brand Mitutoyo Quick Vision, resolution 0.0001 mm (see Figure 2). This instrument includes a computational application, Mitutoyo Mitac Qvpack, version 7.401A, which ensures the virtual construction of geometric elements, such as lines and circles, among others, which are necessary to measure the dimensional and geometric quantities of interest. It is equipped with a digital camera installed in its instrumented vertical (Z) and transverse (Y) axes, oriented towards a reference glass plane, which is connected to the remaining instrumented longitudinal axis (X). It allows for the acquiring of images from an object, and determines the 3D coordinates of points of interest using a dedicated computer vision software, based on linear measurements related to the instrumented measurement axes (X, Y, Z). Although being able to perform 3D measurements, only 2D measurements were performed in this work. This 3D optical measuring instrument also has its own artificial lighting system, which can be adjusted to observe opaque and translucent objects with differentiated photometric characteristics. The raw data obtained are composed of 3D coordinates of points retrieved from the acquired 2D images. The diameter of the circular components was measured using the 3D coordinates of points regularly distributed in the circumference observed in the 2D image, followed by the use of a least square method in order to fit a circle to the measured points, therefore enabling the calculation of the corresponding diameter.
Both three-dimensional optical measuring instruments and laser interferometers are advanced tools used for length measurements. It should be noted that while both tools can provide extremely accurate dimensional measurements, the specific capabilities and resolutions might differ based on the particular model, design, or setup of the device.
2.2. Flow Measurement
Flow measurements were performed in each microfluidic chip assembly using the gravimetric method and the front track method in order to verify the best suitable method for leakage detection.
The gravimetric method [16] is used to determine a delivered mass of a liquid over a time interval. This method can be used for testing inline flow sensors and flow generators (Figure 3). In a gravimetric microfluidic setup, an electronic balance is used (Mettler AX26) to determine the delivered mass of a fluid from/through the test object, which can be a flow generator, a microfluidic device, or a flow meter. The time interval in which the mass is delivered is determined by a timing module to derive the mass flow rate. The climatic conditions such as air temperature, relative humidity, and pressure are determined to correct for buoyancy effects on the balance. The liquid temperature is determined to convert the mass flow rate into a volumetric flow rate, considering the density of the liquid used [17]. In addition, this particular setup not only uses an evaporation trap to reduce evaporation, which is especially useful at low flow rates, but also a connecting tube was inserted below the water surface inside the weighing vessel of the balance to avoid the drop impact effect. The flow was generated with a programmable syringe pump Nexus 3000, from Chemyx, using a 1 mL ILS glass syringe connected to a polyethylene (PE) tube of 1.26 mm (0.05′) inner diameter.
The front tracking method for flow measurements described in [18,19] is an optical method that consists of tracking the position of the meniscus of a liquid (liquid/air or liquid/liquid interface) inside a (typically) capillary tube over time. An optical image acquisition system and image processing software are used to achieve the position over time of the meniscus. Knowing the displacement of the meniscus over time and the cross-section area of the capillary, it is possible to calculate the flow rate. Alternatively, the front tracking method can be performed in a microfluidic channel if the inner dimensions of the channel are known along with their associated uncertainties. In this specific case, a high-resolution Alvium 1800 U-1240 camera with a resolution of 12 MP and a Qioptic Optem 7:1 telecentric zoom lens was used (Figure 4). The camera was connected to a computer and uses a Python-based program to identify the meniscus and calculate its position.
2.3. Microchips Used
Three different chips made of polydimethylsiloxane (PDMS) and of cyclic olefin copolymer (TOPAS) were used:
- (i)
- PDMS chip with one channel of 100 μm width and 50 μm depth, with two 0.9 mm inlet holes; material: PDMS; dimensions: 40 mm × 10 mm; manufactured by INESC MN (Figure 5) and tested for assemblies with different components.
- (ii)
- Chip A (see Figure 6): parallel channel array with fluid interface holes; material: TOPAS® (COC polymer for medical use); dimensions: 75.5 mm × 25.5 mm × 1.5 mm; with eight parallel channels of 100 µm width, 100 µm depth, 18 mm length; connectors are glued to the chip holes.
- (iii)
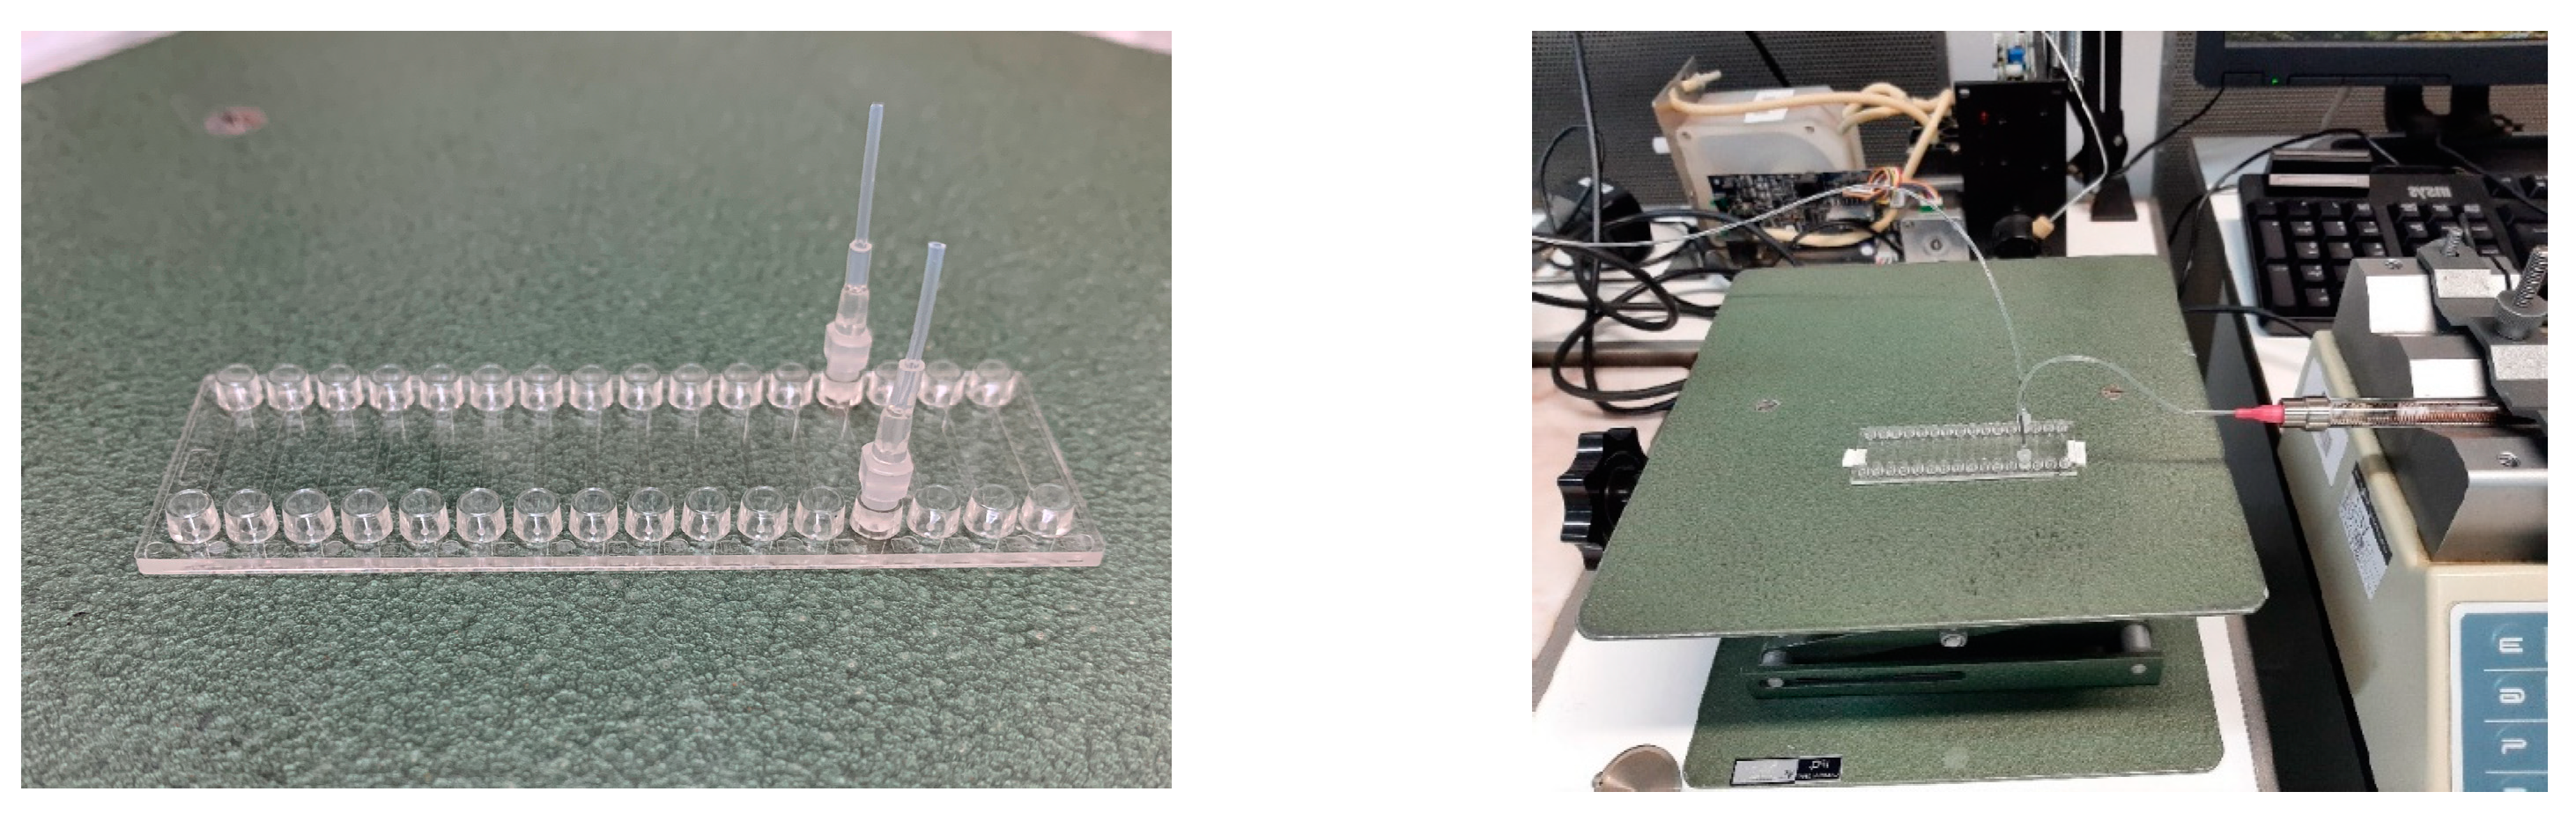
- Chip C (see Figure 7): parallel channels with mini Luer fluidic interface; material: TOPAS® (COC polymer for medical use); dimensions: 75.5 mm × 25.5 mm × 4 mm; with eight parallel channels of 100 µm width, 100 µm depth, 18 mm length. Luer fluidic interface, similar to “female mini luer port” integrated directly on the chip.
3. Results
3.1. Dimensional Measurement Results
The dimensional measurement results for the three different assemblies using the laser interferometry and the 3D optical measuring instrument are shown in Figure 8, Figure 9, Figure 10, Figure 11 and Figure 12. For all the assemblies, the inner diameter or external diameter of each microfluidic component was measured depending on the type of connection and accessory used.
In the case of accessories of translucent material when using laser interferometry, the image viewed on the stereomicroscope (even with the cross-shaped reticle in place), does not enable good repeatability in defining the starting and ending points of the diameter to be measured. This led to dimensional measurement results outside of laboratory acceptance criteria. When considered as unsatisfactory quality measurement results, only the measurement standard deviation was displayed, and the corresponding uncertainty was not estimated. For PE tube and stainless-steel catheter components, the measurement results were acceptable, and therefore the expanded uncertainty was presented with a coverage factor k = 2 which, for a normal distribution, corresponds to an approximately 95% coverage probability. These length measurement results are displayed in Figure 8.
![Metrology 04 00015 g008]()
Figure 8.
“PE tube” and “stainless steel catheter” top planes photographed with the Zeiss stereomicroscope, and the respective the dimensions measured using the HP laser interferometer.
Figure 8.
“PE tube” and “stainless steel catheter” top planes photographed with the Zeiss stereomicroscope, and the respective the dimensions measured using the HP laser interferometer.
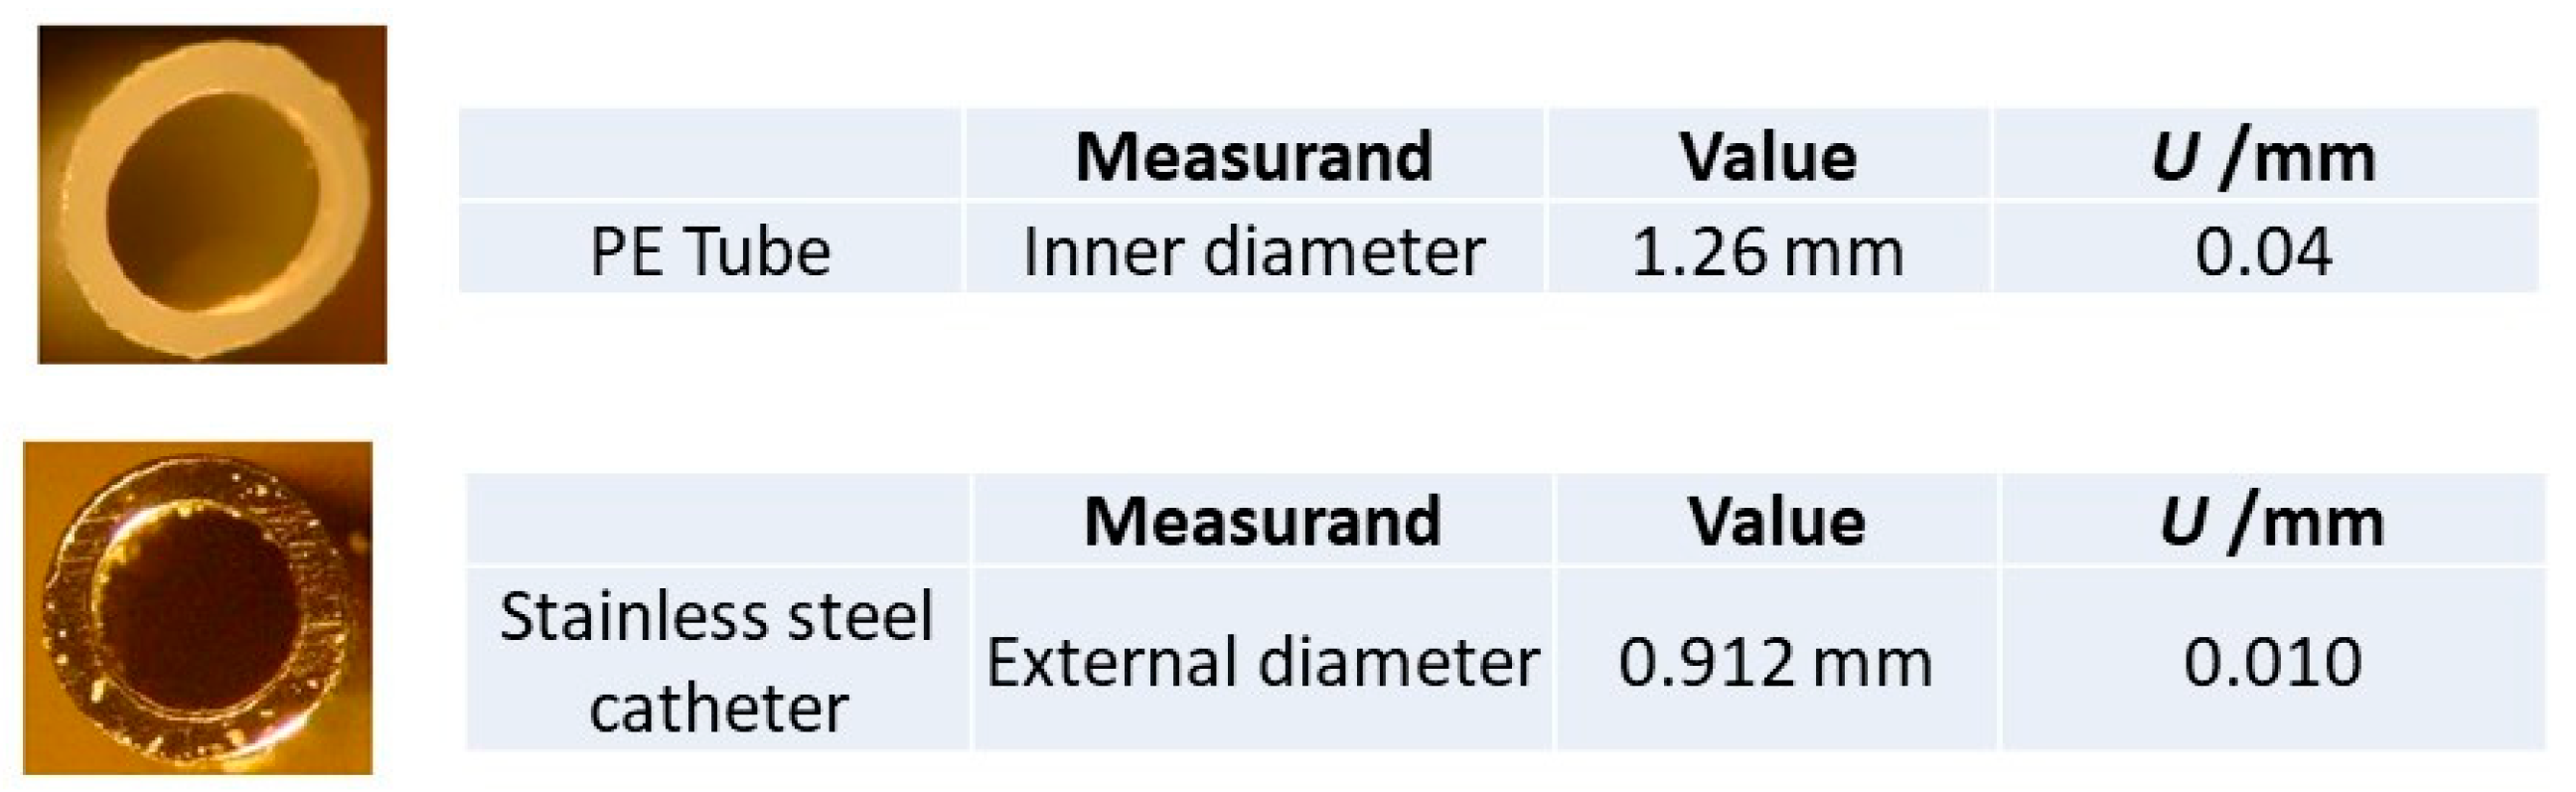
For the PE tube and the stainless steel components, the measurement uncertainties were determined using the interferometer. It was evidenced to be larger for the former than for the latter due to the circularity measurement uncertainty component being greater for the plastic materials.
All the measurement results obtained from the 3D optical measuring instrument are presented with expanded uncertainty values, with a coverage factor k = 2, corresponding to an approximately 95% coverage probability.
The dimensional measurement uncertainty was calculated with the GUM methodology [27] using the following optical measuring instrument uncertainty components:
- calibration;
- instrumental drift;
- instrument resolution;
- geometrical shape deviation (circularity);
- linear thermal variation;
- measurement repeatability.
The values of the measurands in the Tables in Figure 9, Figure 10, Figure 11, Figure 12 and Figure 13 were obtained with the HP laser interferometer, as described in Section 2.1.
![Metrology 04 00015 g009]()
![Metrology 04 00015 g010]()
![Metrology 04 00015 g011]()
Figure 9.
Chip PDMS hole in the chip photographed with the Zeiss stereomicroscope, and dimensions measured using the HP laser interferometer; the assembly is shown in Figure 5.
Figure 9.
Chip PDMS hole in the chip photographed with the Zeiss stereomicroscope, and dimensions measured using the HP laser interferometer; the assembly is shown in Figure 5.
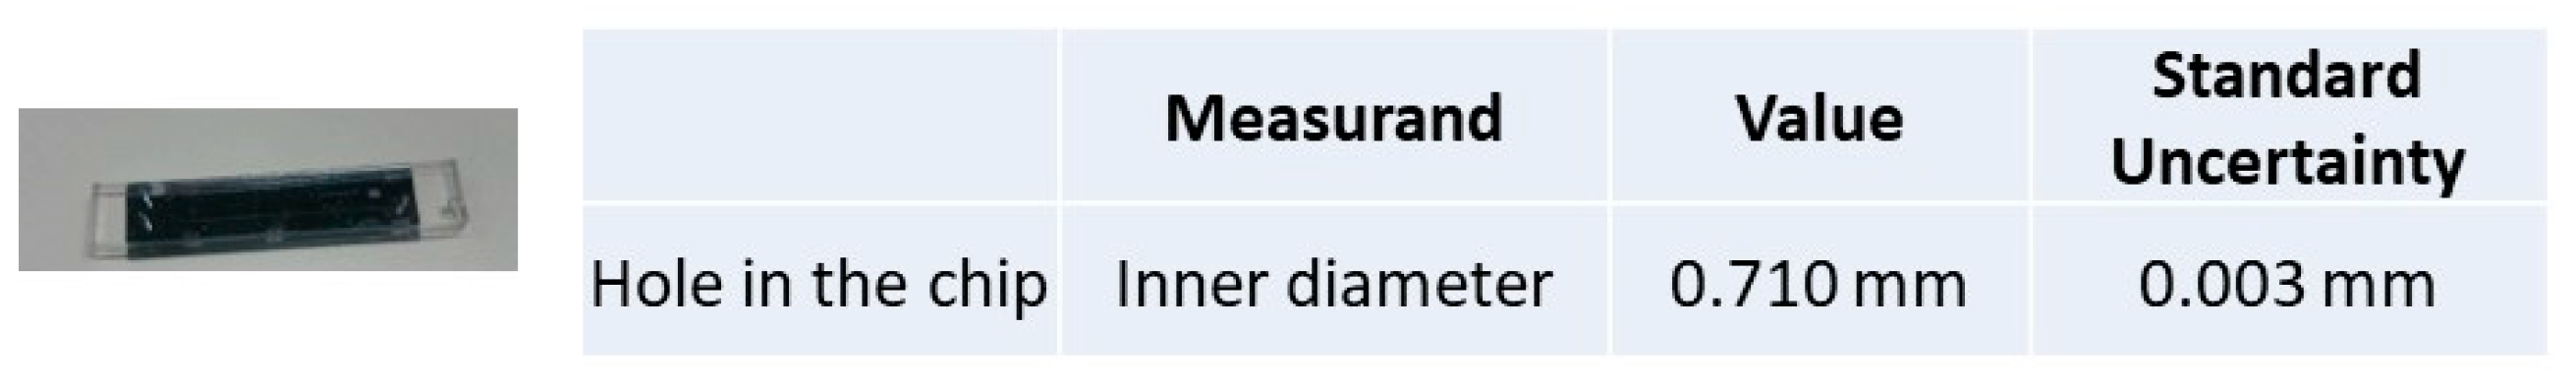
Figure 10.
Topas chip A “rubber tube” top planes photographed with the Zeiss stereomicroscope, and the dimensions measured using the HP laser interferometer; the assembly is shown in Figure 6.
Figure 10.
Topas chip A “rubber tube” top planes photographed with the Zeiss stereomicroscope, and the dimensions measured using the HP laser interferometer; the assembly is shown in Figure 6.
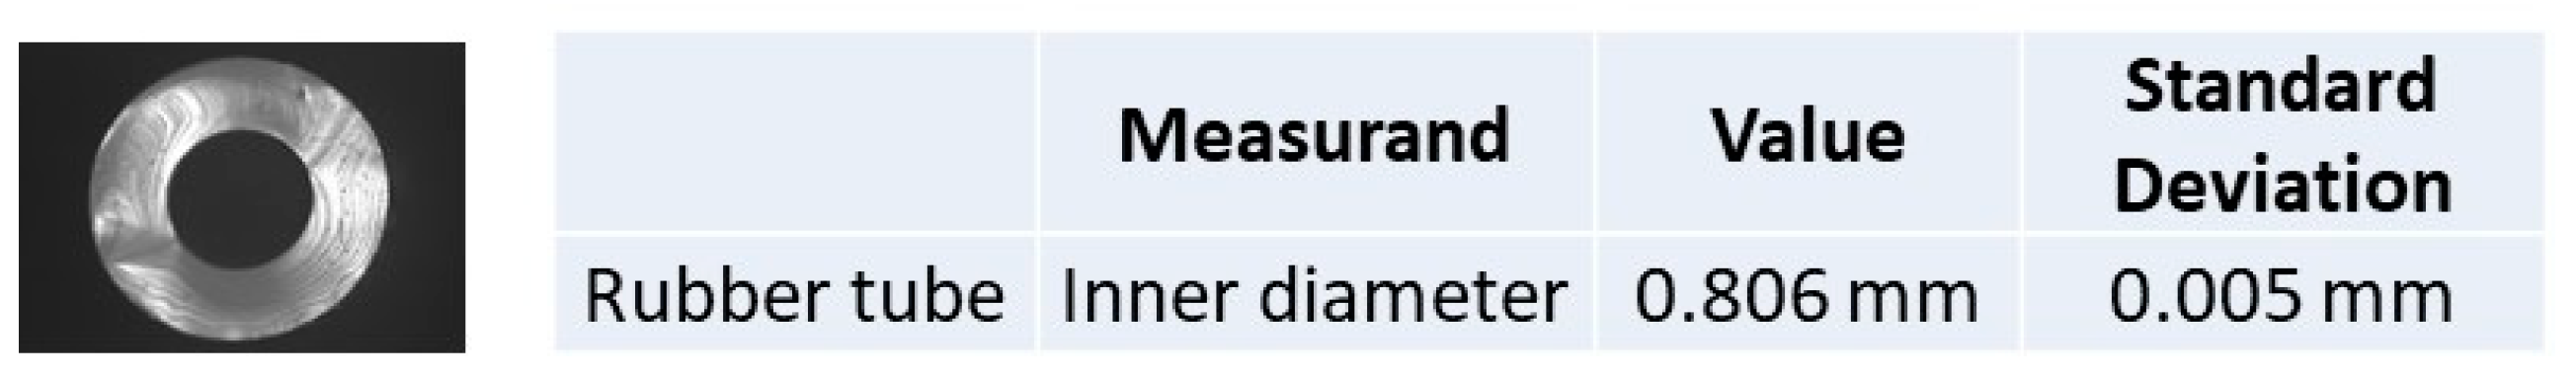
Figure 11.
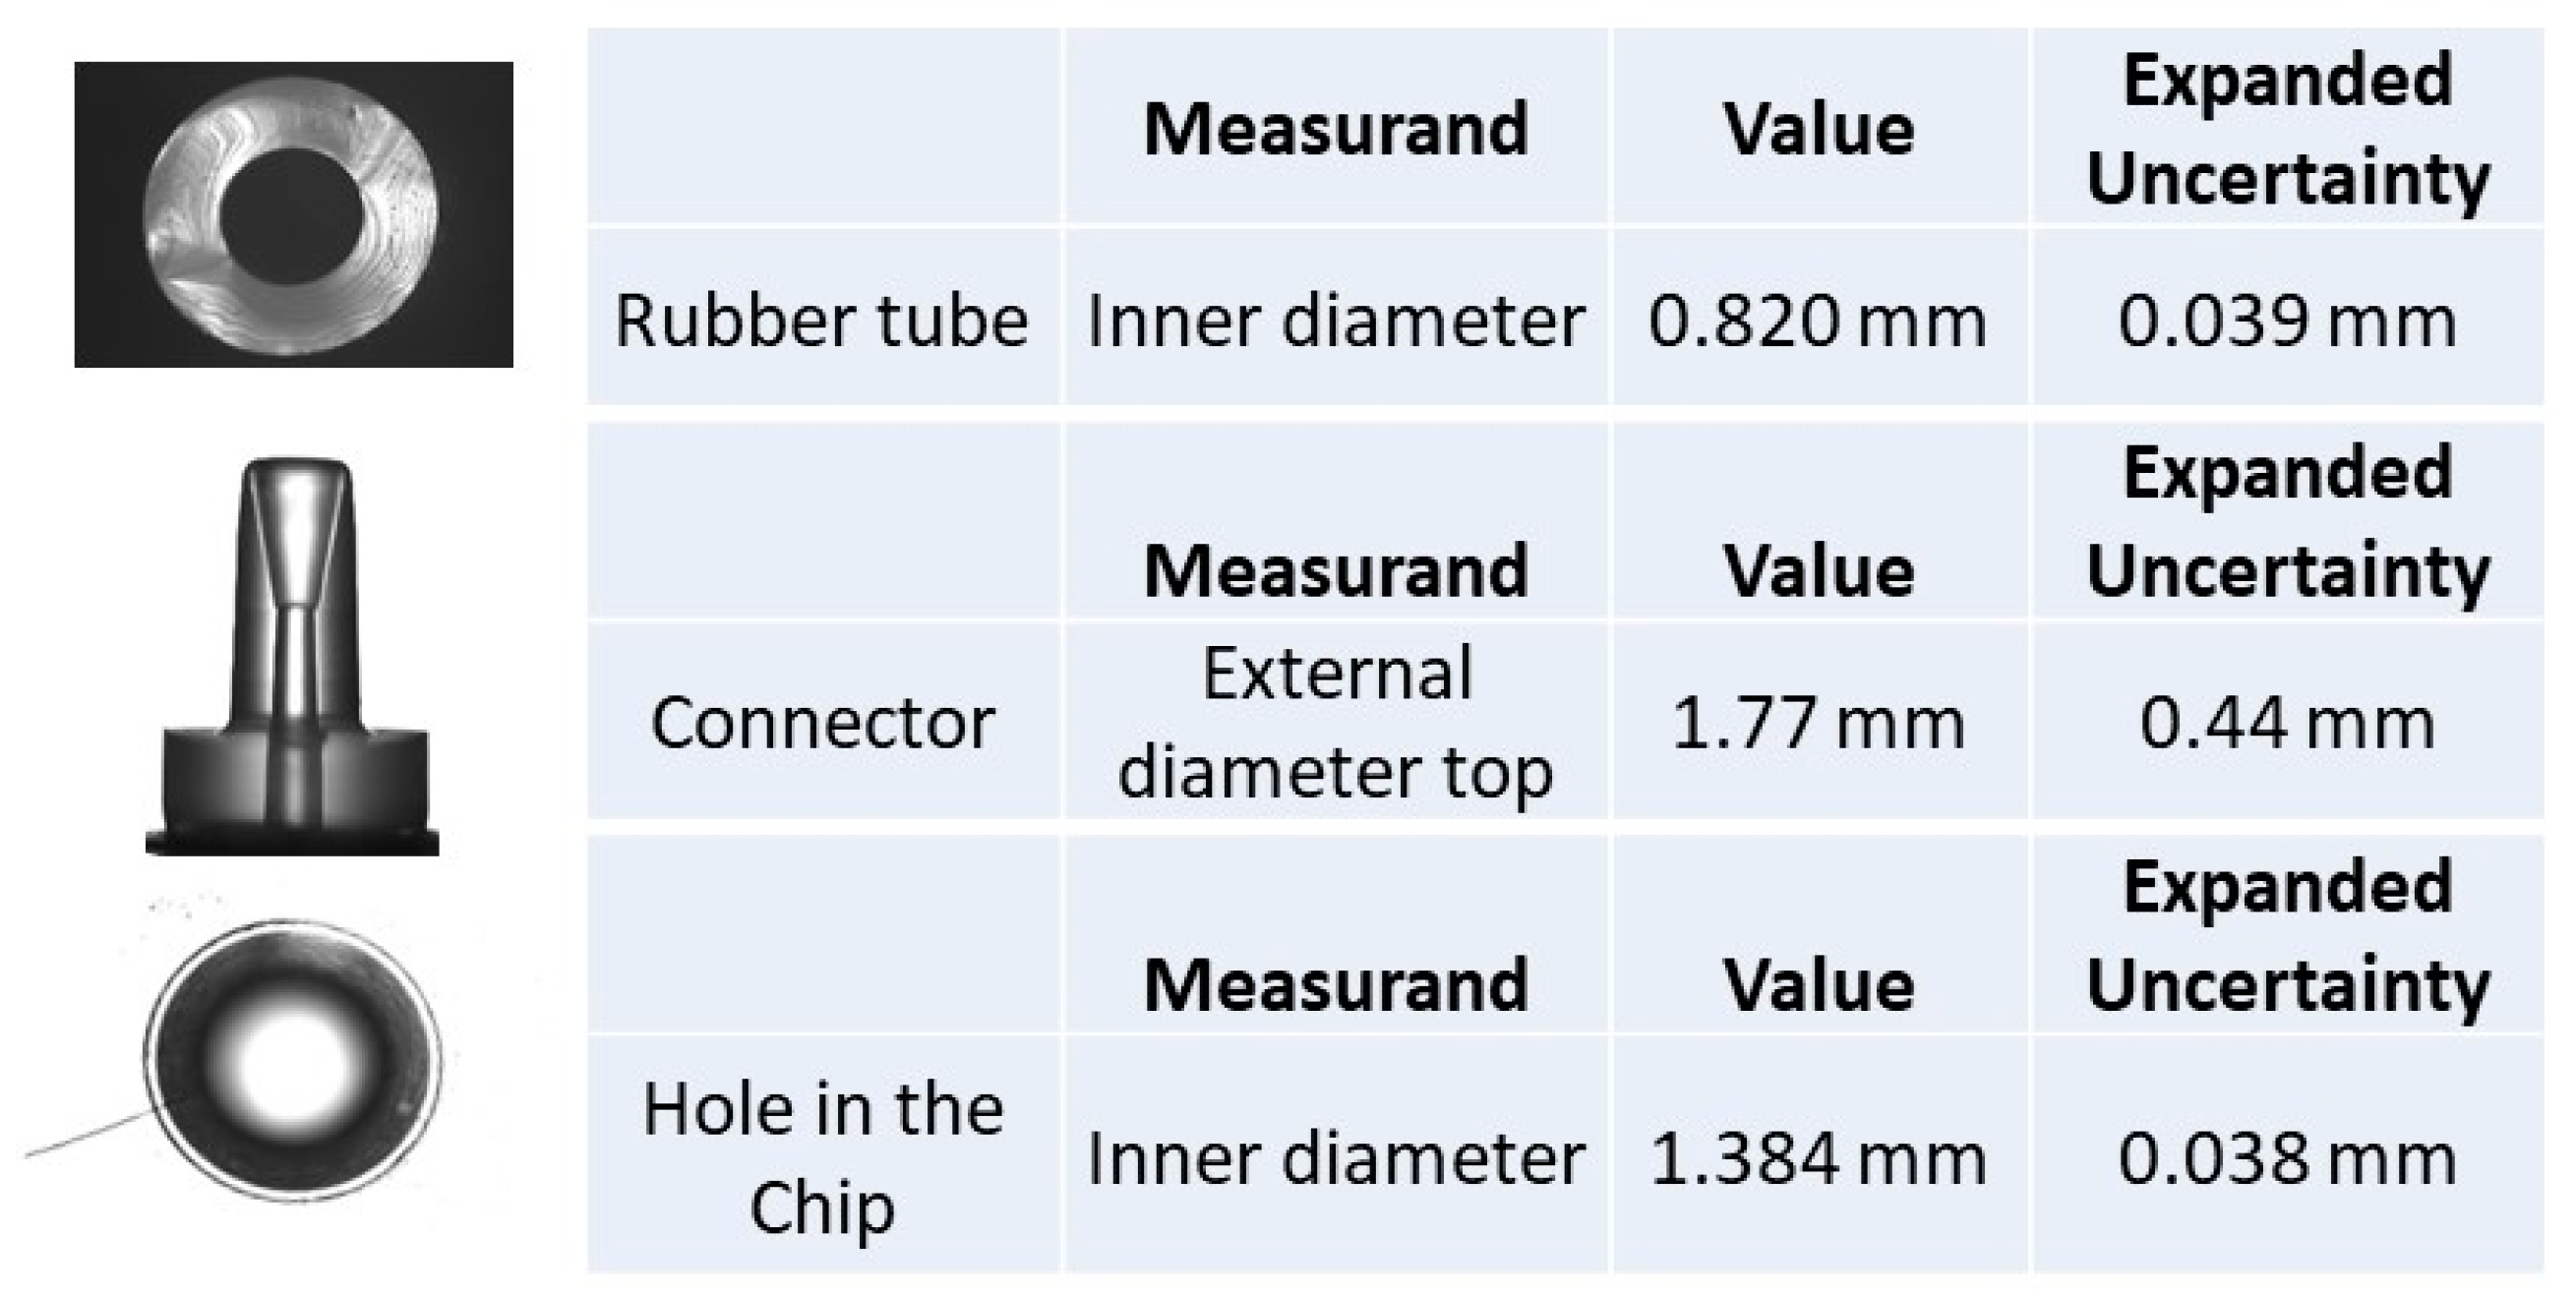
Topas chip A “rubber tube” top plane photographed with the Zeiss stereomicroscope, “Connector” and “Hole in the chip” photographed with the 3D measuring instrument, and the dimensions measured with the 3D optical measuring instrument; the assembly is shown in Figure 6.
Figure 11.
Topas chip A “rubber tube” top plane photographed with the Zeiss stereomicroscope, “Connector” and “Hole in the chip” photographed with the 3D measuring instrument, and the dimensions measured with the 3D optical measuring instrument; the assembly is shown in Figure 6.
3.1.1. Chip PDMS
The 3D optical measuring instrument was not used to determine the dimensions in the PDMS chip due to the problems in optical reading the connecting holes in this device.
For the hole of the chip, only standard deviation was displayed due to technical difficulties in measuring the rubber material sizes that do not enable obtaining acceptable measurement repeatability.
3.1.2. Chip A
For the rubber tube, only standard deviation was displayed because technical difficulties that do not enable acceptable measurement repeatability.
The uncertainty values for the connector measurements are higher than for the other components due to the form of the connector top. Nevertheless, as the values obtained for the rubber tuber using both optical methods are very similar, a coherence is provided for the measurement results.
3.1.3. Chip C
Chip C was studied with the laser interferometry and 3D optical measuring instrument methods. For both of them, it can be observed that the measurement results for the connector and hole in chip are very similar, with the measurement uncertainty or standard deviation being larger for the connector than for the hole in the chip. This difference is due to a corresponding larger circularity uncertainty component.
This dimension-measurement data analysis allows us to suggest that the measured length values and associated uncertainties/standard deviation are consistent. It is tempting to deduce that both methods may be used to determine the dimensions of the microfluidic components. However, the influence of the translucid components’ variability on the uncertainty of the measurement determination requires further studies on the interferometer method to confirm the equivalent usability of the methods.
Shape deviations intrinsic to the components’ characteristics such as roundness, cylindricity, and translucency of plastic material are identified as the main factors for the high standard deviations computed with the interferometric method. The order of magnitude of the latter is about 0.01 mm, when the interferometer has a resolution of 0.01 μm. This corresponds to dimensional measurement results of clearly unsatisfactory quality, for which the uncertainty estimate was not performed.
From the results with the 3D optical measuring instrument, in Figure 11 and Figure 13, it can be concluded that uncertainty values obtained in the dimensional measurements are also dependent on the component material. The more rigid and less translucent the material, the smaller the uncertainty.
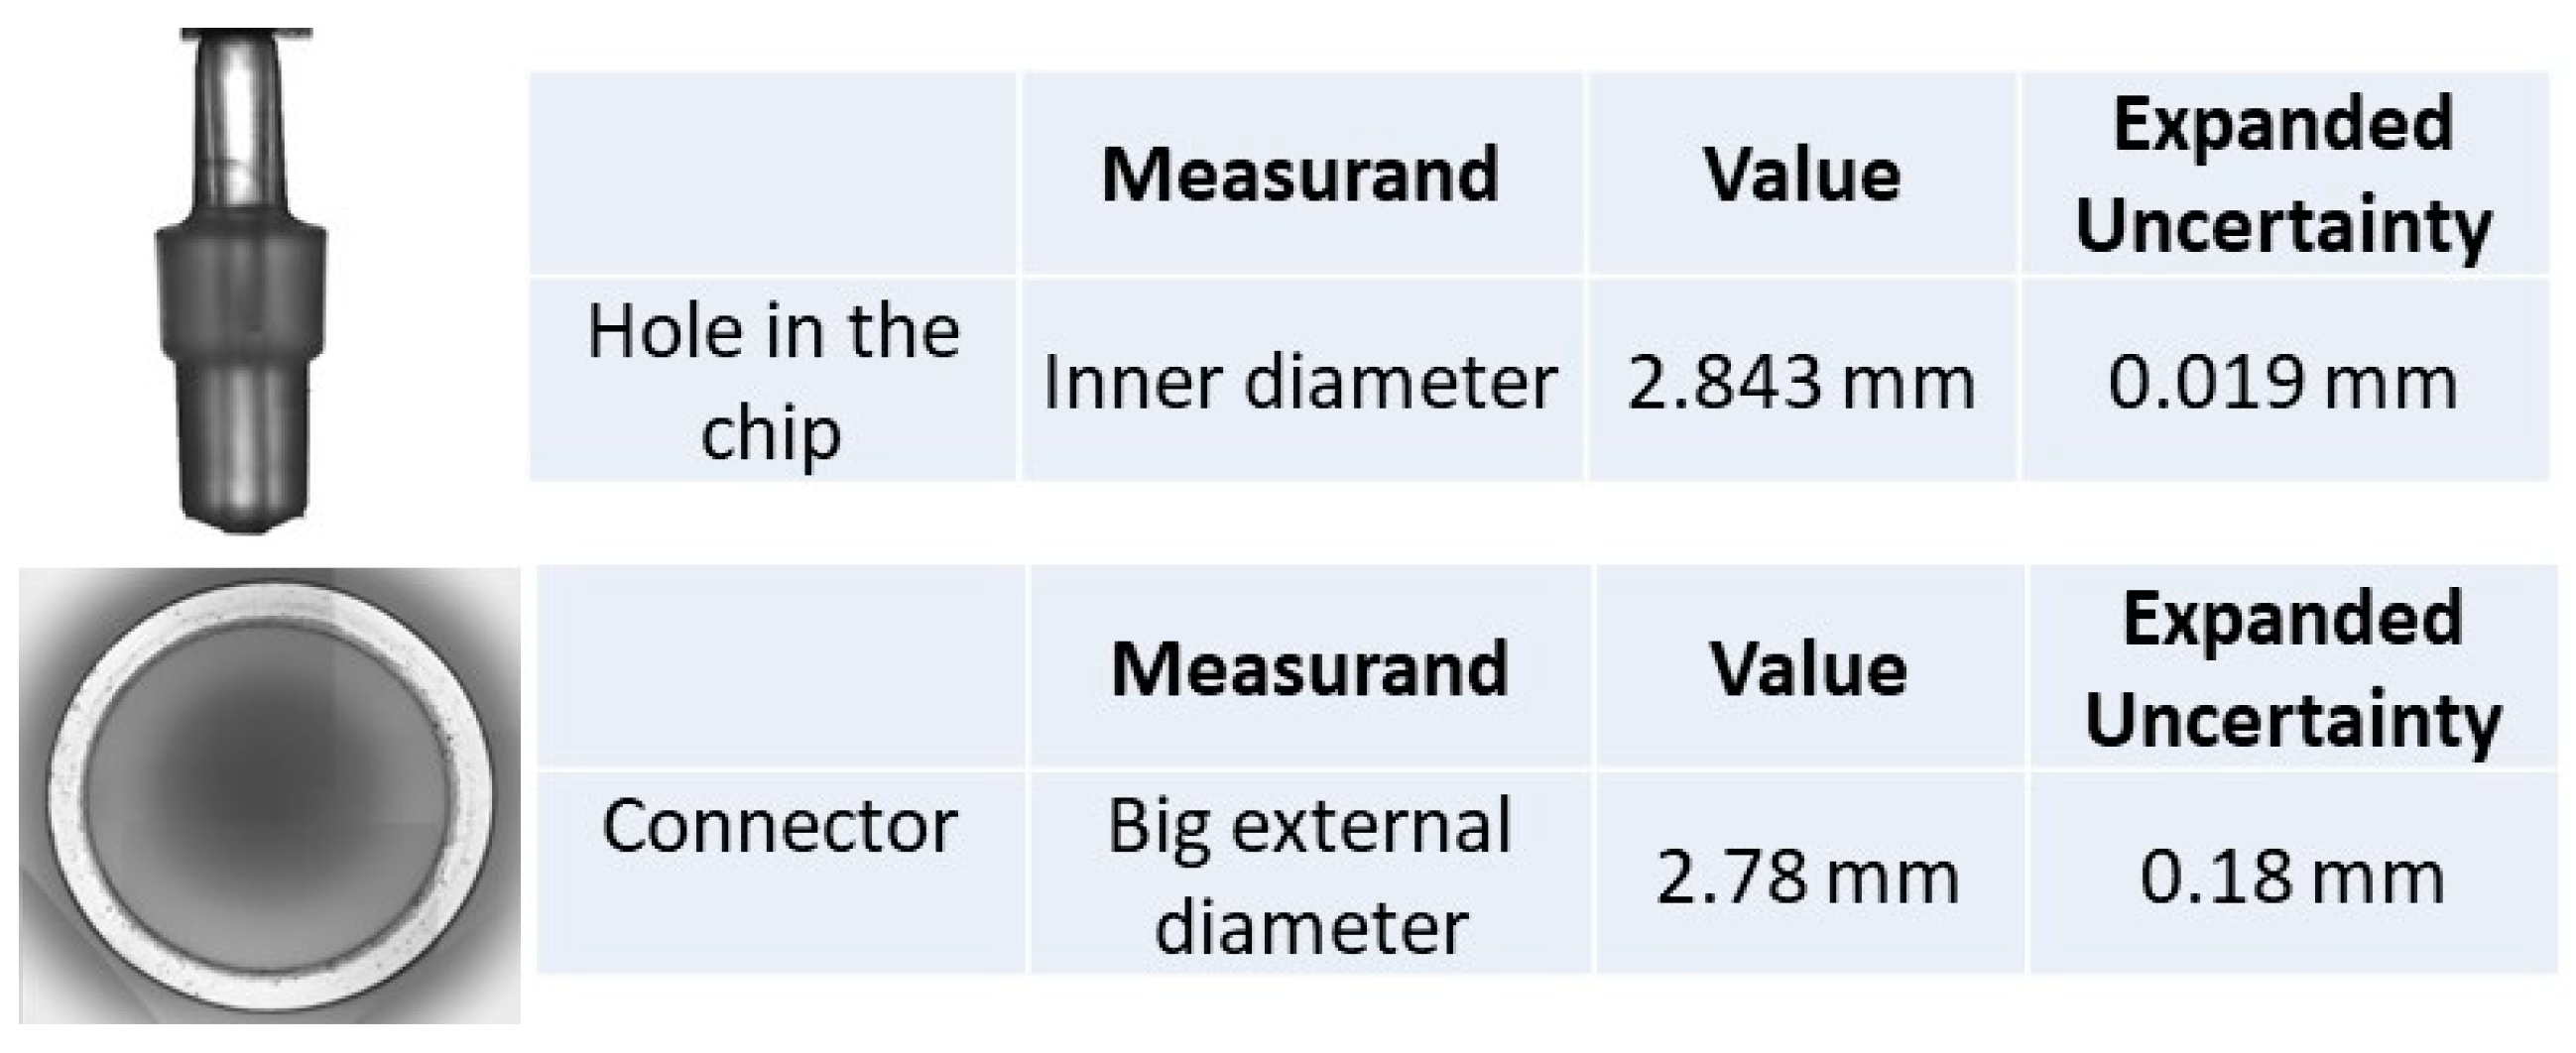
From the results of the Topas chip C connector outer diameter, in Figure 12 and Figure 13, it can be concluded that the latter is smaller than the inner diameter of the hole in the chip. This insufficient match may be the origin of leaks.
Injection-molded COC/COP devices appear to have more uniform dimensions than PDMS. Indeed, the standard deviation obtained for the Topas chip C hole in the chip is almost half the value (0.24%) of the PDMS hole (0.42%).
![Metrology 04 00015 g012]()
![Metrology 04 00015 g013]()
Figure 12.
Topas chip C connector and hole in the chip photographed with the 3D measuring instrument digital camara, and dimensions measured with the HP interferometer; the assembly is shown in Figure 7.
Figure 12.
Topas chip C connector and hole in the chip photographed with the 3D measuring instrument digital camara, and dimensions measured with the HP interferometer; the assembly is shown in Figure 7.
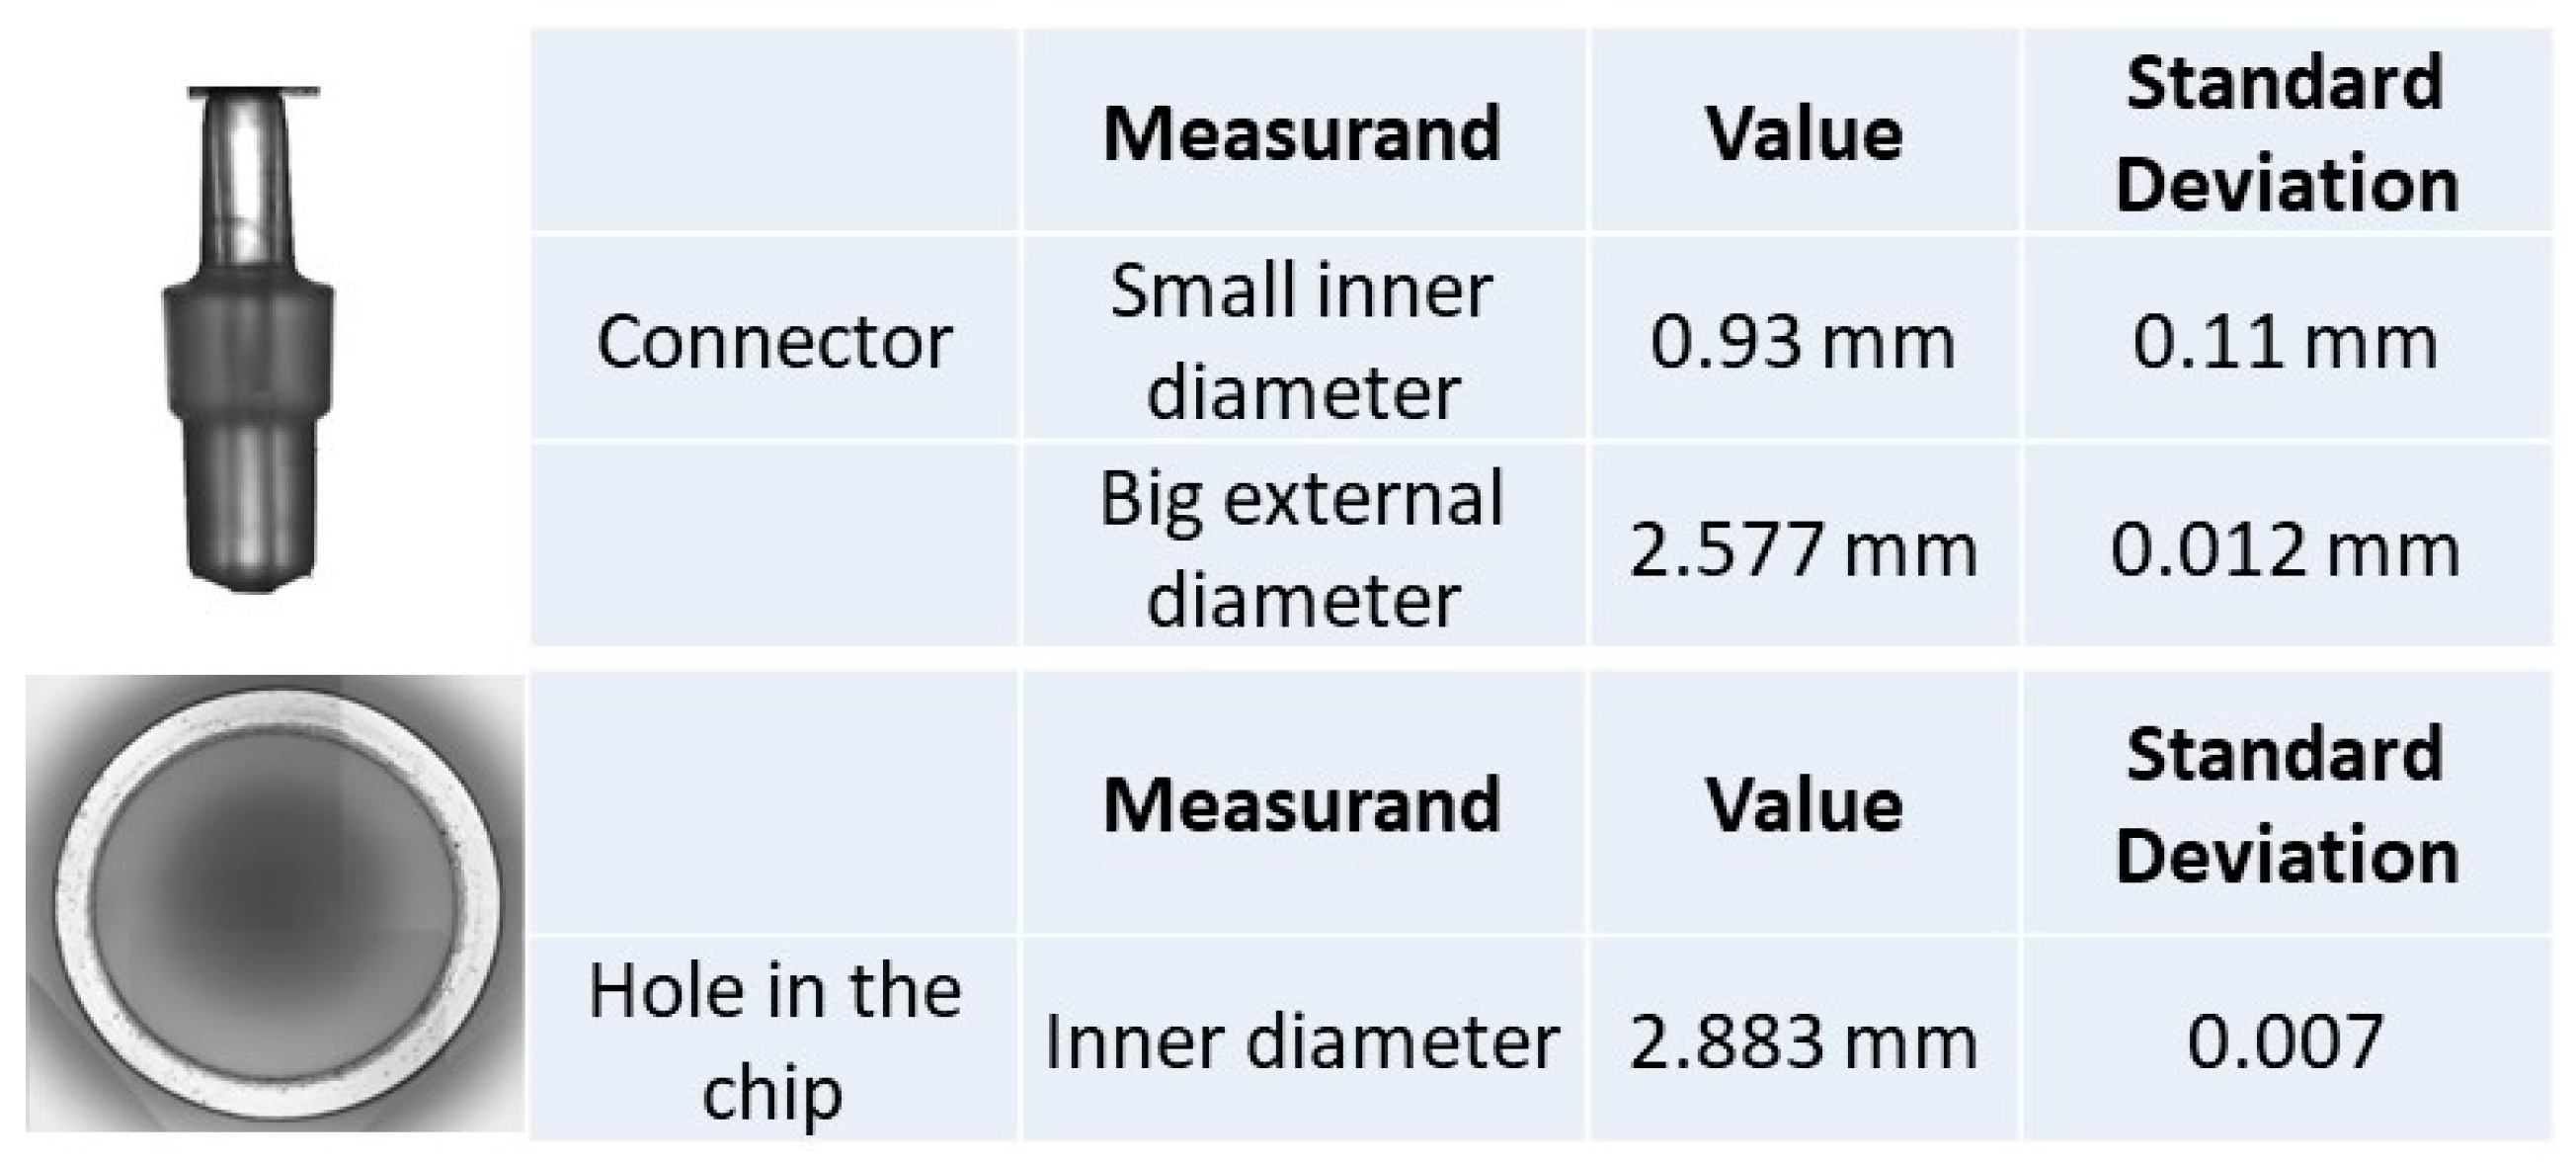
Figure 13.
Topas chip C “connector” and “hole in the chip” photographed with the 3D measuring instrument digital camara, and dimensions measured with the 3D optical measuring instrument; the assembly is shown in Figure 7.
Figure 13.
Topas chip C “connector” and “hole in the chip” photographed with the 3D measuring instrument digital camara, and dimensions measured with the 3D optical measuring instrument; the assembly is shown in Figure 7.
3.2. Flow Results
The flow measurement results, error, and uncertainty for the three different assemblies using the gravimetric method and the front track method are shown in Table 1 and Table 2.
Here, the measurement error is equal to the subtraction of the nominal or read flow value by the measured flow out of the chip value, which is the reference flow value.
The uncertainty calculation was performed according to the GUM procedure [27] and the relevant literature for each method [28,29]. The evaluation of the consistency of the gravimetric and flow track methods was analyzed according to the normalized error statistics (En) [30], and the results are presented in Table 3.
From Table 1, Table 2 and Table 3, it can be observed that small deviations from nominal values were observed for the majority of the tested flow rates. The high error obtained for the smallest flow rates in Chip C (0.01 mL/h) can be explained by leakage occurring due to the incompatibility of dimensions between the connector outer diameter and the hole in the chip inner diameter, as mentioned in Section 3.1.3. In the case of the front track method, the observation of negative flow values corresponds to a situation with a null resulting flow going out of the chip, due to the meniscus moving in the opposite direction of the out-of-the-chip flow. The consistency of the methods was analyzed with the En value statistics. Since the majority of the results evidenced En lower than 1, it can be concluded that they are satisfactory.
4. Final Discussion and Conclusions
The objective of this work was to determine the sizes of the connection port of microfluidic devices and their components using two different methods, a laser interferometer and an optical 3D measuring instrument. One of the aftermaths was to evaluate the possible existence of fluid leaks in each system due to component dimensional incompatibility by determining the flow rate error of different microfluidic systems using the gravimetric and the front track methods.
The length-measured results obtained with the laser interferometer and optical 3D measuring instrument methods were found to be broadly metrologically compatible [31].
For the laser interferometry method, the definition of the measurement plane of the accessories in translucent material presented a technical difficulty due to the equipment available. As a consequence, it was only possible to compute a measurement standard deviation.
Shape deviations inherent to the plastic accessories, such as roundness, cylindricity and translucency, are known to be the main factors responsible for the evidenced standard deviation high values in this study. For instance, it was observed that for a 0.01 μm resolution interferometer, there was a 0.01 mm standard deviation order of magnitude. Indeed, the shape deviations and the constituents being plastic materials make the tubes and connector’s dimensions very difficult to highly accurately measure with the interferometer. Therefore, the measured values may only be associated with standard deviations and not uncertainties.
For the optical 3D measuring instrument, it was possible to calculate the associated uncertainties and images for all accessories, even the translucent ones. Therefore, it can be concluded that using 3D optical measuring instrument is the best measurement method for translucent material. It was also verified that uncertainty values in all dimensional measurements are completely dependent on the component material. The more rigid the material, the smaller the uncertainty.
From the dimensional measurements, Topas chip C, the connector’s outer diameter, was evidenced to be smaller than the hole in the chip’s inner diameter. Consequently, these components are not dimensionally compatible and tightly linked. This may have an influence for potential leakage in the system. This situation was validated by the flow tests.
Flow tests were performed in each chip assembly using the front track method and the gravimetric method in order to verify possible variabilities and advantages of the methods. The consistency of the methods was analyzed using the En value statistics, and it was verified that the majority of the results are satisfactory, i.e., evidencing En values lower than 1. Therefore, no significant difference was found in the performance of each method. As the uncertainty values of both methods are very similar, it can be concluded that both methods can be used for the flow determination of microfluid chips. The flow measurement results obtained also confirm the connection problem in the Topas chip C due to the size incompatibility between the connector and the microfluidic hole, where a leakage could be evidenced in both methods. Within the front track method, the connection problem is even more evident due to the negative values; this means that no flow came out of the chip, and the meniscus was moving in the opposite direction of the flow due to evaporation and negative pressure.
Injection-molded COC/COP devices appear to be more uniform than PDMS, mainly having the outer dimensions of a standard microscope slide or microtiter plate, 1.5 mm port size, and mini-Luers with a pitch of 4.5 mm. It is usually connected to flexible tubing, or a sleeve. These material components also provide better repeatability of measurements in both quantities: flow, and dimensions.
The results of this work directly address the current lack of measurement methods for dimensions of microfluidic structures, especially after assembly, by providing a comprehensive comparison of different protocols, ultimately suggesting a preferred option for immediate application within the microfluidic industry. Future work can be performed with glass chips and different microfluidic components.
Author Contributions
Conceptualization, E.B. Methodology, E.B. and F.S., A.L., V.S. and L.M.; formal analysis, E.B.; investigation, E.B., F.S., A.L. and L.M.; resources, E.B., F.S. and L.M.; data curation, E.B.; writing—E.B., F.S., L.M. and V.S. review and editing, R.F.M., J.A.e.S. and E.B.; visualization, R.F.M. and J.A.e.S.; supervision, E.B.; project administration, E.B.; funding acquisition, E.B. All authors have read and agreed to the published version of the manuscript.
Funding
This work was performed under project 20NRM02 MFMET that has received funding from the EMPIR program co-financed by the participating States and from the European Union’s Horizon 2020 research and innovation program.
Data Availability Statement
The data presented in this study are available on request from the corresponding author.
Acknowledgments
This project (20NRM02 MFMET) has received funding from the EMPIR program co-financed by the Participating States and from the European Union’s Horizon 2020 research and innovation program. The authors would like to thanks to Microfluidic ChipShop, a partner of MFMET project, for providing Topas plates and connectors used in this paper. The authors also acknowledge Fundação para a Ciência e a Tecnologia for its financial support through the UNIDEMI projects UIDB/00667/2020 and UIDP/00667/2020. INESC MN acknowledges FCT for funding of the Research Unit (UID/05367/2020) through pluriannual BASE and PROGRAMATICO and program grant PTDC-FIS-PLA/31055/2017. We would like to thank Olivier Pellegrino from IPQ for is extensive editorial and language revision.
Conflicts of Interest
The authors declare no conflicts of interest.
References
- ISO 22916:2022; Microfluidic Devices—Interoperability Requirements for Dimensions, Connections and Initial Device Classification. ISO: Geneva, Switzerland, 2022.
- Azizipour, N.; Avazpour, R.; Rosenzweig, D.H.; Sawan, M.; Ajji, A. Evolution of Biochip Technology: A Review from Lab-on-a-Chip to Organ-on-a-Chip. Micromachines 2020, 11, 599. [Google Scholar] [CrossRef] [PubMed]
- Grayson, A.C.R.; Shawgo, R.S.; Johnson, A.M.; Flynn, N.T.; Li, Y.; Cima, M.J.; Langer, R. A BioMEMS review: MEMS technology for physiologically integrated devices. Proc. IEEE 2004, 92, 6–21. [Google Scholar] [CrossRef]
- Silverio, V.; Cardoso, S. Lab-on-a-chip: Systems integration at the microscale. In Drug Delivery Devices and Therapeutic Systems; Elsevier Science: Amsterdam, The Netherlands, 2021; Chapter E; ISBN 978-0-12-819838-4. [Google Scholar]
- Leung, C.M.; de Haan, P.; Ronaldson-Bouchard, K.; Kim, G.-A.; Ko, J.; Rho, H.S.; Chen, Z.; Habibovic, P.; Jeon, N.L.; Takayama, S.; et al. A guide to the organ-on-a-chip. Nat. Rev. Methods Prim. 2022, 2, 33. [Google Scholar] [CrossRef]
- Huh, D.; Leslie, D.C.; Matthews, B.D.; Fraser, J.P.; Jurek, S.; Hamilton, G.A.; Thorneloe, K.S.; McAlexander, M.A.; Ingber, D.E. A human disease model of drug toxicity–induced pulmonary edema in a lung-on-a-chip microdevice. Sci. Transl. Med. 2012, 4, ra147–ra159. [Google Scholar] [CrossRef] [PubMed]
- Bhatia, S.N.; Ingber, D.E. Microfluidic organs-on-chips. Nat. Biotechnol. 2014, 32, 760–772. [Google Scholar] [CrossRef] [PubMed]
- Berlanda, S.F.; Breitfeld, M.; Dietsche, C.L.; Dittrich, P.S. Recent Advances in Microfluidic Technology for Bioanalysis and Diagnostics. Anal. Chem. 2021, 93, 311–331. [Google Scholar] [CrossRef] [PubMed]
- Paik, S.; Kim, G.; Chang, S.; Lee, S.; Jin, D.; Jeong, K.Y.; Lee, I.S.; Lee, J.; Moon, H.; Lee, J.; et al. Near-Field Sub-Diffraction Photolithography with an Elastomeric Photomask. Nat. Commun. 2020, 11, 805. [Google Scholar] [CrossRef] [PubMed]
- Vanderpoorten, O.; Peter, Q.; Challa, P.K.; Keyser, U.F.; Baumberg, J.; Kaminski, C.F.; Knowles, T.P.J. Scalable Integration of Nano-, and Microfluidics with Hybrid Two-Photon Lithography. Microsyst. Nanoeng. 2019, 5, 4020. [Google Scholar] [CrossRef] [PubMed]
- Li, W.; Yu, M.; Sun, J.; Mochizuki, K.; Chen, S.; Zheng, H.; Li, J.; Yao, S.; Wu, H.; Ong, B.S.; et al. Crack Engineering for the Construction of Arbitrary Hierarchical Architectures. Proc. Natl. Acad. Sci. USA 2019, 116, 23909–23914. [Google Scholar] [CrossRef] [PubMed]
- Schmidt-Speicher, L.M.; Länge, K. Microfluidic integration for electrochemical biosensor applications. Curr. Opin. Electrochem. 2021, 29, 100755. [Google Scholar] [CrossRef]
- Fernández-la-Villa, A.; Pozo-Ayuso, D.F.; Castaño-Álvarez, M. Microfluidics and electrochemistry: An emerging tandem for next-generation analytical microsystems. Curr. Opin. Electrochem. 2019, 15, 175–185. [Google Scholar] [CrossRef]
- Manz, A.; Graber, N.; Widmer, H.M. Miniaturized Total Chemical Analysis Systems: A Novel Concept for Chemical Sensing. Sens. Actuators B 1990, 1, 244–248. [Google Scholar] [CrossRef]
- Available online:. https://Mfmet.eu (accessed on 26 February 2024).
- Batista, E.; Alves e Sousa, J.; Cardoso, S.; Silverio, V. Experimental testing for metrological traceability and accuracy of liquid microflows and microfluidics. Flow Meas. Instrum. 2021, 71, 101691. [Google Scholar] [CrossRef]
- Bissig, H.; Petter, H.T.; Lucas, P.; Batista, E.; Filipe, E.; Almeida, N.; Ribeiro, L.F.; Gala, J.; Martins, R.; Savanier, B.; et al. Primary standards for measuring flow rates from 100 nL/min to 1 mL/min—Gravimetric principle. Biomed. Eng. 2015, 60, 301–316. [Google Scholar] [CrossRef] [PubMed]
- Batista, E.; Sousa, J.A.; Alvares, M.; Afonso, J.; Martins, R. Development of an experimental setup for micro flow measurement using the front tracking method. Meas. Sens. 2021, 18, 100152. [Google Scholar] [CrossRef]
- Boudaoud, A.W.; McGraw, J.D.; Lopez-Leon, T.; Ogheard, F. Traceability of the primary Nano-flow measurement System: Measuring the local inner diameter of a glass capillary. Measurement 2023, 218, 113141. [Google Scholar] [CrossRef]
- Zuo, C.; Qian, J.; Feng, S.; Yin, W.; Li, Y.; Fan, P.; Han, J.; Qian, K.; Chen, Q. Deep learning in optical metrology: A review. Light Sci. Appl. 2022, 11, 39. [Google Scholar] [CrossRef] [PubMed]
- Gåsvik, K.J. Optical Metrology, 3rd ed.; Wiley: Hoboken, NJ, USA, 2002. [Google Scholar]
- Yoshizawa, T. Handbook of Optical Metrology: Principles and Applications, 2nd ed.; CRC Press: Boca Raton, FL, USA, 2017. [Google Scholar]
- Hariharan, P. Basics of Interferometry; Elsevier Inc.: New York, NY, USA, 2007. [Google Scholar]
- Donges, A.; Noll, R. Laser Measurement Technology—Fundamentals and Applications; Springer: Berlin, Germany, 2014; ISBN 978-3-662-43633-2. [Google Scholar]
- Engel, T. 3D optical measurement techniques. 2023 Meas. Sci. Technol. 2002, 34, 032002. [Google Scholar] [CrossRef]
- Su, X.; Zhang, Q. Dynamic 3-D shape measurement method: A review. Opt. Laser Eng. 2010, 48, 191–204. [Google Scholar] [CrossRef]
- JCGM 100:2008; BIPM, IEC, IFCC, ILAC, ISO, IUPAC, IUPAP, and OIML, Evaluation of Measurement Data—Guide to the Expression of Uncertainty in Measurement. BIPM: Paris, France, 2008.
- Batista, E. Innovative Contributions on Calibration Methodologies towards Reliable Microflow Measurements. Ph.D. Thesis, Mechanical Engineering, FCT/UNL, Caparica, Portugal, 2022. [Google Scholar]
- Ahrens, M.; Klein, S.; Nestler, B.; Damiani, C. Design, uncertainty assessment of a setup for calibration of microfluidic devices down to 5 nL min−1. Meas. Sci. Technol. 2014, 25, 015301. [Google Scholar] [CrossRef]
- ISO 13528:2022; Statistical Methods Used in Proficiency Testing by Interlaboratory Comparisons. ISO: Geneva, Switzerland, 2022.
- JCGM 200:2012; BIPM, IEC, IFCC, ILAC, ISO, IUPAC, IUPAP, and OIML, International Vocabulary of Metrology|BASIC and General Concepts and Associated Terms (VIM). Joint Committee for Guides in Metrology: Paris, France, 2012.
Figure 1.
Measurement setup using the HP laser interferometry, the SIP 3 m bench, and the stereomicroscope. (a) SIP bench (1) and it’s carriage (2) coupled with the stereomicroscope (3) and the HP mobile retroreflector (4). (b) HP control unit (5), the HP laser head (6) fixed to the SIP bench (7), the linear interferometer (8), and the stereomicroscope (without photographic camera) coupled to the carriage and the microfluidic component (9) to be measured in the top of an alignment system.
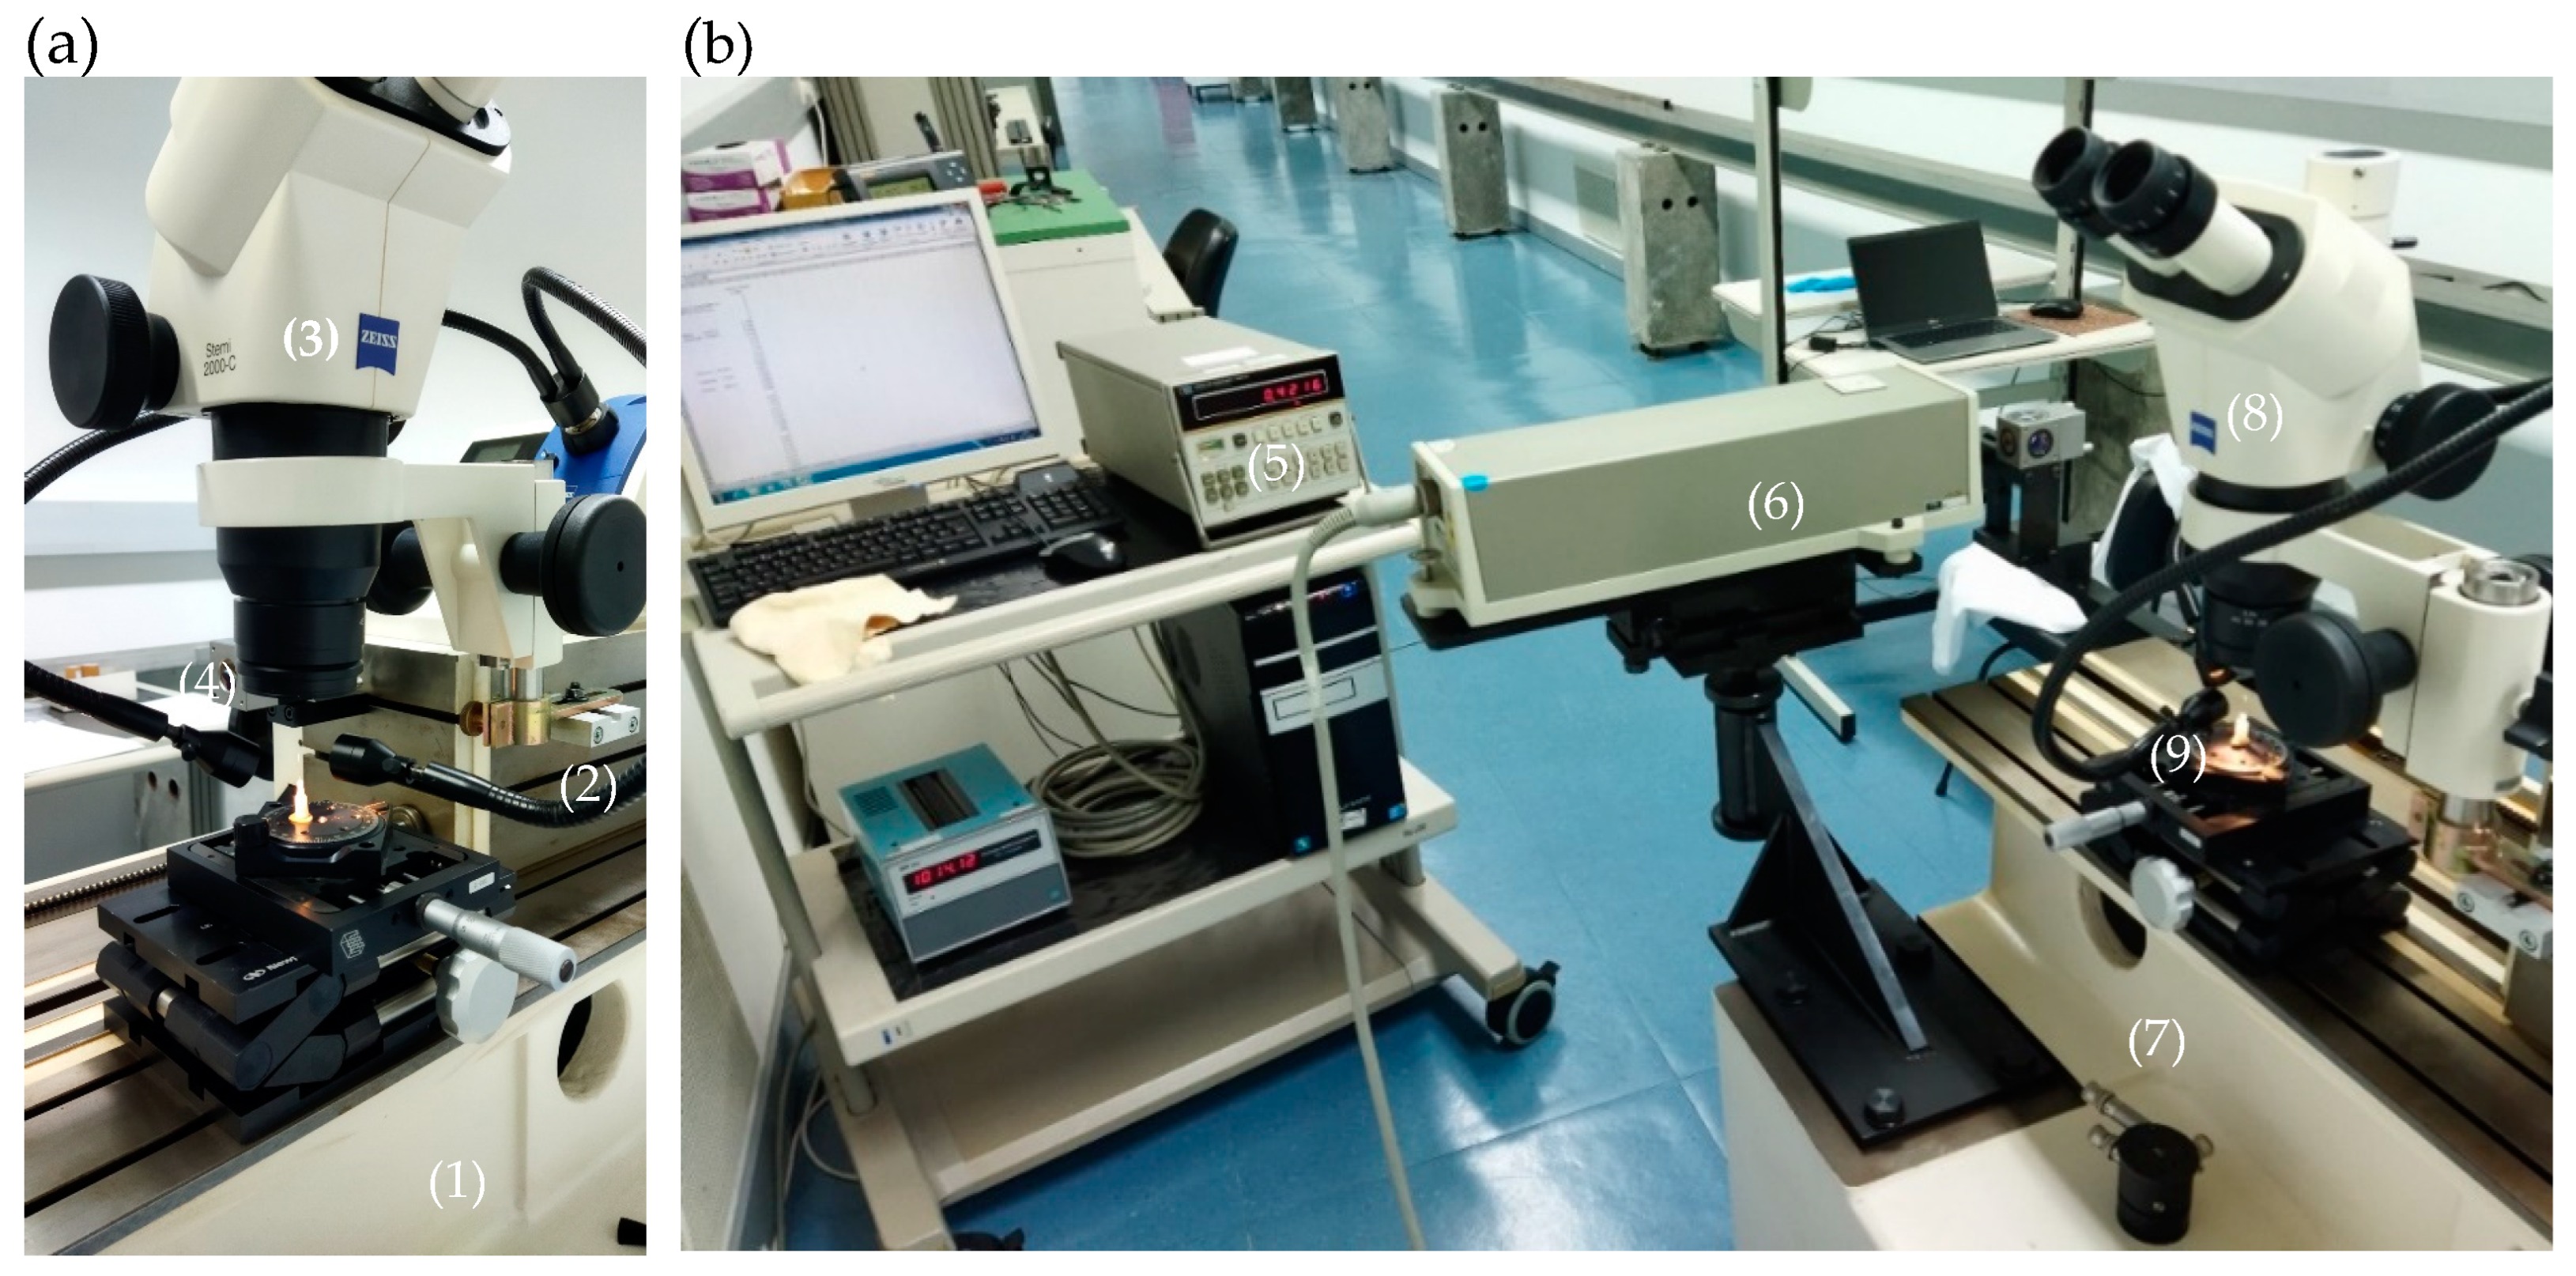
Figure 2.
Three-dimensional optical measuring instrument and corresponding examples of use.
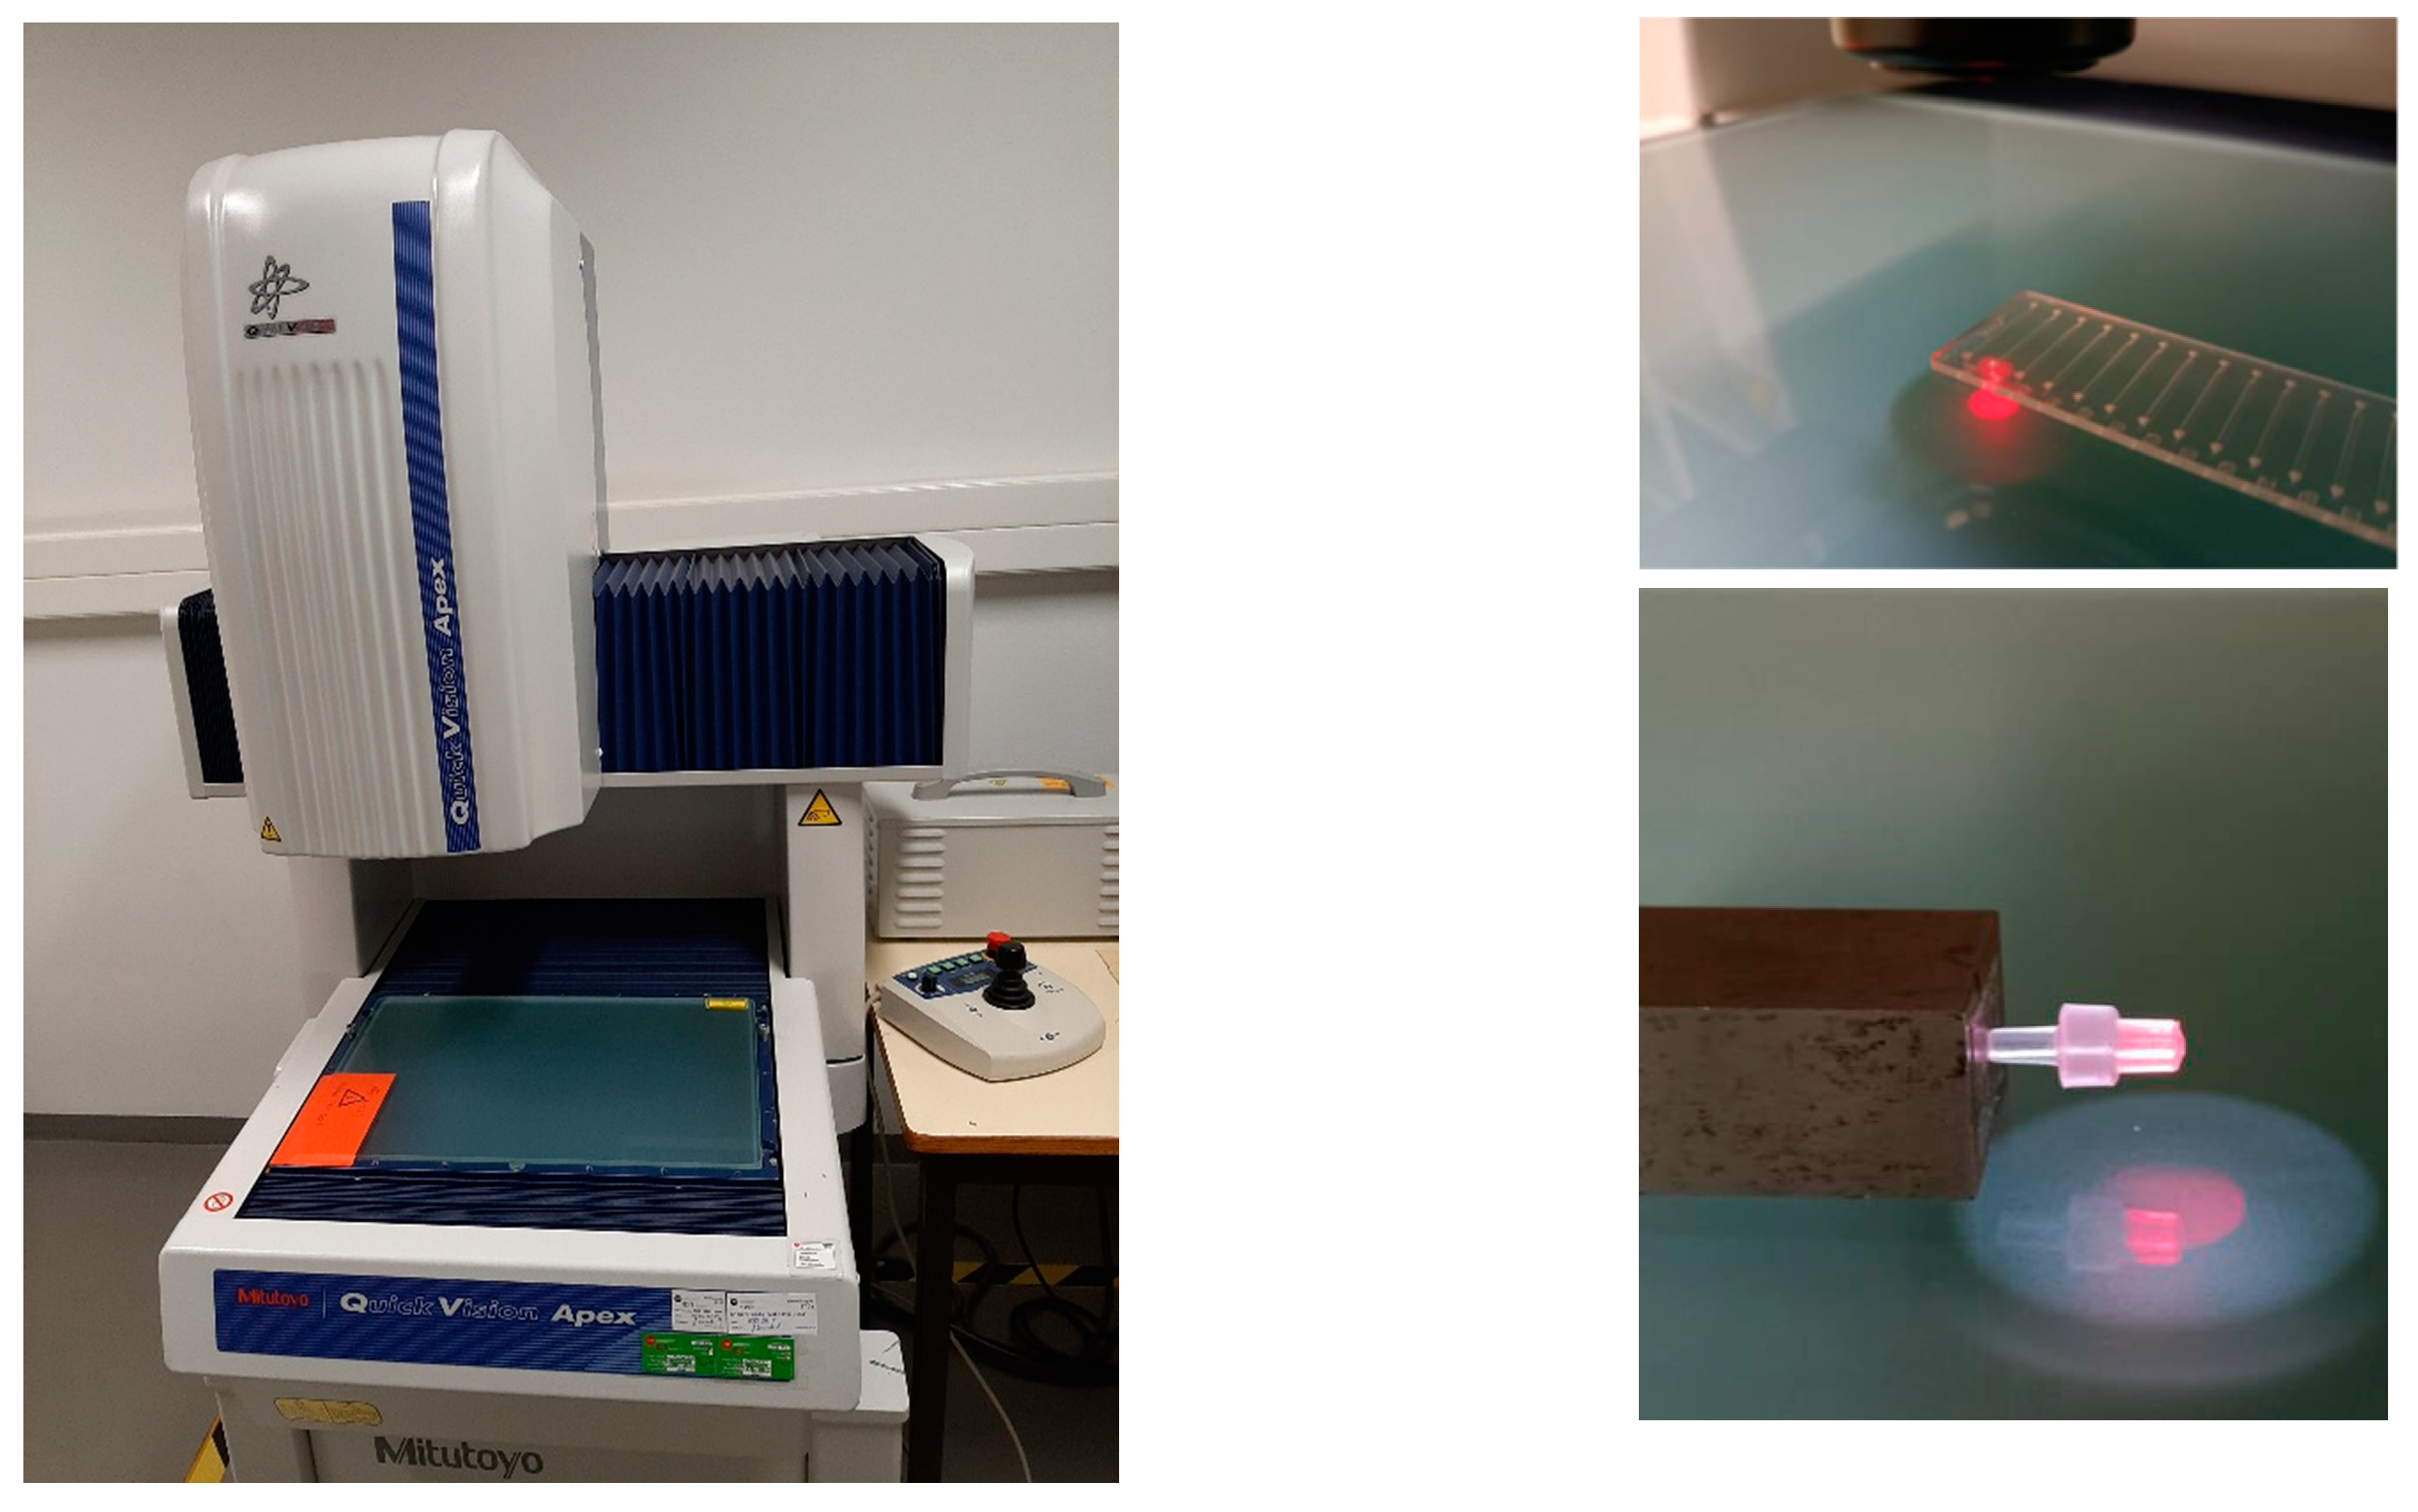
Figure 3.
Gravimetric flow measurement setup.
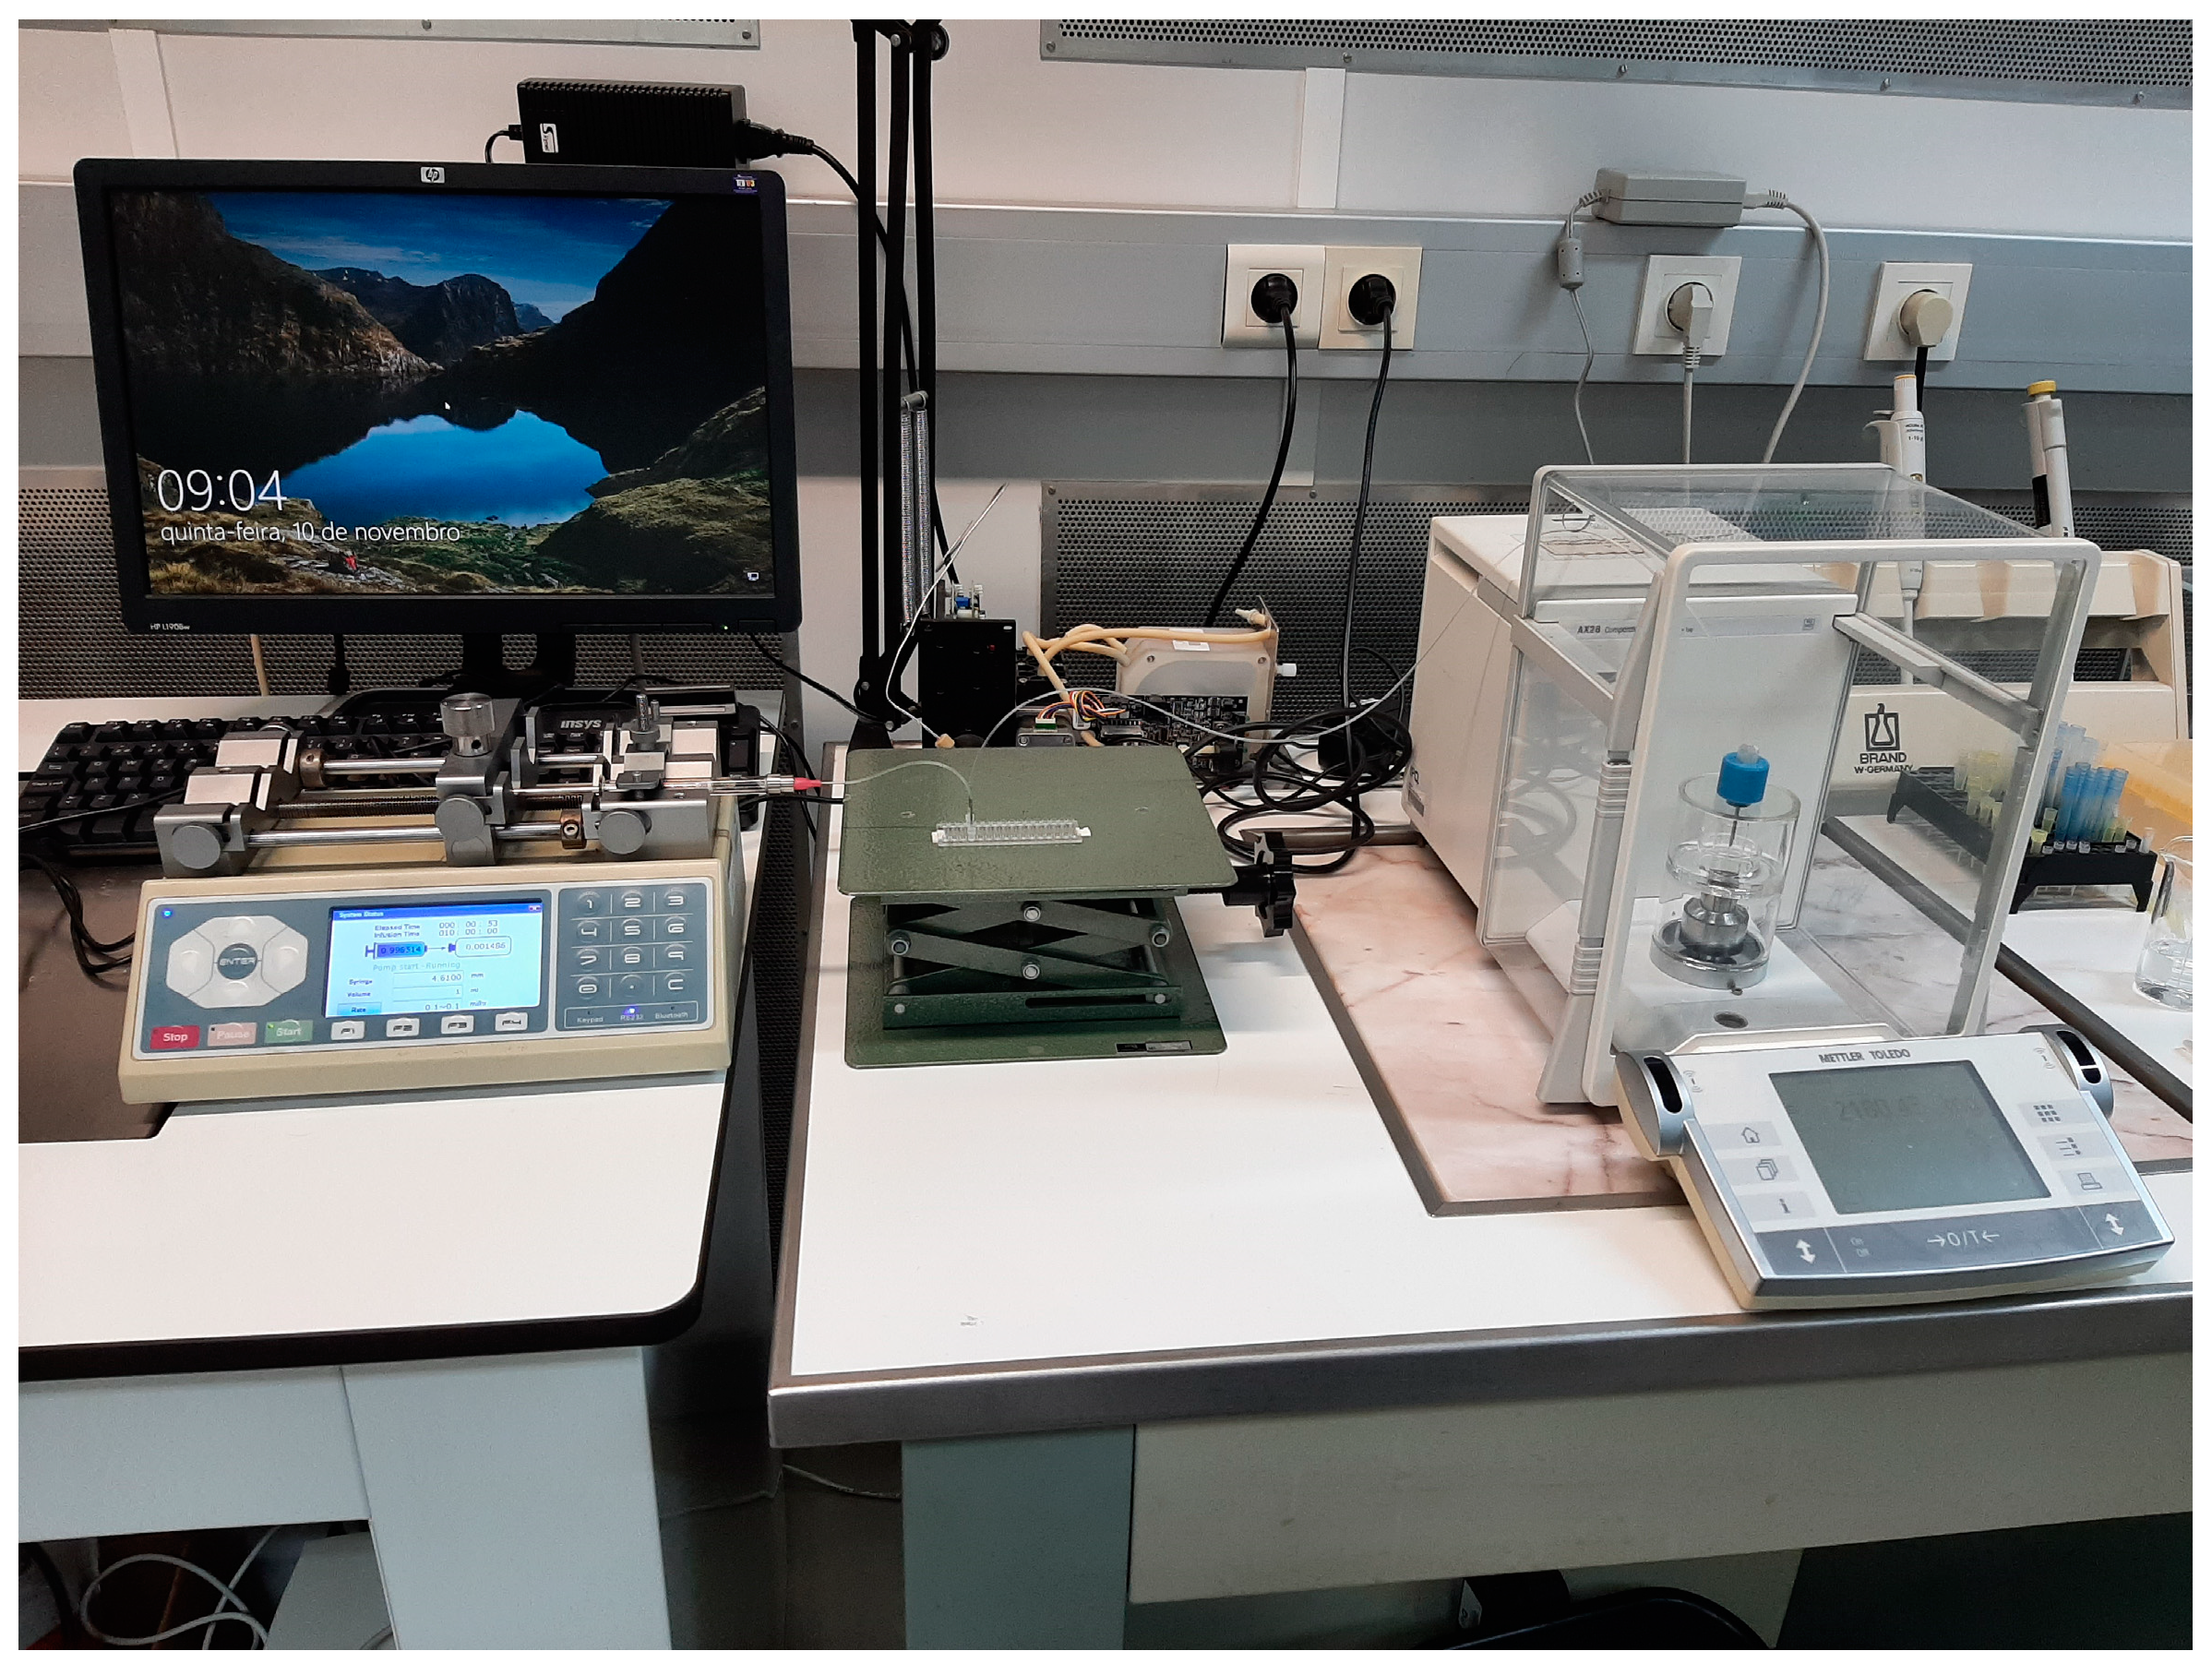
Figure 4.
Front track flow measurement setup.

Figure 5.
PDMS chip and correspondent assembly.
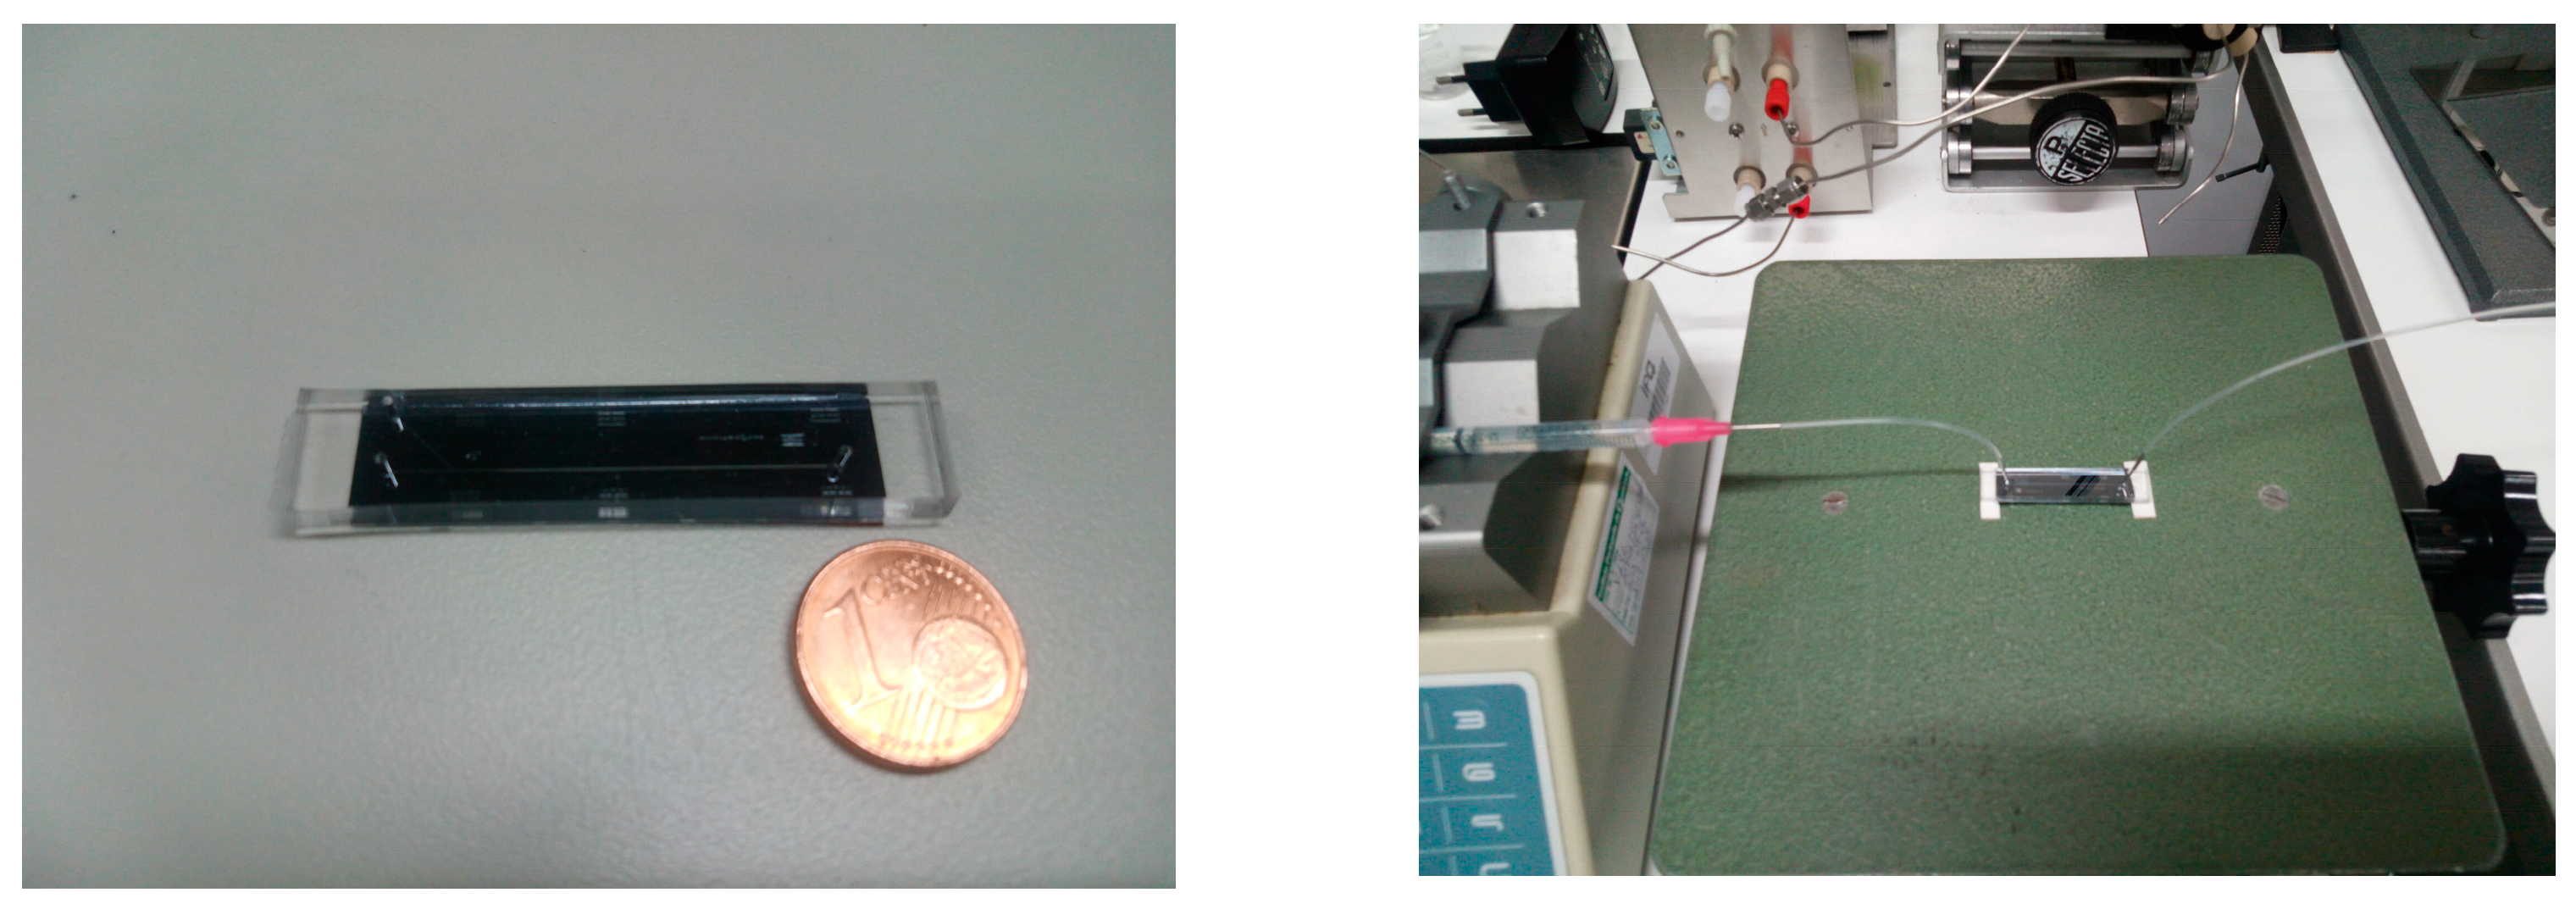
Figure 6.
TOPAS® chip A and correspondent assembly.
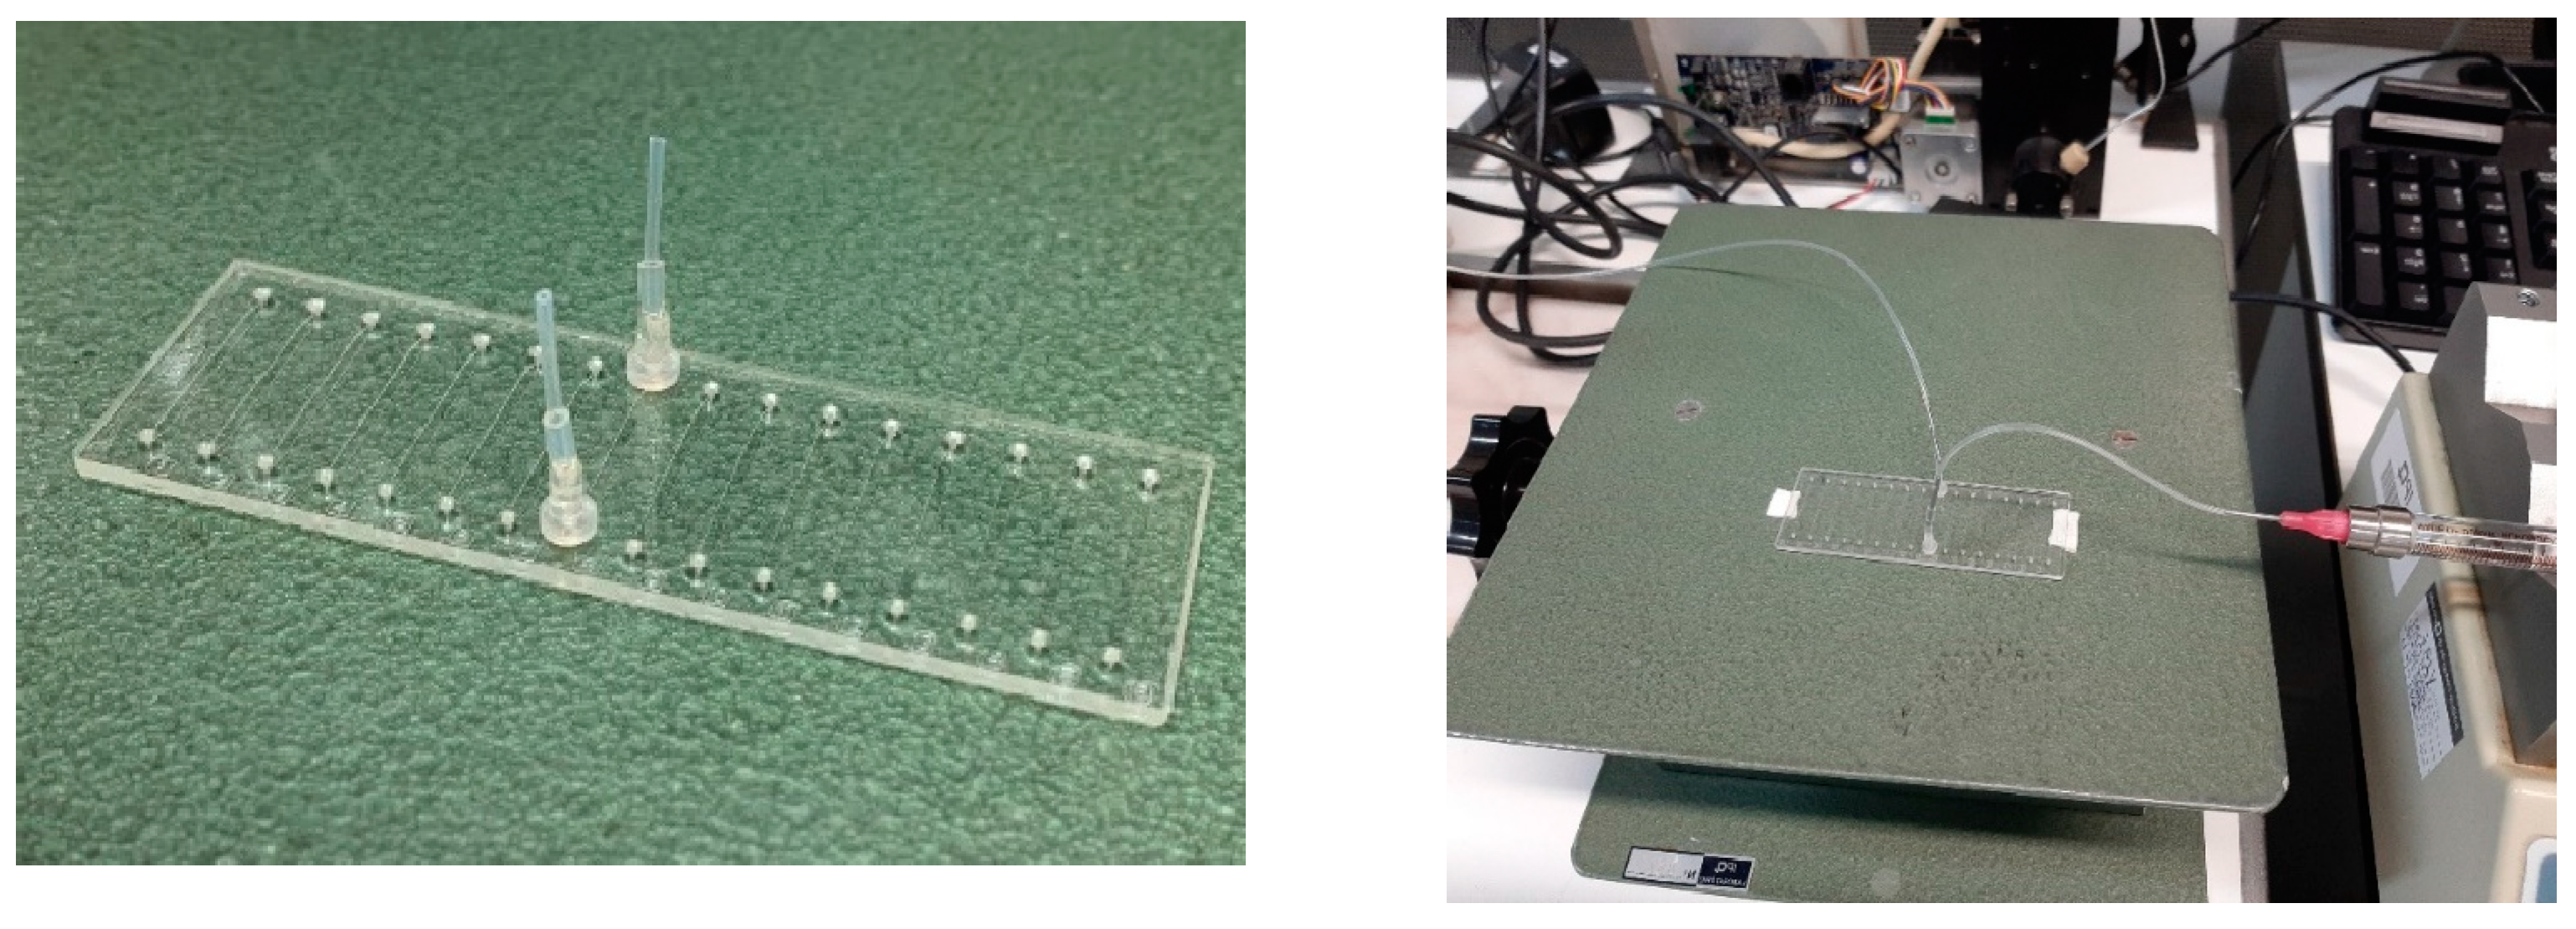
Figure 7.
TOPAS® chip C and correspondent assembly.

Table 1.
Experimental flow results obtained with the gravimetric method.
| Gravimetric Method | ||||
|---|---|---|---|---|
| Chip | Nominal Flow, FN/(mL/h) | Measured Out of Chip Flow, Fmeas/(mL/h) | Error, E/% | U/% |
| PDMS | 0.001 | 0.0011 | 11.94 | 25 |
| 0.01 | 0.0107 | 4.84 | 4.1 | |
| 0.1 | 0.0907 | 8.17 | 2.5 | |
| 1 | 0.8875 | 0.55 | 2.4 | |
| A | 0.01 | 0.0099 | −1.0 | 5.0 |
| 0.1 | 0.0983 | −1.7 | 3.8 | |
| 1 | 0.9907 | −0.93 | 0.19 | |
| C | 0.01 | 0.0069 | −31 | 5 |
| 0.1 | 0.0970 | −2.6 | 3.4 | |
| 1 | 1.0170 | 1.7 | 3.0 | |
Table 2.
Experimental flow results obtained with the front track method.
| Front Track Method | ||||
|---|---|---|---|---|
| Chip | Nominal Flow, FN/(mL/h) | Measured Out of Chip Flow, Fmeas/(mL/h) | Error, E/% | U/% |
| PDMS | 0.001 | −0.0014 | 241.3 | 14.0 |
| 0.01 | 0.0113 | −13.3 | 3.3 | |
| 0.1 | 0.0961 | 3.9 | 2.6 | |
| 1 | 1.0257 | −2.6 | 4.0 | |
| A | 0.01 | 0.0095 | 5.0 | 3.7 |
| 0.1 | 0.0967 | 3.3 | 2.8 | |
| 1 | 0.9819 | 1.8 | 6.2 | |
| C | 0.01 | −0.0033 | 133.0 | 43 |
| 0.1 | 0.0996 | 0.4 | 1.9 | |
| 1 | 1.0259 | −2.6 | 4.0 | |
Table 3.
Flow experimental consistency analysis of results obtained with the gravimetry and front track methods.
Table 3.
Flow experimental consistency analysis of results obtained with the gravimetry and front track methods.
| Chip | Nominal Flow, FN/(mL/h) | En |
|---|---|---|
| PDMS | 0.001 | 8.10 |
| 0.01 | −3.50 | |
| 0.1 | −1.20 | |
| 1 | 0.67 | |
| A | 0.01 | −0.65 |
| 0.1 | −0.34 | |
| 1 | −0.14 | |
| C | 0.01 | −2.34 |
| 0.1 | 0.55 | |
| 1 | 0.18 |
Disclaimer/Publisher’s Note: The statements, opinions and data contained in all publications are solely those of the individual author(s) and contributor(s) and not of MDPI and/or the editor(s). MDPI and/or the editor(s) disclaim responsibility for any injury to people or property resulting from any ideas, methods, instructions or products referred to in the content. |
© 2024 by the authors. Licensee MDPI, Basel, Switzerland. This article is an open access article distributed under the terms and conditions of the Creative Commons Attribution (CC BY) license (https://creativecommons.org/licenses/by/4.0/).
Share and Cite
MDPI and ACS Style
Batista, E.; Alves e Sousa, J.; Saraiva, F.; Lopes, A.; Silverio, V.; Martins, R.F.; Martins, L. The Importance of Dimensional Traceability in Microfluidic Systems. Metrology 2024, 4, 240-253. https://doi.org/10.3390/metrology4020015
AMA Style
Batista E, Alves e Sousa J, Saraiva F, Lopes A, Silverio V, Martins RF, Martins L. The Importance of Dimensional Traceability in Microfluidic Systems. Metrology. 2024; 4(2):240-253. https://doi.org/10.3390/metrology4020015
Chicago/Turabian StyleBatista, Elsa, João Alves e Sousa, Fernanda Saraiva, André Lopes, Vania Silverio, Rui F. Martins, and Luis Martins. 2024. "The Importance of Dimensional Traceability in Microfluidic Systems" Metrology 4, no. 2: 240-253. https://doi.org/10.3390/metrology4020015