1. Introduction
The coronavirus disease 2019 (COVID-19) pandemic caused by the novel severe acute respiratory syndrome coronavirus 2 (SARS-CoV-2) wreaked havoc on communities, economies, and healthcare systems as the virus infected over 771 million people and contributed to the deaths of more than 6.9 million people as reported to the World Health Organization as of 8 November 2023 [
1]. As the virus evolved newer strains, transmission rates, symptoms, and treatment efficacy also changed. The first case of COVID-19 in Idaho was confirmed on 12 March 2020 by the Idaho Department of Health and Welfare. Since the beginning of the pandemic, a total of 522,919 cases have been reported in Idaho [
2]. The impact of the pandemic on Idaho was substantial. The Idaho Department of Health and Welfare issued three separate Crisis Standards of Care declarations during the pandemic, as intensive care units were pushed beyond their limits and emergency care had to be rationed. COVID-19 infections contributed to the deaths of 5582 Idahoans, or 1 in 328 residents [
3].
Idaho features a low population density within a relatively large geographical region, which can create economic and social challenges. Southwest Idaho includes a small metro area with fewer than 1 million residents surrounded by extensive frontier and remote (FAR) regions [
4], with the nearest metropolitan areas more than 350 miles away in any direction. The low population density and frontier and remote characteristics put the intermountain west at risk of being an understudied region during the SARS-CoV-2 pandemic. As genomic surveillance efforts to monitor the pandemic quickly became mainstream, the bulk of resources and efforts were concentrated in highly populous, urban areas. Understanding the effects of the pandemic in sparsely populated states is crucial because there are unique challenges and considerations associated with these regions. To better understand how the COVID-19 pandemic evolved in Southwest Idaho, this study analyzes the sequences of COVID19-positive samples collected from the Genetics and Infectious Disease Laboratory at Boise State University and the Biology Department at Northwest Nazarene University. The two southwest Idaho counties (Ada and Canyon) from which most of the samples are obtained are part of the Census Bureau’s Boise Metropolitan Statistical Area and are designated as Health Professional Shortage Areas and a Medically Underserved Area [
5] and comprise approximately 40% of the population of the state of Idaho. The population density is 420 people per square mile in these two counties compared to the statewide density of 22 people per square mile [
6]. Here, we report the results of the genomic surveillance in Southwest Idaho, among college-aged students, university staff and faculty, local preK-12 students and teachers, and state employees in Southwest Idaho.
2. Materials and Methods
2.1. Surveillance Testing
Northwest Nazarene University, Nampa, Idaho, and Boise State University, Boise, Idaho, athletes and staff participating in NCAA sports were tested weekly. Several preK-12 schools in the valley opted to test weekly as well. Students residing in dormitories were tested after arriving on campus prior to the 2021–2022 Fall semester and after holiday travel. Individuals working on campus and commuting students taking on-campus classes were tested as they deemed necessary. The Boise State Public Health testing center tested individuals from local businesses, state and local government employees, and arts organizations, as well as community members in general. Northwest Nazarene University offered daily options for asymptomatic screening for all faculty and students taking classes and working on campus (symptomatic individuals were asked to test at the campus wellness center). Businesses or groups concerned about an outbreak requested on-site testing. Patient demographics and self-reported symptoms were collected.
2.2. Sample Collection
Two types of collection methods were used. Patients’ saliva was collected into a sterile 15 mL tube. Anterior nasal swabs were collected by patients after receiving instructions to swab each nasal cavity with a nylon fiber swab for 15 s and then to place the sample into 3 mL of viral transport media in a sterile tube. The tests were transported to the laboratory and stored at room temperature (saliva samples) or at 4 °C (anterior nasal samples) until further analysis.
2.3. Screening for SARS-CoV-2
Screening tests included the following: Yale’s SalivaDirect™ PCR Assay (SD)1, TaqMan One-Step RT-PCR master mix (Applied Biosystems™, #A15300, Waltham, MA, USA), TaqPath™ COVID-19 Combo Kit (TP) (Applied Biosystems™, #A47814), and the TaqPath™ COVID-19, FluA, FluB Combo Kit (TP-CF) (Applied Biosystems™, #A47814). For the SD test [
7], “Workflow 1” was used with ThermoFisher Scientific MagMAX™ Viral/Pathogen Proteinase K (Thermo Fisher, #A42363, Waltham, MA, USA). All samples were run on a QuantStudio™ 5 Real-Time PCR System, using 96 well plates and a volume of 0.1 mL (Applied Biosystems™: #A28568). Samples with CT < 40 were considered positive for COVID-19 and were aliquoted and stored at −80 °C. Samples with CT < 35 were sequenced.
2.4. Sample Sequencing
RNA extraction was performed with a KingFisher™ Flex using the MagMAX™ Viral/Pathogen II (MVP II) Nucleic Acid Isolation Kit (Applied Biosystems™, #A48383), and sequenced on an Illumina NextSeq 1000 using Illumina’s COVIDSeq™ Assay (Illumina, #20049393) and a P2/300 cycle reagent kit (Illumina, #4462230). Illumina COVIDSeq™ v4 Primer Pools were used for sequencing (Illumina, #20065135) (San Diego, CA USA). Library quantity was determined using the Qubit™ 4 Fluorometer with the 1× dsDNA HS Assay Kit (Invitrogen, #Q33231) (Waltham, MA, USA). A 2% PhiX spike-in was added for quality control.
2.5. Genomic Data Analysis
Sequences were analyzed with the DRAGEN COVID Lineage (version 3.5.12) pipeline on Illumina’s BaseSpace hub. The DRAGEN COVID Lineage analysis involves the Kmer-based detection of SARS-CoV-2, the alignment of reads to a reference genome, variant calls, and the generation of consensus genome sequences. This pipeline used the applications Pangolin [
8] and Nextclade [
9] to analyze the lineage and clade, respectively. Sequences that failed the DRAGEN default quality control analysis, most likely due to low virus titers in the original sample, were removed from the study. Sequences were aligned to GenBank’s “Wuhan-Hu-1/2019” root sequence with a custom-built reference dataset of 21,094 sequences deposited in the Global Initiative on Sharing All Influenza Data (GISAID) with collection dates between January 2020 and 7 May 2022. These represented samples from 36 US states, excluding Idaho (Nextstrain 4.2.0), to determine the lineage and clade. Sequences with the requisite metadata were uploaded to GISAID. All clade and lineage nomenclature used the Pango system with common names (Delta, Omicron) [
10].
2.6. Phylogenic Analysis
SARS-CoV-2 phylogeny was reconstructed with Augur and visualized with Auspice using the Nextstrain pipeline (
https://github.com/nextstrain/ncov; release version 12 (accessed on 1 January 2023)) [
11]. We included all 1717 sequences for the Nextstrain analysis.
2.7. Data Cleaning
Demographic data were aligned with the genomic samples and files were uploaded to GISAID and the National Center for Biotechnology Information (NCBI). Duplicates were removed and the identified viral sequences originating from the same individuals within a 90-day window were assumed to represent the same infection event. Sequences that failed the NextClade quality control were removed from the dataset. We confirmed that sequence quality and the percentage of non-N bases were equivalent across clades using a chi-squared test and a one-way analysis of variance, respectively. As some analyses depended upon the entire testing population, not just COVID-19-positive cases, we summarized the number of tests in each month, including each individual once per month to reduce over-counting due to some groups requiring weekly testing.
2.8. Analysis of Age or Sex with Clade and Lineage
The data were grouped by age into 5 categories: under 5, 5 to 17, 18 to 25, 26 to 40, and over 40 years old. Because testing groups could be overrepresented at specific times of the year (i.e., during the school year) and during specific outbreak periods, age distribution at testing varied throughout the study period. We used our testing demographics to identify the periods when age groups were tested and divided the data into four six-month testing time frames (Fall 2020, Spring 2021, Fall 2021, and Spring 2022). For each time period, age and clade assessments were performed for the available data within these time frames. The association between age group or sex and clades with n > 10 was assessed with a Pearson’s chi-squared test. The relationship was considered significant for
p < 0.05. The odds ratio and confidence intervals for sex or age groups to test positive in our total study group were calculated using the epitools package (version 0.5–10.1) [
12].
2.9. Analysis of Symptoms with Clade
Fifteen groups of common symptoms were created (e.g., cough and congestion) from the ICD10 codes. Because individuals could report up to 10 symptoms and most people reporting symptoms reported more than 1 symptom (54% of the 1527 who reported symptoms), we analyzed the prevalence of symptoms by clade separately for each symptom. For each symptom, we analyzed its presence or absence across clades using Fisher’s exact test and adjusted the
p-value for multiplicity using the false discovery rate [
13] To understand the different clade representations when the test was statistically significant, we examined the cell’s contribution to the χ
2 statistic in the 2 × n table (presence/absence of symptom group, by clade), flagging values > 3. We used base R and the library gmodels (version 2.18.1.1) for this assessment [
14]. We visually examined the occurrence by lineage for 21J (Delta) and 21K (Omicron) to determine if these symptoms could be associated with lineages. This analysis was limited to those individuals that were specifically asked about symptoms and those clades that occurred after June 2021, when consistent symptom collection was employed.
3. Results
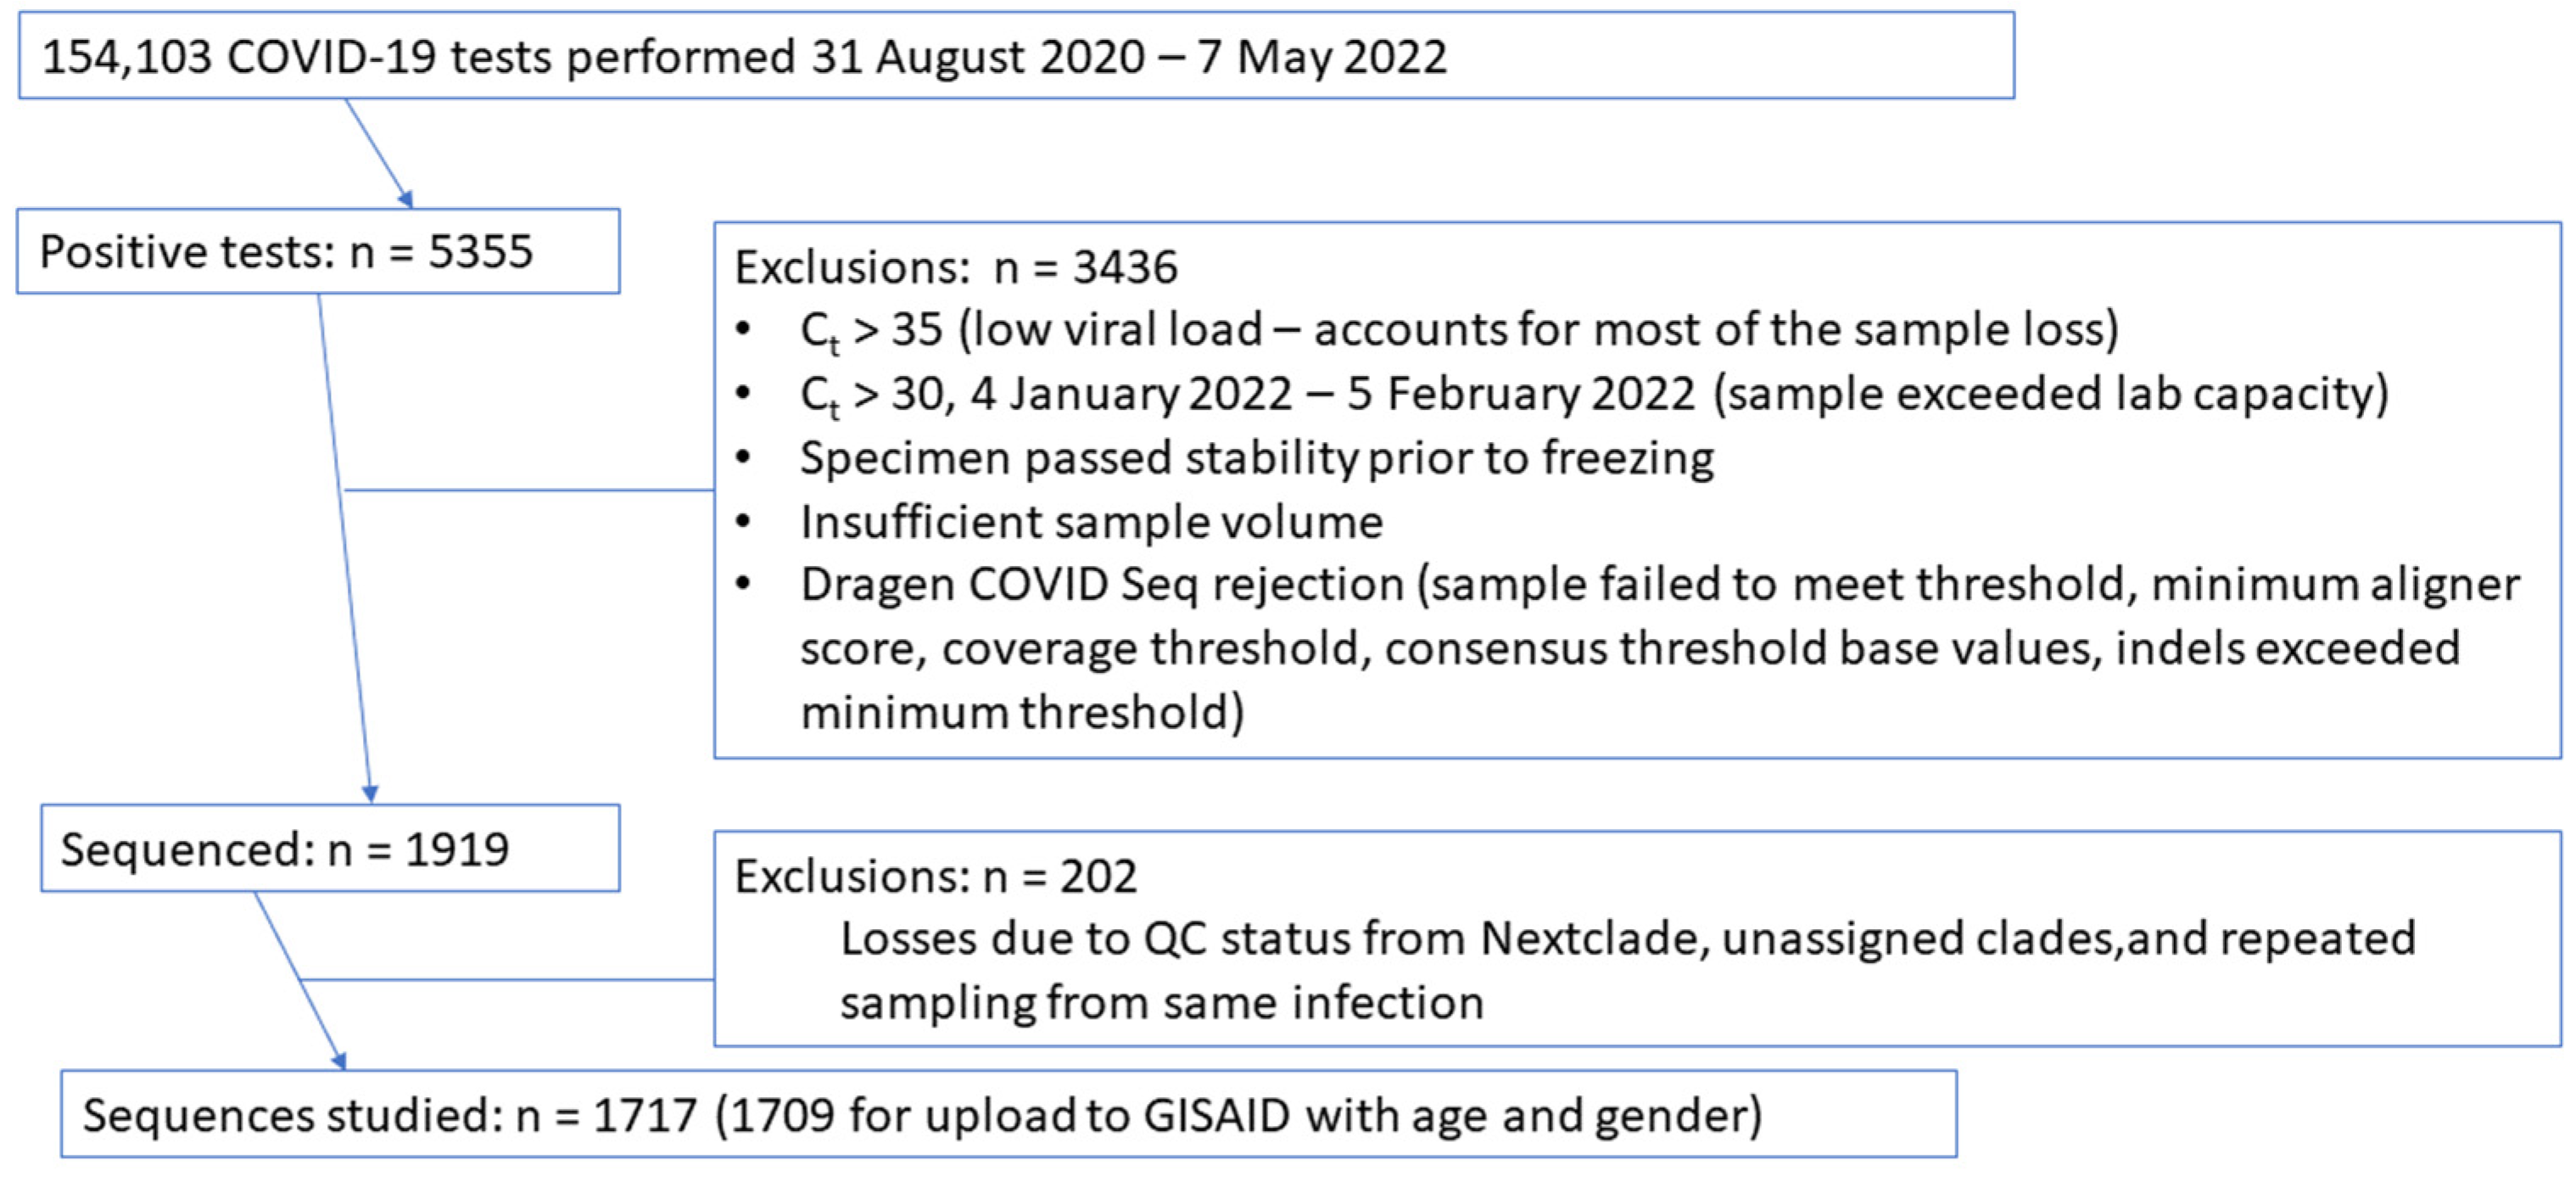
The Boise State University Genetics and Infectious Disease Laboratory performed 86,289 SARS-CoV-2 diagnostic tests between 4 November 2020 and 7 May 2022, registering 4620 positive results for a positivity rate of 5.4%. Northwest Nazarene University performed 67,814 tests between 31 August 2020 and 27 April 2022, registering 735 positive results for a 1.1% positivity rate. From these, 1717 unique SARS-CoV-2 isolates were sequenced (
Figure 1).
Nationally, when campuses reopened in the Fall of 2020, outbreaks occurred in student living areas, and many students and employees became infected with the virus spreading to the surrounding community. In the Spring of 2021, intervention policies were in place that helped curb the virus’ spread. College-age people were eligible for the vaccine and, by late April 2021, individuals aged 16 years or older could receive a vaccination. Northwest Nazarene University has a student population of approximately 1778 (1100 undergraduate and 700 graduate students), with a 24% minority enrollment. Boise State University has a student population of approximately 26,000 (23,000 undergraduate and 3200 graduate students), with a 25% minority enrollment.
Contingency policies at Northwest Nazarene University included required masking and 6′ spacing during Fall 2020 and throughout April 2021. Asymptomatic campus members were advised to test twice a week during the first academic year and at least once a week in the second year (2021–2022). Campus members who tested positive for COVID-19 were isolated in designated housing (if residential students) or at home according to the CDC guidelines. A contactless food delivery system was implemented for quarantined students. Similar quarantine periods were imposed for individuals identified by contact tracing, unless the individuals were vaccinated.
At Boise State University, measures to prevent and/or minimize the spread were implemented to support safe working, learning, and living environments. Measures included wearing masks, social distancing, online courses, and contact tracing within classrooms using a mobile app, using an online pre-ordering system for meals with contactless grocery and food delivery services, providing isolation housing with a limited number of beds available for residents who tested positive, a notification system provided by Boise State Public Health, guidance during isolation, clearance from the isolation protocol, and making available a real-time status to provide information on clearance to be on campus through the student “myBoiseState” homepage, the “Welcome” page, and “My Bronco ID” on the Boise State mobile app. A QR Code app was implemented 1/11/21 to improve COVID-19 classroom contact tracing and attendance tracking data in Boise State classrooms. Students and instructors used their mobile devices to scan QR codes at assigned seats and locations in classrooms. This launched a web application with a quick prompt for authorization and location data already populated, resulting in more accurate information compared to a previous approach that asked students to fill out a survey. A dashboard was established by the Boise State Hazard and Climate Resilience Institute (HCRI) to facilitate the dissemination of information and collect and generate resources for the community during the COVID-19 pandemic, including information about how to stay informed about cases in Idaho, trends in the data, steps to take to reduce risks, and resources available.
Our study population was 54% female, 80% under the age of 40 years, identifying as White (77%) and non-Hispanic (77%) (
Table 1).
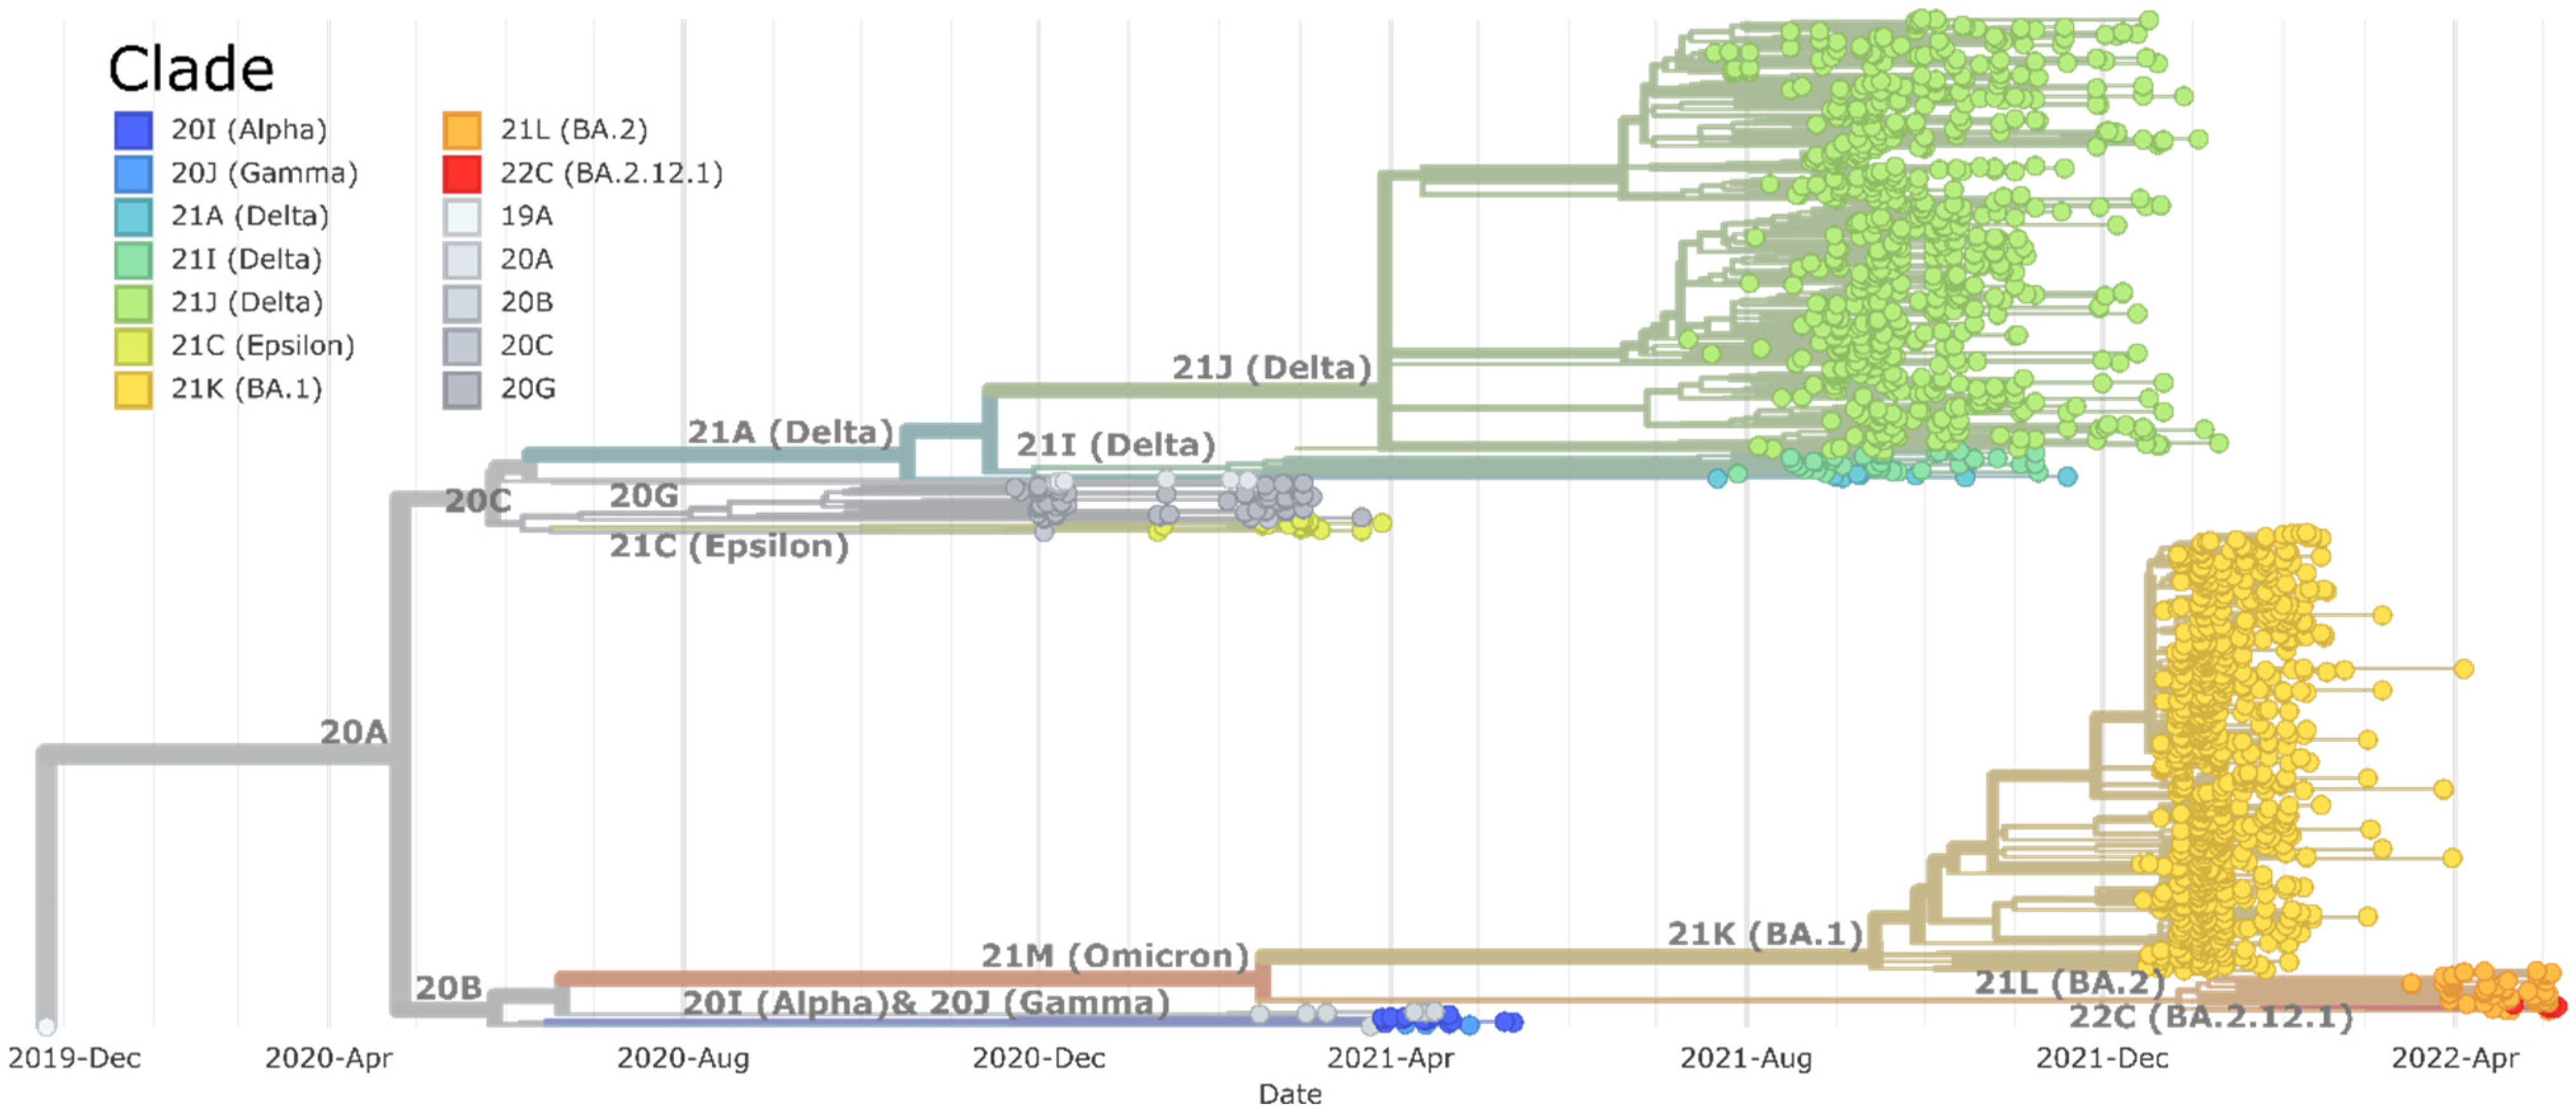
Viral sequences were organized by phylogeny by Nextstrain (version 12) and compared against a sampling of 21,094 high-quality viral genomes acquired from GISAID representing 36 US states and excluding other Idaho samples (
Figure 2). The first strains sequenced in 2020 were of the 20G clade. Over the course of the 2020–2021 and 2021–2022 academic years, despite substantial and impactful measures to reduce the spread, the SARS-CoV-2 pandemic resulted in infections from 17 Nextstrain clades and 102 Pango lineages within the study population (
Figure 2).
3.1. Viral Evolution
SARS-CoV-2 demonstrated a considerable capacity for rapid evolution. The first divergent clades appeared within weeks of sample archiving. By December 2020, four clades and corresponding Pango lineages were detected. Both detected lineages of the 21C clade, B.1.427 and B.1.429, occurred over the same time period as the more dominant 20G clade. An assessment of the B.1.429 infections identified three mutations in the S1 subunit of the spike protein relative to the original 2019 Wuhan strain, and a C10641T mutation unique within our dataset (
Figure 3). The last detected B.1.429 infection was first found on 29 March 2021 and was the last detected 21C clade sample in our dataset, marking the end of the 20C-derived SARS-CoV-2 variants. These were eventually supplanted by the 21A-derived Delta variants (
Figure 2).
Several short-lived variants of the 20B clade were detected between February and May 2021. These variants represent the early lineage-level evolution detected in our dataset. Testing slowed down following the close of the 2021 Spring semester in May and the presence of the 20C and 20G clades began to decrease while lineages of the 20B clade began to rise. Testing ahead of the Fall 2021 semester in July determined that the detected lineages were all from the newly established Delta variant.
We found 32 unique lineages in the Delta family of variants across three clades co-existing between July 2021 and January 2022. The dominant clade was 21J, representing 93% of our cases. The 21A clade was detectable throughout the Fall 2021 semester but represented just 1.2% of cases (n = 9). The 21I clade, with eight Pango lineages, was also present during this same period and accounted for 5.3% (n = 41) of sequenced Delta variant infections. The lineages found in our Delta sequences largely reflected the same lineages found across North America, although the Idaho subset featured at least one overrepresented mutational site, ORF1b F685Y, detected in 54 Idaho infections and rarely in the north American cohort (
Figure 3).
The Nextstrain analysis delineated major nodes within the 21J clade. The Pango lineage AY.44 was the most populous (38% of cases) and featured eight mutations in the S1 subunit of the spike protein, which were mutations common to all Delta variants, and a unique F183V amino acid change in the second open reading frame, ORF1b. All three Delta variants were present from July to November 2021 with 85% or more of the sequences each month presenting the 21J clade. However, this abruptly shifted in December 2021, when the Omicron variant, 21K, became the dominant variant in 71% of cases.
The supplanting Omicron variant family, derived from the 20B clade, consisted of 15 Pango lineages (BA.2 and subtypes) and accounted for 818 sequenced infections collected between December 2021 and May 2022. Nearly all cases were from the 21K clade (90%), and it was the only clade identified in our study group until March 2022. As observed in much of the world, the BA.1 lineage was then supplanted by BA.2. In April 2022 to the end of the study, all cases were BA.2 lineages (clades 21L and 22C). We did not detect any B.1.1.529 Omicron variants in our sample set.
The Omicron samples featured 14 unique spike mutations. The 21K clade had six unique spike mutations (F371L, G446S, G496S, T547K, N856K, and L981F) in 717 samples, while another four mutations were specific to 21L and 22C (T19I, V213G, T376A, and D405N) in the remaining 79 cases.
The genomic surveillance of epidemics allows for unique clinical insights. Several localized outbreaks were identified by genetic likeness within our study population. Between August and October 2021, 380 SARS-CoV-2-positive samples were collected. Among these, 27 were highly related infections of the AY122 Pango lineage (
Figure 4). The first occurrence of this variant occurred in August 2021, and samples with this variant were found over the next three weeks. Of these cases, all were from 17–20-year-old college students with 12 of them living on campus. Many were asymptomatic with only five indicating known exposure.
3.2. Characteristic of Infected Individuals
More women than men were tested for SARS-CoV-2 in our study (
Table 1). However, men were not more likely than women to test positive for SARS-CoV-2 (OR 0.98, CI 0.93 to 1.05). For clades with 10 or more cases, there was an association between sex and clade (
p = 0.015). Men were underrepresented in the 20I (Alpha, V1) and 21L (Omicron) clades (std residuals −1.85 and −1.77, respectively; χ
2-statistic 17.3). In our study group, individuals aged 26 to 40 years were significantly more likely to test positive for SARS-CoV-2 than other groups (OR 1.39 (1.2, 1.7)) (
Table 1).
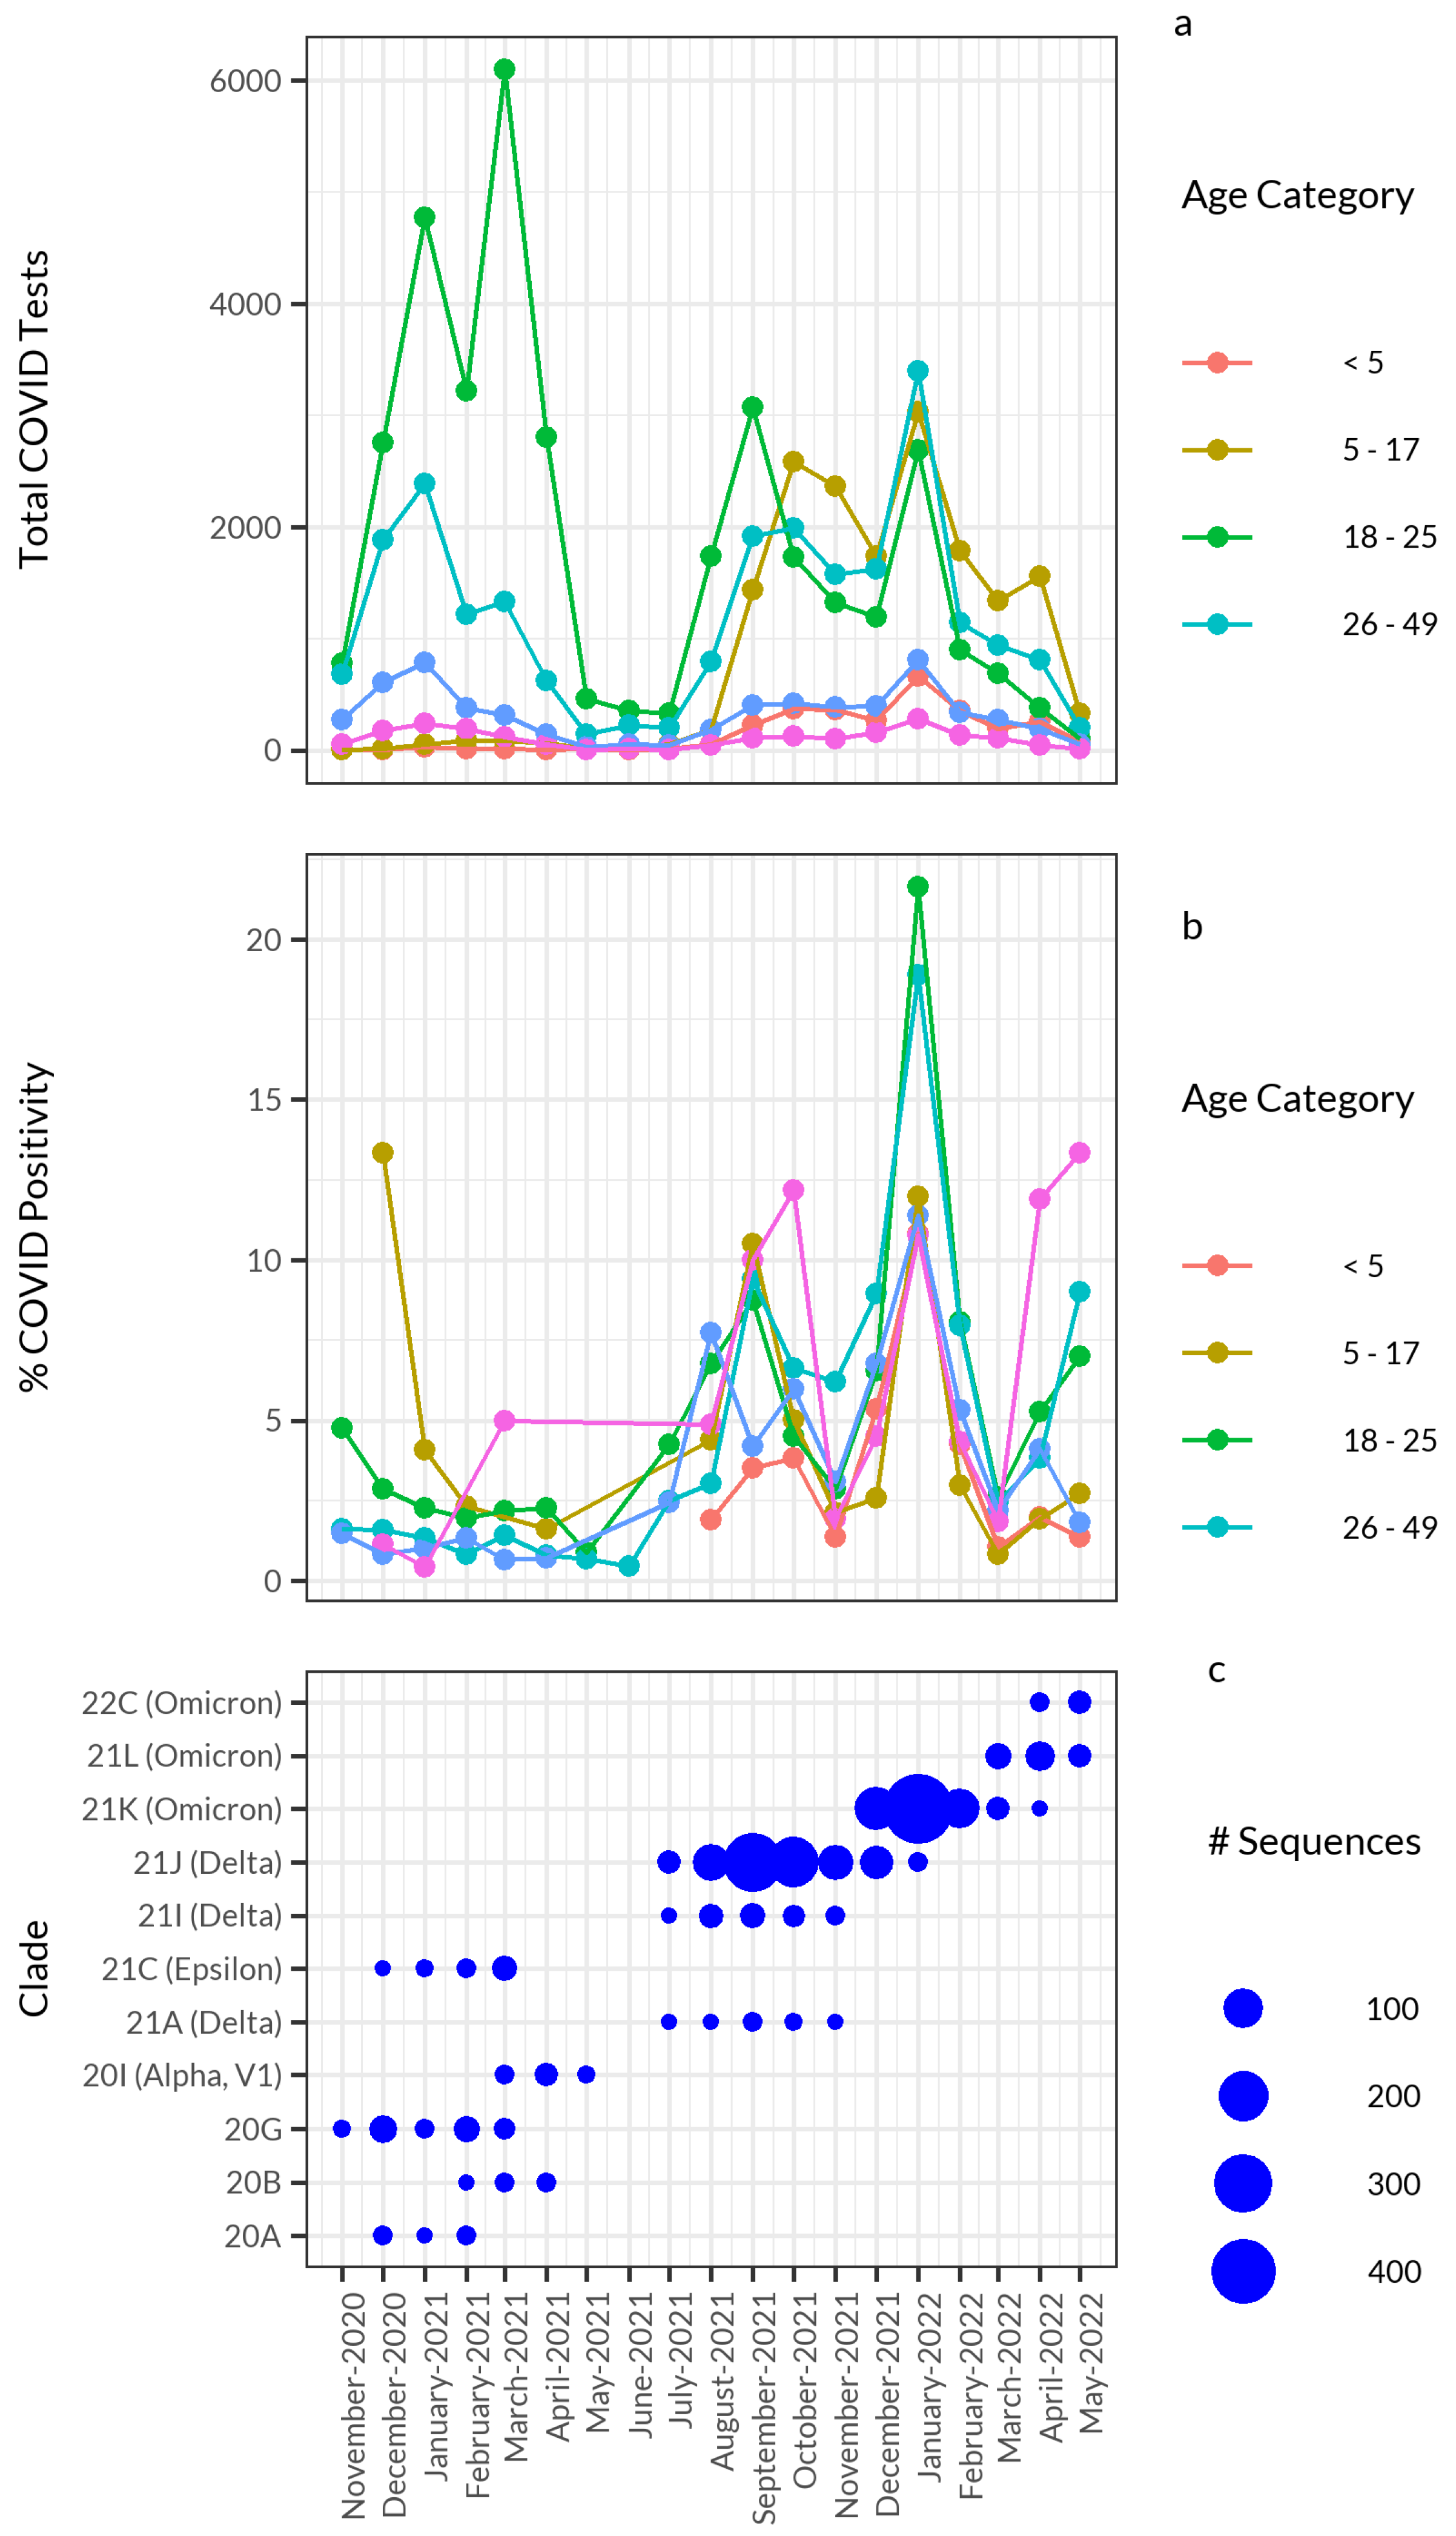
During the first academic year (2020–2021), college-aged individuals made up the majority of tests; there was more parity in testing ages in year two (
Figure 5). Age groups and clades were significantly associated (χ
2,
p = 4 × 10
–14). Notably, in the Fall of 2021, the age group of 5 to 17 year olds was underrepresented regarding those infected with the 21K (Omicron) clade, while the 26 to 40-year-old age group was overrepresented (
p < 0.001, χ
2 std residuals −3.0, 2.5, χ
2 = 26.2, df = 8) (
Figure 5). There were similar rates of testing for the 26–40-year-old group as for younger adults (
Figure 5). These susceptibility differences did not persist into the Spring semester, even though 21K (Omicron) infections continued (
Figure 5c).
Twenty-three distinct Pango lineages of at least 10 cases each were identified. Within the three families (AY, BA, and B), there was a significant association of AY and B lineages with age. Those aged 18 to 25 years old were substantially more likely than other age groups to be infected with AY.122 within the AY lineages (χ2 std residual 4.9, χ2 statistic 100, df = 40). As noted previously, there was a 27-student outbreak with this strain, which accounted for the overrepresentation of the 18 to 25-year-old group. There was also an unexpectedly high number of children under five years old infected with the B.1.617.2 lineage relative to all other B lineages (χ2 std residuals 3.6, χ2 = 34.5, df = 12), although this only accounted for four of the 18 cases.
3.3. Symptom Analysis
A total of 1522 sequences out of the original 1717 had identified symptoms or stated they were asymptomatic. The 21J (Delta) variant produced a higher prevalence of congestion and loss of taste and smell and a lower prevalence of a sore throat. The opposite was observed for 21K (Omicron). We did not observe an obvious association of these three symptoms for any specific lineage within 21J and 21K. Approximately 50% of cases with a loss of taste and smell that were also 21J (Delta) were assigned to Pango lineage AY.44, but the observed odds ratio (OR 1.6 (0.9,3.0)) did not reach significance with the relatively small numbers of cases (n = 42 with a loss of taste and smell in 21J (Delta)).
Table 2 presents the analysis, including the significant association of 21L with fatigue, 21I with headache and congestion, and the lack of association of 21C with a cough and sore throat.
4. Discussion
The goal of this study was to contribute sequences to the SARS-CoV-2 databases and to track the progression of variants in an intermountain west region during the pandemic. We reported the submission of 1717 sequences to GISAID and NCBI and described the sequences of clades and lineages between 31 August 2020 and May 2022. Information on patient demographics and symptoms provided insights into how infections manifested across different populations in our community.
We noted differences in the positivity rates for the two universities participating in this study: Northwest Nazarene University and Boise State University. The difference in positivity rates was most likely due to the fact that Northwest Nazarene University offered daily options for asymptomatic screening for all faculty and students taking classes and working on campus. In contrast, at Boise State University, asymptomatic screening was more limited. At Boise State University, weekly testing for asymptomatic individuals was provided for athletes and staff participating in NCAA sports and limited preK-12 schools. Students residing in dormitories were tested after arriving on campus prior to the 2021 Fall semester and after holiday travel. However, individuals working at Boise State and commuting students taking on-campus classes were tested as they deemed necessary, and so were more likely to test if they had symptoms or had an exposure risk. Individuals from local businesses, state and local government employees, arts organizations, and community members were tested if an outbreak occurred.
The frontier and remote relative geographic and population Isolation of Idaho may have been protective against the early spread of SARS-CoV-2 when travel restrictions and lockdown measures were implemented in various parts of the world. This may have delayed the arrival and subsequent spread of the virus in the state, but by 2022, the virus was even reported in isolated areas. Idaho was one of the last of the United States to record a case of SARS-CoV-2 (13 March 2020), almost two months after the first case in the US [
15]. This later arrival in the state is reflected in our data. While the first Idaho case of the Delta variant was identified in April 2021, no more cases were identified until July 2021 when Idaho initiated more extensive sequencing statewide. Our first sample of Omicron (BA.1) was collected on 14 December 2021, within weeks of the first US case. By that time, masking and group size restrictions were no longer in place, likely contributing to the more rapid spread of later variants.
To design effective disease prevention and management strategies, it is important to differentiate the relative risks for demographic groups. Especially in the first year of the pandemic, it was believed that males had higher clinical severity, mortality, and perhaps susceptibility rates [
16,
17,
18,
19]. However, in November 2021, there were fewer cases of COVID-19 among men than women (145,163 vs. 159,058, respectively) and men had a significantly lower population odds ratio of contracting COVID-19 (OR 0.90, CI 0.89 to 0.91) [
20]. We did not find a significant association between sex and susceptibility to infection in our study when accounting for the higher COVID testing rate among women. Together, these results suggest that susceptibility is not affected by differences in the testing rates between sexes within our study population.
There were significant associations between age and specific clades or lineages of SARS-CoV-2, consistent with other observations. The Delta variant (B 1.167.2) was identified worldwide as highly transmissible, particularly infecting children and adolescents [
21,
22]. One hypothesis for this increased transmission was that children were more likely to be in school and group settings. In our study, children under five years old had even higher infection rates than school-aged children or college students. This can potentially be explained by a reduced compliance to masking in this age group, as well as a need for more hands-on playing and learning behaviors. Interestingly, the large wave of 21K (Omicron) and its lineages in Southwestern Idaho did not show a similar higher susceptibility rate for children than other cohorts [
23].
The finding that a loss of taste and smell decreases in those infected with the Omicron variant is well-supported in the literature [
24,
25,
26,
27,
28]. Omicron has been shown to lack specific mutations that are associated with anosmia and ageusia. The pre-Omicron literature that examined the symptoms of the Delta variant used different reference groups and was not consistent, showing both relative increases [
29,
30] in this symptom and decreases [
31]. An increased cough and sore throat in Omicron clades relative to Delta and/or pre-Delta clades was reported [
26,
29,
30]. However, our results show significantly less congestion than expected in the 21K Omicron clade compared to the Delta clades. It has been suggested that, among Omicron cases, symptoms broadened to the upper respiratory system, increasing these symptoms along with fever, a sore throat, fatigue, and cough, with the caveat that these were all symptoms of other common infections and could not be isolated to COVID-19 in the case of co-infection [
25].
The limitations of our study included an overrepresentation of individuals from the 18 to 25-year-old age range. University populations are often homogeneous in terms of age, lifestyle, and socio-economic background, which may not reflect the broader population. The population studied here had a median age of 22 years, which can present limitations regarding the conclusions for age susceptibilities. University settings foster close interactions, shared living spaces, and social gatherings, making it challenging to isolate or control the variables related to viral transmission. The findings from studies on university populations may not always be extrapolated to other age groups or settings due to the unique dynamics of campus life. Additionally, those undergoing testing were self-selecting to some extent based on whether they were symptomatic, while those participating in athletic programs were tested regardless of symptoms and most often presented as asymptomatic. Some limitations existed for the recording of symptoms as these records may not have included all the symptoms. Finally, the majority of the samples analyzed in this study were from the Delta and Omicron waves during Fall 2021 and early 2022. These factors could have limited our conclusions regarding the associations between symptoms and clades, which could have been underestimated for the lesser clades.
5. Conclusions
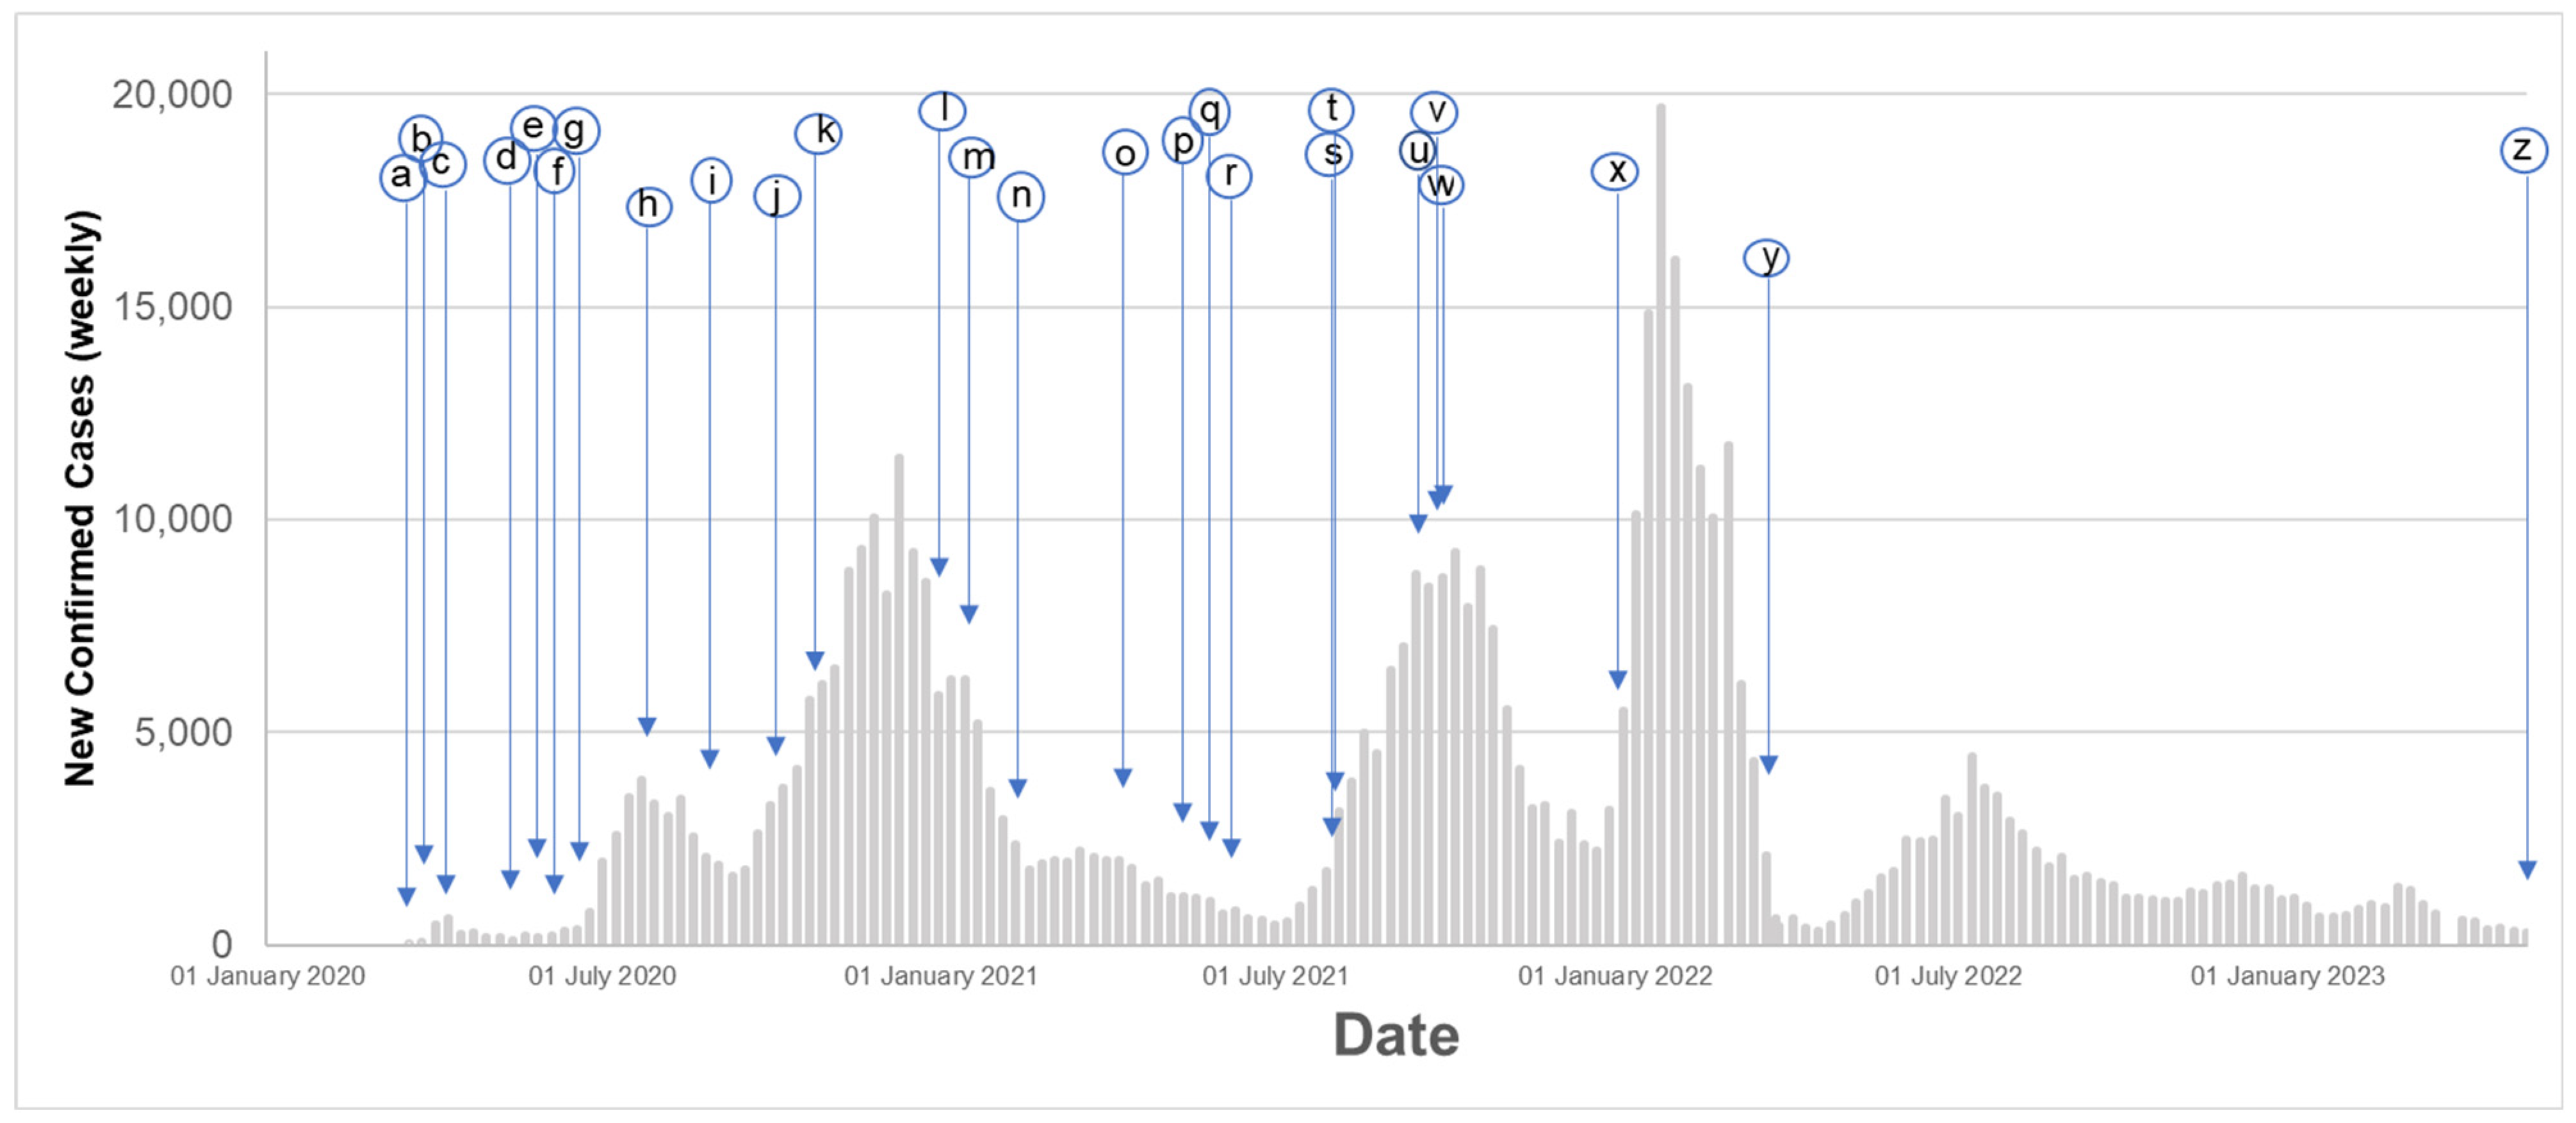
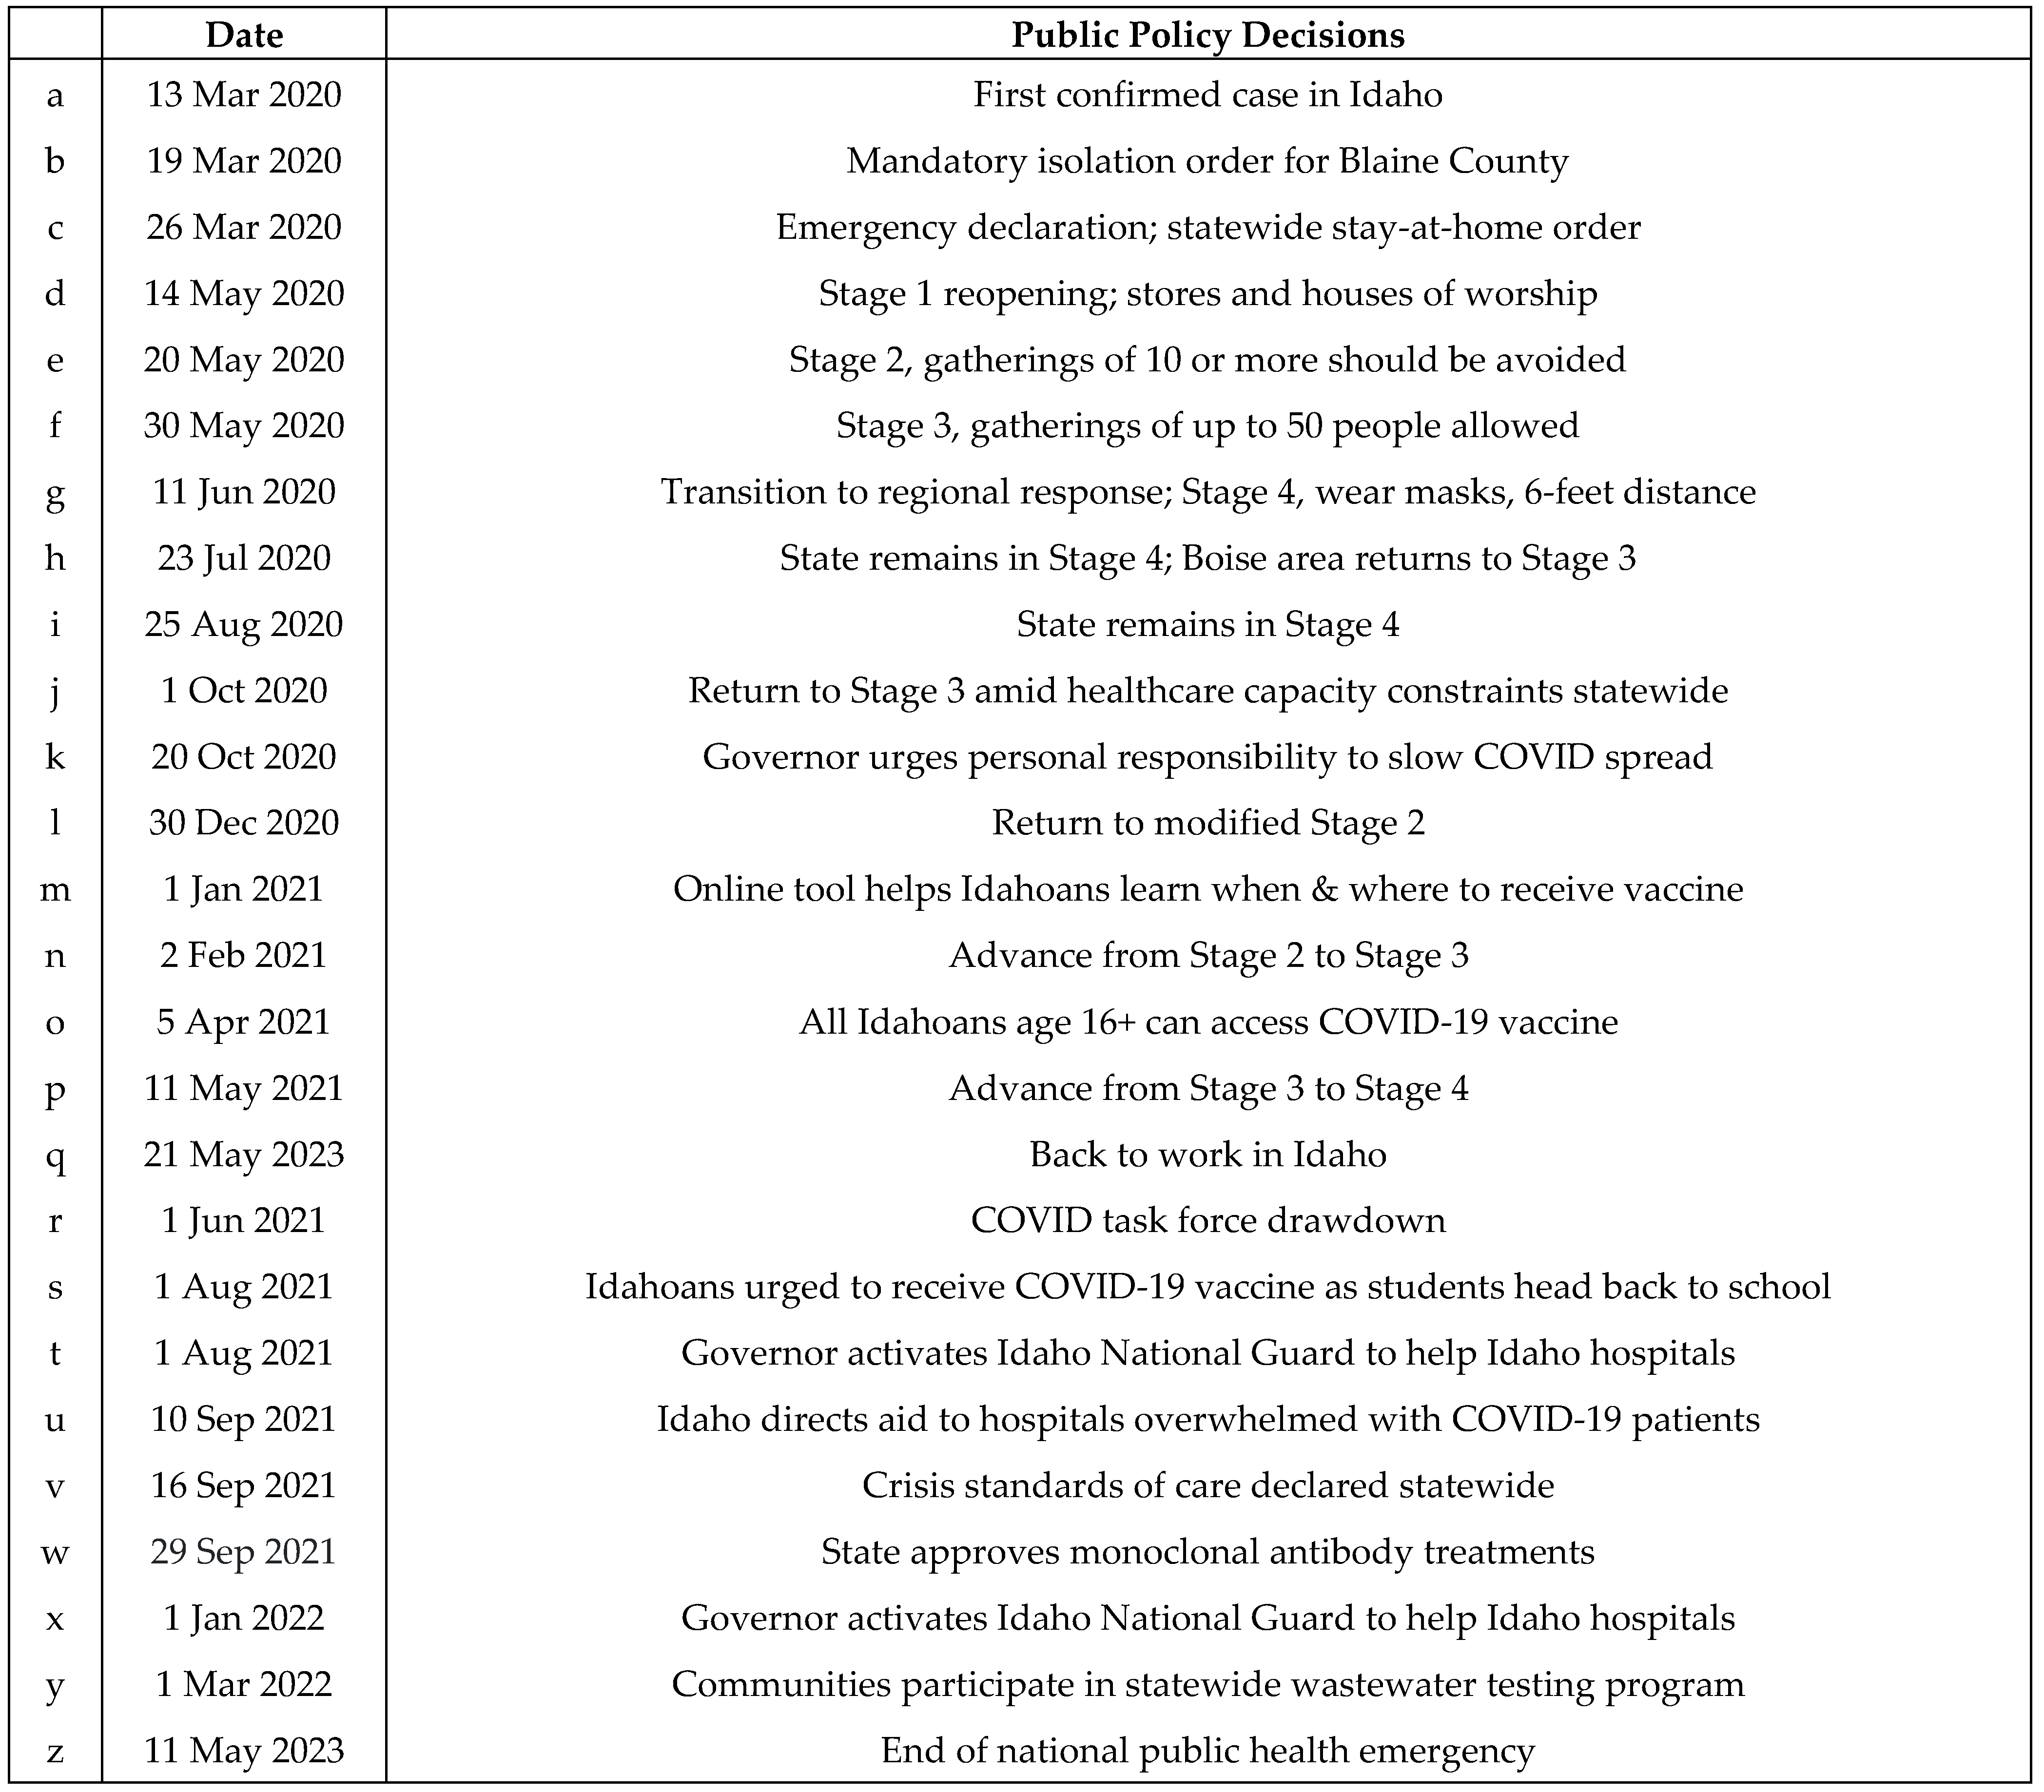
While Idaho is a frontier and remote state, this study focused on a small urban center. In addition to the rapid arrival of new lineages traced from origins well outside the geographically isolated regions studied here, the detection of a missense mutation (ORF1b F685Y) in a high proportion of local infections, which was not detected in the reference set and was rarely found in other datasets, highlighted an example of how such a mutation could spread rapidly and locally, even without a clear or lasting positive selection bias. Both this incident and the broader observation of the general course of SARS-CoV-2 viral evolution underpin the critical nature of genomic surveillance efforts. To better understand the results of our study,
Figure 6 illustrates the progression of newly confirmed cases in Idaho highlighting public policy decisions and interventions that are implemented over time.
Significant public resources were used for unprecedented genomic and clinical surveillance during the SARS-CoV-2 pandemic. What is clear from this and other efforts is how unpredictably, rapidly, and even regionally a viral pandemic can evolve.
With the benefit of experience and the analyses these efforts permitted, we can better prepare for a future that may face additional pandemic events. Public awareness and expectations can be established earlier on while minimizing the risk of miscommunications, leading to an improved accuracy of forecasting and increased compliance with public health safety measures.

 ,
, 


