Article

Inhibitory Effects of Metformin for Pancreatic Neuroendocrine Neoplasms: Experimental Study on Mitochondrial Function

1
Department of Hepato-Biliary-Pancreatic Surgery and Transplantation, Kanazawa University, Kanazawa 920-8641, Japan
2
Department of Biochemistry and Molecular Vascular Biology, Graduate School of Medical Sciences, Kanazawa University, Kanazawa 920-8641, Japan
3
Division of Oncology and Molecular Biology, Cancer Research Institute, Kanazawa University, Kanazawa 920-1192, Japan
*
Author to whom correspondence should be addressed.
Onco 2024, 4(2), 77-86; https://doi.org/10.3390/onco4020007
Submission received: 3 January 2024 / Revised: 14 April 2024 / Accepted: 24 April 2024 / Published: 27 April 2024

Abstract

:

Simple Summary

There have been several reports that progression-free survival in patients with unresectable pancreatic neuroendocrine neoplasms (panNENs) could be improved by an antidiabetic drug, metformin. In this study, we evaluated the effects of metformin on cell metabolism and viability using the panNEN cell line, QGP-1, and RIN-m. We are the first to show that the administration of metformin to QGP-1 and RIN-m activates adenosine monophosphate-activated protein kinase and suppresses mitochondrial respiration using an XF analyzer. The impact of this study is to elucidate how metformin has an antitumor effect against panNEN.

Abstract

Although pancreatic neuroendocrine neoplasms (panNENs) are much less common and have a better prognosis than exocrine pancreatic cancers, their recurrence rate is not low, even in Grade 1 (World Health Organization classification) panNEN. Recently, there have been several reports that the progression-free survival in patients with unresectable panNEN could be improved by an antidiabetic drug, metformin, with the co-treatment of everolimus or a somatostatin analog. In this study, we aimed to evaluate the effects of metformin on cell metabolism and viability using the panNEN cell line, QGP-1, and RIN-m in culture. We observed an inhibitory effect of metformin on QGP-1 cell proliferation in a dose-dependent manner. Metformin was found to decrease the oxygen consumption rate in QGP-1 and RIN-m cells after metformin 48 h treatment and immediately after exposure. Cell proliferation was suppressed after metformin treatment. Phosphorylated adenosine monophosphate-activated protein kinase (AMPK) expression was increased, and cyclin D1 expression was decreased in RIN-m cells 24 h after metformin treatment by Western blotting in a dose-dependent manner. In conclusion, suppressive mitochondrial respiration and AMPK activation by metformin are, thus, suggested to inhibit panNEN cell viability and cell survival.

1. Introduction

Pancreatic neuroendocrine neoplasm (PanNEN) is a rare disease. panNENs were reported to comprise 1 to 2% of all pancreatic tumors in 2005, with an annual prevalence of less than 1 in 100,000 individuals; however, the number of cases increases annually [1,2,3]. The World Health Organization’s (WHO’s) pathological classification of panNEN was issued in 2010, and guidelines were prepared in Japan in 2015. In 2017, the WHO classification and Japanese guidelines were revised to the latest version: there are three grades of malignancy classification based on mitotic figures and the Ki-67 index.
PanNEN is expected to have a relatively good prognosis, but even in Grade 1, the recurrence rate is by no means low, and since it often occurs in young people, long-term follow-up is necessary. In recent years, the number of therapeutic agents that have been used (such as sustained somatostatin analog preparations (octreotide), antineoplastic agents (streptozocin, everolimus, and sunitinib), and diabetic drugs) has increased, but treatment duration is lengthy, even in unresectable/recurrent cases [4,5,6]. It is difficult to continue ordinary chemotherapy alone, and effective drug selection that can be used without adverse events in the long term is required.
Metformin is the most widely used antidiabetic drug for the treatment of type 2 diabetes, which is used by more than 150 million people annually [7]. This drug reduces blood glucose levels by inhibiting gluconeogenesis in the liver and increasing glucose uptake in skeletal muscles. It decreases insulin resistance by improving insulin sensitivity. The activation of adenosine monophosphate-activated protein kinase (AMPK), an enzyme that is the central regulator of metabolic pathways, is thought to be involved in the glucose-lowering effects of metformin [8]. The first report indicating its antitumor effect for pancreatic cancer in mammals was in 2001 [9], and the first study reporting the association between the use of metformin and a reduced incidence of cancer in patients with type 2 diabetes was published in 2005 [10]. Epidemiological studies have shown that patients with type 2 diabetes receiving metformin have significantly lower carcinogenic and mortality rates than those on other treatments [11,12,13,14]. However, although many clinical trials are currently underway, no results have been obtained that strongly support its efficacy [15,16,17]. Metformin has shown antiproliferative effects on various types of tumors using xenograft models [18]. The main mechanism of tumor growth suppression by metformin is due to the activation of AMPK, which has various downstream effects that work together to suppress tumor growth [18,19,20]. It has been pointed out that by inducing the phosphorylation of AMPK, it is also possible to directly suppress the growth of cancerous cells [21,22,23].
Because metformin does not directly stimulate insulin secretion, the risk of hypoglycemia is lower than other oral antidiabetic agents, and metformin alone rarely causes hypoglycemia. The most common toxicity of metformin is mild abdominal symptoms, which are usually individual and alleviated by escalating the administered dose. Lactic acidosis, the most serious toxicity of metformin, is extremely rare, occurring in only a few per 100,000 people. Based on the above, it is safely administered to many diabetic patients over a long period of time.
In 2018, the use of metformin for the treatment of diabetes in patients with unresectable panNENs treated with everolimus and somatostatin analogs was reported to prolong progression-free survival [24]. However, the detailed mechanism of the cytostatic effect of metformin on panNEN has not yet been clarified.
In this study, we aimed to evaluate the impact of metformin on mitochondrial respiration, AMPK activation, and antitumor effects in QGP-1 human panNEN cells and the rat insulinoma cell line RIN-m.

2. Materials and Methods

2.1. Cell Lines and Treatments

The human panNEN cell line QGP-1 was provided by the Japanese Cancer Research Resources Bank, and the rat insulinoma cell line RIN-m was provided by the ATCC (CRL-2057; ATCC, Manassas, VA, USA). The cells were cultured in RPMI1640 (Gibco BRL Life Technologies, Tokyo, Japan), supplemented with 10% fetal bovine serum, 100 U/mL of penicillin, and 100 μg/mL of streptomycin at 37 °C with 5% CO2.
Metformin (Wako Laboratory Chemicals, Tokyo, Japan) was dissolved in phosphate-buffered saline and stored frozen at −20 °C at a stock concentration of 100 mM.

2.2. Cell Proliferation Assay

The proliferation of metformin-treated cells was determined by a TC20 automated cell counter and a standard 3-(4,5-dimethylthiazol-2-yl)-2,5-diphenyltetrazolium bromide (MTT) assay. QGP-1 and RIN-m cells were seeded in a 96-well culture plate at a density of 1.0 × 10⁴ cells/well and allowed to attach for 24 h. The cells were treated with various concentrations (0.25–1.0 mM) of metformin for 72 h. The cell viability was determined by trypan blue staining. The absorbance was measured at 570 nm in each well using an automated microplate reader.

2.3. Western Blotting

The cells were lysed in a radioimmunoprecipitation assay buffer containing a 1% protease inhibitor cocktail (Sigma-Aldrich, St. Louis, MO, USA) and a 1% phosphatase inhibitor (Sigma-Aldrich). The concentration of the protein in each lysate was measured with a bicinchoninic acid protein assay kit (Pierce Biotechnology, Rockford, IL, USA). Proteins from each sample (50 μg/well) were separated by sodium dodecyl sulfate-polyacrylamide gel electrophoresis on 12.5% gel and then transferred to nitrocellulose membranes. After blocking in a 0.05% Tween-20/tris-buffered saline (TBS) buffer, the membranes were probed with primary antibodies against phospho-AMPKα (Thr172) (D4D6D) (Cell Signaling Technology Inc., Beverly, MA, USA) and AMPK (D63G4) (Cell Signaling Technology Inc.) overnight at 4 °C, followed by anti-rabbit IRDye 680 secondary antibodies (LI-COR Biotechnology, Lincoln, NE, USA) in a 0.05% Tween-20/TBS buffer. The antigen–antibody complex was visualized using the Odyssey Infrared Imaging systems (LI-COR Biotechnology). The relative band intensities were also quantified by ImageJ (ver. 1.54h).

2.4. Extracellular Flux (XF) Analysis

QGP-1 and RIN-m cells were seeded into XF 24-well cell culture microplates (Seahorse Biosciences, North Billerica, MA, USA) at 15,000 cells/well in 250 μL of an RPMI1640 growth medium, placed in the incubator with 5% CO2 at 37 °C.
After 24 h, these cells were treated with RPMI1640 growth medium supplemented with 1.0 or 2.0 mM of metformin for 48 h, followed by an XF bioenergetic assay. The assay was initiated by replacing the medium with 525 μL of the assay medium (supplemented with Roswell Park Memorial Institute [RPMI] with 1.0 or 2.0 mM of metformin without serum), preheated to 37 °C. Cells were incubated at 37 °C without CO2 for 60 min. Furthermore, cells were preequilibrated with the assay medium before the first measurement. After the equilibration period, cells were baseline-measured three times. The following reagents were then administered: 1.5 μM of oligomycin, an inhibitor of adenosine triphosphate (ATP) synthesis, was used to distinguish O2 consumption devoted to ATP synthesis; 2 μM of carbonyl cyanide-p-trifluoromethoxyphenylhydrazone (FCCP), an uncoupling agent, was added to measure uncoupled respiration; and 0.5 μM of antimycin A, a complex III inhibitor, was used to assay complex III-linked respiration.
Next, QGP-1 and RINm cells were treated with 1.0 or 2.0 mM of metformin for 48 h before using the XF bioenergetic assay. The assay was initiated by replacing the medium with 525 mL of the 37 °C assay medium (RPMI 1640 with serum and with 1.0 or 2.0 mM of metformin). Prior to the first measurement, cells were incubated without CO2 at 37 °C for 60 min, and the cells were pre-equilibrated in an assay medium. After equilibration, cells were subjected to three baseline measurements, infused with the above reagents (1.5 μM of oligomycin, 2 μM of FCCP, and 0.5 μM of antimycin A) in sequence, and an XF bioenergetic assay was performed.

2.5. Statistical Analysis

Differences among the data were investigated by the one-sided Student’s t-test and two-way analysis of variance with Prism 9.0 for Windows (GraphPad Software, Inc., San Diego, CA, USA). A p-value less than 0.05 was considered to indicate a statistically significant difference.

3. Results

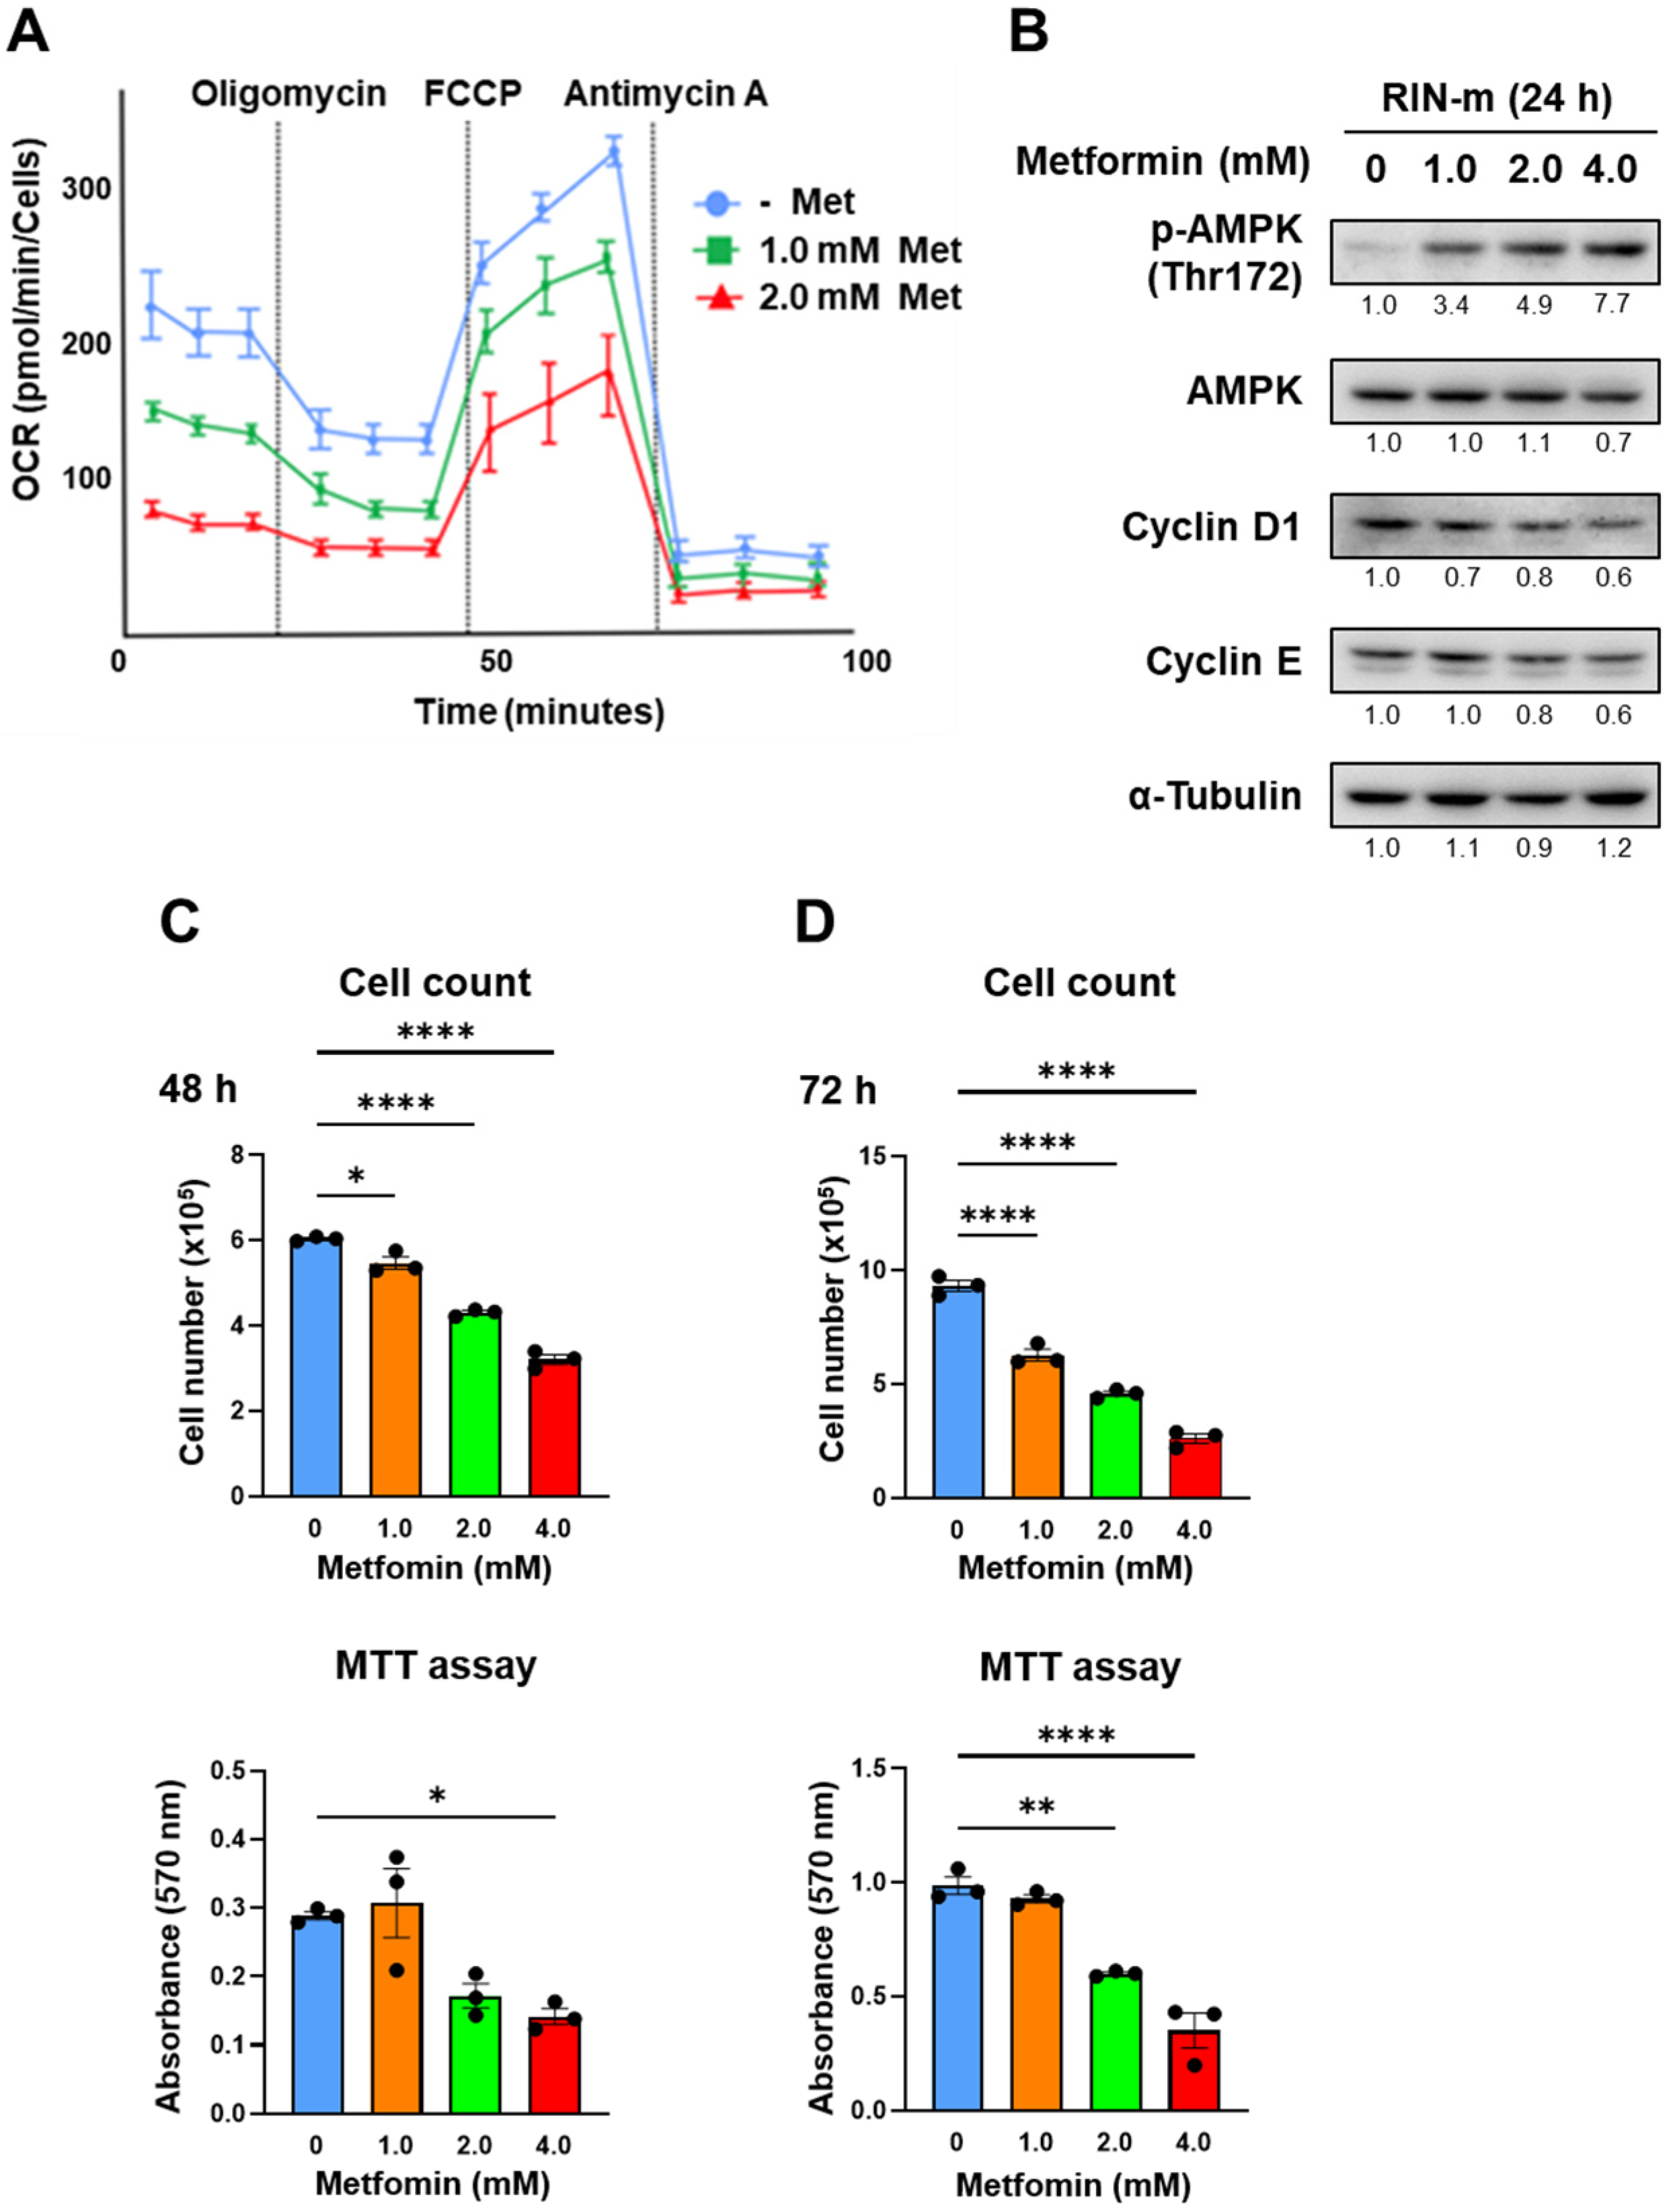
3.1. Metformin Suppressed Mitochondrial Respiration in QGP-1 Cells

We first investigated the effects of metformin on cellular metabolic status. XF analysis was performed to assess mitochondrial respiration in QGP-1 cells. Following the addition of metformin, the oxygen consumption rate (OCR) of QGP-1 cells was measured under the additions of oligomycin, FCCP, and antimycin A (Figure 1A). We did not see OCR changes immediately after metformin treatment (Figure 1B). However, after the addition of FCCP, the maximum OCR decreased significantly in a metformin concentration-dependent manner (Figure 1C).
Figure 1D shows the OCR change in QGP-1 cells after 48 h of treatment with metformin. At basal respiration, the OCR of QGP-1 cells decreased with a significant difference in a metformin concentration-dependent manner (Figure 1E). The maximum OCR of QGP-1 cells after the addition of FCCP was significantly decreased in a metformin concentration-dependent manner (Figure 1F). The results indicated that metformin suppresses mitochondrial respiration in QGP-1 cells.

3.2. Metformin-Induced AMPK Phosphorylation in QGP-1 Cells

We next investigated the AMPK activity of QGP-1 cells with the addition of metformin. Twenty-four hours after the addition of metformin, phosphorylated AMPK was detected as the metformin concentration increased, and cyclin D1 expression was decreased by 2.0 mM of metformin (Figure 2 and Supplementary Figure S1). This result indicated that AMPK is activated depending on the concentration of metformin in QGP-1 cells.

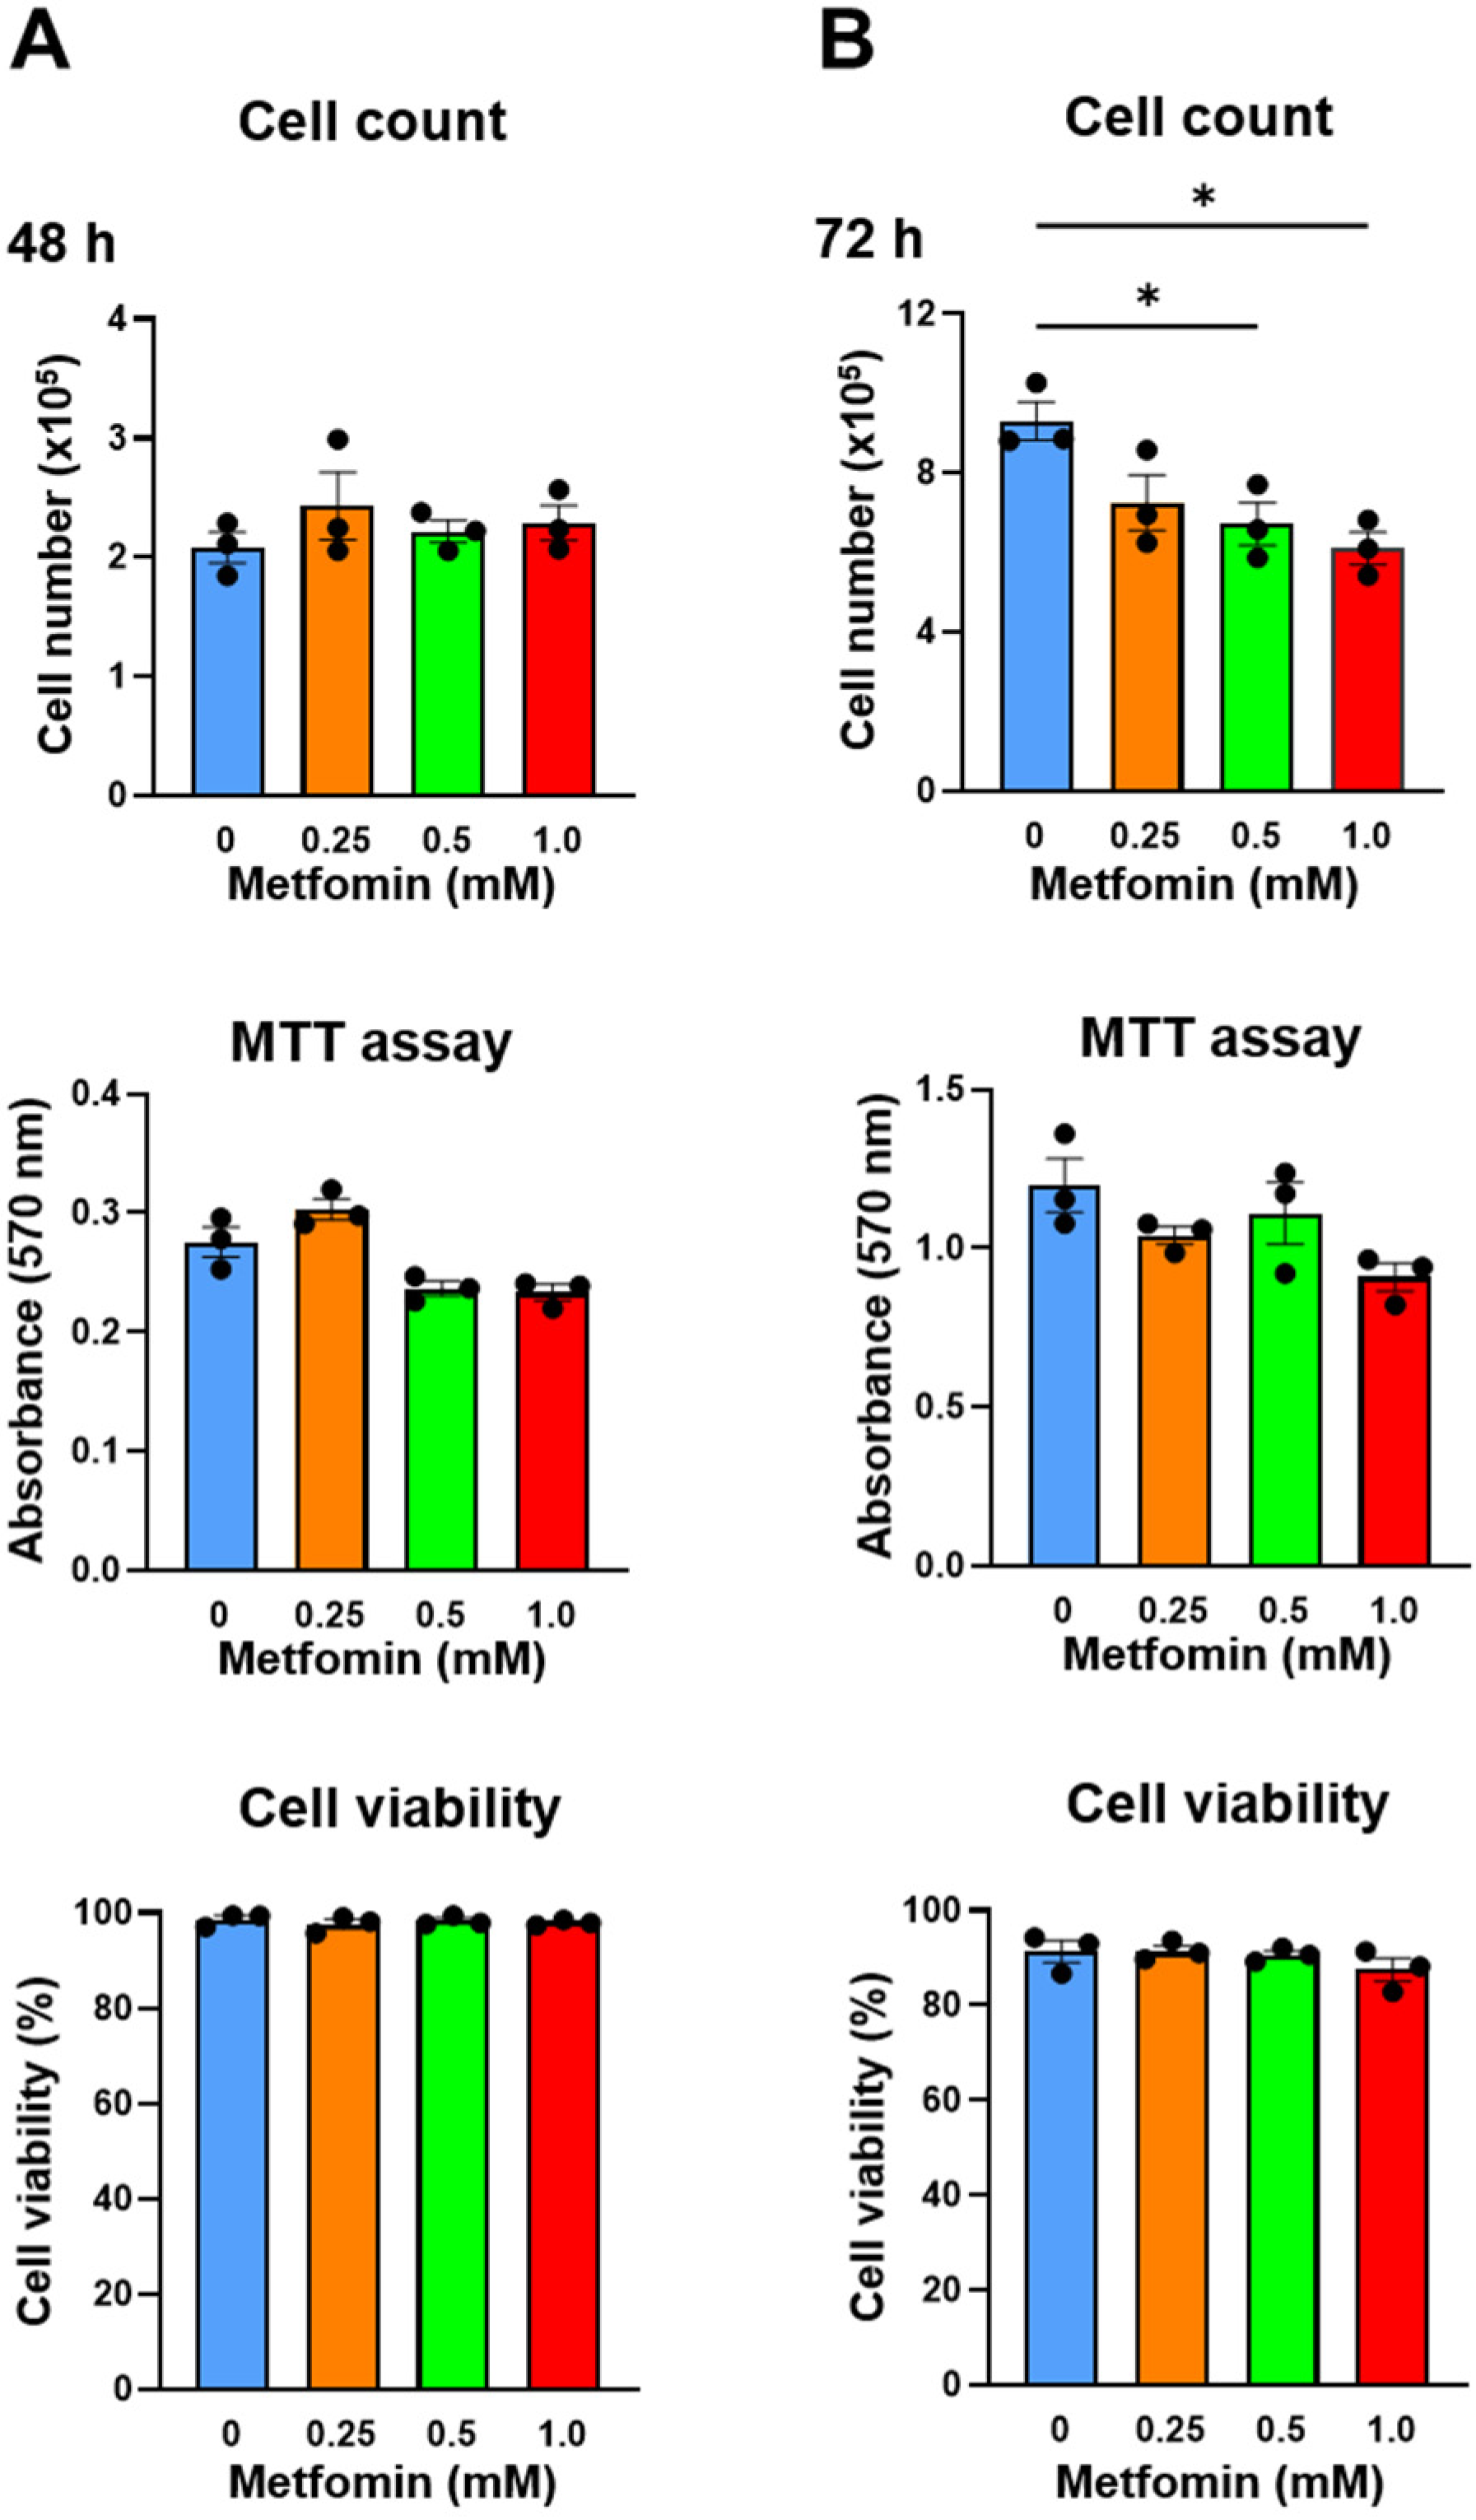
3.3. Metformin Suppressed Cell Proliferation in QGP-1 Cells

Metformin (0.25, 0.5, and 1.0 mM) was added to QGP-1 cells, and the number of cells after 48 h and 72 h was measured by cell counting and the MTT assay. After 48 h, QGP-1 cell proliferation was not suppressed (Figure 3A); however, after 72 h, the cell proliferation was significantly suppressed by 0.5 and 1.0 mM of metformin treatments (Figure 3B). Cellular damage was not observed by additions of metformin using the cell viability assays we employed (Figure 3A,B). These results indicate that the metformin treatment of QGP-1 cells inhibits cell proliferation. No significant difference was observed in the MTT assay. Because of the possible metabolic effects of metformin, we decided to rely on cell numbers in subsequent assays.

3.4. Verification of the Effect of Metformin in RIN-m Cells

The effects of metformin were verified using another cell line, RIN-m. Figure 4A shows the OCR change in RIN-m cells after 48 h of treatment with metformin based on XF analysis. The maximum OCR decreased significantly in a metformin concentration-dependent manner, as well as QGP-1. In addition, AMPK activation and cell cycle-related proteins in RIN-m through the metformin treatment were evaluated by Western blotting (Figure 4B and Figure S2). After 24 h of metformin treatment, phosphorylated AMPK was upregulated, and cyclin D1 was downregulated in a concentration-dependent manner. Figure 4C shows the cell proliferation and MTT assays. Cell proliferation was dose-dependently suppressed by the treatment of metformin at 48 and 72 h, and cellular viability evaluated by the MTT assay was significantly decreased when 2.0 and 4.0 mM of metformin was exposed in RIN-m cells.

4. Discussion

We successfully demonstrated that metformin inhibits proliferation by suppressing the mitochondrial respiration of panNEN in vitro in this study. So far, to the best of our knowledge, there has been no study that has administered metformin to QGP-1 cells and measured mitochondrial respiration using an XF analyzer. In this study, we showed the impact of metformin on mitochondrial respiratory suppression, AMPK activation, and antitumor effects for QGP-1 human panNEN cells. Furthermore, we demonstrated that similar results were obtained in rat insulinoma cells RIN-m.
Besides antidiabetic effects, metformin has received a great deal of attention because many studies have shown a reduction in the incidence of cancer in diabetic patients treated with metformin [9,12]. The inhibition of mitochondrial complex 1 activity is reported to be the mechanism of the antitumor effect of metformin [25,26]. Metformin targets mitochondria and has been shown to inhibit the growth of pancreatic cancer cells [27] and pheochromocytoma, which is a neuroendocrine tumor derived from adrenal medulla chromaffin cells [28].
In this study, the mitochondrial respiration of QGP-1 and RIN-m was measured using an XF analyzer. The maximum OCR shortly after the administration of metformin to QGP-1 and after the long-term administration of metformin to QGP-1 both decreased in a concentration-dependent manner. The administration of metformin to the panNEN cell line QGP-1 and RIN-m significantly suppressed mitochondrial respiration in a concentration-dependent manner. In particular, metformin administration to QGP-1 showed significant effects immediately after metformin administration.
Metformin activates AMPK by increasing the phosphorylation of the catalytic α subunit at T172 [21,29]. The activation of AMPK leads to the inactivation of Akt/mTOR signaling via the inhibition of mTOR, thereby contributing to a reduction in the synthesis of nutrients, such as glucose and amino acids, and in the production of intracellular energy, ultimately inhibiting cell proliferation. Furthermore, metformin can directly inhibit tumor cell proliferation by regulating the cell cycle through cyclin D1 and the expression of the tumor suppressor p53. There is also a report showing the antitumor effect of metformin on panNEN using QGP-1 by inducing cell cycle arrest and apoptosis [30].
There were several limitations to this study. First, since this study was a cell line experiment in vitro, it is necessary to verify compatibility through in vivo experiments. Second, only two cell lines, QGP-1 and RIN-m, were used for panNEN in this study. Other neuroendocrine tumor cell lines or even patient-derived cells need to be validated.
In conclusion, in this study, the administration of metformin to QGP-1 and RIN-m significantly suppressed the mitochondrial respiration of these cells in a concentration-dependent manner, activated AMPK, and thus suppressed cell proliferation. Further studies are required to elucidate the antitumor effects of metformin on panNEN to confirm the clinical availability of metformin.

Supplementary Materials

The following supporting information can be downloaded at: https://www.mdpi.com/article/10.3390/onco4020007/s1, Figure S1: Western blotting of p-AMPK, AMPK, and cyclin D1 expressed in QGP-1 cells at 24 h after metformin treatment; Figure S2: Western blotting of p-AMPK, AMPK, cyclin D1 and cyclin E expressed in RIN-m cells at 24 h after metformin treatment; Table S1: Quantification of band intensities of p-AMPK, AMPK and cyclin D1 in QGP-1 cells at 24 h after metformin treatment; Table S2 Relative band intensities of p-AMPK, AMPK and cyclin D1 in QGP-1 cells at 24 h after metformin treatment; Table S3 Quantification of band intensities of p-AMPK, AMPK, cyclin D1 and cyclin E in RIN-m cells at 24 h after metformin treatment; Table S4 Relative band intensities of p-AMPK, AMPK, cyclin D1 and cyclin E in RIN-m cells at 24 h after metformin treatment.

Author Contributions

Conceptualization, S.M. (Shogo Maruzen), Y.Y., H.T. and S.Y.; methodology, S.M. (Shogo Maruzen) and Y.Y.; software, S.M. (Shogo Maruzen) and S.Y.; validation, S.M. (Shogo Maruzen) and Y.Y.; formal analysis, S.M. (Shogo Maruzen) and Y.Y.; investigation, S.M. (Shogo Maruzen), S.M. (Seiichi Munesue), L.G., S.K. and Y.Y.; resources, S.M. (Shogo Maruzen), S.M. (Seiichi Munesue) and Y.Y.; data curation, S.M. (Shogo Maruzen) and S.M. (Seiichi Munesue); writing—original draft preparation, S.M. (Shogo Maruzen), S.M. ( Seiichi Munesue), Y.Y. and S.Y.; writing—review and editing, S.M. (Shogo Maruzen), S.M. (Seiichi Munesue), Y.Y., C.T., M.O., S.T., S.N., I.M., H.T. and S.Y.; visualization, S.M. (Shogo Maruzen) and S.M. (Seiichi Munesue); supervision, C.T., Y.Y. and S.Y. All authors have read and agreed to the published version of the manuscript.

Funding

This research was funded by S.Y. and I.M., JSPS KAKENHI; grant number 22K08891.

Institutional Review Board Statement

Not applicable.

Informed Consent Statement

Not applicable.

Data Availability Statement

The data used in this study are available from the corresponding author upon reasonable request.

Acknowledgments

We thank Yasuyo Futakuchi for her skillful technical assistance.

Conflicts of Interest

The authors declare no conflicts of interest.

References

  1. Oberg, K.; Eriksson, B. Endocrine tumours of the pancreas. Best. Pr. Res. Clin. Gastroenterol. 2005, 19, 753–781. [Google Scholar] [CrossRef] [PubMed]
  2. Schimmack, S.; Svejda, B.; Lawrence, B.; Kidd, M.; Modlin, I.M. The diversity and commonalities of gastroenteropancreatic neuroendocrine tumors. Langenbecks Arch. Surg. 2011, 396, 273–298. [Google Scholar] [CrossRef] [PubMed]
  3. Masui, T.; Ito, T.; Komoto, I.; Uemoto, S.; JNETS Project Study Group. Recent epidemiology of patients with gastro-entero-pancreatic neuroendocrine neoplasms (GEP-NEN) in Japan: A population-based study. BMC Cancer 2020, 20, 1104. [Google Scholar] [CrossRef] [PubMed]
  4. Ito, T.; Igarashi, H.; Nakamura, K.; Sasano, H.; Okusaka, T.; Takano, K.; Komoto, I.; Tanaka, M.; Imamura, M.; Jensen, R.T.; et al. Epidemiological trends of pancreatic and gastrointestinal neuroendocrine tumors in Japan: A nationwide survey analysis. J. Gastroenterol. 2015, 50, 58–64. [Google Scholar] [CrossRef] [PubMed]
  5. Dasari, A.; Shen, C.; Halperin, D.; Zao, B.; Zhou, S.; Xu, Y.; Shih, T.; Yao, J.C. Trends in the incidence, prevalence, and survival outcomes in patients with neuroendocrine tumors in the United States. JAMA Oncol. 2017, 3, 1335–1342. [Google Scholar] [CrossRef] [PubMed]
  6. Ito, T.; Masui, T.; Komoto, I.; Doi, R.; Osamura, R.Y.; Sakurai, A.; Ikeda, M.; Takano, K.; Igarashi, H.; Shimatsu, A.; et al. JNETS clinical practice guidelines for gastroenteropancreatic neuroendocrine neoplasms: Diagnosis, treatment, and follow-up: A synopsis. J. Gastroenterol. 2021, 56, 1033–1044. [Google Scholar] [CrossRef] [PubMed]
  7. He, L.; Wondisford, F.E. Metformin action: Concentrations matter. Cell Metab. 2015, 21, 159–162. [Google Scholar] [CrossRef] [PubMed]
  8. Bailey, C.J.; Turner, R.C. Metformin. N. Engl. J. Med. 1996, 334, 574–579. [Google Scholar] [CrossRef] [PubMed]
  9. Schneider, M.B.; Matsuzaki, H.; Haorah, J.; Ulrich, A.; Standop, J.; Ding, X.Z.; Adrian, T.E.; Pour, P.M. Prevention of pancreatic cancer induction in hamsters by metformin. Gastroenterology 2001, 120, 1263–1270. [Google Scholar] [CrossRef]
  10. Evans, J.M.; Donnelly, L.A.; Emslie-Smith, A.M.; Alessi, D.R.; Morris, A.D. Metformin and reduced risk of cancer in diabetic patients. BMJ 2005, 330, 1304–1305. [Google Scholar] [CrossRef]
  11. Bowker, S.L.; Majumdar, S.R.; Veugelers, P.; Johnson, J.A. Increased cancer-related mortality for patients with type 2 diabetes who use sulfonylureas or insulin. Diabetes Care 2006, 29, 254–258. [Google Scholar] [CrossRef] [PubMed]
  12. Landman, G.W.; Kleefstra, N.; van Hateren, K.J.; Groenier, K.H.; Gans, R.O.; Bilo, H.J. Metformin associated with lower cancer mortality in type 2 diabetes: ZODIAC-16. Diabetes Care 2010, 33, 322–326. [Google Scholar] [CrossRef] [PubMed]
  13. Decensi, A.; Puntoni, M.; Goodwin, P.; Cazzaniga, M.; Gennari, A.; Bonanni, B.; Gandini, S. Metformin and cancer risk in diabetic patients: A systematic review and meta-analysis. Cancer Prev. Res. 2010, 3, 1451–1461. [Google Scholar] [CrossRef] [PubMed]
  14. Noto, H.; Goto, A.; Tsujimoto, T.; Noda, M. Cancer risk in diabetic patients treated with metformin: A systematic review and meta-analysis. PLoS ONE 2012, 7, e33411. [Google Scholar] [CrossRef] [PubMed]
  15. Goodwin, P.J.; Chen, B.E.; Gelmon, K.A.; Whelan, T.J.; Ennis, M.; Lemieux, J.; Ligibel, J.A.; Hershman, D.L.; Mayer, I.A.; Hobday, T.J.; et al. Effect of Metformin vs Placebo on Invasive Disease-Free Survival in Patients With Breast Cancer: The MA.32 Randomized Clinical Trial. JAMA 2022, 327, 1963–1973. [Google Scholar] [CrossRef] [PubMed]
  16. Tsakiridis, T.; Pond, G.R.; Wright, J.; Ellis, P.M.; Ahmed, N.; Abdulkarim, B.; Roa, W.; Robinson, A.; Swaminath, A.; Okawara, G.; et al. Metformin in Combination With Chemoradiotherapy in Locally Advanced Non-Small Cell Lung Cancer: The OCOG-ALMERA Randomized Clinical Trial. JAMA Oncol. 2021, 7, 1333–1341. [Google Scholar] [CrossRef] [PubMed]
  17. Cho, W.R.; Wang, C.C.; Tsai, M.Y.; Chou, C.K.; Liu, Y.W.; Wu, Y.J.; Lin, M.T.; Chen, K.D.; Chuang, C.H.; Huang, P.Y.; et al. Impact of metformin use on the recurrence of hepatocellular carcinoma after initial liver resection in diabetic patients. PLoS ONE 2021, 16, e0247231. [Google Scholar] [CrossRef] [PubMed]
  18. Chaudhary, S.C.; Kurundkar, D.; Elmets, C.A.; Kopelovich, L.; Athar, M. Metformin, an antidiabetic agent reduces growth of cutaneous squamous cell carcinoma by targeting mTOR signaling pathway. Photochem. Photobiol. 2012, 88, 1149–1156. [Google Scholar] [CrossRef] [PubMed]
  19. Bao, B.; Azmi, A.S.; Ali, S.; Zaiem, F.; Sarkar, F.H. Metformin may function as anti-cancer agent via targeting cancer stem cells: The potential biological significance of tumor-associated miRNAs in breast and pancreatic cancers. Ann. Transl. Med. 2014, 2, 59. [Google Scholar]
  20. Dowling, R.J.; Zakikhani, M.; Fantus, I.G.; Pollak, M.; Sonenberg, N. Metformin inhibits mammalian target of rapamycin-dependent translation initiation in breast cancer cells. Cancer Res. 2007, 67, 10804–10812. [Google Scholar] [CrossRef] [PubMed]
  21. Zhou, G.; Myers, R.; Li, Y.; Chen, Y.; Shen, X.; Fenyk-Melody, J.; Wu, M.; Ventre, J.; Doebber, T.; Fujii, N.; et al. Role of AMP-activated protein kinase in mechanism of metformin action. J. Clin. Investig. 2001, 108, 1167–1174. [Google Scholar] [CrossRef]
  22. Zakikhani, M.; Dowling, R.; Fantus, I.G.; Sonenberg, N.; Pollak, M. Metformin is an AMP kinase-dependent growth inhibitor for breast cancer cells. Cancer Res. 2006, 66, 10269–10273. [Google Scholar] [CrossRef]
  23. Vakana, E.; Platanias, L.C. AMPK in BCR-ABL expressing leukemias. Regulatory effects and therapeutic implications. Oncotarget 2011, 2, 1322–1328. [Google Scholar] [CrossRef] [PubMed]
  24. Pusceddu, S.; Vernieri, C.; Di Maio, M.; Marconcini, R.; Spada, F.; Massironi, S.; Ibrahim, T.; Brizzi, M.P.; Campana, D.; Faggiano, A.; et al. Metformin Use Is Associated With Longer Progression-Free Survival of Patients With Diabetes and Pancreatic Neuroendocrine Tumors Receiving Everolimus and/or Somatostatin Analogues. Gastroenterology 2018, 155, 479–489.e7. [Google Scholar] [CrossRef] [PubMed]
  25. Lee, J.; Yesilkanal, A.E.; Wynne, J.P.; Frankenberger, C.; Liu, J.; Yan, J.; Elbaz, M.; Rabe, D.C.; Rustandy, F.D.; Tiwari, P.; et al. Effective breast cancer combination therapy targeting BACH1 and mitochondrial metabolism. Nature 2019, 568, 254–258. [Google Scholar] [CrossRef] [PubMed]
  26. Saini, N.; Yang, X. Metformin as an anti-cancer agent: Actions and mechanisms targeting cancer stem cells. Acta Biochim. Biophys. Sin. 2018, 50, 133–143. [Google Scholar] [CrossRef]
  27. Boukalova, S.; Stursa, J.; Werner, L.; Ezrova, Z.; Cerny, J.; Bezawork-Geleta, A.; Pecinova, A.; Dong, L.; Drahota, Z.; Neuzil, J. Mitochondrial Targeting of Metformin Enhances Its Activity against Pancreat Cancer. Mol. Cancer Ther. 2016, 15, 2875–2886. [Google Scholar] [CrossRef]
  28. Meireles, C.G.; Lourenco de Lima, C.; Martins de Paula Oliveira, M.; Abe da Rocha Miranda, R.; Romano, L.; Yo-Stella Brashaw, T.; Neves da Silva Guerra, E.; de Assis Rocha Neves, F.; Chapple, J.P.; Simeoni, L.A.; et al. Antiproliferative effects of metformin in cellular models of pheochromocytoma. Mol. Cell Endocrinol. 2022, 539, 111484. [Google Scholar] [CrossRef] [PubMed]
  29. Hawley, S.A.; Gadalla, A.E.; Olsen, G.S.; Hardie, D.G. The antidiabetic drug metformin activates the AMP-activated protein kinase cascade via an adenine nucleotide-independent mechanism. Diabetes 2002, 51, 2420–2425. [Google Scholar] [CrossRef] [PubMed]
  30. Yamana, H.; Kato, K.; Kobara, H.; Fujihara, S.; Fujita, K.; Namima, D.; Fujita, N.; Kobayashi, K.; Kamada, H.; Morishita, A.; et al. Metformin Inhibits Proliferation and Tumor Growth of QGP-1 Pancreatic Neuroendocrine Tumor Cells by Inducing Cell Cycle Arrest and Apoptosis. Anticancer. Res. 2020, 40, 121–132. [Google Scholar] [CrossRef] [PubMed]
Figure 1. XF analysis. (A) The OCR of QGP-1 cells at different time points immediately after treatment with 0 (blue), 0.25 (brown), 0.5 (green), or 1.0 mM (red) of metformin. The OCR is measured under oligomycin, FCCP, and antimycin A treatments. Data points represent the mean OCR in five independent cultures, and error bars represent standard errors; (B) immediately after treatment with metformin; (C) the maximum OCR after FCCP decreases in a concentration-dependent manner of metformin; and (D) the OCR of QGP-1 cells after treatment with 0 (blue), 1.0 (green), 2.0 mM (red) of metformin for 48 h. OCR under oligomycin, FCCP, and antimycin A treatments. Data points represent the mean OCR in ten independent cultures, and error bars represent standard errors. (E) The OCR after 48 h treatment with metformin; (F) after 48 h treatment with metformin, the maximum OCR was measured. The measurement progressed while maintaining the tendency of first-time OCR; maximum OCR decreased in a concentration-dependent manner of metformin. * p < 0.05, ** p < 0.01. OCR, oxygen consumption rate; FCCP, carbonyl cyanide p trifluoromethoxy phenylhydrazone; XF, extracellular flux.
Onco 04 00007 g001
Figure 2. Western blotting of p-AMPK, AMPK, and cyclin D1 in QGP-1 cells after 24 h metformin treatment. Relative expression values are shown under the bands (Supplementary Tables S1 and S2). p-AMPK, phosphorylated adenosine monophosphate-activated protein kinase; AMPK, total AMPK.
Onco 04 00007 g002
Figure 3. Cell count, MTT assay, and cell viability of QGP-1 cells treated with 0 (blue), 0.25 (brown), 0.5 (green), and 1.0 mM (red) of metformin for 48 h (A) and 72 h (B). Data points represent the mean cell number in three independent cultures, and error bars represent standard errors. * p < 0.01. MTT, 3-(4,5-dimethylthiazol-2-yl)-2,5-diphenyltetrazolium bromide.
Onco 04 00007 g003
Figure 4. (A) XF analysis of RIN-m: the OCR after treatment with 1.0 or 2.0 mM of metformin for 48 h. OCR under oligomycin, FCCP, and antimycin A treatments. (B) Western blotting of p-AMPK, AMPK, cyclin D1, and cyclin E in RIN-m after 24 h of metformin treatment. Relative expression values are shown under the bands (Supplementary Tables S3 and S4). (C,D) Cell counting and MTT assay of RIN-m cells treated with 0 (blue), 1.0 (brown), 2.0 (green), and 4.0 mM (red) of metformin for 48 h and 72 h. * p < 0.05, ** p < 0.01, **** p < 0.0001.
Onco 04 00007 g004
Disclaimer/Publisher’s Note: The statements, opinions and data contained in all publications are solely those of the individual author(s) and contributor(s) and not of MDPI and/or the editor(s). MDPI and/or the editor(s) disclaim responsibility for any injury to people or property resulting from any ideas, methods, instructions or products referred to in the content.

