Article

Blood Pressure Estimation from Photoplythmography Using Hybrid Scattering–LSTM Networks

1
Department of Electrical Engineering, Faculty of Engineering, Aswan University, Aswan 81542, Egypt
2
Department of Electrical Engineering, Faculty of Engineering, Sohag University, Sohag 82524, Egypt
3
Department of Computer Science, Arab Academy for Science, Technology and Maritime Transport, Aswan 81511, Egypt
4
Graduate School of Biomedical Engineering, Tohoku University, Aramaki, Aoba-ku, Sendai, Miyagi 980-8579, Japan
*
Authors to whom correspondence should be addressed.
BioMedInformatics 2024, 4(1), 139-157; https://doi.org/10.3390/biomedinformatics4010010
Submission received: 15 October 2023 / Revised: 9 November 2023 / Accepted: 2 January 2024 / Published: 9 January 2024
(This article belongs to the Special Issue Feature Papers in Applied Biomedical Data Science)

Abstract

:
One of the most significant indicators of heart and cardiovascular health is blood pressure (BP). Blood pressure (BP) has gained great attention in the last decade. Uncontrolled high blood pressure increases the risk of serious health problems, including heart attack and stroke. Recently, machine/deep learning has been leveraged for learning a BP from photoplethysmography (PPG) signals. Hence, continuous BP monitoring can be introduced, based on simple wearable contact sensors or even remotely sensed from a proper camera away from the clinical setup. However, the available training dataset imposes many limitations besides the other difficulties related to the PPG time series as high-dimensional data. This work presents beat-by-beat continuous PPG-based BP monitoring while accounting for the aforementioned limitations. For a better exploration of beats’ features, we propose to use wavelet scattering transform as a better descriptive domain to cope with the limitation of the training dataset and to help the deep learning network accurately learn the relationship between the morphological shapes of PPG beats and the BP. A long short-term memory (LSTM) network is utilized to demonstrate the superiority of the wavelet scattering transform over other domains. The learning scenarios are carried out on a beat basis where the input corresponding PPG beat is used for predicting BP in two scenarios; (1) Beat-by-beat arterial blood pressure (ABP) estimation, and (2) Beat-by-beat estimation of the systolic and diastolic blood pressure values. Different transformations are used to extract the features of the PPG beats in different domains including time, discrete cosine transform (DCT), discrete wavelet transform (DWT), and wavelet scattering transform (WST) domains. The simulation results show that using the WST domain outperforms the other domains in the sense of root mean square error (RMSE) and mean absolute error (MAE) for both of the suggested two scenarios.

1. Introduction

The control of blood pressure (BP) is crucial, making regular BP monitoring a significant concern. According to the World Health Organization (WHO) [1], 17.9 million people die each year from cardiovascular illnesses. The American Society of Anesthesiologists (ASA) has outlined basic anesthetic monitoring criteria [2], recommending blood pressure checks every 5 min to ensure the patient’s circulatory system functions properly.
According to the ASA, blood pressure should be taken every 5 min to ensure the proper functioning of the patient’s circulatory system. Typically, BP is represented through three essential readings, including systolic, diastolic, and mean pressure, which are defined as follows: the pressure imposed on the walls of blood arteries by blood at the conclusion of systolic ventricular contraction is known as systolic blood pressure (SBP); the pressure imposed on the blood vessel walls at the conclusion of diastole, or relaxation, is known as diastolic blood pressure (DBP); and the pressure that determines the average rate of blood flow through systemic arteries is known as mean pressure.
Continuous arterial blood pressure (ABP) represents the gold standard of BP monitoring; however, it is difficult to measure in routine clinical practice because it is performed via arterial cannulation by a trained operator. Auscultatory, oscillometry, tonometry, and volume clamping methods are commonly used in traditional BP monitoring.
Traditional blood pressure monitoring techniques have two main drawbacks. Firstly, they require special instruments that may not be available to everyone. Secondly, these methods are not always suitable for babies and elderly individuals. As a result, using existing technologies is challenging, as they are unsafe for high-rate usage. Frequent use of cuff-based BP monitoring at a high rate can cause a measurement error due to the deterioration of the mechanical parts. Hence, continuous BP monitoring cannot be effectively carried out through traditional non-invasive approaches.
Recently, photoplethysmography (PPG) signals have been leveraged for continuous BP monitoring through simple wearable devices [3,4,5] through simple wearable devices [6]. PPG signal represents changes in blood volume in the skin blood vessels by tracking fine variations in the absorbed/reflected infrared light intensity due to blood pulsation. These changes not only explain blood volume but also provide information on blood flow and red blood cell orientation.
Thanks to the publicly available MIMIC II dataset (Multi-parameter Intelligent Monitoring in Intensive Care) [7], which provides joint PPG–ABP data along with electrocardiogram (ECG) signals. Numerous research efforts have been dedicated to inferring the relationship between PPG and BP based on these available datasets through machine learning [8,9,10,11,12,13] and deep-learning techniques [14,15,16,17,18,19].
In this paper, we propose an efficient approach for beat-by-beat BP estimation from PPG signals utilizing different feature extraction methods and deep learning techniques. Different learning scenarios are carried out in this study: (1) estimation of ABP beats from the corresponding PPG beats, and (2) estimation of BP values (SBP and DBP) from the corresponding PPG beats.
Section 2 discusses recently published BP estimation methods, the motivation, and challenges of BP estimation, and finally it presents the contributions of our study. Section 3 presents the datasets and preprocessing techniques used in the study. Section 4 explains the proposed method. Section 5 presents the results of the proposed method. Section 6 summarizes the study and highlights some lines of our future work.

2. Related Works

Recently, several BP estimation methods have been proposed in the literature, leveraging machine and deep learning techniques. Literature in the field of BP monitoring can be categorized into two main groups: BP estimation and ABP waveform reconstruction. These clusters are based on both PPG and ECG signals.
For example, the authors in the work presented in [13] extracted features from contact PPG to train a neural network for BP determination. This system has undergone experimentation on patients. In [14], deep learning networks have been evaluated for BP estimation based on both contact PPG and camera-based remote PPG (rPPG) signals. A spectro-temporal deep neural network is employed to estimate BP in [15]. The authors used the MIMIC III database to train the network after many prepossessing operations. The authors used the MIMIC II database [7] to train the network after many prepossessing operations. The experimental results showed that the mean absolute errors were 9.43 and 6.88 for SBP and DBP, respectively.
Instead of using a single PPG sensor approach, two sensors were employed to estimate BP in [17,20,21,22,23,24]. In the work presented in [23], the authors suggested using the pulse transit time (PTT) and pulse arrival time (PAT) with the PPG signal that is collected using the contact method to find the blood pressure. The time it takes for a pressure wave to transition between two artery sites is known as the PTT. Authors in the work presented in [23] investigated the relationship between BP and PTT in various scenarios. The pulse arrival time is the amount of time that elapses between when the heart is electrically stimulated and when the pulse wave reaches a certain location on the body (PAT). To rephrase, PAT is the combination of the PTT plus the isovolumic contraction duration and ventricular electromechanical delay, collectively termed as the pre-ejection period (PEP) delay. PAT is still employed in the literature because of its simplicity even though it has been discovered that it can lower diastolic pressure accuracy.
In addition to using a cuffless method, pulse wave velocity (PWV) can be used to estimate blood pressure as well. This strategy is based on the hypothesis that BP may be roughly estimated from the speed of the heartbeat pulse. In the work presented in [21], the authors confirmed the relationship between PWV and SBP by experiments applied to 63 volunteers. Jointly using two kinds of signals, ECG and PPG signals, this method is not recommended because it needs signals from two different sensors. Also, the estimated signals in this scheme need more refinements to be clearer. In the work presented in [25], a scheme to convert the PPG signal to the ABP signal has been introduced using the federated learning approach. The simulation results explained that the mean absolute error was improved to reach 2.54 mmHg. In contrast, the standard deviation was 23.7 mmHg for the mean arterial blood pressure.
In the work presented in [26], a unique blood pressure estimation technique based on the feature of PPG signals using LSTM and PCA was presented. The raw PPG signals were employed to extract 12 time-domain features. Moreover, ten features were extracted from the raw PPG signals using principal component analysis (PCA). By using the long short-term memory network (LSTM) model, all sets of features were merged to produce 22 features for blood pressure estimation. The LSTM model was adopted to implement a waveform-based technique for continuous BP measurement from ECG and PPG waveforms [27]. The model had two layers: one artificial neural network (ANN) that trained the features from signal sound waves and another LSTM that created the temporal correlation between the relatively low hierarchy’s extracted features with output SBP and DBP values. This model’s performance is highly dependent on the ECG and PPG cycles. A hybrid CNN-RNN model is adopted as well to estimate BP from PPG signals. In [28], a phase network is proposed for BP estimation. The first phase preferred two CNNs to extract features from PPG segments before estimating the systolic and diastolic blood pressures independently. The second phase applied LSTM to capture temporal dependencies. In this model CNN network is used as a feature extractor and LSTM is used as the BP estimator.
On the other hand, the ABP waveform is approximated using two deep learning models [17]. An approximation network, which is a one-dimensional U-Net network fed with PPG and ECG signals, was first used to estimate the waveform. Then, an iterative network to resolve the estimated BP waveforms is employed. Then, ABP is used to calculate SBP and DBP by finding the maximum and minimum values of the ABP signal, respectively. In another research [29], a 1D V-Net deep learning algorithm for BP waveform prediction is used. The model is fed with two signals (ECG and PPG). The main problem is that the model necessitates a large amount of input variables as well as noninvasive blood pressure indicators.
Furthermore, the work presented in [30] explored the use of a cycle generative adversarial network (Cycle GAN) to assess BP waveforms employing PPG data. The authors estimated the waveforms using a transformer and a convolutional network, using data from the same subject for training and testing, which may impact the realism of the results.

2.1. Challenges and Motivations

Data quality: Clean data is mainly required for fully exploiting deep-learning power. However, any practical dataset needs some cleaning for excluding deformed signals, hence, mitigating disturbing the training operations. Cleaning is performed because defected (deformed) signals are invalid for training. Strict data cleaning reduces the amount of available data essentially to the extent that becomes insufficient for the network to infer the underlying phenomena.
PPG nature as time series: The nature of the PPG signal can be described as a time series or high dimensional data. The different signals exhibit general deformation and translation. Moreover, based on our observations, there are many PPG classes or shapes related to the same BP range. So, learning these complicated relationships requires effective feature simplification before the deep learning stage. Two difficulties were reported during the examination of PPG/ABP signals. There was a shift in the foot position in some PPG signals, and the foot position was not clear in others due to poor signal recording. The position of the peak and foot must be clear and consistent to extract the correct feature values. As a result, the wavelet scattering transform (SWT) was used to overcome the two previously mentioned challenges.
Training Bases: Using Beat-by-Beat training rather than signal-based training.
Available data: In this work, we focus on BP monitoring from PPG signals only rather than using both PPG and ECG signals.

2.2. Contributions

For a better exploration of beats’ features, we propose to merge deep learning with efficient feature extraction means to cope with the limitation of the training dataset and to help the deep learning network accurately learn the relationship between the morphological shapes of PPG beats and the BP. Hence, deep learning models are applied to a better representative domain rather than the time domain. So, we can summarize our contributions as follows:
First, wavelet scattering transform (WST) is applied to provide an efficient feature extraction prior to deep learning stage. It adds shift invariance property along with some resistance to local deformation.
Second, the performance of WST is compared against different feature extraction domains including time domain, discrete wavelet transforms (DWT), and discrete cosine transform (DCT).
Third, two different learning scenarios are carried out on a beat basis where the input PPG beat is used for predicting:
  • Scenario 1: Corresponding complete the ABP beat. Here, ABP beats are estimated from the corresponding PPG beats.
  • Scenario 2: Just systolic, and diastolic BP values. In this scenario, BP values (SBP and DBP) are estimated from the corresponding PPG beats.

3. Materials Used

This section describes the dataset employed in the proposed deep-learning scenarios. Also, the pre-processing operations are described as well.

3.1. Data Set

The combined PPG-ABP data, which is needed as input to the learning models, is provided by Physionet’s MIMIC II data collection (Multi-parameter Intelligent Monitoring in Intensive Care) [31]. In [17], a better-assembled version of the data is provided publically. An inspection of that data set, however, indicates a high number of erroneous PPG and ABP signals. That dataset will be used to produce a simultaneously cleaned PPG-ABP dataset [32] that will be fed into two deep learning-based BP estimation models. This original data set contains 12,000 records of varying lengths. In each record, ABP (invasive arterial blood pressure in millimeters of mercury), PPG (photoplethysmograph from fingertip), and ECG (electrocardiogram from channel II) data are taken at Fs = 125 samples per second. However, we’re just interested in the PPG beats and the ABP labels/beats that go with them. For efficient processing and filtering, records are separated into 1024 sample pieces. So far, 30,660 signals have been introduced. Figure 1 shows an example for dataset sample including the PPG signal and the corresponding ABP ground truth signal. For being used, these signals are aligned, segmented, and cleaned to use only valid beats.

3.2. Preprocessing

PPG signals can only be pre-processed using any boosting method (for example, band-pass filtering in the [0.5–8] Hz frequency range) as long as their morphological form is not altered. On the other hand, the ABP signal cannot be manipulated since any attempt to increase its quality changes its magnitude, which shows the BP value. During the beat segmentation step, PPG beats will also be altered, but corresponding ABP beats will be kept alone. Without filtering, significantly distorted ABP signals or beats must be eliminated.

4. Methodology

In this work, continuous beat-by-beat BP monitoring is proposed based on the wavelet scattering transform. We are motivated by wavelet scattering transform capabilities that meet the underlying challenges imposed by the usage of the available dataset. WST provides unsupervised feature extraction, hence; the training is performed on the better representative feature domain rather than the noisy time domain. It is recommended to merge the ScatNet with conventional deep learning networks such as the convolutional neural network (CNN) to enhance its learning performance and stability [33,34,35,36]. However, for 1-D signals or time series modeling, recurrent neural networks (RNNs) such as long short-term memory (LSTM) is preferred over CNNs. So, ScatNet is used in the first stage for simplifying signal features followed by the LSTM network in the next stage for training on the simplified representations. Specifically, the ScatNet introduces trustworthy feature retrieval at various beat sizes along with invariance to shift/rotation and small deformation. Hence, it absorbs some of the encountered dataset artifacts.
We introduce two BP prediction scenarios (shown in Figure 2): (1) Beat-by-beat cPPG/ABP mapping: The training is performed for mapping individual PPG beats into corresponding ABP beats. Hence, SBP/DBP (systolic/diastolic BPs) can be found as the maximum/minimum values of the output ABP beat. (2) Beat-by-beat cPPG-to-SBP/DBP mapping: The training is performed for mapping individual contact PPG (cPPG) beats into corresponding SBP/DBP values directly. The two scenarios are performed on a beat basis to provide continuous beat-by-beat BP minoring. Hence, the PPG signal is segmented into beats and the time interval is recorded. Beat-by-beat selection is performed to select valid beats for training, testing, and validation. Notably, the time indexes of all beats are normalized to be with a fixed length, which helps to improve the performance and training stability of the deep learning model. The time interval of each beat is used as extra data in the training, testing, and validation processes in the case of time domain features. The corresponding ABP signals are segmented as well into beats, however, the ABP beats are normalized in time, but not in amplitude. In the second scenario, the normalized PPG beats are used with the BP (SBP and DBP) for each beat for training, validation, and testing. The following processes are applied to estimate BP in both scenarios. The proposed system is evaluated with the remotely estimated PPG (rPPG) to estimate ABP and BP.

4.1. Preprocessing Stage

To remove the contaminating noise, PPG signals are passed through a bandpass filter in the cardiac frequencies [0.5–8 Hz] where the fundamental frequency is in this range a round fundamental frequency, and its first harmonics.

4.2. Signal Segmentation

The filtered signal is divided into beats in this stage so that each beat may be addressed separately. The identification of local minimum locations serves as the foundation for signal segmentation. The local minimum locations for the filtered signal are shown in Figure 3. A crucial feature of the beats is the beat interval (BI), which is the period between each pair of successive minimums [37].

4.3. Beat Selection

Not all the beats are valid for training, testing, validation, and BP prediction. Therefore, three criteria are used for selecting valid beats. Figure 4 shows plots for different segmented beats of the filtered signal with valid and invalid beats. In this figure, it can be shown that many beats are not valid, i.e., with irregular shapes. These beats may disturb the DL network in both training and testing processes.
To reject these beats, the following criteria are used [32]:
Beat interval (BI): the standard range of the heart rate is [40–180 bpm] which corresponds beat interval in the range [1.5–0.33] second. Therefore, we use only beats with beat intervals in the range 0.33 ≤ BI ≤ 1.5. Figure 4a shows examples for valid and invalid beats in sense of BI. One of the beats shown in this figure has BI of 1.25, even if this value is in the valid range, it is far from the average value of the valid range which makes it not valid in strict sense of BI.
Beat Skewness quality index (SQI): Skewness is defined as the difference between the shape of the beat and the standard beat shape. The normal beats have positively skewed shapes. It is also can be called the right-skewed beat. A tail is referred to as the tapering of the curve differently from the data points on the other side If the given beat is shifted to the right and with its tail on the left side, it is a negatively skewed beat. It is also called a left-skewed distribution. The skewness value of any distribution showing a negative skew is always less than zero. SQI can be calculated as
S Q I = i = 1 N ( Y i Y ~ ) 3 / N S 3
where Yi is the beat’s amplitude at index i, Y~ is the mean, S is the standard deviation, and N is the number of beat’s points. In this work, we restrict our beats with only positive SQI. Moreover, the high positivity of SQI leads to a long-tailed beat which is not a normal beat. In our work, we use valid beats with 0 ≤ SQI ≤ 1. Figure 4b shows examples of valid and invalid beats in the sense of SQI. This figure shows three beats with SQI equals −0.9, −0.3 and 0.4. The first two values are negative which correspond invalid beats. On the other hand, positive SQI corresponds to a valid beat in the sense of SQI.
Beat correlation quality index (CQI): The correlation with a standard beat can help restrict beats to be within a valid range. However, the correlation should be not strict that is CQI should be more than 0.3 to ensure rejecting highly deviated beats. Figure 4 demonstrates some of the accepted beats according to these criteria. Figure 4c shows examples of valid and invalid beats in the sense of CQI. This figure shows beats with CQI equals 0.13, 0.19 and 0.94. The first two beats are invalid in the sense of CQI and the third one is a valid beat with a high correlation to a standard beat.
Some of the selected beats, based on the suggested three criteria, are shown in Figure 5.

4.4. Deep Learning Model

WST is introduced as an effective tool for feature extraction. It provides shift-invariant representation that is stable to rotation and local deformation [38]. In this way, it discards the uninformative variations in the signal. So, it has been employed for ECG signal classification [39]. It is regarded as a deep convolutional network (referred to as “ScatNet”) [40] that cascades wavelet transforms and modules nonlinearity. It addresses the main challenges related to CNN networks, represented in: (1) the need for large training data and computations, (2) the choice of many hyperparameters, and (3) the difficulty in interpreting the features. Unlike CNN networks, the filters employed in the convolution stage in ScatNet are computed without training. The feature coefficients are computed by WST as explained in Section 4.5. Features can be explained and visualized efficiently [35]. The following subsections describe both WST and LSTM networks. Figure 6 shows the proposed hybrid deep-learning model along different feature extractors in different domains.

4.5. Wavelet Scattering Transform (WST)

The proposed work employs a signal analysis technique known as wavelet scattering transform to estimate the ABP signal from the PPG signal. The SWT was invented by Stephane Mallat [40]. Its primary goal is to generate a representation of signals or images for classification tasks and in this work, for the first time, we proposed SWT to estimate ABP signal from PPG signal as a regression task. The preceding is accomplished by developing a translation-invariant representation that is resistant to small time-warping deformations. The magnitude of the FT is translation invariant but not stable to small-time warping deformations and the WT is a translation covariant. To generate stability to deformations, the SWT employs convolution with wavelets, nonlinearity applied through modulus operations, and averaging via scaling functions or low-pass filters.
Wavelet transform is a common time-frequency analysis method that has multi-scale and the stability of local deformation. It can extract local feature information from signals well, but it will change over time and easily cause signal feature omission. Scattering transform is an improved time-frequency analysis method based on wavelet transform. The method is essentially an iterative process of complex wavelet transform, modulus operation, and low-pass filtering averaging. It overcomes the drawback of the wavelet transform changing over time while also providing translation invariance, local deformation stability, and rich feature information representation.
The SWT is divided into three stages that cascade:
First, the signal x is decomposed and convolved with a dilated mother wavelet ψ of center frequency λ , yielding x * ψ λ .
Second, the convolved signal is subjected to a nonlinear modulus operator, which typically raises the signal frequency and can compensate for downsampling information loss.
Third, the absolute convolved signal is subjected to a time-average/low-pass filter in the form of a scaling function, yielding x ψ λ J .
By using iterative wavelet decomposition, modular operation, and a low-pass filter, the scattering transform creates invariant, stable, and informative signal feature representation. The process is essentially an iterative process that calculates the input signal and the wavelet modulus operator. The first part of the wavelet modulus operator is known as the invariant part S x , and it is used as the order’s coefficient output. The second part is known as the covariant part U x , and it serves as the input to the next-order transformation. The goal is to recover the high-frequency information that was lost during the invariant part’s operation.
To compute the WST of a signal x , this signal is processed in three successive operations to generate wavelet scattering coefficients in each stage. These operations are convolution, nonlinearity, and averaging, respectively. Figure 7 displays multiresolution/multilayer wavelet scattering transforms in which the scattering coefficients should be determined at each layer [40] as follows:
The zeroth-order scattering coefficients are calculated using basic input averaging as follows:
S 0 x = x J u
U 1 x u , λ = x ψ λ u
Then, let U 1 x ( u , λ ) as the input of the first order of the scattering transform, a new wavelet modulus operator is used to calculate the results.
S 1 x u , λ = U 1 x u , λ J u = x ψ λ u J u
U 2 x u , λ 1 , λ 2 = U 1 x u , λ 1 ψ λ 2 u = x ψ λ 1 u ψ λ 2 u
The wavelet cluster ψ λ 2 in U 2 x u , λ 1 , λ 2 needs to satisfy the scale j 1 > j 2 . Because the energy is very small, when j 1 > j 2 . Then, the iteration operation is repeated, and the scattering output at m-order is as follows:
S m x u , λ 1 , , λ m = x ψ λ 1 ψ λ m J u
U m + 1 x u , λ 1 , , λ m + 1 = x ψ λ 1 ψ λ m + 1 ( u )
The final scattering coefficients are all the output sets of the scattering transform from the 0th to the m-th order:
S x = S 0 x , S 1 x , , S m x

4.6. LSTM Network

The LSTM neural networks for integrated channel equalization and symbol detection are covered in this section. The proposed DL–LSTM-based BP and ABP estimate is trained offline with simulated data.
Input, output, and forget gates, as well as a memory cell, comprise the LSTM structure shown in Figure 8. The LSTM properly stores long-term memory via the forget and input gates. The LSTM cell’s primary structure is depicted in Figure 8, in [41]. The forget gate allows the LSTM to eliminate the unwanted data from the last process by using the Presently used input S x t and the cell output h t . Based on the preceding cell output h t 1 and the Present cell’s input x t , the input gate determines the data that will be utilized in conjunction with the preceding LSTM cell state c t 1 to generate a new state of the cell c t . LSTM may decide which data is discarded and which is maintained by using the forget and input gates. LSTM has several advantages over other RNNs, such as their ability to learn long-term dependencies and capture complex patterns in sequential data [41].

5. Experimental Results and Discussion

In this section, the results of BP from PPG are reported according to two learning scenarios: (1) Per-beat continuous PPG-to-ABP learning, and (2) Per-beat discrete PPG-to-SBP/DBP learning scheme. These scenarios are shown in Figure 6, while the detailed network configurations are described in Table 1 and Table 2. Based on these two learning scenarios, we are interested in studying the impact of the feature extraction stage on the overall performance. So, different feature extractors are used besides WST.
The dataset which is cleaned in the work presented in [32] is used. It is the same as that in MIMIC II [31] after cleaning using the cleaning criteria. It was split into training, validation, and test sets on a beat basis to prevent contamination of the validation and test set by training data.
The total number of beats in the training phase is 175,660 beats; 90% of these beats (158,094 beats) are used for training and 10% of these beats (17,566 beats) are used for validation. In the testing phase, 17,566 beats are used for testing.
We used the mean absolute error (MAE) metric to assess the performance of all methods. We determined the prediction errors for the full dataset.
The segmented PPG beats are normalized to be in the range [0–1] by using the following equation.
S n = S m i n ( S ) max S m i n ( S )  
where Sn is the normalized signal and S is the un-normalized beat. The normalized beats are then normalized in time to be with a fixed length of 120. The time interval is used as a feature besides the normalized beats. The corresponding ABP signals are also divided into beats, however, the ABP beats are only normalized in terms of time and not amplitude. The complete ABP beat represents the label for the first scenario, while only its maxima (SBP) and minima (DBP) points are utilized for labeling in the second scenario.
For the two tested scenarios, beat-by-beat is used in training, validation, and testing rather than signals, the input to the LSTM network is a beat (or corresponding feature domain representation) with a length of 120 in addition to BI (in the case of time domain features) as tabulated in Table 2. In the first scenario, ABP estimation, the output is a sequence with a size equal to 120 × 1 for all feature domains. On the other hand, in the second BP estimation scenario, the output is two values that are the SBP and the DBP, for all feature domains.

5.1. Beat-by-Beat cPPG-to-ABP Mapping

The first scenario for estimating the BP is the estimation of the ABP which can be thought of as the continuous-time BP. In this section, the ABP beats are estimated from the corresponding PPG beats by using the LSTM network with a 120 × 1 sequence regressor output layer. As the output represents a sequence and we are interested in the time series ABP, there are seven possible training combinations for ABP estimation with different feature domains. These combinations are (1) using time domain (TD) for PPG beats with BI and TD for the ABP beats, (2) using DCT for PPG beats and TD for ABP, (3) using DCT for PPG beats and DCT for ABP and then using IDCT for comparison and evaluation, (4) using DWT for PPG beats and TD for ABP, (5) using DWT for PPG beats and DWT for ABP and then using IDWT for comparison and evaluation, (6) using WST for PPG beats and TD for ABP, (7) using WST for PPG beats and DWT for ABP and then using IDWT for comparison and evaluation. The last case is done with the WST-DWT combination because WST is not invertible and the DWT has the nearest features to the WST.
Table 3 shows the RMSE and MAE for the estimated ABP beats with different cases and different feature domains. As expected, using WST outperforms the other feature domains. Also, using the WST–DWT combination has a small enhancement compared to the WST-TD case. This is due to that learning the relation between the WST of PPG and DWT of the ABP is difficult and requires a complex network. Figure 9 shows an example of the reconstructed ABP beats with different feature domains and different cases compared to the ground truth ABP beat. As shown from this figure, the estimated ABP beat by using WST–TD and WST–DWT are highly related and correlated to the ground truth ABP beat.

5.2. Evaluation of the Proposed Method Using cPPG Signals

Table 4 shows a comparison between different feature domains in the sense of RMS error and MAE for the estimated SBP and DBP. From this table, it can be shown that using the time domain, DCT domain, or DWT domain has a small effect on the BP estimation due to the sensitivity to the beat shift and scale. On the other hand, using WST has a recognized improvement of the RMSE and MAE due to better feature localization and insensitivity to shifting and scaling. Scattering plots of the predicted SBP and DBP versus the actual values are shown in Figure 9. This figure is consistent with the RMSE and MAE values where the predicted SBP and DBP are less scattered in the case of WST domain compared to the time, DCT, and DWT domains.
Figure 10 shows the relationship between the predicted (SBP and DBP) and the corresponding ground truth values using different feature domains. This figure confirms the superiority of the proposed WST-based method compared to other feature domains.

5.3. Evaluation of the Proposed Method Using rPPG Signals

As the main goal of this work is to predict BP remotely by using a video camera, the proposed system is evaluated with the public rPPG datasets [38] to show its performance with rPPG signals. Similarly, the rPPG signals are segmented into beats and normalized to be in the range [0–1] using Equation (9). The normalized beats are then normalized in time to be with the fixed length (120). The time interval is used as a feature besides the normalized beats for BP prediction.
As in the case of cPPG, the performance of the predicted SBP and DBP by using different DL networks with the rPPG datasets. Figure 11 shows plots of three examples for the estimated ABP using beat-by-beat with different feature domains. From these figures, it can be shown that using the scattering wavelet transform as a feature domain can track the maximum value of ABP (SBP) as well as the minimum value of ABP (DBP). In addition, the mean absolute error and mean square error for the estimated DBP and SBP from rPPG beats are shown in Table 5.

5.4. Discussion

Utilizing LSTM time sequence-to-value regression, the estimation of systolic blood pressure (SBP) and diastolic blood pressure (DBP) is performed based on the corresponding photoplethysmography (PPG) features. Four feature domains are tested, including the time domain, DCT domain, DWT domain, and WST domain.
In the time domain, beat interval information is included in the input sequence. Each feature domain has its advantages: the time domain incorporates beat interval and PPG behavior, linked to the behavior of arterial blood pressure (ABP) in the time domain, reflecting BP behavior. However, time domain features necessitate a substantial dataset and a complex network to directly extract deep features from PPG beats.
On the other hand, the DCT feature domain compresses beat features into a small number of points, aiding in reducing input size with less deformation. In this study, full-length DCT features were used for a fair comparison. The main drawback of this domain is that error prediction of the DC and low-frequency components may yield destructive results in BP and ABP estimation.
The DWT domain offers combinational features in both time and frequency, making it suitable for ABP and BP estimation. However, it is sensitive to signal shifting and scaling, common in PPG signals, potentially causing errors due to scaling and shifting. In contrast, WST does not suffer from the effects of shifting and scaling in PPG beats. Therefore, WST emerges as the most suitable feature extractor, aiding the LSTM network in learning the relationship between PPG and ABP, and subsequently facilitating accurate BP estimation.

6. Conclusions and Future Work

Recently, blood pressure (BP) has been learned from electrocardiogram (ECG) and/or photoplethysmography (PPG) signals through machine learning or deep learning approaches. In this paper, we present beat-by-beat BP estimation from PPG beats only, employing a hybrid feature extraction and deep-learning approach. Two learning scenarios are introduced using different feature domains, namely, (1) per-beat continuous PPG-to-ABP mapping, and (2) per-beat PPG-to-SBP/DBP learning. The feature domain is introduced to assist the deep learning network in understanding the complex relationships between PPG and arterial blood pressure (ABP) waveforms and overcoming limitations in the training dataset. Among the applied feature extractors, wavelet scattering transform (WST) outperforms other feature domains in terms of root mean square error (RMSE) and mean absolute error (MAE). Additionally, the reconstructed ABP beats exhibit a high correlation with the ground truth ABP when using WST–TD and WST–DWT. As future work, it is suggested to (1) replace LSTM with another deep learning network, and (2) explore changes in the WST filtering based on another complex wavelet.

Author Contributions

Conceptualization, O.A.O., M.S., A.M.H., N.S. and Y.S.; Methodology, O.A.O., M.S., A.M.H., N.S. and Y.S.; Software, O.A.O. and M.S.; Validation, O.A.O., M.S., A.M.H., N.S. and Y.S.; Formal analysis, O.A.O., M.S., A.M.H. and N.S.; Investigation, O.A.O., M.S., A.M.H. and N.S.; Resources, O.A.O. and M.A.-N.; Data curation, O.A.O. and M.S.; Writing—original draft, O.A.O. and M.S.; Writing—review & editing, O.A.O., M.S., M.A.-N., N.S. and Y.S.; Visualization, O.A.O.; Supervision, M.A.-N. and O.A.O.; Project administration, M.A.-N. and O.A.O.; Funding acquisition, M.A.-N. and O.A.O. All authors have read and agreed to the published version of the manuscript.

Funding

This research received no external funding.

Institutional Review Board Statement

Not applicable.

Informed Consent Statement

Not applicable.

Data Availability Statement

The authors declare that the manuscript consists of the public dataset for PPG signals and does not include any human or animal studies. Our cleaned dataset will be made available to those concerned upon request.

Conflicts of Interest

The authors declare no conflict of interest.

References

  1. Available online: https://www.who.int/health-topics/cardiovascular-diseases#tab=tab (accessed on 5 March 2022).
  2. American Society of Anesthesiologists. Standards of the American Society of Anesthesiologists: Standards for Basic Anesthetic Monitoring. 2020. Available online: https://www.asahq.org/standards-and-guidelines/standards-for-basic-anesthetic-monitoring (accessed on 1 October 2023).
  3. Martínez, G.; Howard, N.; Abbott, D.; Lim, K.; Ward, R.; Elgendi, M. Can photoplethysmography replace arterial blood pressure in the assessment of blood pressure? J. Clin. Med. 2018, 7, 316. [Google Scholar] [CrossRef]
  4. Panula, T.; Sirkia, J.-P.; Wong, D.; Kaisti, M. Advances in non-invasive blood pressure measurement techniques. IEEE Rev. Biomed. Eng. 2022, 16, 424–438. [Google Scholar] [CrossRef]
  5. Moraes, J.; Rocha, M.; Vasconcelos, G.; Filho, J.V.; De Albuquerque, V.; Alexandria, A. Advances in photopletysmography signal analysis for biomedical applications. Sensors 2018, 18, 1894. [Google Scholar] [CrossRef] [PubMed]
  6. Le, T.; Ellington, F.; Lee, T.Y.; Vo, K.; Khine, M.; Krishnan, S.K.; Dutt, N.; Cao, H. Continuous non-invasive blood pressure monitoring: A methodological review on measurement techniques. IEEE Access 2020, 8, 212478–212498. [Google Scholar] [CrossRef]
  7. Goldberger, A.L.; Amaral, L.A.; Glass, L.; Hausdorff, J.M.; Ivanov, P.C.; Mark, R.G.; Mietus, J.E.; Moody, G.B.; Peng, C.K.; Stanley, H.E. PhysioBank, PhysioToolkit, and PhysioNet: Components of a new research resource for complex physiologic signals. Circulation 2020, 101, e215–e220. [Google Scholar]
  8. Slapničar, G.; Luštrek, M.; Marinko, M. Continuous blood pressure estimation from PPG signal. Informatica 2018, 42, 33–42. [Google Scholar]
  9. Haddad, S.; Boukhayma, A.; Caizzone, A. Continuous ppg-based blood pressure monitoring using multi-linear regression. IEEE J. Biomed. Health Inform. 2021, 26, 2096–2105. [Google Scholar]
  10. Yan, W.-R.; Peng, R.-C.; Zhang, Y.-T.; Ho, D. Cuffless continuous blood pressure estimation from pulse morphology of photoplethysmograms. IEEE Access 2019, 7, 141970–141977. [Google Scholar] [CrossRef]
  11. Khalid, S.; Zhang, J.; Chen, F.; Zheng, D. Blood pressure estimation using photoplethysmography only: Comparison between different machine learning approaches. J. Healthc. Eng. 2018, 2018, 1548647. [Google Scholar] [CrossRef] [PubMed]
  12. Maqsood, S.; Xu, S.; Tran, S.; Garg, S.; Springer, M.; Karunanithi, M.; Mohawesh, R. A survey: From shallow to deep machine learning approaches for blood pressure estimation using biosensors. Expert Syst. Appl. 2022, 197, 116788. [Google Scholar]
  13. Xing, X.; Sun, M. Optical blood pressure estimation with photoplethysmography and FFT-based neural networks. Biomed. Opt. Express 2016, 7, 3007–3020. [Google Scholar] [CrossRef]
  14. Schrumpf, F.; Frenzel, P.; Aust, C.; Osterhoff, G.; Fuchs, M. Assessment of deep learning based blood pressure prediction from PPG and rPPG signals. In Proceedings of the IEEE/CVF Conference on Computer Vision and Pattern Recognition, Nashville, TN, USA, 20–25 June 2021; pp. 3820–3830. [Google Scholar]
  15. Slapničar, G.; Mlakar, N.; Luštrek, M. Blood pressure estimation from photoplethysmogram using a spectro-temporal deep neural network. Sensors 2019, 19, 3420. [Google Scholar] [CrossRef] [PubMed]
  16. Harfiya, L.; Chang, C.-C.; Li, Y.-H. Continuous blood pressure estimation using exclusively photopletysmography by LSTM-based signal-to-signal translation. Sensors 2021, 21, 2952. [Google Scholar] [CrossRef] [PubMed]
  17. Ibtehaz, N.; Mahmud, S.; Chowdhury, M.E.H.; Khandakar, A.; Salman Khan, M.; Ayari, M.A.; Tahir, A.M.; Rahman, M.S. PPG2ABP: Translating Photoplethysmogram (PPG) Signals to Arterial Blood Pressure (ABP) Waveforms. Bioengineering 2022, 9, 692. [Google Scholar] [CrossRef]
  18. Hsu, Y.-C.; Li, Y.-H.; Chang, C.-C.; Harfiya, L.N. Generalized deep neural network model for cuffless blood pressure estimation with photoplethysmogram signal only. Sensors 2020, 20, 5668. [Google Scholar] [CrossRef]
  19. Schrumpf, F.; Frenzel, P.; Aust, C.; Osterhoff, G.; Fuchs, M. Assessment of Non-Invasive Blood Pressure Prediction from PPG and rPPG Signals Using Deep Learning. Sensors 2021, 21, 6022. [Google Scholar] [CrossRef]
  20. McCombie, D.B.; Reisner, A.T.; Asada, H.H. Adaptive blood pressure estimation from wearable PPG sensors using peripheral artery pulse wave velocity measurements and multi-channel blind identification of local arterial dynamics. In Proceedings of the 2006 International Conference of the IEEE Engineering in Medicine and Biology Society, New York, NY, USA, 30 August 2006–3 September 2006; pp. 3521–3524. [Google Scholar]
  21. Gesche, H.; Grosskurth, D.; Küchler, G.; Patzak, A. Continuous blood pressure measurement by using the pulse transit time: Comparison to a cuff-based method. Eur. J. Appl. Physiol. 2012, 112, 309–315. [Google Scholar] [CrossRef]
  22. Kachuee, M.; Kiani, M.M.; Mohammadzade, H.; Shabany, M. Cuff-less high-accuracy calibration-free blood pressure estimation using pulse transit time. In Proceedings of the 2015 IEEE International Symposium on Circuits and Systems (ISCAS), Lisbon, Portugal, 24–27 May 2015; pp. 1006–1009. [Google Scholar]
  23. Chen, T.; Ng, S.H.; Teo, J.T.; Yang, X. Method and System for Optical Blood Pressure Monitoring. U.S. Patent 10,251,568, 2019. [Google Scholar]
  24. Mahmud, S.; Ibtehaz, N.; Khandakar, A.; Tahir, A.M.; Rahman, T.; Islam, K.R.; Hossain, M.S.; Rahman, M.S.; Musharavati, F.; Ayari, M.A.; et al. A Shallow U-Net Architecture for Reliably Predicting Blood Pressure (BP) from Photoplethysmogram (PPG) and Electrocardiogram (ECG) Signals. Sensors 2022, 22, 919. [Google Scholar] [CrossRef] [PubMed]
  25. Brophy, E.; De Vos, M.; Boylan, G.; Ward, T. Estimation of continuous blood pressure from ppg via a federated learning approach. Sensors 2021, 21, 6311. [Google Scholar] [CrossRef]
  26. Senturk, U.; Polat, K.; Yucedag, I. A Novel Blood Pressure Estimation Method with the Combination of Long Short Term Memory Neural Network and Principal Component Analysis Based on PPG Signals; Springer: Berlin/Heidelberg, Germany, 2019; pp. 868–876. [Google Scholar]
  27. Tanveer, M.S.; Hasan, M.K. Cuffless blood pressure estimation from electrocardiogram and photoplethysmogram using waveform based ANN-LSTM network. Biomed. Signal Process. Control 2019, 51, 382–392. [Google Scholar] [CrossRef]
  28. Esmaelpoor, J.; Moradi, M.H.; Kadkhodamohammadi, A. A multistage deep neural network model for blood pressure estimation using photoplethysmogram signals. Comput. Biol. Med. 2020, 120, 103719. [Google Scholar] [CrossRef] [PubMed]
  29. Hill, B.L.; Rakocz, N.; Rudas, Á.; Chiang, J.N.; Wang, S.; Hofer, I.; Cannesson, M.; Halperin, E. Imputation of the Continuous Arterial Line Blood Pressure Waveform from Non-Invasive Measurements Using Deep Learning. Sci. Rep. 2021, 11, 15755. [Google Scholar] [CrossRef] [PubMed]
  30. Mehrabadi, M.A.; Aqajari, S.A.H.; Zargari, A.H.A.; Dutt, N.; Rahmani, A.M. Novel Blood Pressure Waveform Reconstruction from Photoplethysmography Using Cycle Generative Adversarial Networks. arXiv 2022, arXiv:2201.09976. [Google Scholar]
  31. Saeed, M.; Lieu, C.; Raber, G.; Mark, R.G. MIMIC II: A massive temporal ICU patient database to support research in intelligent patient monitoring. Comput. Cardiol. 2002, 29, 641–644. [Google Scholar]
  32. Salah, M.; Omer, O.A.; Hassan, L.; Ragab, M.; Hassan, A.M.; Abdelreheem, A. Beat-Based PPG-ABP Cleaning Technique for Blood Pressure Estimation. IEEE Access 2022, 10, 55616–55626. [Google Scholar] [CrossRef]
  33. Oyallon, E.; Mallat, S.; Sifre, L. Generic deep networks with wavelet scattering. arXiv 2013, arXiv:1312.5940. [Google Scholar]
  34. Oyallon, E.; Belilovsky, E.; Zagoruyko, S. Scaling the scattering transform: Deep hybrid networks. In Proceedings of the IEEE International Conference on Computer Vision, Venice, Italy, 22–29 October 2017; pp. 5618–5627. [Google Scholar]
  35. Cotter, F.; Kingsbury, N. Visualizing and improving scattering networks. In Proceedings of the 2017 IEEE 27th International Workshop on Machine Learning for Signal Processing (MLSP), Tokyo, Japan, 25–28 September 2017; pp. 1–6. [Google Scholar]
  36. Oyallon, E.; Zagoruyko, S.; Huang, G.; Komodakis, N.; Lacoste-Julien, S.; Blaschko, M.; Belilovsky, E. Scattering networks for hybrid representation learning. IEEE Trans. Pattern Anal. Mach. Intell. 2018, 41, 2208–2221. [Google Scholar] [CrossRef] [PubMed]
  37. Salah, M.; Hassan, L.; Abdel-khier, S.; Hassan, A.M.; Omer, O.A. Robust Facial-Based Inter-Beat Interval Estimation through Spectral Signature Tracking and Periodic Filtering. In Intelligent Sustainable Systems; Springer: Berlin/Heidelberg, Germany, 2022; pp. 161–171. [Google Scholar]
  38. Sifre, L.; Mallat, S. Rotation, scaling and deformation invariant scattering for texture discrimination. In Proceedings of the IEEE Conference on Computer Vision and Pattern Recognition, Portland, OR, USA, 23 June 2013–28 June 2013; pp. 1233–1240. [Google Scholar]
  39. Liu, Z.; Yao, G.; Zhang, Q.; Zhang, J.; Zeng, X. Wavelet scattering transform for ECG beat classification. Comput. Math. Methods Med. 2020, 2020, 3215681. [Google Scholar] [CrossRef]
  40. Bruna, J.; Mallat, S. Invariant scattering convolution networks. IEEE Trans. Pattern Anal. Mach. Intell. 2013, 35, 1872–1886. [Google Scholar] [CrossRef] [PubMed]
  41. Hochreiter, S.; Schmidhuber, J. Long short-term memory. Neural Comput. 1997, 9, 1735–1780. [Google Scholar] [CrossRef]
Figure 1. An example dataset sample includes the PPG signal and the corresponding ABP signal.
Biomedinformatics 04 00010 g001
Figure 2. Proposed blood pressure monitoring system (testing phase). In the Raw Signal block, the red, green, and blue colors stand for the three channels of RGB images.
Biomedinformatics 04 00010 g002
Figure 3. Beat segmentation based on local minimum detection. The red symbols stand for the end of each beat.
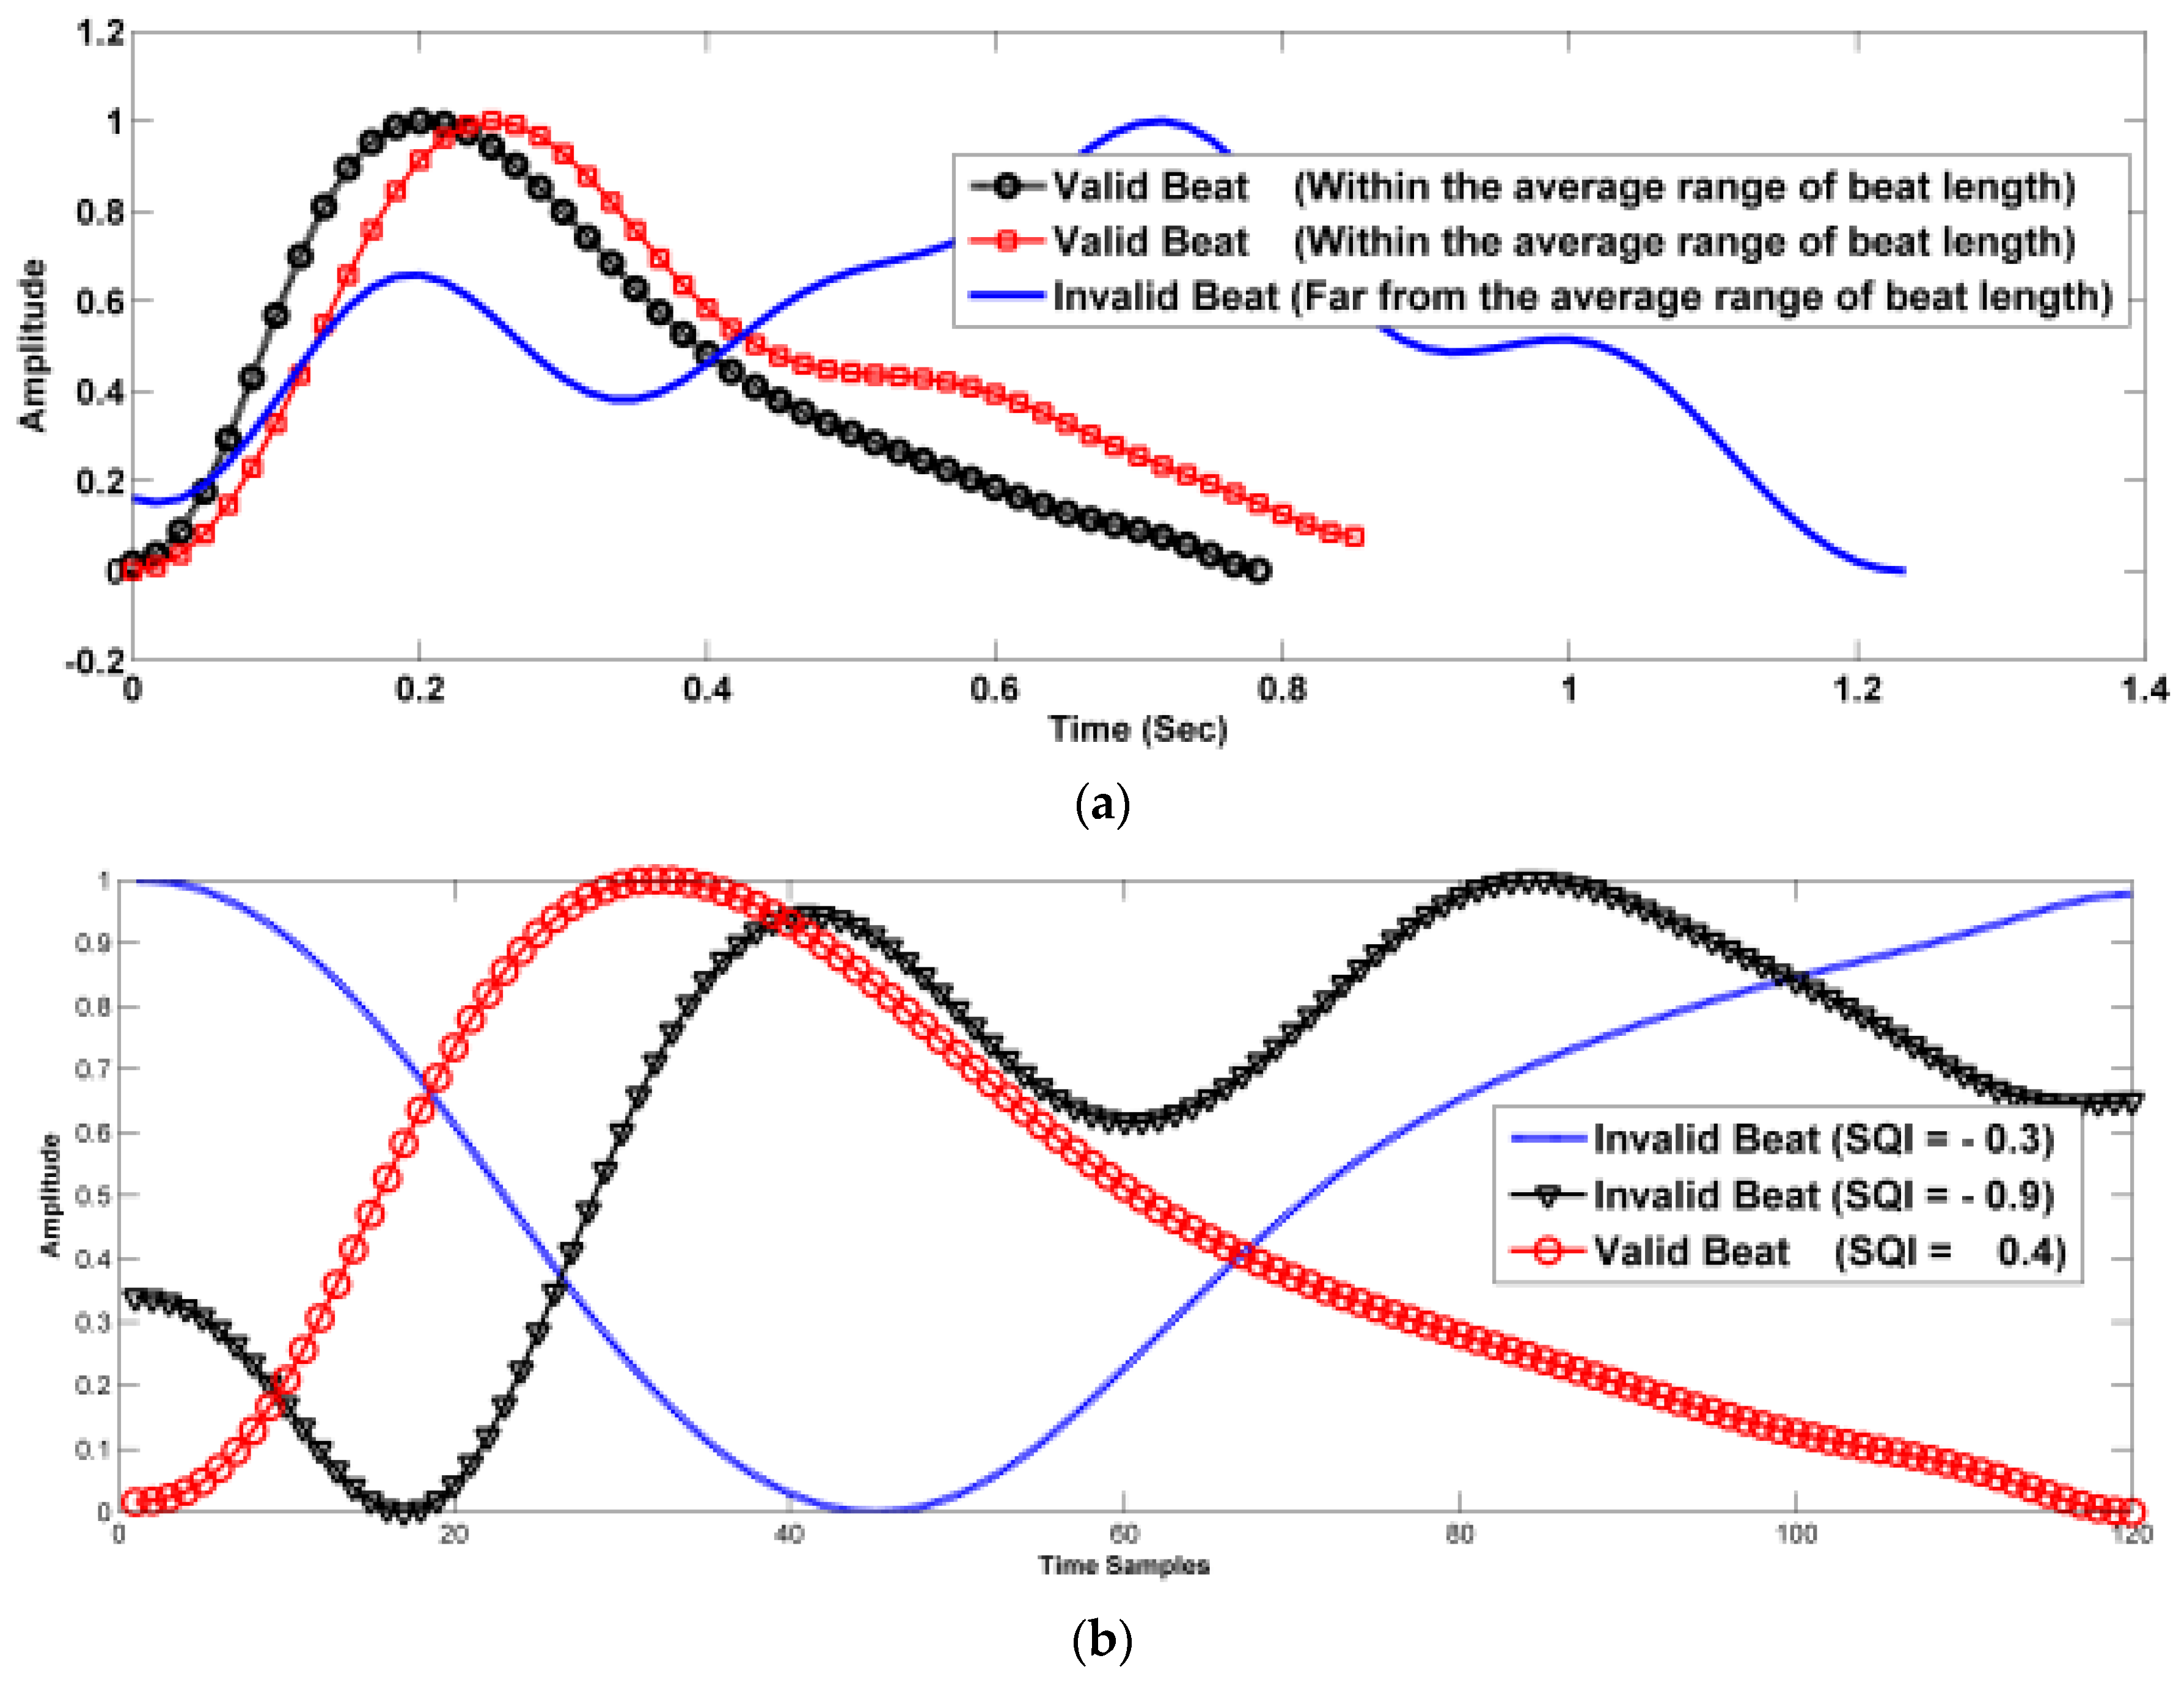
Biomedinformatics 04 00010 g003
Figure 4. Segmented beats (including noisy beats), (a) the effect of noise on the beat length, (b) the effect of noise on the beat correlation, and (c) the effect of noise on the beat skewness.
Biomedinformatics 04 00010 g004aBiomedinformatics 04 00010 g004b
Figure 5. Selected beats (according to common selection criteria).
Biomedinformatics 04 00010 g005
Figure 6. The block diagram of the proposed per-beat BP estimation system (training stage).
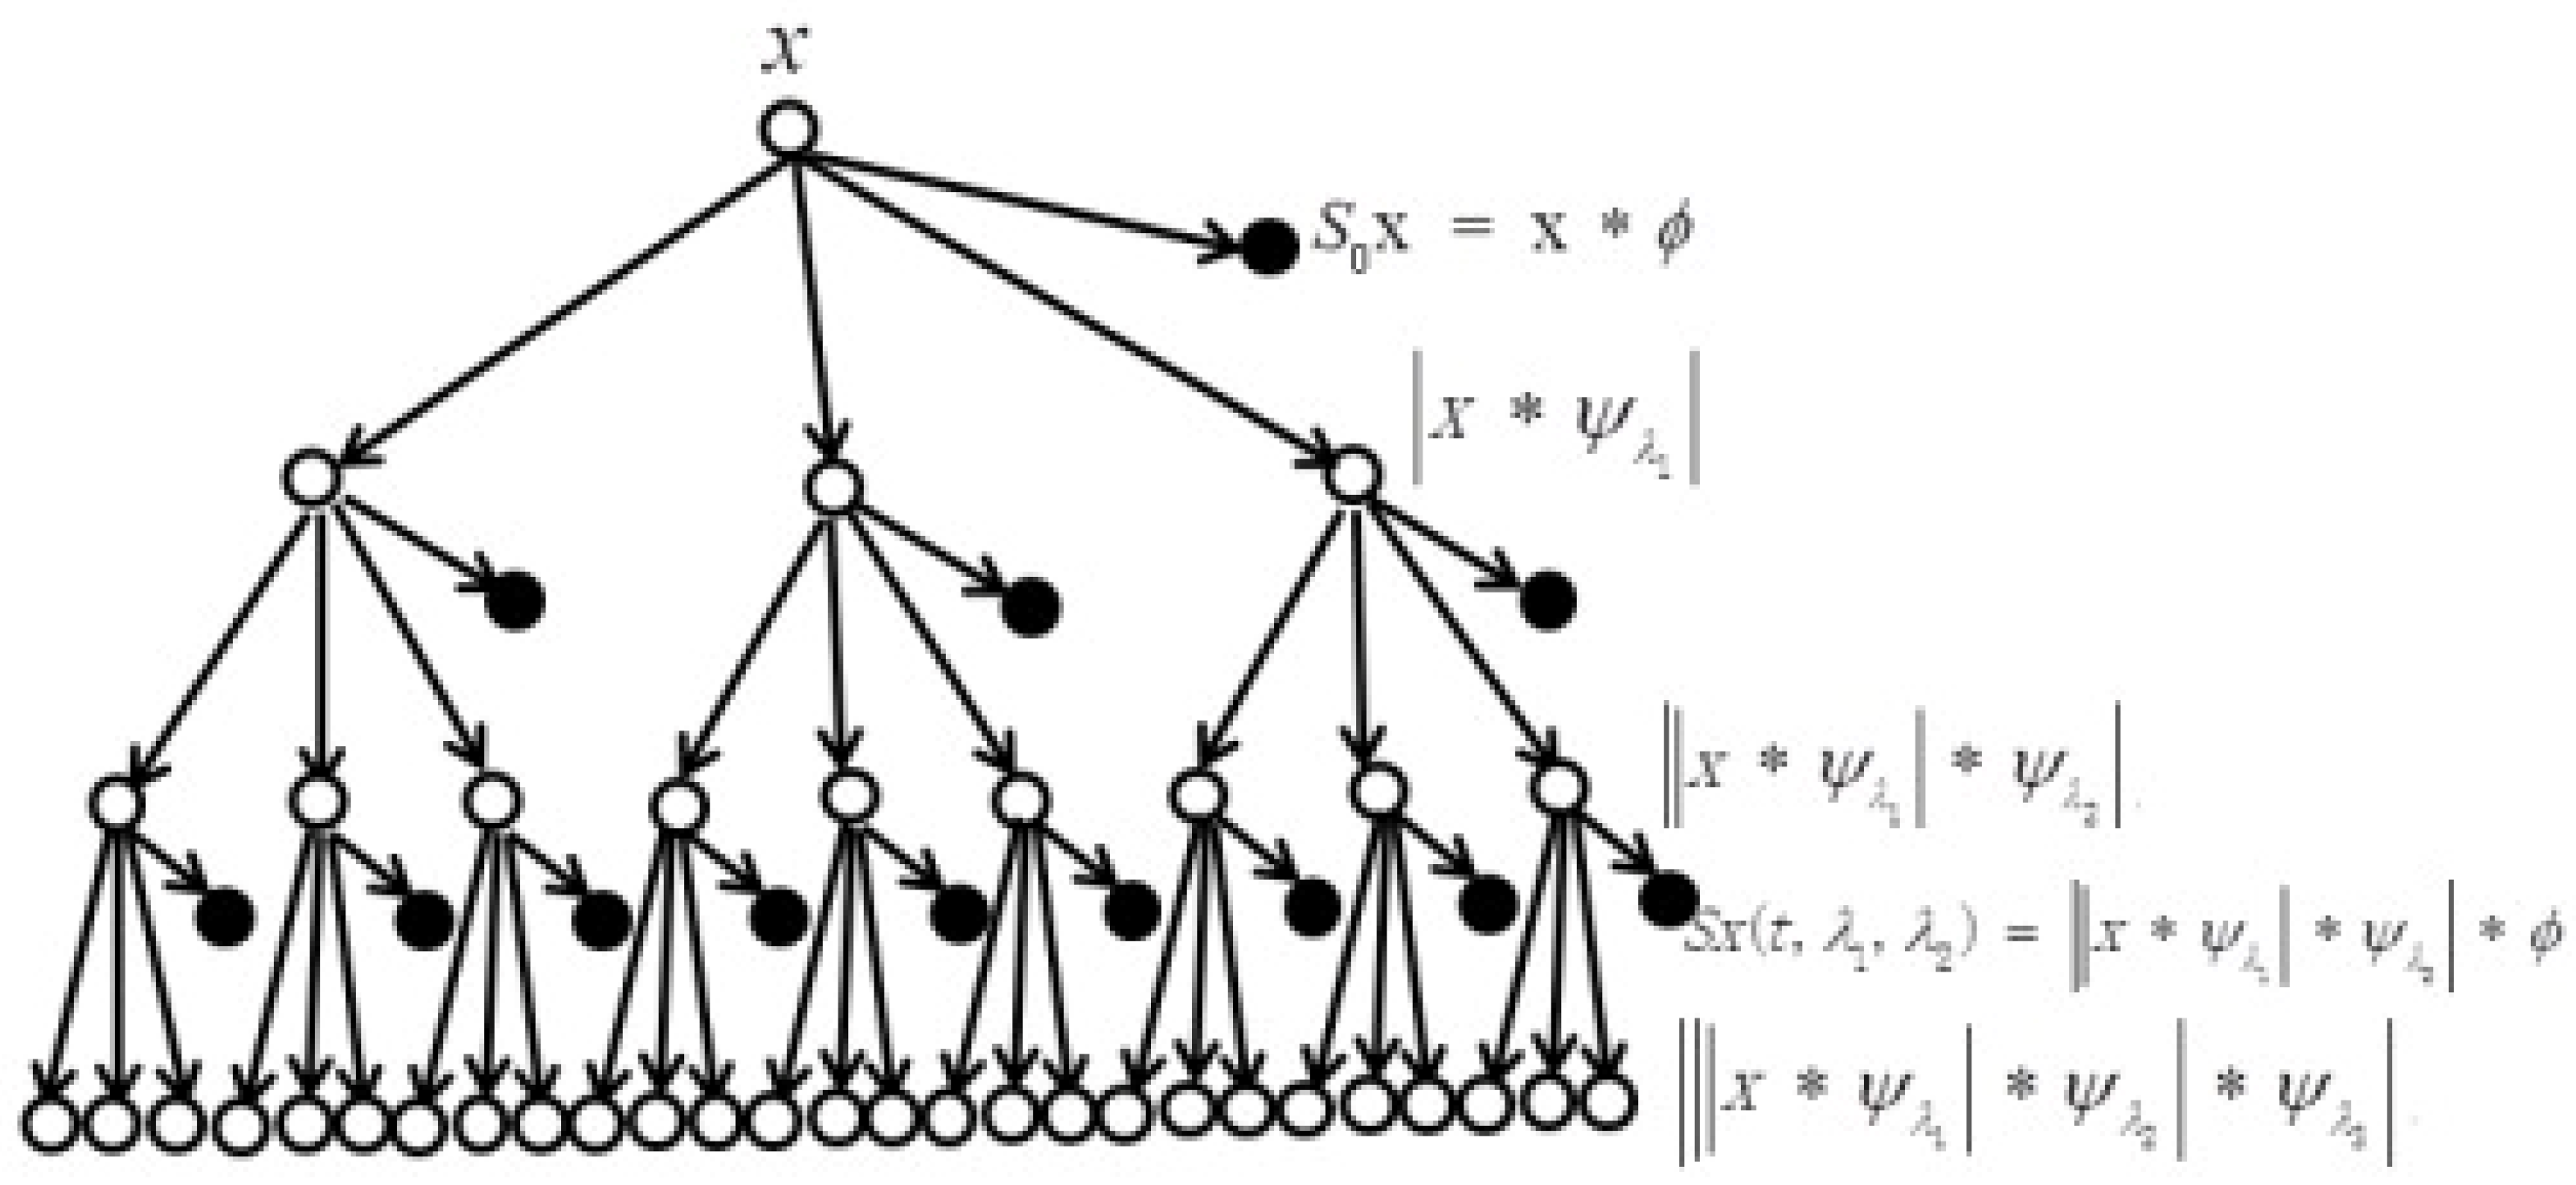
Biomedinformatics 04 00010 g006
Figure 7. Multilayer wavelet scattering transform. Unfilled circles stand for the order of the transform. Filled circles stand for the output coefficients of the wavelet scattering transform. The symbol * stands for the convolution process.
Biomedinformatics 04 00010 g007
Figure 8. The architecture of the LSTM.
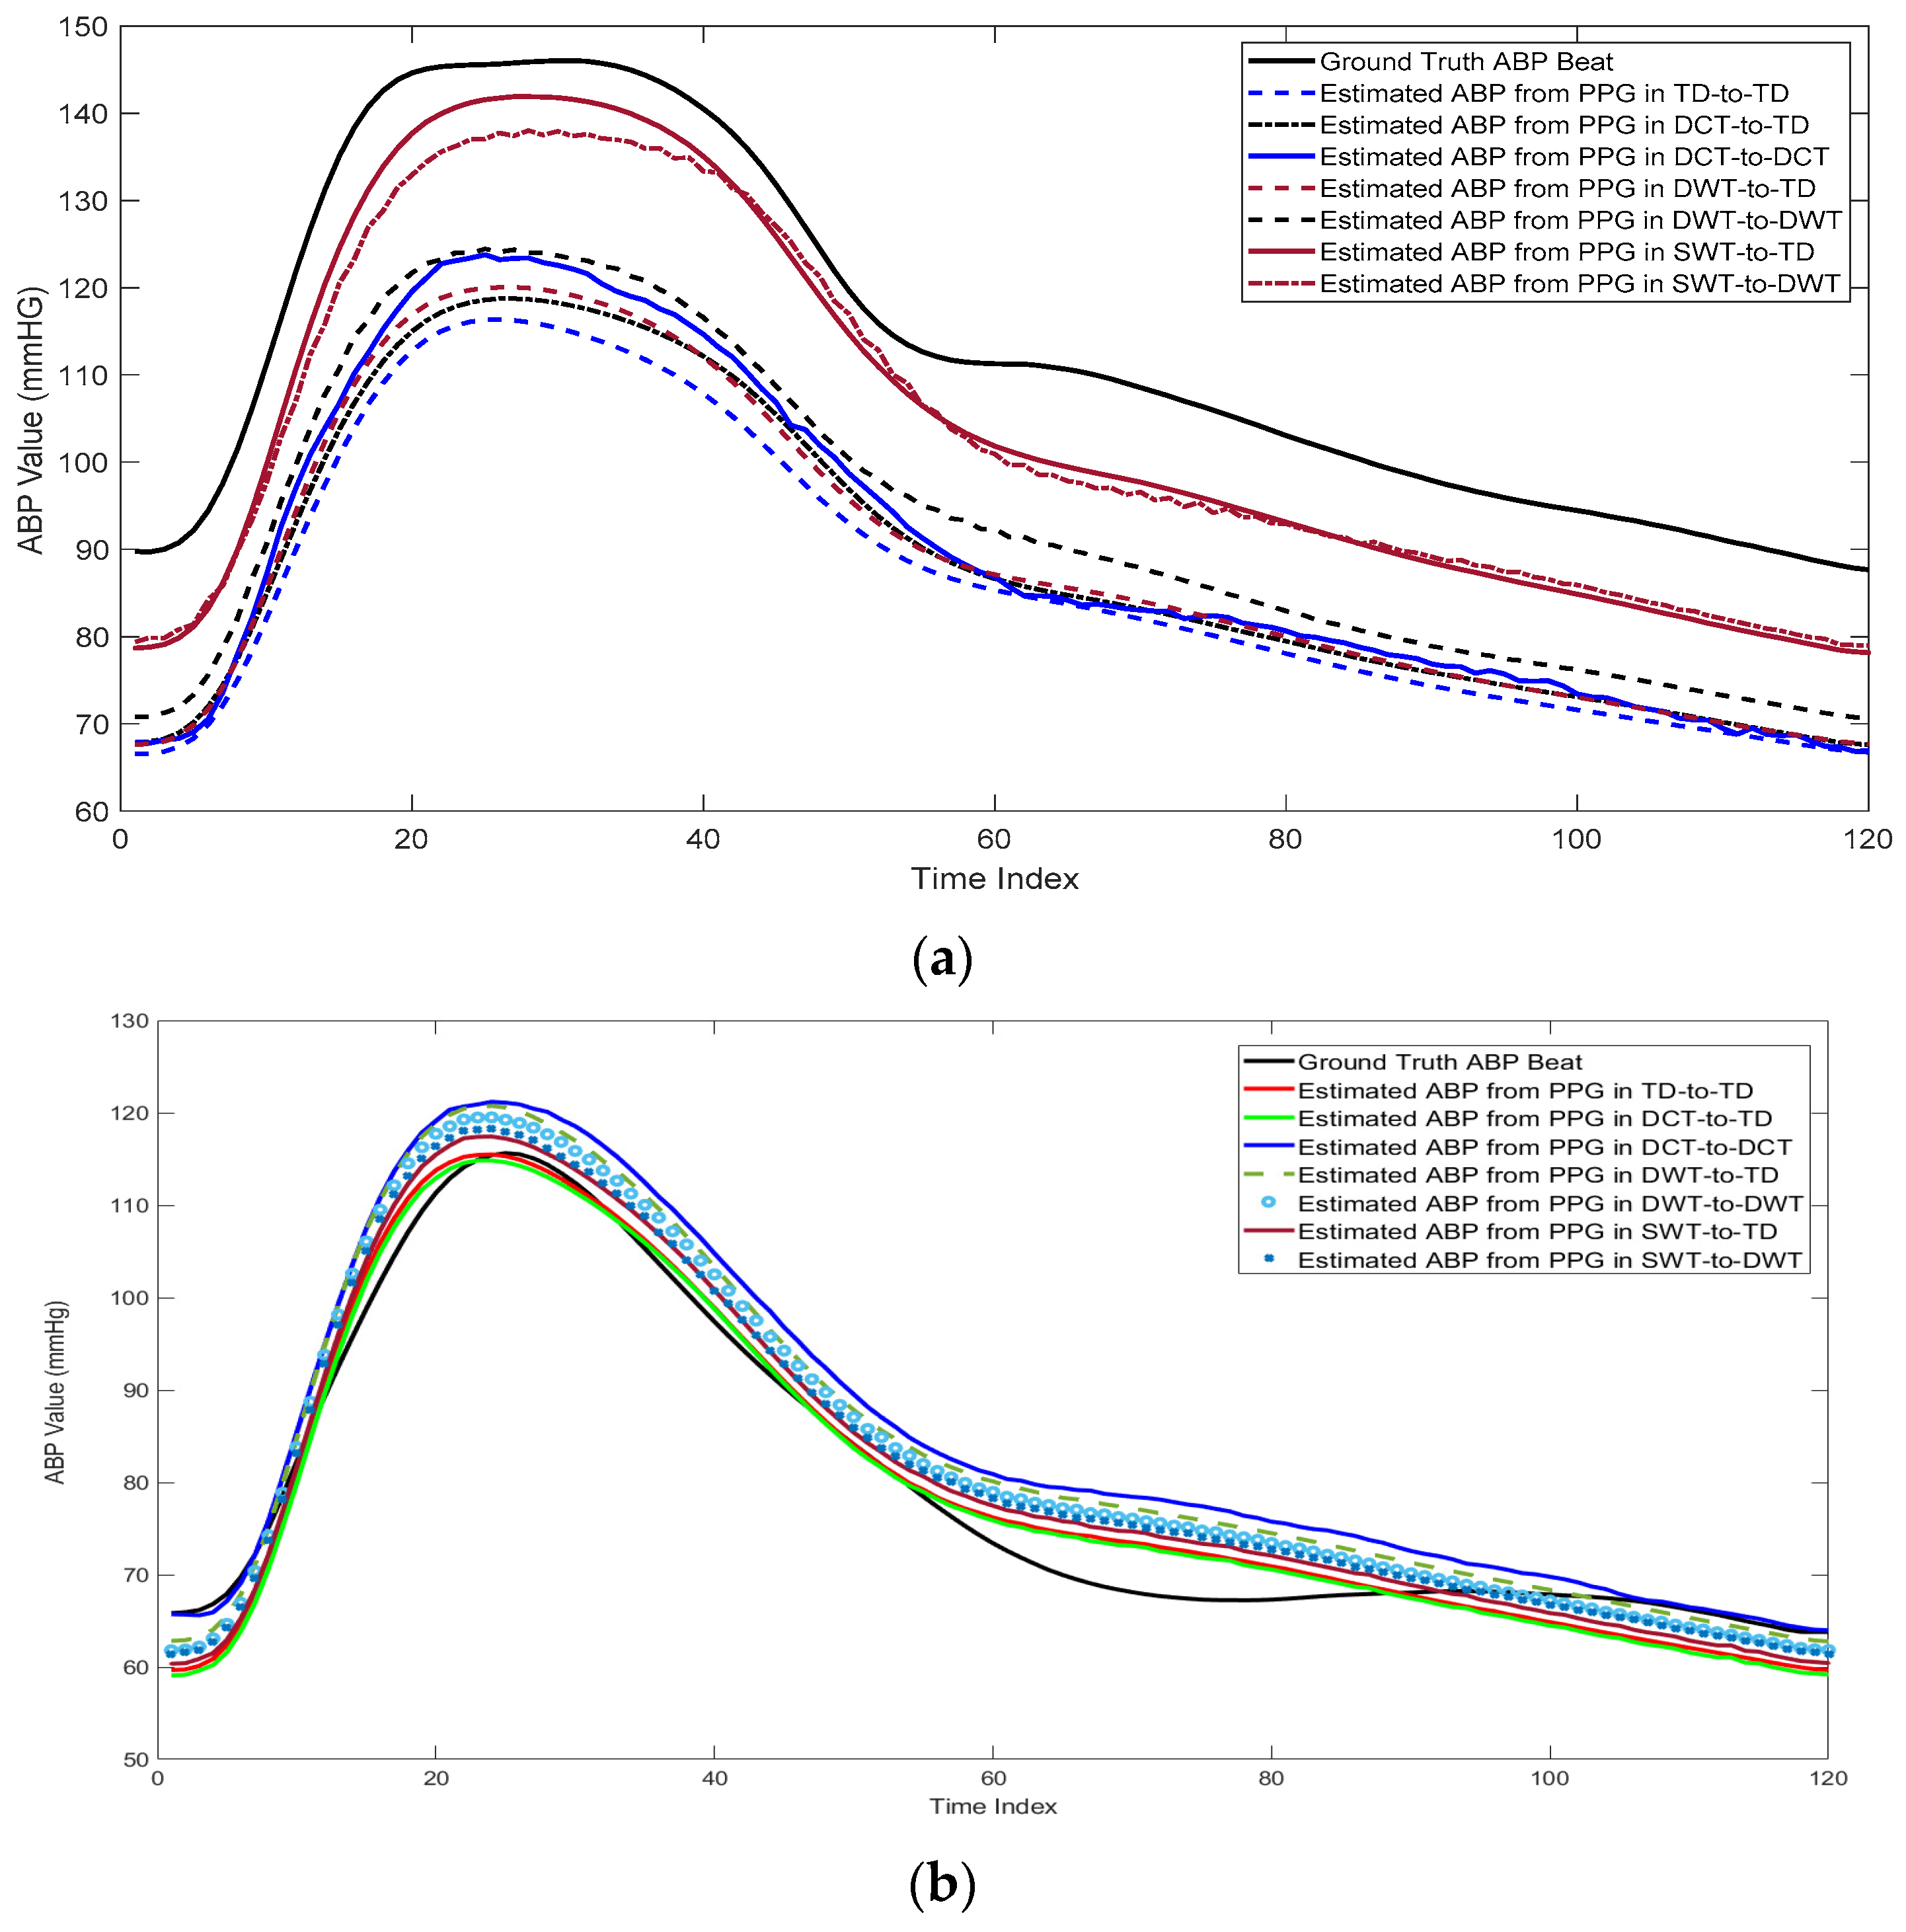
Biomedinformatics 04 00010 g008
Figure 9. Comparison between the estimated ABP beats from PPG beats using different transformations in two cases: (a) High blood pressure, (b) normal blood pressure, and (c) low blood pressure.
Biomedinformatics 04 00010 g009aBiomedinformatics 04 00010 g009b
Figure 10. The relationship between the predicted and actual SBP and DBP using: (a) Time domain featured, (b) Features in the DCT domain, (c) Features in the DWT domain, and (d) Features in the wavelet scattering domain.
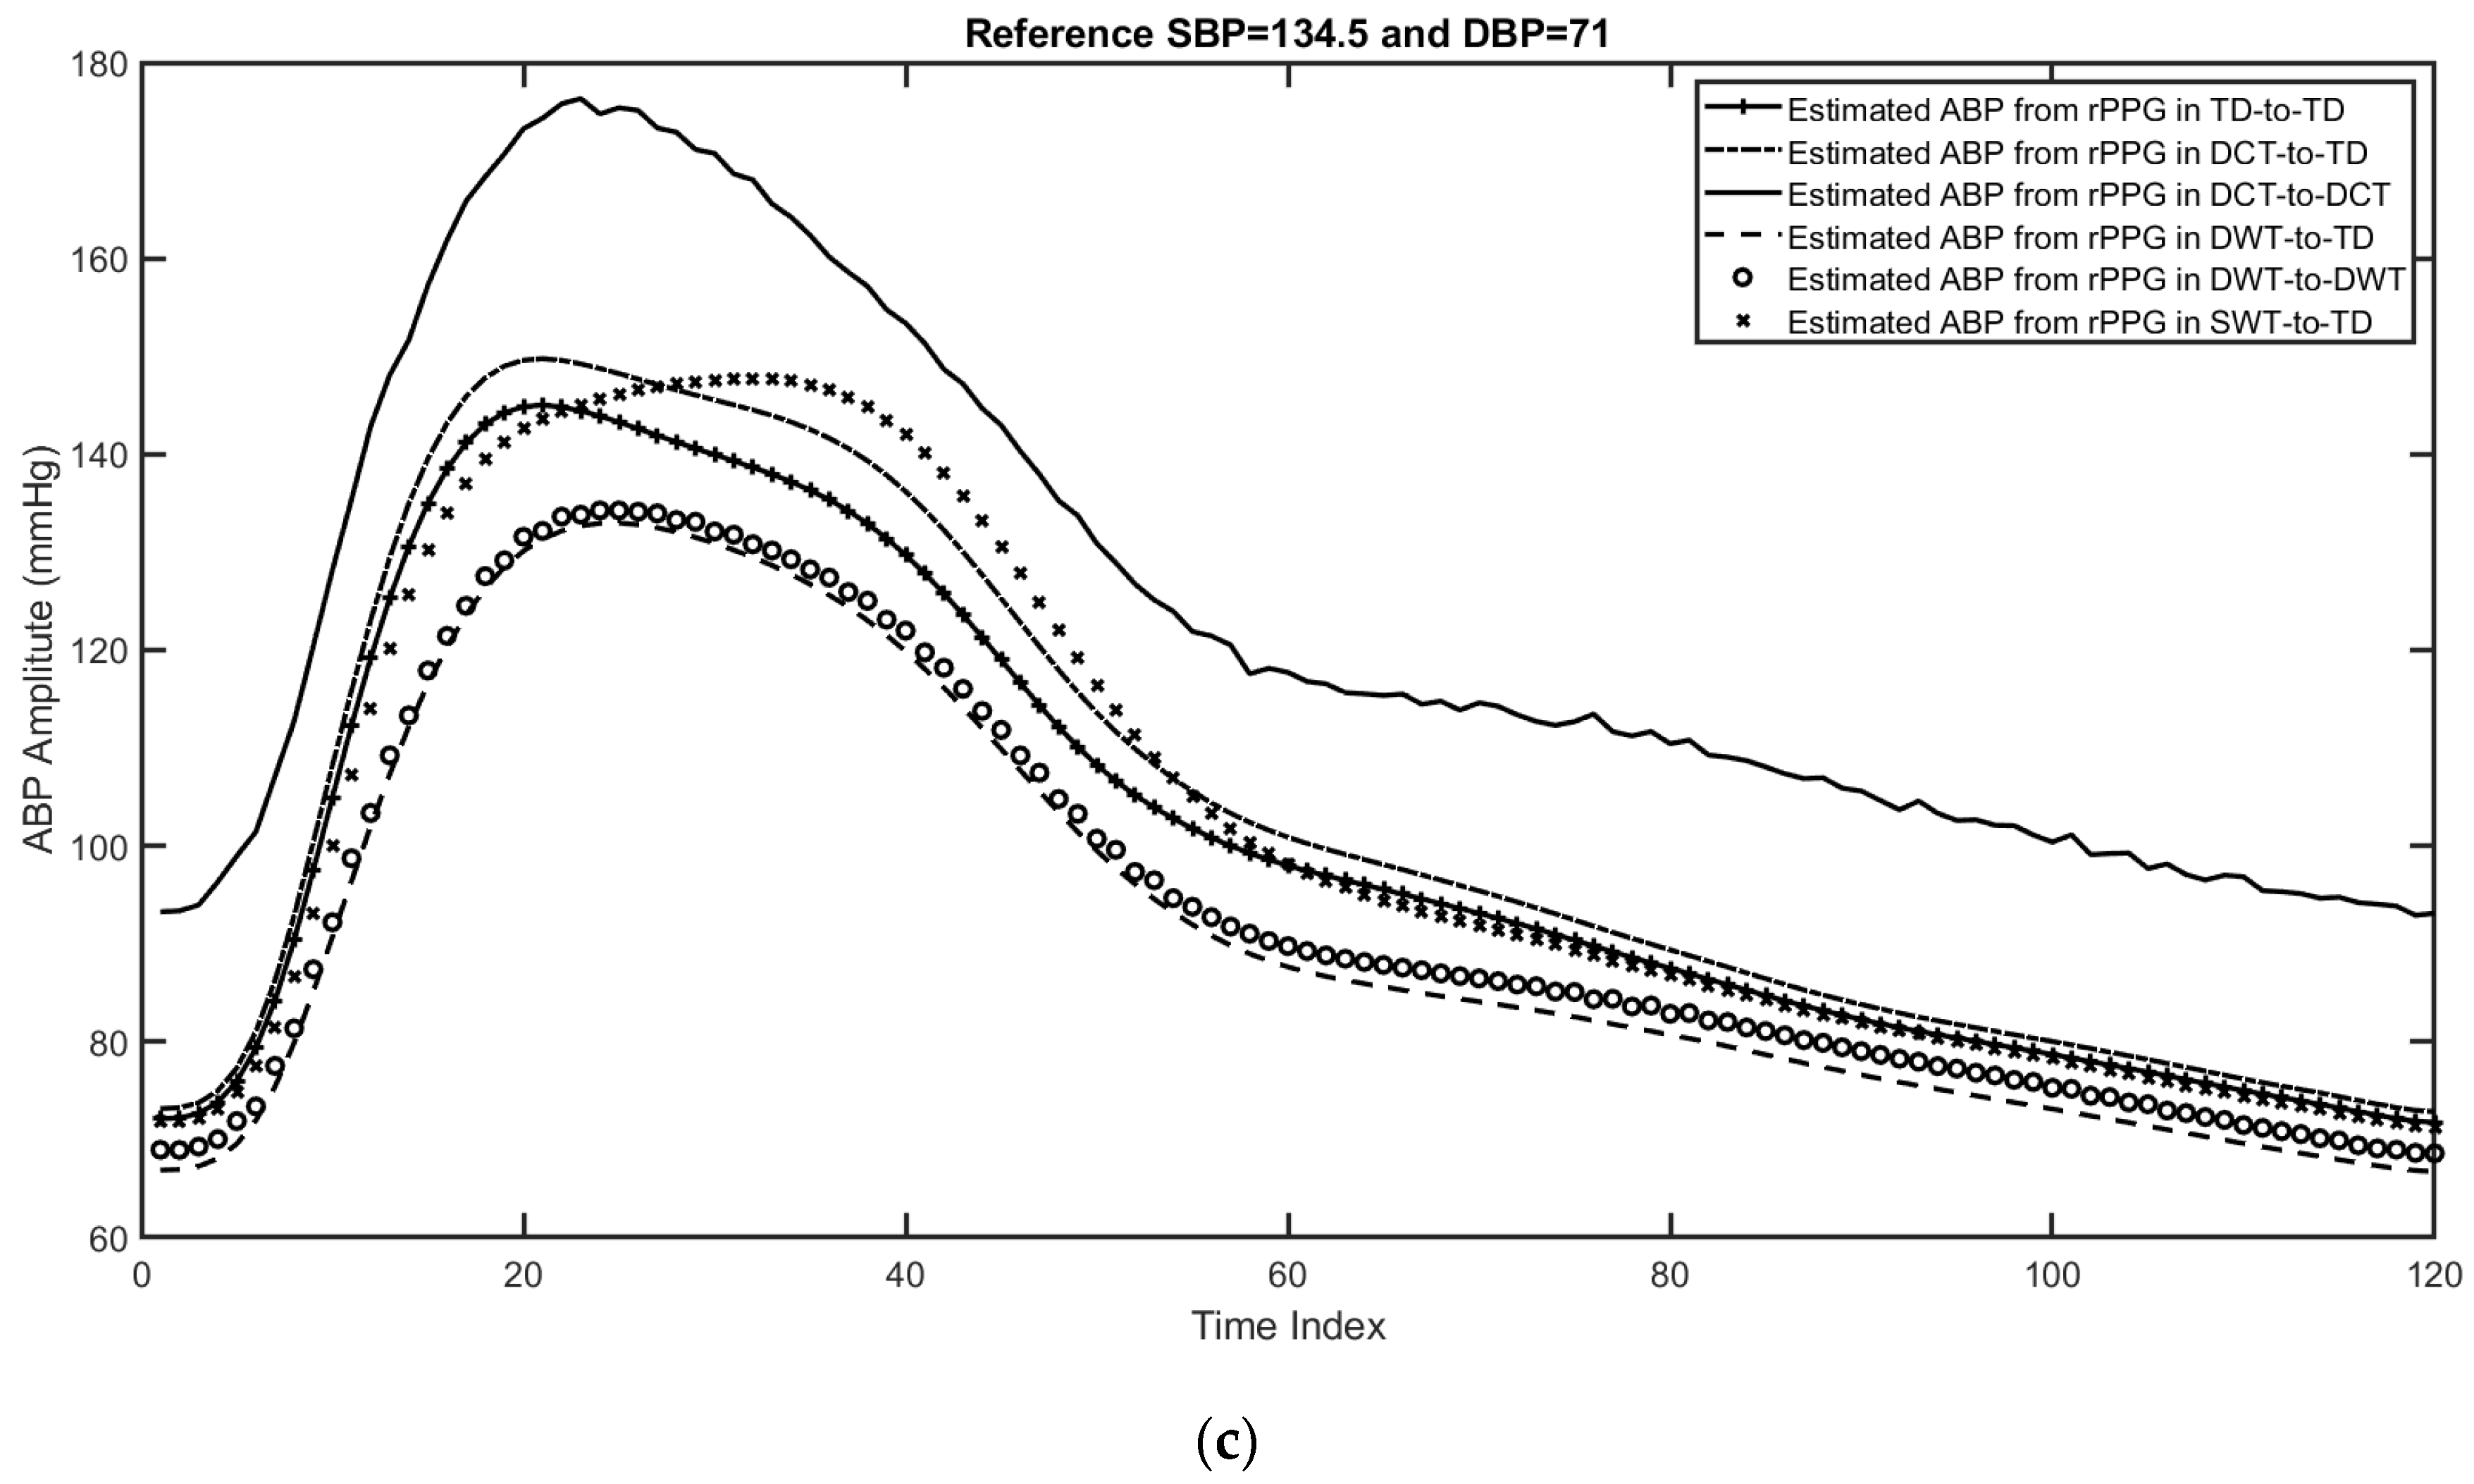
Biomedinformatics 04 00010 g010
Figure 11. Three examples for the estimated ABP beats using different feature domains, including the time domain, features in the DCT domain, features in the DWT domain, and features in the wavelet scattering domain. (a) First example with reference SBP = 137 and DBP = 72, (b) second example with reference SBP = 144 and DBP = 73, and (c) third example with reference SBP = 134.5 and DBP = 71.
Biomedinformatics 04 00010 g011aBiomedinformatics 04 00010 g011b
Table 1. Network specifications.
Number of Beats158,094
Beat Length (time samples)120
Input Feature DomainOne of the following domains:
1-
Time Domain.
2-
DCT Domain.
3-
DWT Domain.
4-
WST Domain
Number of Channels4 × 1 Layer array
Layer specifications
1-
Sequence input with 120 dimensions
2-
LSTM with 20 hidden units
3-
Two fully connected layer
4-
Regression Output mean-squared-error
Learning Rate0.005
Number of Iterations per Epoch191
Optimization functionL2-Norm
Optimization methodADAM
Table 2. Input and output data size in the two used scenarios for different domains.
Per-Beat
Scenario
DomainTimeDCTDWTWST
PPG2ABPInput size121 × 1120 × 1120 × 1120 × 1
Output size120 × 1120 × 1120 × 1120 × 1
PPG2SBP/DBPInput size121 × 1120 × 1120 × 1120 × 1
Output size2 × 12 × 12 × 12 × 1
Table 3. Estimated beat-by-beat ABP evaluation using RMSE and MAE for different transformations. Best values are highlighted in bold.
DomainTimeDCTDWTWST
Case TD+BI-TDDCT-TDDCT-DCTDWT-TDDWT-DWTWST-TDWST-DWT
RMSE11.166311.358711.553210.990510.85549.20848.9935
MAE9.887710.060610.16699.74159.60807.76717.6257
Table 4. Estimated SBP and DBP evaluation using RMSE and MAE for different transformations. Best values are highlighted in bold.
DomainTime DCTDWTWST
BPDBPSBPDBPSBPDBPSBPDBPSBP
RMSE9.563617.65809.7477 17.97629.4865 17.39146.916414.2079
MAE7.1212 13.57207.2472 13.90567.0517 13.33675.094510.8358
Table 5. Estimated SBP and DBP evaluation using RMSE and MAE for different transformations. Best values are highlighted in bold.
DomainTime DCTDWTWST
BPDBPSBPDBPSBPDBPSBPDBPSBP
RMSE11.1798 17.806611.7560 17.706211.2555 16.944111.203415.4742
MAE11.129515.072011.551116.760610.0244 14.34869.539013.3852
Disclaimer/Publisher’s Note: The statements, opinions and data contained in all publications are solely those of the individual author(s) and contributor(s) and not of MDPI and/or the editor(s). MDPI and/or the editor(s) disclaim responsibility for any injury to people or property resulting from any ideas, methods, instructions or products referred to in the content.

