
Probing the Local Polarity in Biocompatible Nanocarriers with Solvatofluorochromism of a 4-Carbazole-1,8-naphthalimide Dye


1
IBB—Institute for Bioengineering and Biosciences, Department of Bioengineering, Instituto Superior Técnico, Universidade de Lisboa, Av. Rovisco Pais, 1049-001 Lisbon, Portugal
2
Associate Laboratory i4HB—Institute for Health and Bioeconomy at Instituto Superior Técnico, Universidade de Lisboa, Av. Rovisco Pais, 1049-001 Lisbon, Portugal
*
Author to whom correspondence should be addressed.
Photochem 2022, 2(3), 489-502; https://doi.org/10.3390/photochem2030034
Submission received: 12 May 2022
/
Revised: 15 June 2022
/
Accepted: 21 June 2022
/
Published: 24 June 2022
(This article belongs to the Special Issue Advanced Research in Photothermal Therapy)
Abstract
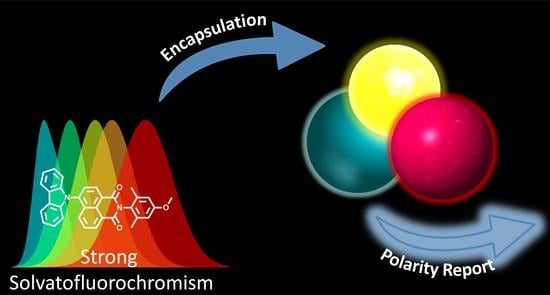
:The study of local polarity at the nanoscale is of crucial importance for the development of smart drug delivery systems and photonic materials and is frequently accomplished with the use of luminescent tracer dyes. Nile Red is often used for this purpose, owing to its polarity-sensitive internal charge transfer transition, but its performance is affected by specific solute-solvent interactions that prevent its widespread applicability. Herein, we develop a new 1,8-naphthalimide dye with a strong charge-transfer transition that results in a large dipole moment change upon excitation. This leads to luminescence properties with high sensitivity to solvent polarity, that are independent of specific or inductive interactions. These properties are explored to probe the polarity of biocompatible nanocarriers. This dye was effective in probing the properties of polymeric nanoparticles, allowing the accurate calculation of polarity descriptors and dielectric constants.
1. Introduction
The determination of local polarity and dielectric environment distribution in materials at the nanoscale is emerging as an area of great scientific and technological interest [1,2,3]. These factors can influence properties such as glass transition temperature, molecule mobility, or photonic properties, which are of crucial importance in diverse areas, including drug delivery, membrane transport, or optoelectronic devices [1,2,3,4]. Thus, to measure these parameters, several techniques emerged. For instance, broad-band dielectric spectroscopy can determine the dielectric constant (ε) in polymer films as thin as 5 nm, although with limited spatial resolution [4]. The resolution for the determination of ε can be significantly improved with another technique called nanoscale dielectric microscopy, which employs a modified atomic force microscope (AFM) equipped with an alternating current detector [1]. However, most available techniques are limited to thin polymer films and dedicated to surface measurements. Thus, to determine local polarity in nanoenvironments (e.g., polymer vesicles, nanoparticles, ultrathin films), the analysis of photophysical properties of tracer dyes is often employed [5,6]. For instance, time-resolved fluorescence measurements enable the characterization of solute transport or segment mobility in polymersomes. Steady-state emission spectroscopy also allows probing local permittivity in polymers and has been used to characterize spatial heterogeneity of ε in polymeric films through single molecule or fluorescence microscopy studies [3,5]. Nile Red (NR) has been widely used as a luminescent dye in these approaches, owing to its photostability and convenient optical properties including high photoluminescence quantum yield (PLQY) and absorption and emission spectra strongly sensitive to the local environment [7,8]. NR has also been particularly used in biological applications, for instance in the detection of proteins from the spectral position of its fluorescence, or to determine intracellular local polarity from the variation of its lifetime (τF) in fluorescence lifetime imaging spectroscopy (FLIM) [9,10]. The photoluminescent behavior dependent on the environment displayed by NR has been attributed to the formation of a twisted intramolecular charge transfer (TICT) state, arising from a conformation change of the electron-donating diethylamino moiety [11]. This process results in a large dipole moment change between the ground and excited state, which influences their interaction in solvent or surrounding molecules [7]. Despite numerous and intensive studies, both on practical applications of theoretical and NR photophysics, there is still debate on whether the TICT is controlled by medium polarity, rigidity, or dielectric constant [12,13,14]. In addition, it has been demonstrated that the photophysics of NR is significantly affected by particular solvent parameters, such as high polarizability, or specific solvent-solute interactions, hindering attempts to establish models that accurately predict its behavior [7,15]. Under this framework, we propose a novel 1,8-naphthalimide dye as a polarity probe whose photophysical behavior can be adequately described using medium polarity parameters. 1,8-Naphthalimide (NI) dyes are an interesting class of photoluminescent compounds that usually display high photoluminescent quantum yield and fluorescence spectral position sensitive to their environment. This makes them particularly interesting for application as optical sensors, biological fluorescent probes, and even as emissive dopants in metal-free organic light-emitting diodes (OLEDs) [16,17]. The photophysical properties of NIs are often associated with intramolecular charge transfer (CT) transitions that arise when electron-donating moieties are appended to the electron-withdrawing naphthalimide core. Similar to the TICT of NR, these CT transitions result in large dipole moment changes between ground and excited states and, thus, in a considerable sensitivity to surrounding polarity. This feature leads to interesting optical properties such as strong solvatochromism and mechanochromic behavior [18]. Herein, we report the preparation of a NI dye-bearing carbazole as a strong electron-donating moiety in a donor-acceptor (D-A) architecture and the study of its photophysical properties as a function of medium polarity. D-A type NIs have received ample attention in the development of supramolecular structures and metal-organic frameworks [19,20]. In this work, we explore the photoluminescence of a NI dye to probe the local polarity of several relevant nanocarriers, ranging from polymeric nanoparticles to biocompatible surfactant micelles, and compare its performance with NR.
2. Materials and Methods
2.1. Materials
All reagents, polymers, and surfactants were acquired from Sigma-Aldrich, Merck, or TCI Europe and used as received. For synthesis, all solvents were purchased with analytical grade from the same vendors and used without further purification. Drying was carried out by standing with freshly activated 4 Å molecular sieves for 48 h [21]. Deionized water purified using a Millipore Milli-Q system to a resistivity of 18.2 MΩ was used throughout the experiments unless otherwise stated. Argon (Ar) gas (Alphagaz 1, 99.999%) was purchased from Air Liquid. For spectroscopy, solvents were of spectroscopy or HPLC grade and used as received without further purification. Amino- and carboxyl-modified polystyrene nanoparticles were purchased from Poly-sciences, Inc. as ca. 2.5% suspension in water.
2.2. Methods
2.2.1. NMR Spectroscopy
1H and 13C NMR spectra were recorded at 300 MHz and 100 MHz respectively using a Bruker Avance III 300 spectrometer (Bruker BioSpin GmbH, Rheinstetten, Germany) in CDCl3, referenced to the solvent for both proton and carbon spectra.
2.2.2. Mass Spectrometry
Electrospray mass spectra were performed at the Unitat d’Espectrometria de Masses (Universitat de Barcelona, Barcelona, Spain) in an LC/MSD-TOF spectrometer using H2O–CH3CN 1:1 to introduce the sample.
2.2.3. Synthesis
Synthesis was carried out according to Scheme 1 in three steps, using the following procedure.
Synthesis of 4-Bromo-N-(4-hydroxy-2,6-dimethylphenyl)-1,8-naphthalimide (1)
To a round bottom flask 4-bromonaphthalic anhydride (1.5 g, 5.4 mmol), 4-aminoxylenol (0.9 g, 6.6 mmol) and 37.5 mL of glacial acetic acid were added. The reaction mixture was refluxed for 24 h. After cooling, precipitate was formed, recovered by filtration, and washed with water (2 × 50 mL) and diethyl ether (2 × 50 mL). 4-Bromo-N-(4-hydroxy-2,6-dimethylphenyl)-1,8-naphthalimide was obtained as a white solid (1.71 g, 79.9%). m.p. = 316–318 °C. 1H-NMR (300 MHz, DMSO-d6): δ = 9.51 (s, 1H, OH), 8.63 (m, 2H, H5 + H7), 8.41 (d, 1H, H2, 3J H2-H3 = 10.5 Hz), 8.29 (d, 1H, H3, 3J H3-H2 = 10.5 Hz), 8.07 (t, 1H, H6, 3J = 7.7 Hz, 3J = 8.1 Hz), 6.61 (s, 2H, H3′), 1.92 (s, 6H, C2′-CH3). HRMS, calc. for C20H13BrNO3 [M-H]− 394.0084, found 394.0084.
Synthesis of 4-Bromo-N-(4-methoxy-2,6-dimethylphenyl)-1,8-naphthalimide (2)
To a two-necked flask under nitrogen containing 4-Bromo-N-(4-hydroxy-2,6-dimethylphenyl)-1,8-naphthalimide (1 g, 2.5 mmol) and dry dimethylformamide (DMF, 20 mL), potassium carbonate (0.52 g, 3.8 mmol) and iodomethane (0.53 g, 3.8 mmol) were added. The reaction mixture was placed at 100 °C during 3 h after which potassium carbonate was filtered. Distillation at reduced pressure afforded the crude solid. The residue was purified by chromatography in dichloromethane to give the desired product. 4-Bromo-N-(4-methoxy-2,6-dimethylphenyl)-1,8-naphthalimide was obtained as a white solid (0.80 g, 77.3%). m.p. = 249–251 °C. 1H-NMR (300 MHz, CDCl3): δ = 8.74 (d, 1H, H7, 3J H7-H6 = 7.3 Hz), 8.67 (d, 1H, H5, 3J H5-H6 = 8.5 Hz), 8.50 (d, 1H, H3, 3J H3-H2 = 7.8 Hz), 8.11 (d, 1H, H2, 3J H2-H3 = 7.8 Hz), 7.92 (t, 1H, H6, 3J = 7.9 Hz, 3J = 7.9 Hz), 6.78 (s, 2H, H3′), 3.86 (s, 3H, OCH3), 2.13 (s, 6H, C2′-CH3). HRMS, calc. for C21H17BrNO3 [M + H]+ 410.0386, found 410.0393.
Synthesis of 4-Carbazole-N-(4-methoxy-2,6-dimethylphenyl)-1,8-naphthalimide (3)
To a two-necked flask under nitrogen containing 4-bromo-N-(4-methoxy-2,6-dimethylphenyl)-1,8-naphthalimide (0.2 g, 0.5 mmol) and carbazole (0.12 mg, 0.75 mmol), 15 mL of dry toluene were added. The reaction mixture was degassed bubbling argon for 15 min, then bis(tri-tert-butylphosphine)palladium(0) (Pd(t-Bu3P)2, 5 mol%) and sodium tert-butoxide (NaOtBu, 0.07 g, 0.75 mmol) were added and the reaction mixture was stirred at 115 °C for 24 h under inert atmosphere. After cooling, water and CH2Cl2 were added. The organic layer was separated and dried over anhydrous magnesium sulphate. Evaporation of the solvent under reduced pressure afforded the crude solid. The residue was purified by chromatography in hexane/acetone (4:1) to give the desired product. 4-Carbazole-N-(4-methoxy-2,6-dimethylphenyl)-1,8-naphthalimide was obtained as a bright yellow solid (92.7 mg, 37.8%). For analytical purposes, the compound was further purified by recrystallization from chloroform and petroleum ether 40–60 (vapor diffusion). m.p. = 303–305 °C. 1H-NMR* (300 MHz, CDCl3): δ = 8.88 (d, 1H, H2, 3J H2-H3 = 7.3 Hz), 8.75 (d, 1H, H7, 3J H7-H6 = 7.3 Hz, 4J H7-H5 = 0.9 Hz), 8.26 (dd, 2H, H4Cz + H5Cz, 3J H4Cz/H3Cz–H5Cz/H6Cz = 6.5 Hz), 7.99 (d, 1H, H3, 3J H3-H2 = 7.7 Hz), 7.89 (d, 1H, H5, 3J H5-H6 = 8.5 Hz, 4J H5-H7 = 0.9 Hz), 7.69 (t, 1H, H6, 3J H6-H7 = 7.3 Hz, 3J H6-H5 = 8.4 Hz), 7.40 (m, 4H, H1Cz + H2Cz + H7Cz + H8Cz), 7.11 (dd, 2H, H3Cz + H6Cz, 3J H3Cz/H4Cz–H6Cz/H5Cz = 6.7 Hz), 6.82 (s, 2H, H3′), 3.88 (s, 3H, OCH3), 2.21 (s, 6H, C2′-CH3). 13C-NMR (100 MHz, CDCl3): δ = 163.1, 159.4, 141.7, 140.7, 136.8, 132.5, 132.1, 130.5, 130.3, 129.3, 127.7, 127.5, 126.4, 123.8, 122.8, 120.8, 120.6, 113.9, 110.1, 55.3, 18.3. EA. Calc. for C33H24N2O3·0.02 CHCl3, C 79.49; H 4.85; N 5.61. Found: C 79.54; H 4.84; N 5.66. HRMS, calc. for C21H17BrNO3 [M + H]+ 497.1860, found 497.1865.
* for proton signal attribution, please consult Appendix A, Figure A1.
2.2.4. Nanoparticles Preparation
Neutral polystyrene (PS) and poly(methylmethacrylate) (PMMA) and poly(lactic-co-glycolic acid) (PLGA) nanoparticles were prepared using a modified nanoprecipitation method [22,23,24]. Fluorescent dye was co-dissolved with polymer at a ratio of 1:99 (w/w).
PS nanoparticles (PSNPs): 10 mg of PS and 0.1 mg of 3 were dissolved in 2.5 mL of tetrahydrofuran (THF) and the resulting solution was added to 10 mL of an aqueous solution of 2.5 mg of Triton X-100 at 50 °C, stirred at 1000 rpm with a magnetic stirrer. The mixture was stirred for 24 h at room temperature and centrifuged at 1000× g to remove polymer aggregates. The supernatant was collected, centrifuged at 20,000× g, and washed with water.
PMMA nanoparticles (PMMANPs): 10 mg of PMMA and 0.1 mg of 3 were dissolved in 10 mL of acetone and to the resulting solution, 13 mL of an aqueous solution of 3 mg of Triton X-100 were added while stirring at 200 rpm with a magnetic stirrer. The mixture was stirred for 24 h at room temperature and centrifuged at 1000× g to remove polymer aggregates. The supernatant was collected, centrifuged at 20,000× g, and washed with water.
PLGA nanoparticles (PLGANPs): 50 mg of PLGA and 0.5 mg of 3 were dissolved in 2 mL of acetonitrile and added to 10 mL of a 1% (w/v) Pluronic P-123 aqueous solution, while stirred at 800 rpm. The mixture was stirred for 24 h at room temperature and centrifuged at 1000× g to remove polymer aggregates. The supernatant was collected and passed through a 0.45 µm membrane filter.
2.2.5. Dye-Loading of Nanocarriers
Commercial PSNPs were dye loaded using a swelling procedure, as previously described [25]. For encapsulation in micelles, dye 3 was dissolved in THF and added to an aqueous at the desired surfactant concentration in a solvent ratio of 1:10. The solutions were stirred for 24 h to allow the evaporation of the organic solvent and filtered through a 0.45 µm membrane to remove aggregates. For encapsulation in bovine serum albumin, dye 3 was dissolved in ethanol and added to a phosphate-saline buffer solution of BSA at the desired concentration in a solvent ratio of 1:100 to prevent denaturation of the protein. The solutions were stirred for 24 h to allow the evaporation of the organic solvent and the complexation of the dye and filtered through a 0.45 µm membrane to remove aggregates.
2.2.6. Optical Spectroscopy
Absorption spectra were collected using a Shimadzu UV-3600 double beam spectrophotometer or a Jasco V-650 double beam spectrophotometer. Emission spectra were collected in a Jobin Yvon Fluorolog fluorescence spectrometer, at 25 °C, using right-angle geometry for solutions, and front-face geometry for particle suspensions. Emission was found to be independent of excitation wavelength. Fluorescence decays of dyes were measured by the single-photon timing method using a Horiba DeltaFlex system with a BH 405 nm laser excitation, with 500 ps pulse width. Emission wavelength. Impulses were recorded slightly away from the excitation wavelength with a Ludox scattering suspension, thus defining the instrument response function (IRF). Dye solutions were kept at low concentrations to keep A < 0.1 to reduce the inner filter effect. Particle samples were prepared as suspensions in aqueous media, adjusting concentration to ca. 0.1–0.5% w/v. Surfactant concentrations were adjusted to a minimum of two-fold above the established critical micellar concentration. Fluorescence quantum yields (ΦF) in organic solvents were determined using the comparative method using acridine yellow in ethanol (ΦF = 0.47, λexc = 420 nm) as standard [26]. In nanoparticles, ΦF was determined with the absolute method using an integrating sphere. Since nanoparticle suspension absorption spectra are affected by light scattering, in this work the Stokes shift was calculated from the longest wavelength transition absorption maximum (υa) taken from the excitation spectrum, and emission maximum (υe) taken from the emission spectrum, for all samples.
Dynamic Light Spectroscopy (DLS) was carried out on a Horiba nanoPartica SZ-100 V2 Nanoparticle Analyzer or a Malvern Zetasizer Nano ZS. Nanomaterials were suspended in water (1 mg/mL) and the analyzed samples were prepared by diluting the stock suspensions (1:100). Measurements were carried out at a 90° scattering angle on PS cuvettes at 25 °C. All tests were run six times for 30 s and the average values were presented and particle size was calculated by fitting the correlation curves using solver mathematical software from the Stokes-Einstein equation.
3. Results and Discussion
For this study, a 1,8-naphthalimide with a D-A architecture was selected as a potential fluorescent polarity probe. NI dyes are known to exhibit CT transitions when coupled with strong electron-donating moieties, yielding solvent-dependent emission wavelength, lifetime, and quantum yield. We selected carbazole as a donor group and coupled it with the NI core to obtain dye 3 in a three-step synthesis starting with 4-bromonaphthalic anhydride, as depicted in Scheme 1. p-Aminoxylenol was selected for the formation of the NI from the reaction with naphthalic anhydride in acetic acid, as it enables further derivatization at the phenol moiety for the tuning of solubility or appending grafting moieties. NI 1 is methylated at the hydroxyl moiety in an SN2 reaction with iodomethane. The resulting NI 2 is condensed with carbazole in a Buchwald-Hartwig amination reaction to achieve the desired NI 3. All newly synthesized compounds are characterized by NMR and elemental analyses.
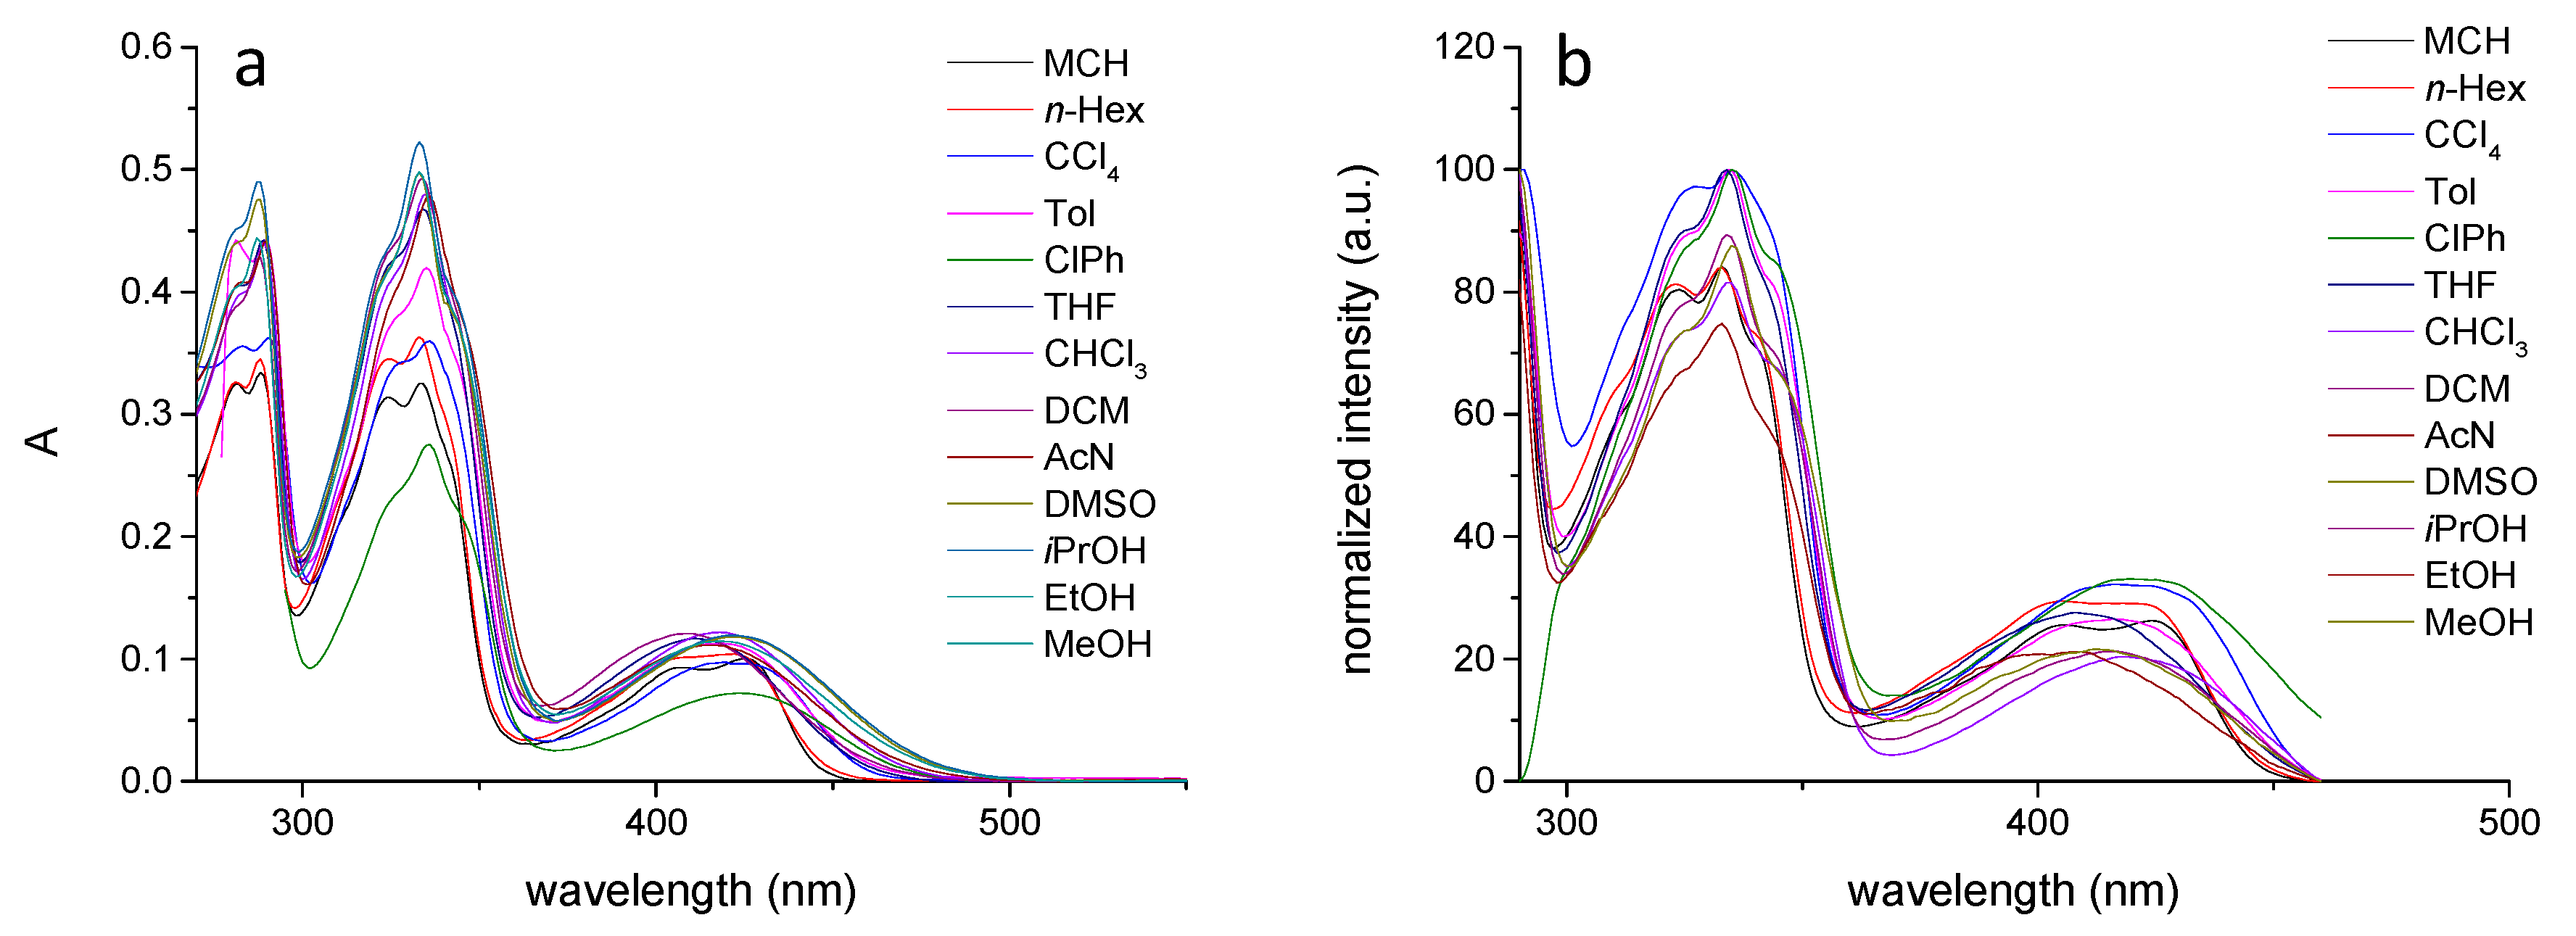
To assess the applicability of 3 as a fluorescent probe, the photophysical properties were characterized in a series of twelve organic solvents. The obtained UV-Vis absorption spectra, shown in Figure A2a, display a strong π-π* absorption band with vibronic resolution between 300 nm and 370 nm, and a weaker CT absorption band in the 370–500 nm region. The latter is significantly more sensitive to solvent polarity, showing vibronic resolution in non-polar solvents (methylcyclohexane, MCH, and n-hexane, n-Hex), and becoming increasingly broader and structureless in more polar solvents. The CT character of this transition is further evidenced by the emission spectra of 3 (Figure 1), where the fluorescence band widens, shifts to lower energies, and decreases in intensity with increasing solvent polarity. The excitation spectra (Figure A2b) corresponding to these emission bands reproduced the absorption spectra in the respective solvent, indicating that the emission arises from single molecular species and not from molecular aggregates. These results are typical photoluminescence patterns of D-A molecules with intramolecular charge transfer emissive excited states [27,28,29].
Further investigation also showed that other photophysical parameters are significantly affected by solvent polarity. Table 1 shows that the fluorescence quantum yield (ΦF) of 3 decreases markedly from 0.45 in MCH to 0.01 in dimethylsulfoxide (DMSO), while the fluorescence lifetime (τF) undergoes a less linear variation, with a slight increase from MCH to dichloromethane (DCM) and decreasing abruptly in acetonitrile (AcN) and DMSO. This non-linear variation of τF can be justified by analyzing the radiative (kr) and non-radiative (knr) rate constants in different solvents in Table 1. In low polarity solvents, 3 exhibits high kr, and the radiative decay competes with non-radiative energy dissipation. With increasing solvent polarity, the interaction with the polar excited state increases, resulting in a significant increase in non-radiative processes, which become predominant at long-wavelength emission, due to the energy gap law.
The considerable changes in photophysical properties with solvent polarity, mainly the large redshift exhibited by the emission band and the decrease in ΦF, hint that the CT transition leads to a significant change in dipole moment (Δµ) upon excitation, and this value was calculated from the Lippert-Mataga plot in Figure 2a, using Equation (1):
In Equation (1), υa and υf are the lowest energy absorption and emission maxima (in cm−1), respectively, h is Planck’s constant, c is the velocity of light, ρ is the Onsager cavity radius (cm−1, determined from the dye molecular weight M and density, d), ε is the solvent dielectric constant and n the refractive index, and µe and µg are the excited state and ground state dipole moments, respectively. Equation (1) can be simplified as:
From the slope of the Lippert-Mataga plot (16,150 cm−1), it is possible to determine that Δµ for compound 3 is ca. 16.28 D, which is considerably large and confirms that a photoinduced charge transfer occurs upon excitation. It is also worth noting that the Stokes shift (Δυ) of 3 is highly correlated with the Lippert-Mataga parameter, with an R2 for the linear fit of 0.95. Similar linearity is observed when Δυ is plotted against the empirical polarity descriptor ET(30) if protic solvents are not considered (Figure 2b) [30].
These results suggest that 3 has potential applicability as a polarity probe. To confirm this, it was compared against the commonly used tracer dye NR, whose results are summarized in Figure 3 and Table A2. The results show that (i) the Δυ variation with solvent polarity is less substantial for NR than for 3 (slope of Lippert-Mataga plot equal to 2602 cm−1), and (ii) its correlation with polarity descriptors is considerably lower (R2 = 0.73 vs. Δf; R2 = 0.61 vs ET(30)) for NR than for 3. The first observation can be attributed to a much lower Δµ in the case of NR (established at ca. 6.30 D) [7], which leads to a less pronounced bathochromic shift in emission (ca. 3000 cm−1 against ca. 5000 cm−1 for 3) with a change in ε from ~2 to ~46. The lower correlation with polarity parameters can be justified by stronger specific and inductive solute-solvent interactions for NR, which have been demonstrated to affect the energy levels of ground and excited states [7,9,14].
In summary, this study demonstrates that NI 3 exhibits (i) photoinduced CT with concomitant dipole moment change upon excitation, (ii) large Stokes shift that increases with solvent polarity/dielectric constant, and (iii) linear and predictable variation of photophysical parameters as a function of polarity descriptors. Therefore, 3 shows considerable potential as a fluorescent polarity probe. Under this framework, we pursued the probing of local polarity in relevant nanocarriers. This parameter is of crucial importance not only for engineered drug delivery systems but also for the development of photonic nanomaterials, since the photophysical performance of luminophores is usually intrinsically associated with carrier polarity, especially when excited state energy levels are important. As relevant nanocarriers, we selected polystyrene (PS, pristine, amino- and carboxyl-functionalized), poly(mehtylmethacrylate) (PMMA) and poly(lactic-co-glycolic acid) (PLGA) nanoparticles (NPs), bovine serum albumin (BSA), and biocompatible surfactant micelles of Tween® 80 and Pluronic® P-123. The carriers were loaded with 3 and the optical properties of the resulting materials were characterized. The size distribution of the isolated nanoparticles is summarized in Figure A3. Dye concentration in the carrier was kept at or below 1% (w/w) to prevent aggregation and emission reabsorption. The obtained results are summarized in Figure 4 and Table 2.
Apart from BSA, the inclusion of 3 in all nanocarriers yields emission spectra with structureless bands with maxima in the 480–550 nm range. The excitation spectra exhibit the same features as the absorption spectra of 3 in organic solvents, with the strong structured band (π-π* transition) in the 300–350 nm range and a structureless weaker CT band in the 350–500 nm region. In BSA, however, 3 exhibits one narrow blueshifted band with a maximum at 456 nm. When observed against the emission and excitation spectra in MCH (Figure A4), it becomes evident that the narrow bands in the presence of BSA correspond to the electronic transition without broadening and contribution by additional vibronic levels. This shows that 3 undergoes complexation in the hydrophobic pocket of BSA, and the rigidity of the environment restricts molecular motion. These conditions result in a remarkably higher ΦF (0.63) and kr (0.12 ns−1) for 3 in BSA, when compared with other carriers and solvents. In surfactant micelles, 3 exhibits red shifted broad emission bands with maxima at ca. 550 nm, suggesting that these are the carriers with a more polar environment. Among polymeric nanoparticles, the emission bands of 3 show maxima between 483 nm (for neutral PSNPs) and 526 nm (for PLGANPs). It is worth noting that the functionalization of PS with amino or carboxyl moieties leads to differences in the emission spectra of the encapsulated dye. Both functionalized NPs show a slight redshift compared to the neutral counterparts, which is more significant for the aminated NPs. The results in Table 2 also show that the encapsulation of 3 in these materials leads to significant changes in its photophysical properties. In fact, τF is substantially longer than what was determined for organic solutions, and, overall, ΦF is considerably higher. Analyzing the decay rate constants, these results can be justified by a significant reduction of knr upon encapsulation of the dye, which can be attributed to (i) weaker interaction with the medium and (ii) a more restricted environment that reduces molecular vibrational modes.
From this data, it is possible to estimate polarity descriptors for these nanocarriers, using equations in plots in Figure 2 and the determined Δυ for the dye-loaded nanocarriers. The results of these calculations are summarized in Table A3 and show that, regardless of the used descriptor, all nanocarriers except for BSA, have an apparent polarity between that of n-hexane and THF. These values are consistent with the obtained emission position range, and the determined values for ΦF. The polarity parameters determined for BSA suggest remarkably low polarity of the hydrophobic pocket, which is not consistent with previous literature studies applying similar solvatochromism-based approaches that found ET(30) values similar to those of DMSO [31]. These differences can be attributed to structural characteristics of 3, mainly the presence of carbazole, which is a bulky donor group compared to aliphatic amines usually present in fluorescent dyes with ICT. Thus, we expect that (i) 3 adopts a restricted conformation upon complexation and (ii) its interaction with BSA is reduced for minimal energy stabilization of the excited state. These results suggest that molecular size and conformation must be considered when probing the local polarity of materials. To verify if the calculated polarity descriptors are consistent, we solved the Lippert-Mataga equation for ε and compared the obtained values with the ones reported in the literature (Table A3) [3,32,33]. It is demonstrated that the calculated dielectric constants for polymeric nanocarriers are very close to literature values for these polymers, which validates NI 3 as an adequate fluorescent dye to probe local polarity in polymeric nanoparticles. However, the calculated apparent polarity for surfactant micelles is lower than those determined in other works using solvatochromic dyes [34,35]. These differences may be attributed to conformational effects due to the smaller size of micelles compared to polymeric NPs, or to a localization of 3 within the micelle hydrophobic center.
4. Conclusions
A 4-carbazole-1,8-naphthalimide dye (3) was synthesized and its photophysical properties were characterized in organic solution through steady-state and optical spectroscopy. This study found that 3 exhibits a very large dipole moment change upon excitation, and its optical behavior is intrinsically related to solvent polarity, showing a very strong correlation between Stokes shift and polarity descriptors. A formal comparison with a commonly used polarity probe, Nile Red, evidenced that the photophysical parameters of 3 can be effectively predicted from polarity parameters without the interference of specific and/or inductive solvent-solute interactions, enabling its use as a fluorescent polarity probe. Based on these results, 3 was explored to probe the local polarity of known nanocarriers, including surfactant micelles, a protein, and polymeric nanoparticles. Through the exhibited Stokes shift of 3 when encased in the materials, we calculated polarity descriptors and extracted dielectric constant values applying a simple mathematical model. The results show that 3 can accurately assess the polarity of polymeric nanocarriers. However, in highly confined environments and dynamic, heterogeneous carriers, the results were not consistent with those previously reported, demonstrating that the nature of nanoenvironment must be considered when selecting probing dyes.
Supplementary Materials
The following supporting information can be downloaded at: https://www.mdpi.com/article/10.3390/photochem2030034/s1. Figure S1: 1H-NMR spectra for 1 in DMSO-d6.; Figure S2: Mass Spectra for 1. Inset shows [M − H]− isotope pattern; Figure S3: 1H-NMR spectra for 2 in CDCl3; Figure S4: Mass Spectra for 2. Inset shows [M + H]+ isotope pattern; Figure S5: 1H-NMR spectra for 3 in CDCl3; Figure S6: Mass Spectra for 3. Inset shows [M + H]+, [M + Na]+ and [M + K]+ isotope pattern.
Author Contributions
A.M.D.—methodology, investigation; R.P.R.C.—investigation; J.A.—conceptualization, methodology, validation, writing, visualization, supervision, funding acquisition. All authors have read and agreed to the published version of the manuscript.
Funding
This research was funded by FCT—Fundação para a Ciência e a Tecnologia, I.P., through grant SFRH/BPD/120599/2016 (JA) and projects PTDC/QUI-QFI/32007/2017, UIDB/04565/2020, UIDP/04565/2020 and LA/P/0140/2020, and by Liga Portuguesa Contra o Cancro with Terry-Fox Research Grant.
Institutional Review Board Statement
Not Applicable.
Informed Consent Statement
Not Applicable.
Data Availability Statement
The data presented in this study are available within the article.
Conflicts of Interest
The authors declare no conflict of interest. The funders had no role in the design of the study; in the collection, analyses, or interpretation of data; in the writing of the manuscript, or in the decision to publish the results.
Appendix A
Figure A1.
Chemical structure of NI 3 and respective carbon labelling for NMR signal attribution.
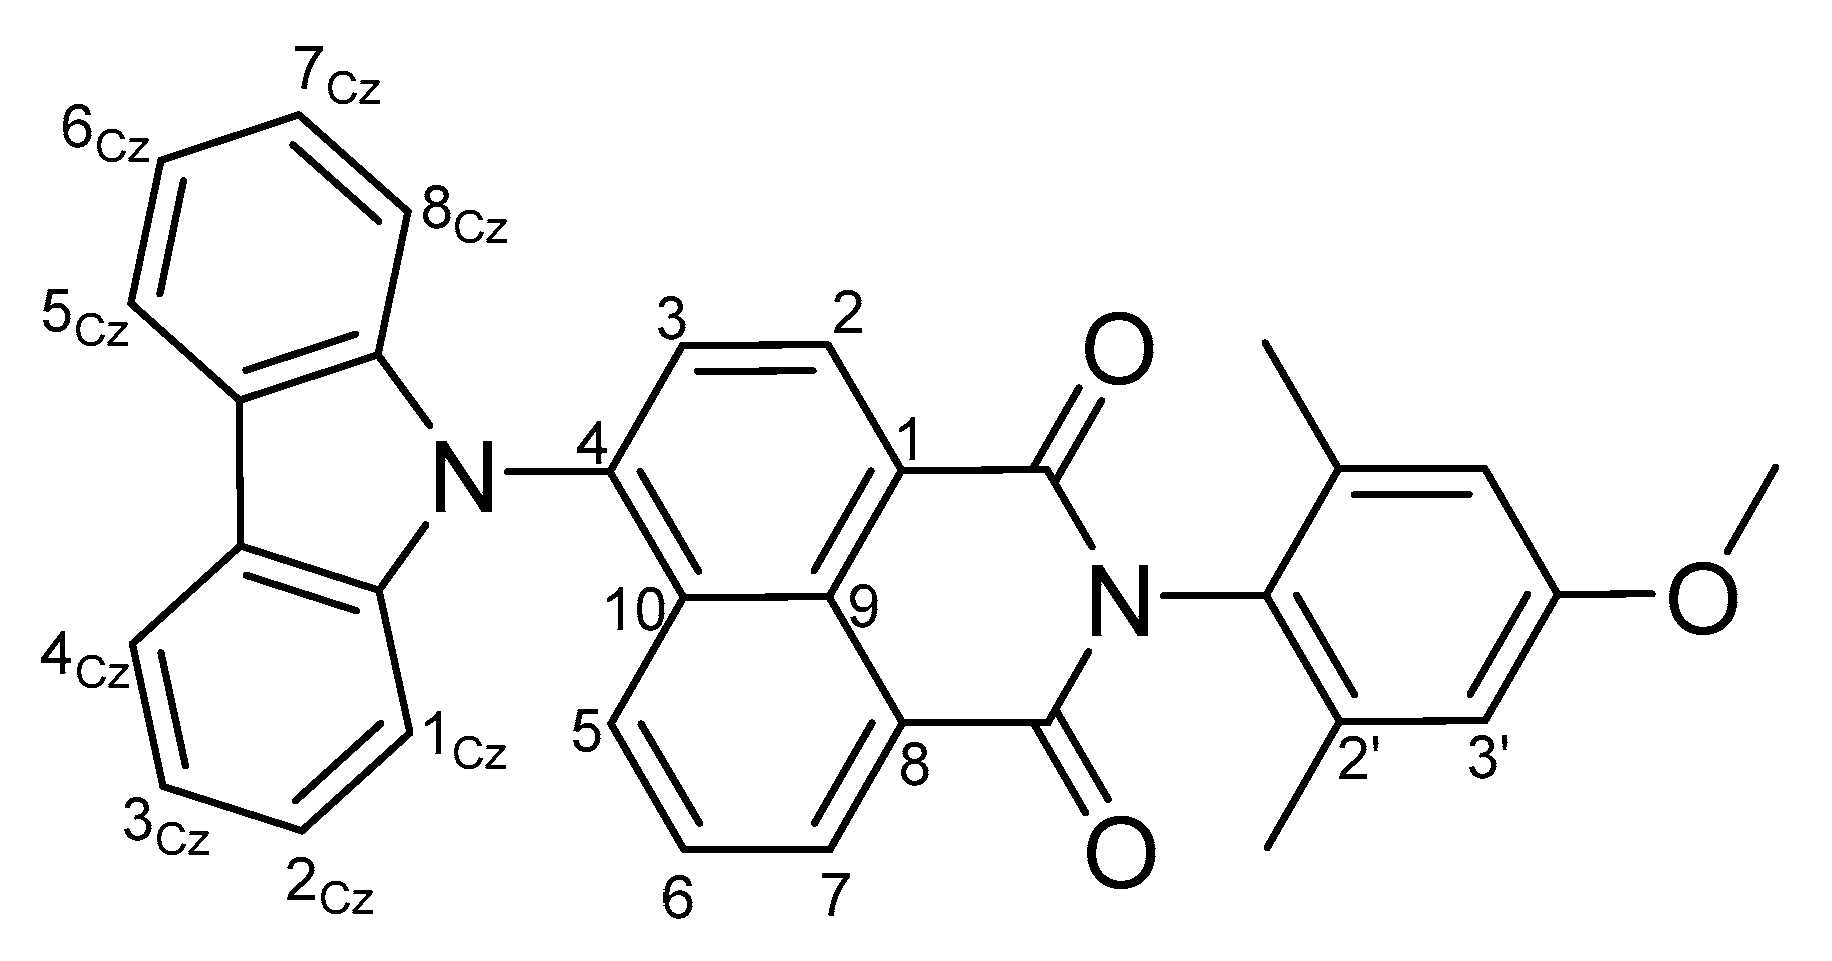
Figure A2.
Absorption (a) and excitation (b) spectra of 3 in organic solvents.

Table A1.
Solvent polarity parameters. ET(30) is, n is the refractive index, ε the dielectric constant and f(n2, εS) the Lippert Mataga parameter.
Table A1.
Solvent polarity parameters. ET(30) is, n is the refractive index, ε the dielectric constant and f(n2, εS) the Lippert Mataga parameter.
| Solvents | ET(30) a (kcal mol−1) | n | ε | f(η2, εS) b |
|---|---|---|---|---|
| MCH | 32.2 | 1.423 | 2.02 | −0.000580992 |
| n-Hexane | 31.1 | 1.387 | 1.92 | −0.000481927 |
| CCl4 | 32.4 | 1.4601 | 2.24 | 0.011243472 |
| Toluene | 33.9 | 1.4968 | 2.38 | 0.013264985 |
| ClPh | 36.8 | 1.5248 | 5.62 | 0.142936293 |
| THF | 37.4 | 1.407 | 7.58 | 0.209640381 |
| DCM | 40.7 | 1.4125 | 8.93 | 0.221048974 |
| AcN | 45.6 | 1.344 | 35.94 | 0.304609347 |
| DMSO | 45.1 | 1.479 | 46.68 | 0.263179328 |
| iPrOH | 19.92 | 1.3776 | 19.92 | 0.276060403 |
| EtOH | 24.55 | 1.3617 | 24.55 | 0.288635801 |
| MeOH | 32.7 | 1.3292 | 32.7 | 0.308276522 |
a from ref. [30]. b determined from .
Table A2.
Experimental photophysical parameters for NR in organic solvents. Υa and υf are the lowest energy absorption and emission maxima, Δυ is the Stokes shift, ΦF the quantim yield, τF the excited state lifetime, and kr and knr the radiative and non-radiative rate constants, respectively.
Table A2.
Experimental photophysical parameters for NR in organic solvents. Υa and υf are the lowest energy absorption and emission maxima, Δυ is the Stokes shift, ΦF the quantim yield, τF the excited state lifetime, and kr and knr the radiative and non-radiative rate constants, respectively.
| Solvents | υa (nm) | υa (cm−1) | υf (nm) | υf (cm−1) | Δυ (cm−1) |
|---|---|---|---|---|---|
| MCH | 475 | 21,053 | 528 | 18,939 | 2113 |
| n-Hexane | 490 | 20,408 | 543 | 18,416 | 1992 |
| Toluene | 494 | 20,243 | 569 | 17,575 | 2668 |
| ClPh | 522 | 19,157 | 597 | 16,750 | 2407 |
| THF | 508 | 19,685 | 594 | 16,835 | 2850 |
| DCM | 521 | 19,194 | 601 | 16,639 | 2555 |
| AcN | 516 | 19,380 | 614 | 16,287 | 3093 |
| DMSO | 534 | 18,727 | 630 | 15,873 | 2854 |
| iPrOH | 525 | 19,048 | 624 | 16,026 | 3022 |
| EtOH | 532 | 18,797 | 631 | 15,848 | 2949 |
| MeOH | 534 | 18,727 | 636 | 15,723 | 3003 |
Table A3.
Experimental photophysical parameters for NR in organic solvents. Υa and υf are the lowest energy absorption and emission maxima, Δυ is the Stokes shift, ΦF the quantim yield, τF the excited state lifetime, and kr and knr the radiative and non-radiative rate constants, respectively.
Table A3.
Experimental photophysical parameters for NR in organic solvents. Υa and υf are the lowest energy absorption and emission maxima, Δυ is the Stokes shift, ΦF the quantim yield, τF the excited state lifetime, and kr and knr the radiative and non-radiative rate constants, respectively.
| Solvents | υa (nm) | υa (cm−1) | υf (nm) | υf (cm−1) | Δυ (cm−1) |
|---|---|---|---|---|---|
| MCH | 475 | 21,053 | 528 | 18,939 | 2113 |
| n-Hexane | 490 | 20,408 | 543 | 18,416 | 1992 |
| Toluene | 494 | 20,243 | 569 | 17,575 | 2668 |
| ClPh | 522 | 19,157 | 597 | 16,750 | 2407 |
| THF | 508 | 19,685 | 594 | 16,835 | 2850 |
| DCM | 521 | 19,194 | 601 | 16,639 | 2555 |
| AcN | 516 | 19,380 | 614 | 16,287 | 3093 |
| DMSO | 534 | 18,727 | 630 | 15,873 | 2854 |
| iPrOH | 525 | 19,048 | 624 | 16,026 | 3022 |
| EtOH | 532 | 18,797 | 631 | 15,848 | 2949 |
| MeOH | 534 | 18,727 | 636 | 15,723 | 3003 |
Figure A3.
Size and size distributions obtained by DLS for pristine (a), aminated (b) and carboxylated (c) PS nanoparticles, PMMA nanoparticles (d) and PLDA nanoparticles (e).
Figure A3.
Size and size distributions obtained by DLS for pristine (a), aminated (b) and carboxylated (c) PS nanoparticles, PMMA nanoparticles (d) and PLDA nanoparticles (e).
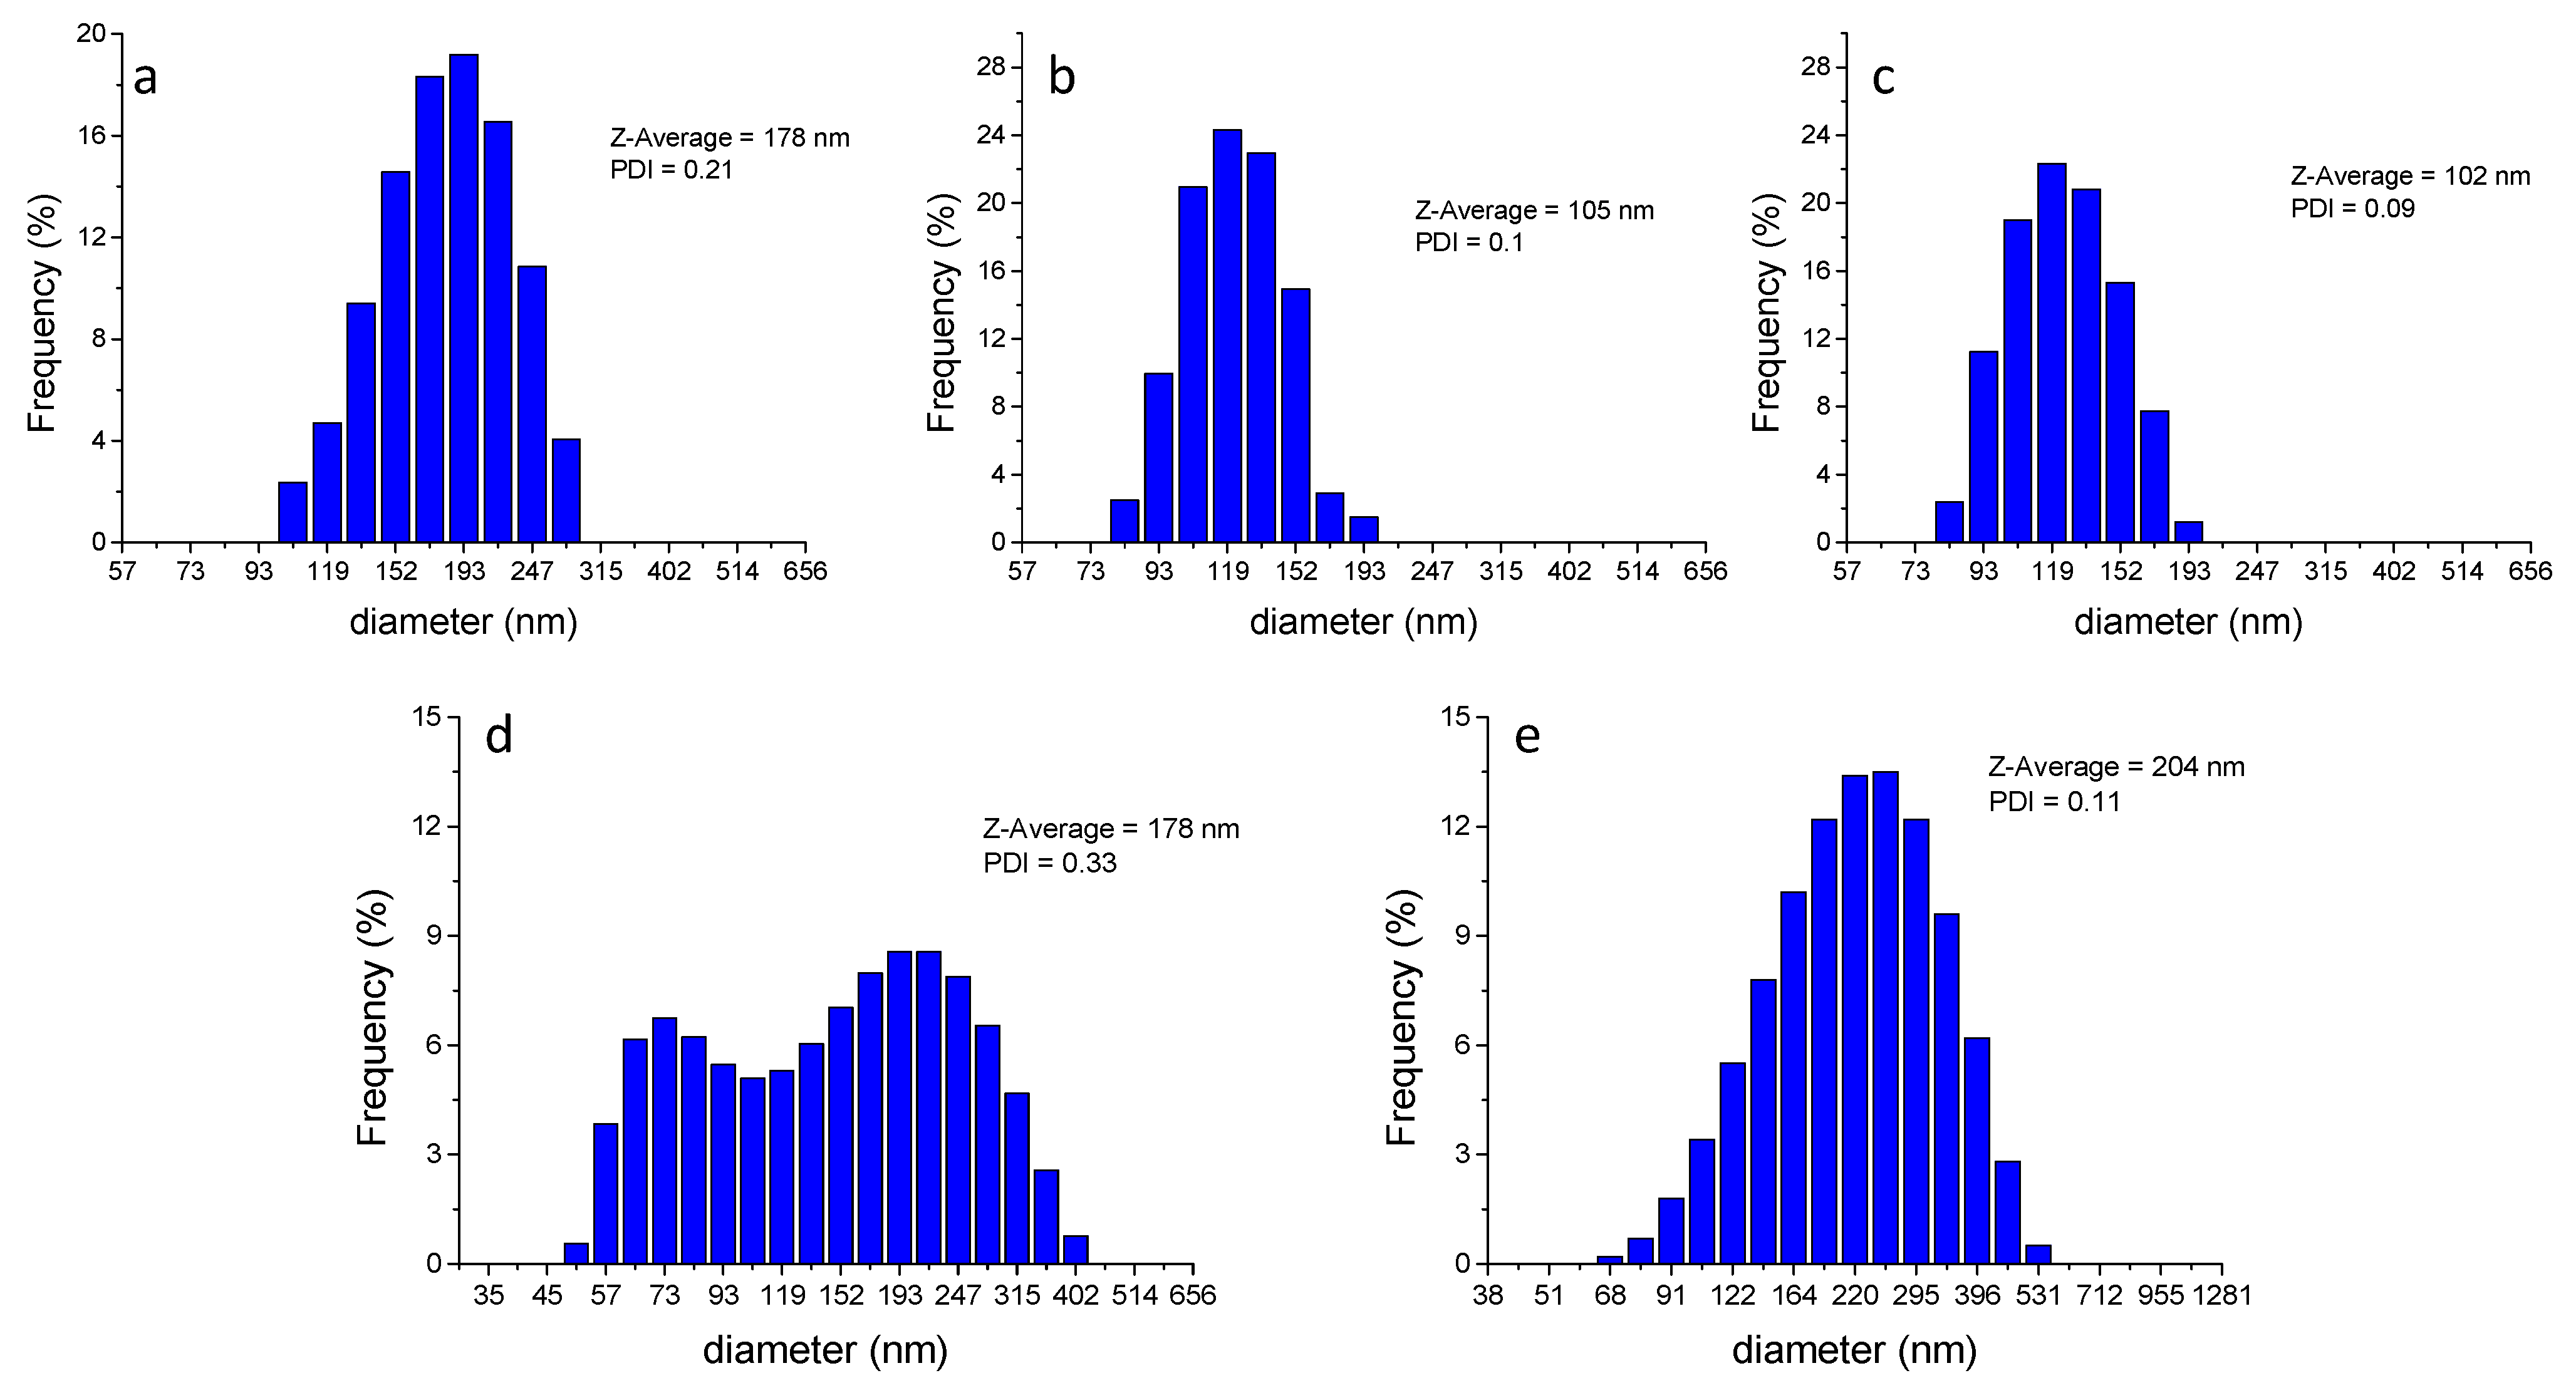
Figure A4.
Emission (dashed lines) and excitation (solid lines) spectra of 3 complexed with BSA (red) and in MCH solution (black).
Figure A4.
Emission (dashed lines) and excitation (solid lines) spectra of 3 complexed with BSA (red) and in MCH solution (black).

Table A4.
Calculated polarity parameters for tested nanocarriers and literature values.
| Nanocarrier | calc. ET(30) a (kcal mol−1) | Calculated f(η2, εS) b | n | Calculated ε | Literature Values [3,30,31,32,33,34,35] | ||
|---|---|---|---|---|---|---|---|
| ε | ET(30) (kcal mol−1) | ||||||
| PSNP | neutral | 31.2 | −0.006 | 1.66 | 2.7 | 2.6 | n.a. * |
| aminated | 31.9 | 0.010 | 1.66 | 2.9 | |||
| carboxylated | 31.4 | −0.001 | 1.66 | 2.8 | |||
| PMMANPs | 35.0 | 0.034 | 1.55 | 3.5 | 3.5 | 35.6 | |
| PLGANPs | 36.2 | 0.054 | 1.49 | 3.8 | 3.0 | 35.8 | |
| BSA | 27.5 | −0.085 | 1.602 | 1.8 | n.a. * | 46.0 | |
| Pluronic P123 micelles | 38.1 | −0.098 | 1.46 | 4.8 | 42.0 | ||
| Tween 80 micelles | 38.3 | 0.100 | 1.47 | 5.1 | 55.0 | ||
References
- Fumagalli, L.; Ferrari, G.; Sampietro, M.; Gomila, G. Quantitative Nanoscale Dielectric Microscopy of Single-Layer Supported Biomembranes. Nano Lett. 2009, 9, 1604–1608. [Google Scholar] [CrossRef] [PubMed]
- Riedel, C.; Arinero, R.; Tordjeman, P.; Lévêque, G.; Schwartz, G.A.; Alegria, A.; Colmenero, J. Nanodielectric mapping of a model polystyrene-poly(vinyl acetate) blend by electrostatic force microscopy. Phys. Rev. E 2010, 81, 010801. [Google Scholar] [CrossRef] [PubMed] [Green Version]
- Hess, C.M.; Riley, E.A.; Palos-Chávez, J.; Reid, P.J. Measuring the Spatial Distribution of Dielectric Constants in Polymers through Quasi-Single Molecule Microscopy. J. Phys. Chem. B 2013, 117, 7106–7112. [Google Scholar] [CrossRef] [PubMed] [Green Version]
- Serghei, A.; Tress, M.; Kremer, F. Confinement Effects on the Relaxation Time Distribution of the Dynamic Glass Transition in Ultrathin Polymer Films. Macromolecules 2006, 39, 9385–9387. [Google Scholar] [CrossRef]
- Hou, Y.W.; Bardo, A.M.; Martinez, C.; Higgins, D.A. Characterization of Molecular Scale Environments in Polymer Films by Single Molecule Spectroscopy. J. Phys. Chem. B 2000, 104, 212–219. [Google Scholar] [CrossRef]
- Levitsky, I.; Krivoshlykov, S.G.; Grate, J.W. Rational Design of a Nile Red/Polymer Composite Film for Fluorescence Sensing of Organophosphonate Vapors Using Hydrogen Bond Acidic Polymers. Anal. Chem. 2001, 73, 3441–3448. [Google Scholar] [CrossRef]
- Yadigarli, A.; Song, Q.; Druzhinin, S.I.; Schönherr, H. Probing of local polarity in poly(methyl methacrylate) with the charge transfer transition in Nile red. Beilstein J. Org. Chem. 2019, 15, 2552–2562. [Google Scholar] [CrossRef] [Green Version]
- Martinez, V.; Henary, M. Nile Red and Nile Blue: Applications and Syntheses of Structural Analogues. Chem. Eur. J. 2016, 22, 13764–13782. [Google Scholar] [CrossRef]
- Sackett, D.L.; Wolff, J. Nile red as a polarity-sensitive fluorescent probe of hydrophobic protein surfaces. J. Anal. Biochem. 1987, 167, 228–234. [Google Scholar] [CrossRef]
- Levitt, J.A.; Chung, P.-H.; Suhling, K. Spectrally resolved fluorescence lifetime imaging of Nile red for measurements of intracellular polarity. J. Biomed. Opt. 2015, 20, 096002. [Google Scholar] [CrossRef] [Green Version]
- Jee, A.Y.; Park, S.; Kwon, H.; Lee, M. Excited state dynamics of Nile Red in polymers. Chem. Phys. Lett. 2009, 477, 112–115. [Google Scholar] [CrossRef]
- Dias, L.C.; Custodio, R.; Pessine, F.B.T. Investigation of the Nile Red spectra by semi-empirical calculations and spectrophotometric measurements. Int. J. Quantum Chem. 2006, 106, 2624–2632. [Google Scholar] [CrossRef]
- Krishna, M.M. Excited-State Kinetics of the Hydrophobic Probe Nile Red in Membranes and Micelles. J. Phys. Chem. A 1999, 103, 3589–3595. [Google Scholar] [CrossRef]
- Hazra, P.; Chakrabarty, D.; Chakraborty, A.; Sarkar, N. Intramolecular charge transfer and solvation dynamics of Nile Red in the nanocavity of cyclodextrins. Chem. Phys. Lett. 2004, 388, 150–157. [Google Scholar] [CrossRef]
- Renge, I.J. Refractive index dependence of solvatochromism. Photochem. Photobiol. A 2018, 353, 433–444. [Google Scholar] [CrossRef]
- Jia, X.; Yang, Y.; Xu, Y.; Qian, X. Naphthalimides for labeling and sensing applications. Pure Appl. Chem. 2014, 86, 1237–1246. [Google Scholar] [CrossRef]
- Christopherson, C.J.; Paisley, N.R.; Xiao, Z.; Algar, W.R.; Hudson, Z.M. Red-Emissive Cell-Penetrating Polymer Dots Exhibiting Thermally Activated Delayed Fluorescence for Cellular Imaging. J. Am. Chem. Soc. 2021, 143, 13342–13349. [Google Scholar] [CrossRef]
- Jena, S.; Dhanalakshmi, P.; Bano, G.; Thilagar, P. Delayed Fluorescence, Room Temperature Phosphorescence, and Mechanofluorochromic Naphthalimides: Differential Imaging of Normoxia and Hypoxia Live Cancer Cells. J. Phys. Chem. B 2020, 124, 5393–5406. [Google Scholar] [CrossRef]
- Cao, X.; Wu, Y.; Liu, K.; Yu, X.; Wu, B.; Wu, H.; Gong, Z.; Yi, T. Iridium Complex Triggered White-Light-Emitting Gel and its Response to Cysteine. J. Mater. Chem. 2012, 22, 2650–2657. [Google Scholar] [CrossRef]
- Jiang, L.; Tian, Y.; Sun, T.; Zhu, Y.; Ren, H.; Zou, X.; Ma, Y.; Meihaus, K.R.; Long, J.R.; Zhu, G. A Crystalline Polyimide Porous Organic Framework for Selective Adsorption of Acetylene over Ethylene. J. Am. Chem. Soc. 2018, 140, 15724–15730. [Google Scholar] [CrossRef]
- Williams, D.B.G.; Lawton, M. Drying of organic solvents: Quantitative evaluation of the efficiency of several desiccants. J. Org. Chem. 2010, 75, 8351–8354. [Google Scholar] [CrossRef] [PubMed]
- Vu, K.B.; Phung, T.K.; Tran, T.T.T.; Mugemana, C.; Giang, H.N.; Nhi, T.L.P. Polystyrene nanoparticles prepared by nanoprecipitation: A recyclable template for fabricating hollow silica. J. Ind. Eng. Chem. 2021, 97, 307–315. [Google Scholar] [CrossRef]
- Aubrey, J.; Ganachaud, F.; Addad, J.P.C.; Cabane, B. Nanoprecipitation of Polymethylmethacrylate by Solvent Shifting: 1. Boundaries. Langmuir 2009, 25, 1970–1979. [Google Scholar] [CrossRef] [PubMed]
- Crucho, C.I.C.; Barros, M.T. Formulation of functionalized PLGA polymeric nanoparticles for targeted drug delivery. Polymer 2015, 68, 41–46. [Google Scholar] [CrossRef]
- Crucho, C.I.C.; Avó, J.; Diniz, A.M.; Pinto, S.N.; Barbosa, J.; Smith, P.O.; Berberan-Santos, M.N.; Pålsson, L.O.; Dias, F.B. TADF Dye-Loaded Nanoparticles for Fluorescence Live-Cell Imaging. Front. Chem. 2020, 8, 404. [Google Scholar] [CrossRef]
- Olmsted, J., III. Calorimetric determinations of absolute fluorescence quantum yields. J. Phys. Chem. 1979, 83, 2581–2584. [Google Scholar] [CrossRef]
- Jiang, W.; Sun, Y.; Wang, X.; Wang, Q.; Xu, W. Synthesis and Photochemical Properties of Novel 4-Diarylamine-1,8-naphthalimide Derivatives. Dye. Pigment. 2008, 77, 125–128. [Google Scholar] [CrossRef]
- Tanaka, H.; Shizu, K.; Nakanotani, H.; Adachi, C. Twisted Intramolecular Charge Transfer State for Long-Wavelength Thermally Activated Delayed Fluorescence. Chem. Mater. 2013, 25, 3766–3771. [Google Scholar] [CrossRef]
- Zhao, Y.; Duan, R.; Zhao, J.; Li, C. Spin-Orbit Charge Transfer Intersystem Crossing in Perylenemonoimide-Phenothiazine Compact Electron Donor-Acceptor Dyads. Chem. Commun. 2018, 54, 12329–12332. [Google Scholar] [CrossRef]
- Cerón-Carrasco, J.P.; Jacquemin, D.; Laurence, C.; Planchat, A.; Reichardt, C.; Sraïdi, K. Solvent polarity scales: Determination of new ET(30) values for 84 organic solvents. J. Phys. Org. Chem. 2014, 27, 512–518. [Google Scholar] [CrossRef]
- Ghosh, S.; Guchhait, N. Chemically Induced Unfolding of Bovine Serum Albumin by Urea and Sodium Dodecyl Sulfate: A Spectral Study with the Polarity-Sensitive Charge-Transfer Fluorescent Probe (E)-3-(4-Methylaminophenyl)acrylic Acid Methyl Ester. ChemPhysChem 2009, 10, 1664–1671. [Google Scholar] [CrossRef] [PubMed]
- Abraham, R.; Thomas, S.P.; Kuryan, S.; Isac, J. Mechanical properties of ceramic-polymer nanocomposites. Express Polym. Lett. 2009, 3, 177–189. [Google Scholar] [CrossRef]
- Gomes, A.J.; Assunção, R.M.N.; Filho, G.R.; Espreafico, E.M.; Machado, A.E.H. Preparation and Characterization of Poly(D,L-lactic-co-glycolic acid) Nanoparticles Containing 3-(Benzoxazol-2-yl)-7-(N,N-diethyl amino)chromen-2-one. J. Appl. Polym. Sci. 2007, 105, 964–972. [Google Scholar] [CrossRef]
- Mishra, J.; Swain, J.; Mishra, A.K. Molecular Level Understanding of Sodium Dodecyl Sulfate (SDS) Induced Sol-Gel Transition of Pluronic F127 Using Fisetin as a Fluorescent Molecular Probe. J. Phys. Chem. B 2018, 122, 181–193. [Google Scholar] [CrossRef]
- Paul, B.K.; Ghosh, N.; Mukherjee, S. Modulated Photophysics and Rotational-Relaxation Dynamics of Coumarin 153 in Nonionic Micelles: The Role of Headgroup Size and Tail Length of the Surfactants. RSC Adv. 2015, 5, 9381–9388. [Google Scholar] [CrossRef]
Scheme 1.
Synthetic pathway for the preparation of carbazole-NI dye 3.
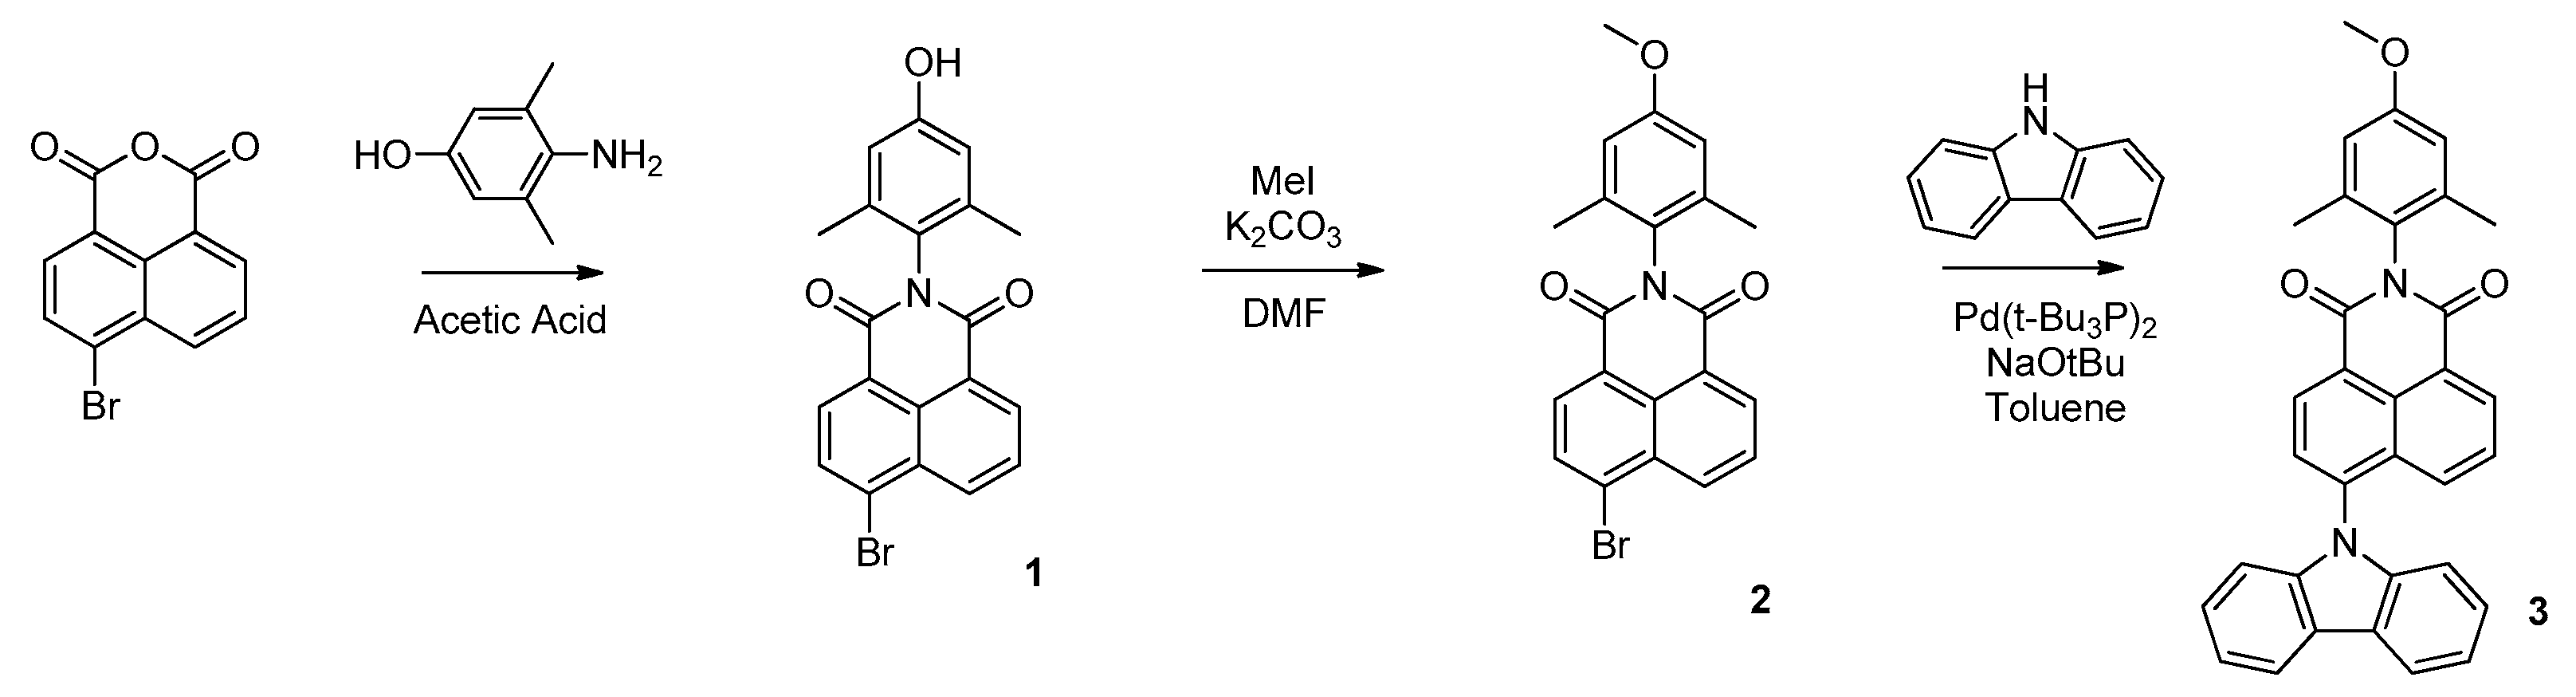
Figure 1.
Emission spectra (a) and normalized emission spectra (b) of 3 in different organic solvents.
Figure 1.
Emission spectra (a) and normalized emission spectra (b) of 3 in different organic solvents.
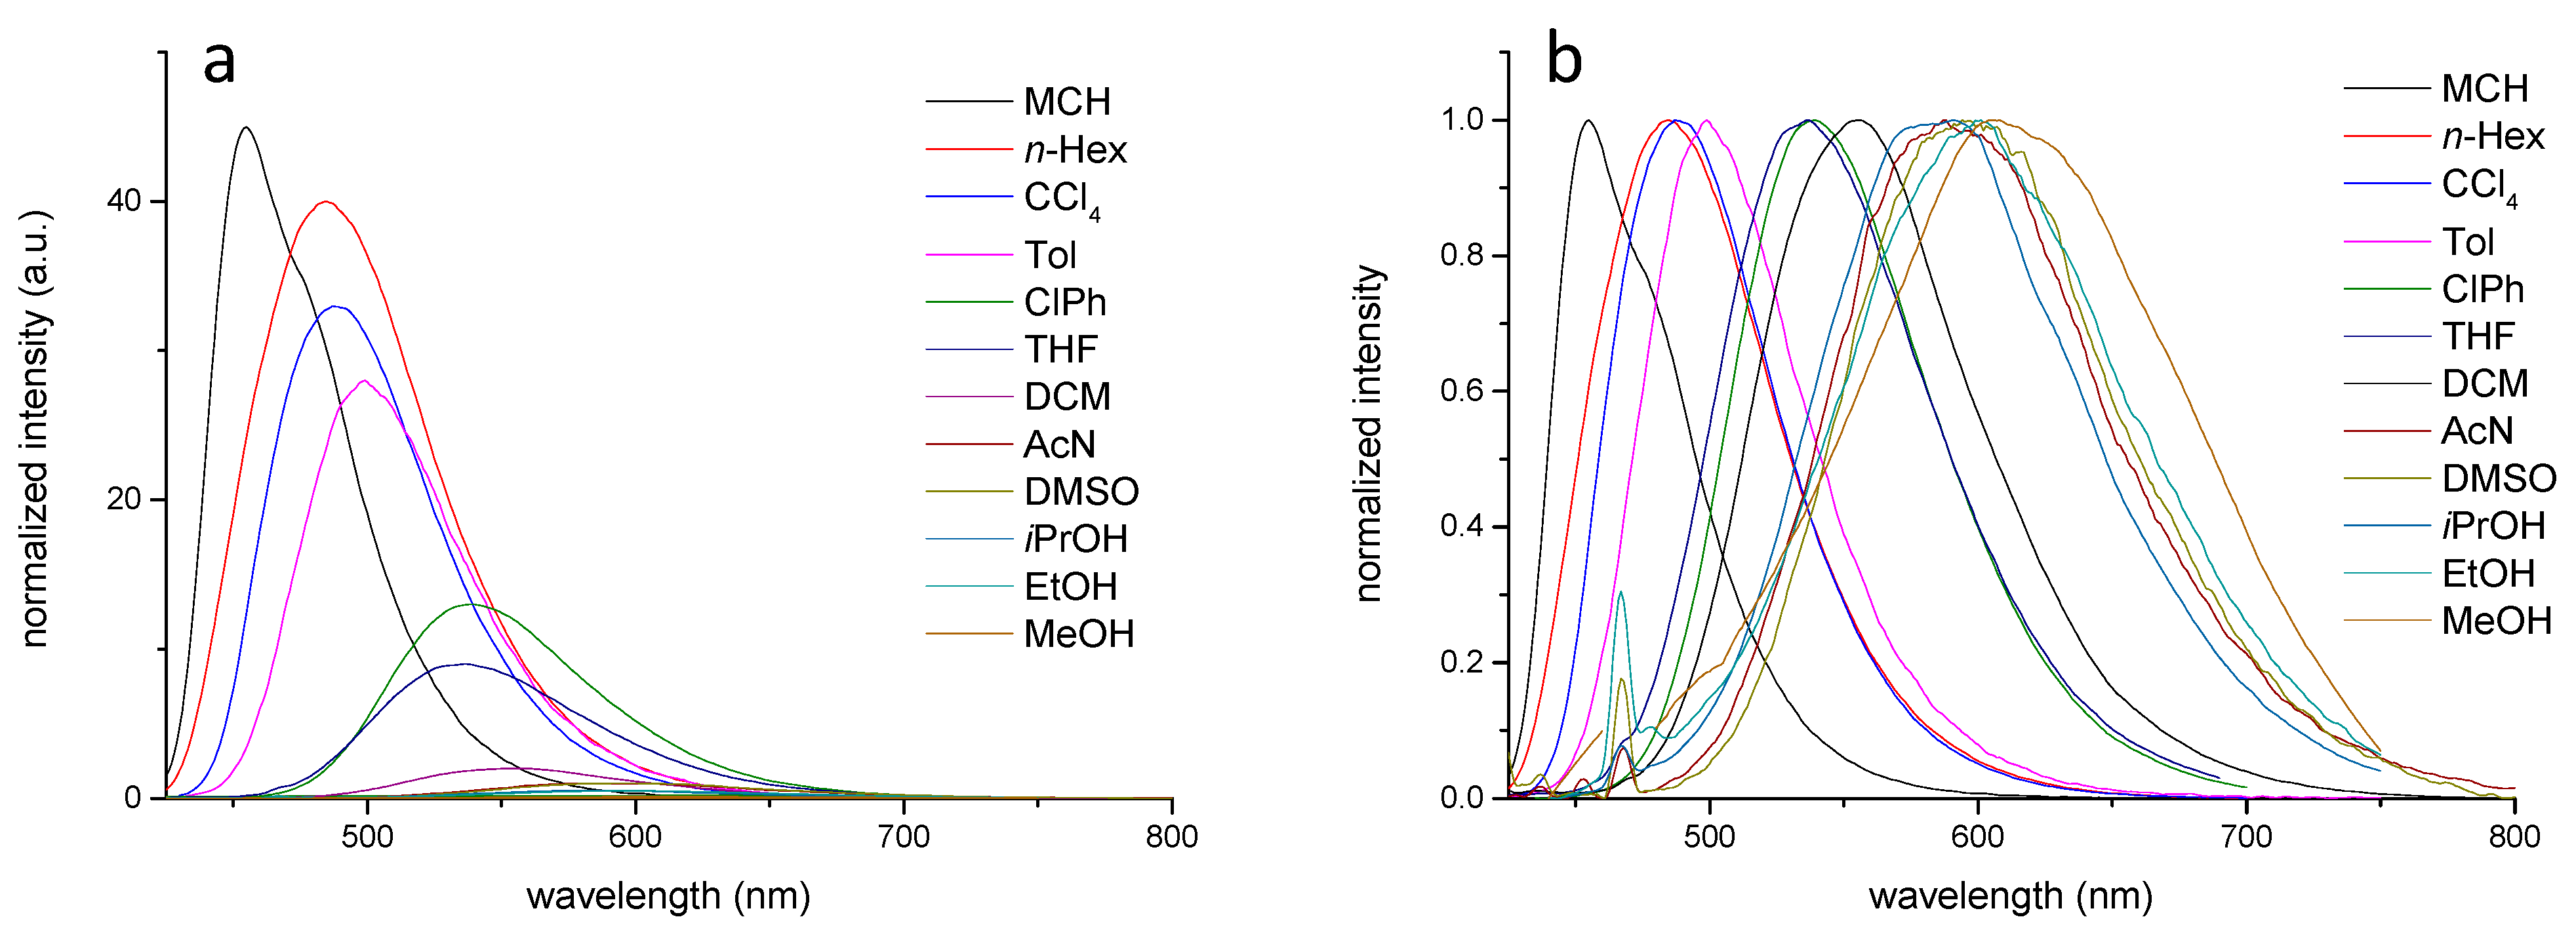
Figure 2.
Variation of Stokes shift (υa–υf) as a function of (a) Lippert-Mataga parameter and ET(30) values (b) for the selected organic solvents. Linear fits were achieved with a linear regression applying a least squares method.
Figure 2.
Variation of Stokes shift (υa–υf) as a function of (a) Lippert-Mataga parameter and ET(30) values (b) for the selected organic solvents. Linear fits were achieved with a linear regression applying a least squares method.
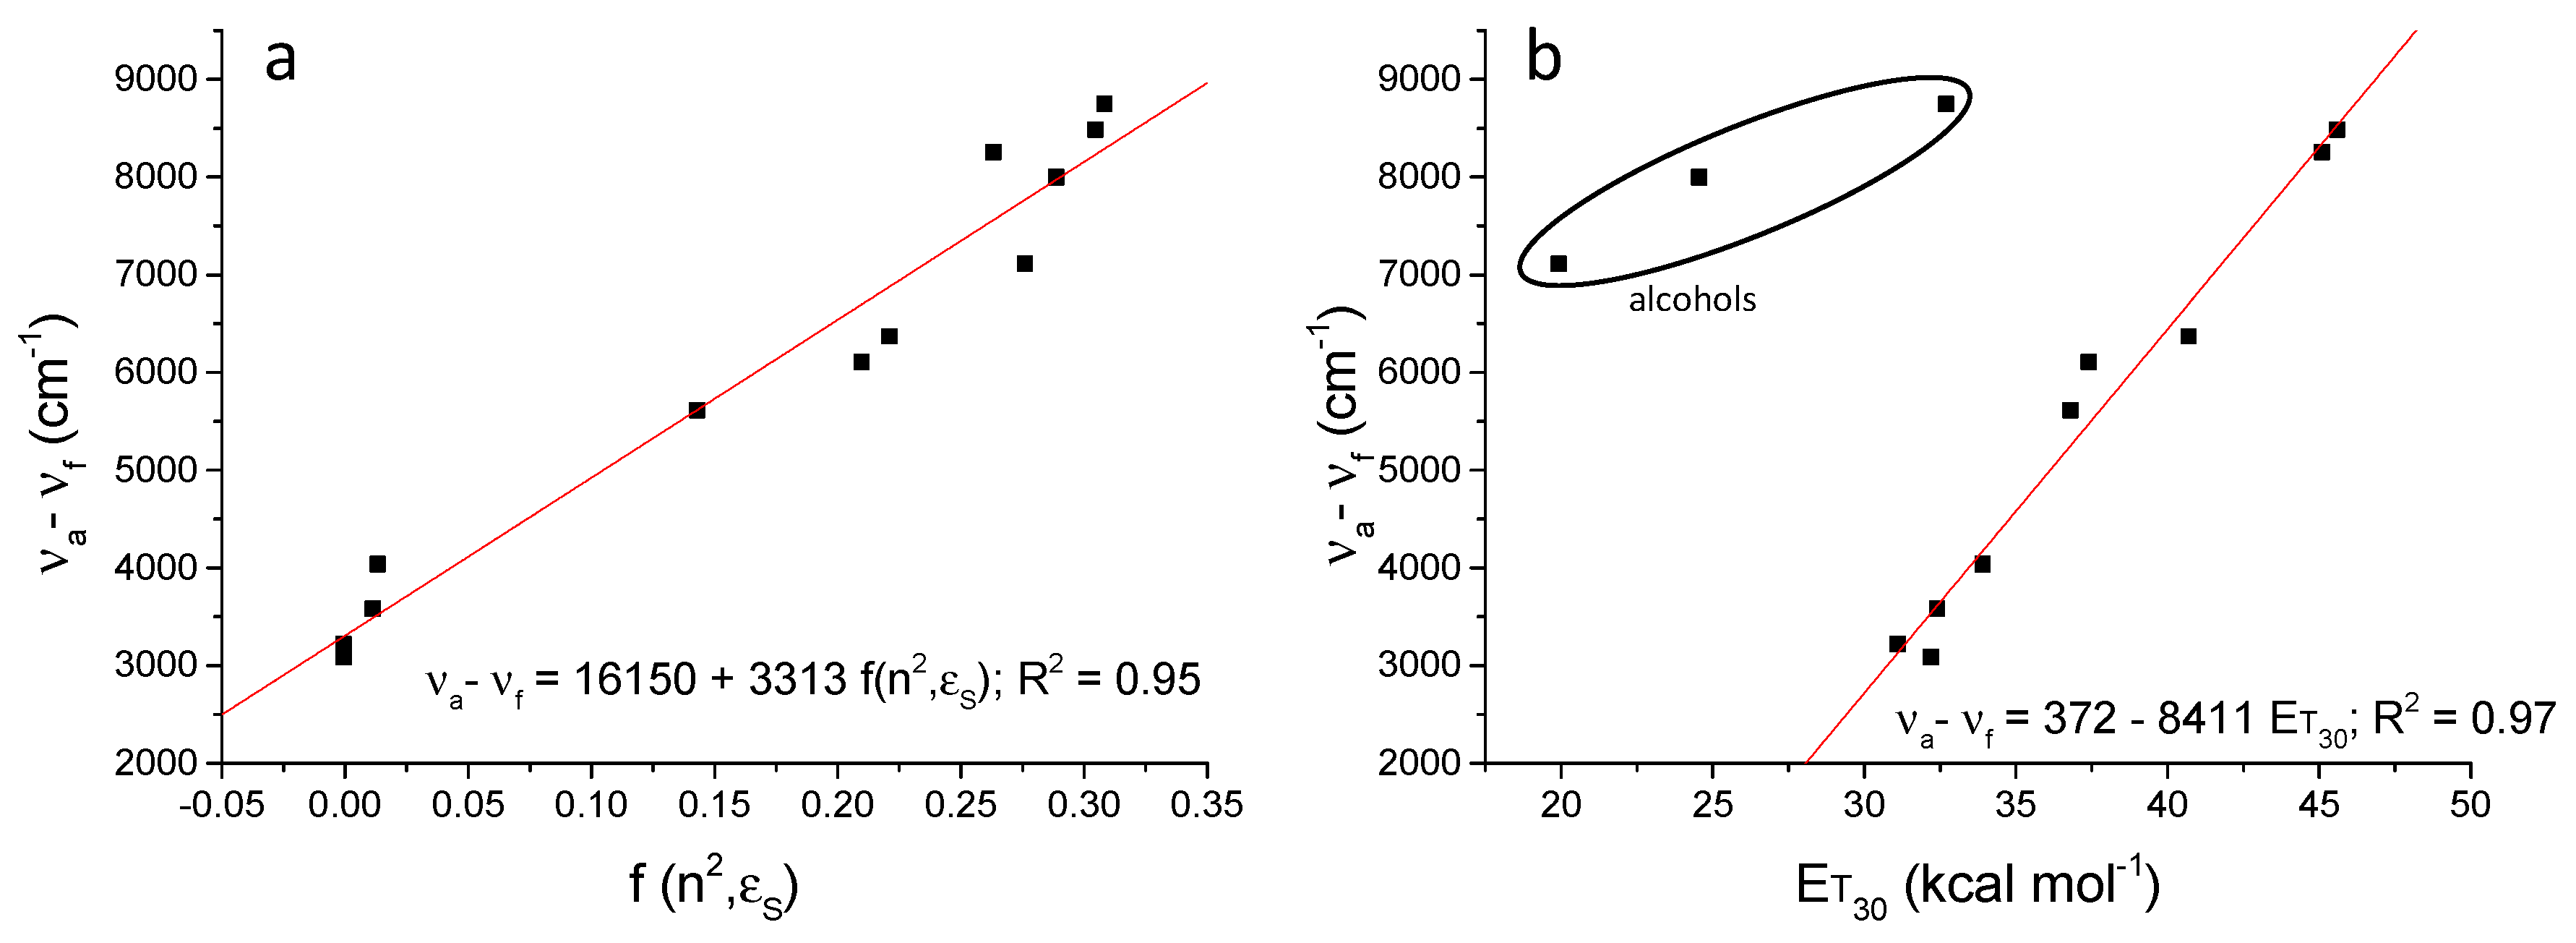
Figure 3.
Normalized emission spectra of Nile Red (a) and variation of Stokes shift (υa–υf) as a function of (b) Lippert-Mataga parameter and ET(30) values (c) in organic solvents. Linear fits were achieved with a linear regression applying a least squares method.
Figure 3.
Normalized emission spectra of Nile Red (a) and variation of Stokes shift (υa–υf) as a function of (b) Lippert-Mataga parameter and ET(30) values (c) in organic solvents. Linear fits were achieved with a linear regression applying a least squares method.
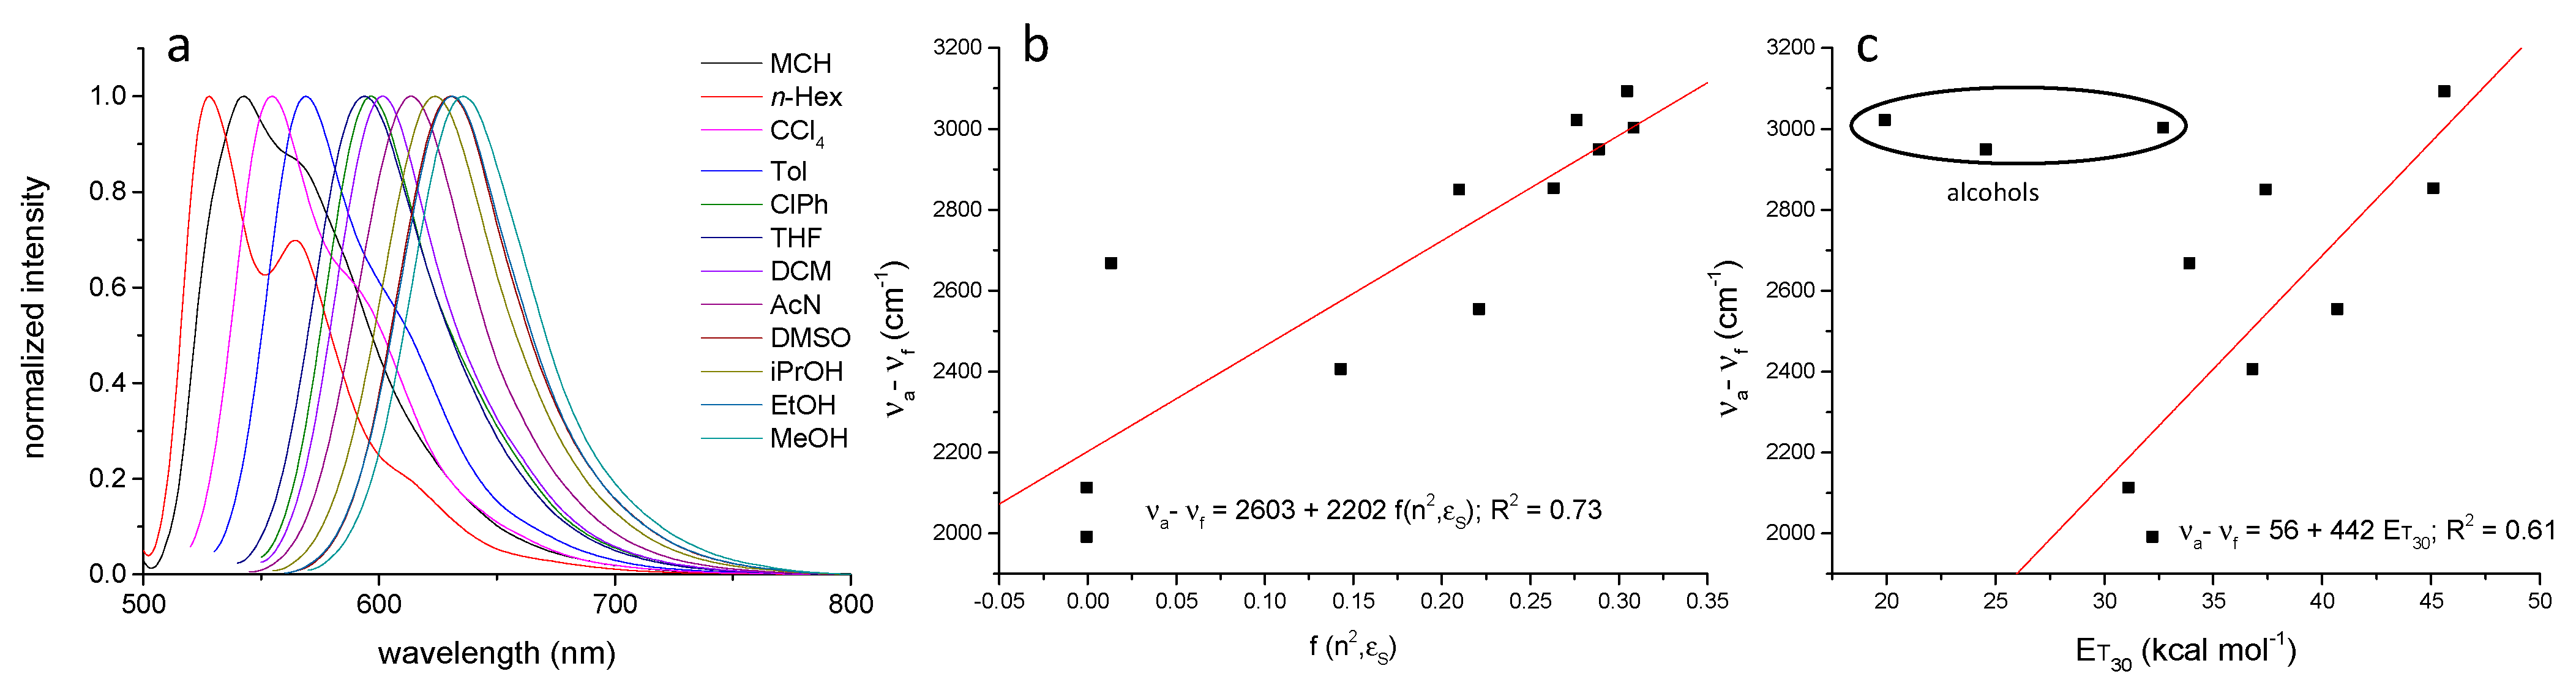
Figure 4.
Normalized emission (a) and excitation (b) spectra of nanocarriers loaded with NI 3 in aqueous media.
Figure 4.
Normalized emission (a) and excitation (b) spectra of nanocarriers loaded with NI 3 in aqueous media.

Table 1.
Experimental photophysical parameters for 3 in organic solvents. Υa and υf are the lowest energy absorption and emission maxima, Δυ is the Stokes shift, ΦF the quantum yield, τF the excited state lifetime, and kr and knr the radiative and non-radiative rate constants, respectively.
Table 1.
Experimental photophysical parameters for 3 in organic solvents. Υa and υf are the lowest energy absorption and emission maxima, Δυ is the Stokes shift, ΦF the quantum yield, τF the excited state lifetime, and kr and knr the radiative and non-radiative rate constants, respectively.
| Solvents a | υa (cm−1) | υf (cm−1) | Δυ (cm−1) | ΦF (%) b | τF (ns) | kr (ns−1) | knr (ns−1) |
|---|---|---|---|---|---|---|---|
| MCH | 24,096 | 21,008 | 3088 | 45.1 | 7.74 | 0.058 | 0.071 |
| n-Hexane | 23,753 | 20,534 | 3219 | 39.9 | 6.62 | 0.060 | 0.091 |
| CCl4 | 23,866 | 20,284 | 3582 | 33.3 | 7.80 | 0.043 | 0.087 |
| Toluene | 24,038 | 20,000 | 4038 | 28.1 | 7.43 | 0.038 | 0.097 |
| ClPh | 23,697 | 18,083 | 5613 | 13.0 | 9.24 | 0.014 | 0.094 |
| THF | 24,390 | 18,282 | 6108 | 9.1 | 6.38 | 0.014 | 0.142 |
| DCM | 24,038 | 17,668 | 6370 | 7.9 | 9.46 | 0.009 | 0.097 |
| AcN | 24,691 | 16,207 | 8484 | 2.3 | 4.01 | 0.005 | 0.245 |
| DMSO | 24,155 | 15,898 | 8256 | 1.0 | 2.69 | 0.004 | 0.367 |
| iPrOH | 23,753 | 16,639 | 7114 | 0.5 | 2.48 | 0.002 | 0.401 |
| EtOH | 23,697 | 15,699 | 7998 | 0.5 | 0.67 | 0.008 | 1.487 |
| MeOH | 23,923 | 15,175 | 8748 | 0.1 | 0.23 | 0.004 | 4.401 |
a Solvent parameters in Supplementary Materials. b Determined using the comparative method against Acridine Yellow in ethanol.
Table 2.
Experimental photophysical parameters for nanocarriers loaded with 3. Υa and υf are the lowest energy absorption and emission maxima, Δυ is the Stokes shift, ΦF the quantum yield, τF the excited state lifetime, and kr and knr the radiative and non-radiative rate constants, respectively.
Table 2.
Experimental photophysical parameters for nanocarriers loaded with 3. Υa and υf are the lowest energy absorption and emission maxima, Δυ is the Stokes shift, ΦF the quantum yield, τF the excited state lifetime, and kr and knr the radiative and non-radiative rate constants, respectively.
| Nanocarrier | υa a (cm−1) | υf (cm−1) | Δυ (cm−1) | ΦFf b (%) | τF (ns) | kr (ns−1) | knr (ns−1) | |
|---|---|---|---|---|---|---|---|---|
| PSNP | neutral | 24,113 | 20,703 | 3410 | 42.0 | 9.51 | 0.044 | 0.061 |
| aminated | 23,923 | 20,449 | 3474 | 38.1 | 10.71 | 0.035 | 0.058 | |
| carboxylated | 23,980 | 20,618 | 3362 | 39.2 | 11.63 | 0.033 | 0.052 | |
| PMMANPs | 23,952 | 20,080 | 3872 | 30.7 | 9.96 | 0.031 | 0.069 | |
| PLGANPs | 23,923 | 19,762 | 4161 | 24.9 | 11.18 | 0.022 | 0.067 | |
| BSA | 23,584 | 21,929 | 1655 | 62.6 | 5.14 | 0.123 | 0.072 | |
| Pluronic P123 micelles | 23,923 | 18,622 | 5301 | 12.1 | 9.74 | 0.012 | 0.090 | |
| Tween 80 micelles | 23,866 | 18,657 | 5209 | 12.9 | 6.02 | 0.022 | 0.145 | |
a Determined from the excitation spectra. b Determined using the absolute method with an Integrating sphere.
Publisher’s Note: MDPI stays neutral with regard to jurisdictional claims in published maps and institutional affiliations. |
© 2022 by the authors. Licensee MDPI, Basel, Switzerland. This article is an open access article distributed under the terms and conditions of the Creative Commons Attribution (CC BY) license (https://creativecommons.org/licenses/by/4.0/).
Share and Cite
MDPI and ACS Style
Diniz, A.M.; Cruz, R.P.R.; Avó, J. Probing the Local Polarity in Biocompatible Nanocarriers with Solvatofluorochromism of a 4-Carbazole-1,8-naphthalimide Dye. Photochem 2022, 2, 489-502. https://doi.org/10.3390/photochem2030034
AMA Style
Diniz AM, Cruz RPR, Avó J. Probing the Local Polarity in Biocompatible Nanocarriers with Solvatofluorochromism of a 4-Carbazole-1,8-naphthalimide Dye. Photochem. 2022; 2(3):489-502. https://doi.org/10.3390/photochem2030034
Chicago/Turabian StyleDiniz, Ana M., Rui P. R. Cruz, and João Avó. 2022. "Probing the Local Polarity in Biocompatible Nanocarriers with Solvatofluorochromism of a 4-Carbazole-1,8-naphthalimide Dye" Photochem 2, no. 3: 489-502. https://doi.org/10.3390/photochem2030034