
Migration Barrier Estimation of Carbon in Lead for Lead–Acid Battery Applications: A Density Functional Theory Approach


1
Composite Materials and Mechanics Laboratory, Mechanical and Aerospace Engineering Department, Tandon School of Engineering, New York University, Brooklyn, NY 11201, USA
2
Composite Materials Department, Central Metallurgical Research and Development Institute (CMRDI), Helwan, Cairo P.O. Box 87, Egypt
*
Author to whom correspondence should be addressed.
Solids 2022, 3(2), 177-187; https://doi.org/10.3390/solids3020012
Submission received: 25 February 2022
/
Revised: 12 March 2022
/
Accepted: 14 March 2022
/
Published: 22 March 2022
Abstract
:Recent efforts towards developing novel lead electrodes involving carbon and lead composites have shown potential for increasing the cycle life of lead–acid (LA) batteries used to store energy in various applications. In this study, first-principles calculations are used to examine the structural stability, defect formation energy, and migration barrier of C in Pb for LA batteries. Density functional theory with the GGA-PBE functional performed the best out of various functionals used for structural stability calculations. Furthermore, with the complete incorporation of C in the Pb matrix, the results show that C is energetically preferred to be at the octahedral interstitial () site in the FCC structure of Pb. Additionally, climbing-image nudged elastic band calculations show a minimum energy pathway for C diffusing from a stable octahedral site to the adjacent octahedral site assisted by a tetrahedral intermediate site. Therefore, the minimum energy pathway for C migration is envisioned to be , where the total energy barrier is observed to be ~90% and more than 100% lower than the and barriers, respectively.
1. Introduction
A transition of the global energy needs from fossil fuels to renewable resources has increased the need for batteries [1]. The research and development of batteries has increased over the past decade, and the battery market is expected to keep growing at a rate of 14.1% until 2027 [2,3]. The total market shares of different types of batteries are shown in Figure 1. Currently, the dominant battery types are lead–acid (LA), lithium-ion (Li-ion), nickel–metal hydride (Ni-MH), and nickel–cadmium (Ni-Cd) batteries [4,5]. Of all of these types, LA and Li-ion batteries are dominating the market. While Li-ion batteries are getting significant attention in electrical vehicles and electronic devices [6,7], the global LA battery demand is expected to keep growing due to their increased usage in automobiles, uninterrupted power sources (UPSs), and manufacturing methods [3,8,9]. The primary driving force for this sustained growth is attributed to the lower cost and overall recyclability (~99%) of LA batteries. Recent development in LA batteries has focused on reducing their total weight while maintaining/enhancing the overall battery performance [10,11] by adding different forms of carbon (C) to the individual electrodes [12,13,14,15]. The primary location of incorporation of C in the LA battery architecture is at the negative active material (NAM). Figure S1 provides a schematic of LA batteries, highlighting the positive active material (traditionally PbO2) and NAM (traditionally Pb), separated by a separator. The NAM is shown to include carbon, where carbon is completely incorporated into the Pb matrix. In this work we are focusing on enhancing our fundamental understanding of the incorporation of C in a Pb matrix.
The addition of carbon to NAM mostly improves the battery performance [17,18,19,20], due to (1) increase in electronic conductivity, (2) restriction of lead sulfate (PbSO4) crystal growth during the charging and discharging cycles, and (3) enhancement of capacitive contribution, which improves the discharge performance [21]. Carbon is added to NAM in different forms (e.g., activated carbon [12,18,22,23], carbon black [13,22,24], graphite [23,25,26], graphene [26,27,28], carbon nanotubes [26,29,30,31], porous carbon [32,33], etc.). While most of these carbons improve the cell performance, microporous carbon with a high surface area has been reported to reduce the capacity of the battery and, hence, is not suitable [20]. Recent studies focusing on the addition of nanostructured carbon to NAM have resulted in higher utilization efficiency and enhancement of charge/discharge performance in LA batteries [29]. There are different approaches to including carbon in NAM, where carbon is either incorporated in the Pb matrix during synthesis or it is adsorbed on the surface of the Pb electrode [22].
Both experimental and theoretical studies are critical to advancing our understanding of different battery technologies. Computational methods at the level of electronic and atomistic methods have been successfully used to enhance our understanding of battery materials [34,35,36,37,38,39,40]. While the impact of carbon on the performance of LA batteries is well established experimentally, it is important to enhance our fundamental understanding of the addition of C to the Pb matrix for further improvement. First-principles calculations are used in this study to address the stability of C in the Pb matrix. Section 2 describes the computational details used in this study. The results on the structural stability of C and diffusion barriers for the movement of C in the Pb matrix are included in Section 3. The conclusions of this work are summarized in Section 4.
2. Computational Details
Density Functional Theory
Density functional theory (DFT) at the level of plane waves was used for all of the calculations performed on the Pb and Pb–C systems in this work. The DFT calculations were carried out using the Vienna Ab initio Simulation Package (VASP) [41,42] available within the MedeA Platform [43]. The generalized gradient approximation (GGA) functional parametrized by Perdew, Burke, and Ernzerhof (PBE) was used to describe the exchange and correlation energies of the electrons [44]. The projector-augmented wave (PAW) pseudopotentials described the valence electron configurations of 6s25d106p2 and 2s22p2 for Pb and C, respectively. All of the calculations performed for this computational examination used a plane-wave cutoff energy of 500 eV. To accommodate varying C concentrations within the Pb matrix, different system sizes along the X-, Y-, and Z-axes were examined. Due to the variation in supercell size, different k-point Monkhorst–Pack meshes were used for integrations over the Brillouin zone [45]. However, the actual k-spacing was maintained close to 0.25 × 0.25 × 0.25 per Å for all of the structures. For structural optimization, all single-point calculations were set with a convergence value of eV; for ionic relaxation and complete optimization (position, supercell shape, and size), the calculation was performed until the Hellmann–Feynman force on each atom was less than 0.02 eV/Å.
Experimentally, the amount of C () added to NAM of LA batteries was reported to be in the range of 0.2–2.0 wt% [12,13,17,22]. As shown in Supplementary Section S1, assuming a two-element system of Pb and C, the wt%–at% conversion shows that the addition of one carbon to every unit cell of Pb (four Pb atoms for the FCC structure) results in a = 1.43 wt% C. By increasing the system size to 2 × 2 × 2 (8 unit cells or 32 Pb atoms), the addition of one C atom results in a = 0.18 wt% C, which is closer to the lower range of the experimental limit reported in the literature. Therefore, this work focused on adding one C to Pb supercells of 1 × 1 × 1, 2 × 1 × 1, 2 × 2 × 1, and 2 × 2 × 2 where the numbers refer to the number of unit cells along the X-, Y-, and Z-axes, respectively. The at% of C () for these cases varied between 20% and ~3%, as shown in Table 1, as the supercell size increased from 1 × 1 × 1 to 2 × 2 × 2.
There are two different systems simulated in this study: (1) a pure Pb system without any C, and (2) a Pb system with one C. The pure Pb system was simulated to validate the computational approach, while the system with C was simulated to understand the stability of C in the Pb unit cell, the defect formation energy, and the diffusion barrier for movement of C in the Pb matrix.
3. Results and Discussion
3.1. Validation and Selection of Functional for Pb
The crystal structure of Pb shows an symmetry with an experimentally measured unit cell length of 4.9508 Å [46] (Figure S2). Both LDA and GGA-PBE functionals have been used to examine crystalline Pb in the literature, where LDA calculations underestimated the lattice parameter while GGA calculations overestimated the lattice parameter [47,48,49,50]. Prior to examining the structural prediction by different functionals, the convergence tests on both the plane-wave cutoff energy and k-point mesh were performed with the GGA-PBE (details are included in Supplementary Section S2). After establishing convergence, a full optimization (atom position, cell shape, and cell volume) of the 1 × 1 × 1 supercell with a 9 × 9 × 9 k-point mesh (corresponding to 0.24 × 0.24 × 0.24 per Å actual k-spacing) was performed. Various density functionals (LDA [51,52], GGA-PBE [53], GGA-AM05 [54], GGA-PBESol [55], GGA-rPBE [56], and GGA-BLYP [57]) and hybrid functionals (PBE0 [58,59] and HSE06 [60] with GGA-PBE) were used to compute the ground state lattice parameter of Pb. Table 2 shows the output we obtained from these simulations. The LDA functional underestimated the lattice parameter by 1.4%. This is similar to the previously reported lattice parameters of Pb predicted using LDA and a tight binding [47] approach. Our GGA-PBE functional calculation overestimated the lattice parameter by 1.6%, which is consistent with the previous DFT predictions at the same level of theory [48,49,50]. A much closer prediction of structural details of Pb (lattice parameter within ± 0.5%) was obtained with the GGA-AM05, GGA-PBESol, and both of the hybrid functionals (HSE06 and PBE0), while the GGA-rPBE and GGA-BLYP functionals overestimated the lattice parameter by 3.0% and 4.5%, respectively.
Along with the lattice parameter, elastic constants and bulk modulus values were evaluated for each of the potentials using 11 × 11 × 11 k-points with a strain of 0.5%. The mechanical property calculations were performed within the MedeA-MT module [43], where the atomic position in the strained lattice was optimized until the Hellmann–Feynman force on each atom was less than 0.01 eV/Å. Table 2 includes the computed elastic constants and bulk modulus values for each case. The elastic constants from experimental studies were reported to be 55.54 GPa, 45.42 GPa, and 19.42 GPa for C11, C12, and C44, respectively, at 0 K, while they were 47.65 GPa, 40.28 GPa, and 14.41 GPa for C11, C12, and C44, respectively, at room temperature (RT) [62]. The bulk modulus [(C11 + 2C12)/3] for these temperatures was estimated to be 48.79 GPa and 42.73 GPa at 0 K and RT, respectively. From the individual elastic stiffness values evaluated for each functional, GGA-AM05 and the HSE06 and PBE0 hybrid functionals predicted C44 to be negative; this indicates that the structure of Pb is unstable using these functionals. For the remaining cases, the LDA functional predicted the elastic constants as being very close to the experimental value at 0 K, where the errors in C11, C12, and C44 were 4.5%, −1.7%, and −2.6%, respectively. The GGA-PBE functional predictions underestimated these values by 17.1–25.1%. A tighter range of underestimation was observed for GGA-PBESol—between 3.0 and 10.6%. Both GGA-rPBE and GGA-BLYP underestimated the elastic properties by between 26.4 and 47.1% in comparison to experimental values referring to 0 K.
Since most of the experimental measurements were performed at room temperature, we also compared our computational predictions against the experimental elastic constants at RT. The comparison shows that the LDA functional overestimated the elastic constants by 21.8%, 10.9%, and 31.3% for C11, C12, and C44, respectively. The GGA-PBE functional underestimated the C11 and C12 stiffness values by 3.4% and 15.5%, respectively, while it overestimated the C44 constant by 8.2%. The GGA-PBESol functional predicted C12 to be within 1% of the experimental value; however, it overestimated C11 and C44 by 13.1% and 17.4%, respectively. GGA-rPBE and GGA-BLYP underestimated the elastic constants much more compared to the GGA-PBE functional.
Therefore, by comparing the structural and mechanical properties estimated, we neglected GGA-rPBE and GGA-BLYP, as these two overestimated the lattice parameter the most compared to the other functionals. Based on the negative C44 values, we eliminated GGA-AM05, HSE06, and PBE0 from further consideration. Out of LDA, GGA-PBE, and GGA-PBESol, GGA-PBESol predicted the lattice parameter closest to the experimental value, while the elastic constants were closer to the 0 K values. As our primary focus was to compare our predictions against experimental values at finite temperatures, we considered GGA-PBE for rest of the studies, as the GGA-PBE functional performed the best in predicting the mechanical properties at room temperature compared to the LDA and GGA-PBESol functionals.
After establishing the functional, we confirmed the metallic character of Pb by analyzing the band structure and density of states (DOS) (Figure S4). A closer look at the partial DOS shows that the metallic characteristics are predominantly dominated by the outermost p-orbitals (valence electrons for Pb are taken as 5 6 6 with the pseudopotential). After examining the pure Pb matrix, the next step was to incorporate C into the Pb matrix.
3.2. Carbon Placement in the Pb Matrix
Based on the discussion above, we added one C atom to the Pb matrix by systematically increasing the supercell size from 1 × 1 × 1 to 2 × 1 × 1, 2 × 2 × 1, and 2 × 2 × 2, representing a C concentration of Cc = 1.43 wt% − 0.18 wt%, as shown in Table 1. This matches the experimental C range in Pb–C batteries, and represents a complete incorporation of C into the Pb matrix [22]. While the number of C atoms in the Pb matrix is kept in the experimental range, the placement of C in the Pb matrix is not clear from the experimental studies. Therefore, we performed a structural stability test by placing C at different interstitial and substitutional sites. The results on the structural stability of C are presented based on the 2 × 2 × 2 supercell size.
Initially, we examined the total energy of the system for the C atom sitting at an interstitial site, i.e., either at the octahedral site () or at the tetrahedral site () in the Pb matrix (Figure 2). A self-consistent field (SCF) calculation while keeping the cell shape and volume fixed resulted in being more favorable than for the 2 × 2 × 2 supercell with one C atom:
where is the total energy of the 2 × 2 × 2 Pb supercell with one C in the octahedral site, and is the total energy of the 2 × 2 × 2 Pb supercell with one C in the tetrahedral site. The results shown in Equation (1) confirm that the C atoms prefer to sit at the octahedral site, which is similar to the placement of C in the γ-Fe matrix (FCC structure) [63].
After establishing the interstitial site stability for C atoms in the Pb matrix, we also performed a stability check between the interstitial and substitutional sites for C. In order to complete this comparison, we prepared the substitutional site by replacing one Pb atom randomly in the 2 × 2 × 2 supercell with a C atom. Therefore, there is a mismatch between the total number of atoms in the supercells for the interstitial (32 Pb atoms + 1 C atom) and substitutional (31 Pb atom + 1 C atom) cases. The comparison of energy requires the calculation of energy per Pb atom. The energy of each Pb atom () was obtained from the 2 × 2 × 2 supercell without any C in the structure. The two energies compared were as follows:
(1) for the interstitial case:
and (2) for the substitutional case
where is the total energy of the 2 × 2 × 2 supercell with one C in the octahedral site, and is the total energy of the 2 × 2 × 2 supercell with one C in the substitutional site. The difference in energies between Equation (2) and Equation (3) or for the 2 × 2 × 2 system size was −2.078 eV (−0.065 eV/atom). This analysis confirms that the interstitial site is preferred over the substitutional site for C in the Pb matrix. It is important to point out that the absolute difference in energy reported here for the two sites depends on the supercell size.
3.3. Activation Barrier for C Diffusion in the Pb Matrix
The performance of NAM in LA batteries is improved by the addition of C to the Pb matrix. Since we are considering the incorporation of C in the Pb matrix (Figure S1), diffusion on C in the Pb electrode will be ideal to tackle sulfation issues at different locations of the NAM. In this section, we attempted to estimate the different migration barriers for C movement in the Pb lattice. All of the calculations in this section were completed using the transition state search (TSS) module within MedeA. The climbing-image nudged elastic band (CI-NEB) [64] approach was used to map the minimum energy pathway between the initial and final configurations. We used a similar computational setting for this part of the examination using the 2 × 2 × 2 supercell, where a 500 eV cutoff energy was used with 3 × 3 × 3 (corresponding to an actual k-spacing of 0.24 × 0.24 × 0.24/Å) k-points. The SCF convergence was set to be 10−6 eV, and the atomic relaxation was achieved until the force on each atom was 0.02 eV/Å. For all of the combinations simulated, a total of nine images were taken along the unidirectional search path, with a spring constant of 5 eV/Å2. The CI-NEB method made sure to estimate the saddle points as the highest points during the migration barrier calculation.
From the structural stability calculations shown in Section 3.2, we performed the CI-NEB transition state search for C moving from one octahedral site to another adjacent octahedral site within the 2 × 2 × 2 supercell (referred to as ). Figure 3 shows all of the migration barriers estimated in this study. Figure 3a shows the calculated energies for the initial, final, and other images in between for the transition. The migration profile shows the same initial and final energy (confirming the equivalent initial and final configuration of C in the octahedral site), with a saddle point midway along the transition path. The migration barrier for was evaluated to be 4.36 eV, which is significantly higher. A similar TSS was completed for the pathway (Figure 3b). The transition state profile was similar to the transition with a migration barrier of 3.95 eV. Our calculations suggest that direct movement of C from one interstitial position to the adjacent interstitial position with the same configuration is associated with very large migration barriers.
In order to explore other possibilities, we examined the linear transition state search with the initial octahedral to final tetrahedral position, and vice versa. Figure 3c,d provide the CI-NEB energy estimation for and diffusion within the Pb matrix. The asymmetry in the initial and final energies was obvious between the octahedral and tetrahedral positions for the two combinations. For the transition, the energy barrier was estimated to be 1.24 eV, while a relatively smaller barrier of 0.82 eV was predicted for C diffusion from the tetrahedral site to the octahedral site, as the absolute energy of the structure with C in the tetrahedral coordinates was higher than for the corresponding octahedral site. Figure S5 in the Supplementary Materials highlights the migration barriers, with data points estimated along the diffusion pathway for each image, and for the climbing image if present.
As established in Section 3.2, is the most stable structural configuration of C in the Pb FCC matrix. It is expected that C will diffuse from one octahedral position to other octahedral positions to remain in the minimum energy configuration. Based on our migration barrier calculations, we expect that the diffusion pathway should include a tetrahedral site to complete the diffusion in two steps. Figure 4 represents the proposed pathway for C diffusion in the Pb matrix, where the octahedral-to-octahedral site migration is assisted by an intermediate tetrahedral position, i.e., is the preferred migration pathway. Thus, the minimum energy pathway for C migration is proposed to be , where the total energy barrier is 1.24 eV + 0.82 eV; when calculating the percentage difference, it is noted to be ~52% of the migration barrier (3.95 eV) and ~47% of the 4.36 eV barrier for the direct migration. A similar octahedral–tetrahedral–octahedral diffusion pathway has been reported for Li migration in Li-ion batteries [65,66].
4. Conclusions
In this study, we used first-principles calculations to examine the structural stability, defect formation energy, and migration barrier of C in Pb for LA batteries. Our analysis of lattice parameters and elastic constants at room temperature for a pure Pb matrix led to the selection of GGA-PBE functionals in comparison to seven other functionals for examining the Pb–C system within density functional theory. A comparison of system energies of C at different locations within the Pb matrix resulted in the octahedral interstitial site () being more favorable than the remaining interstitial and substitutional sites. In addition to the structural stability, we performed CI-NEB calculations to find the migration barriers between different interstitial sites. Our results predict that C will diffuse from one to another site through an intermediate position (). The overall activation energy required is less than for a direct or similar tetrahedral to tetrahedral migration. With the current understanding of the Pb–C system, future investigation of this system will establish the impact of defects on the structural and electronic properties of Pb–C electrodes. Additionally, the impact of C on the stability of PbSO4 on Pb surfaces will be part of future work examining sulfation in the presence of C using computational methods.
Supplementary Materials
The following supporting information can be downloaded at https://www.mdpi.com/article/10.3390/solids3020012/s1: Supporting material consisting of additional data from this work has been included in the supplementary document. Reference [67] is cited in the Supplementary Materials
Author Contributions
K.Y.: Conceptualization, Writing—Original Draft Preparation, Formal Analysis; R.K.B.: Methodology, Review and Editing, Resources; A.D.—Review, Funding Acquisition; N.G.—Review and Editing, Supervision. All authors have read and agreed to the published version of the manuscript.
Funding
This research was funded in whole or part by USAID and NAS through subaward 2000010558. A part of this work is also based upon work supported by the Science, Technology, and Innovation Funding Authority (STDF) under grant (EG US project ID 42692) to Atef Daoud in Egypt.
Institutional Review Board Statement
Not applicable.
Data Availability Statement
The data that support the findings of this study are available within the article and its Supplementary Materials.
Acknowledgments
This article is derived from the subject data funded in whole or part by USAID and NAS through subaward 2000010558. A part of this work is also based upon work supported by the Science, Technology, and Innovation Funding Authority (STDF) under grant (EG US project ID 42692) to Atef Daoud in Egypt. Any opinions, findings, conclusions, or recommendations expressed in this article are those of the authors alone, and do not necessarily reflect the views of USAID, NAS, or STDF.
Conflicts of Interest
Authors declare no conflict of interest.
References
- Grothoff, J.M. Battery storage for renewables: Market status and technology outlook. Int. Renew. Energy Agency Abu Dhabi 2015, 32, 6–10. [Google Scholar]
- Gaddam, R.R.; Katzenmeier, L.; Lamprecht, X.; Bandarenka, A.S. Review on physical impedance models in modern battery research. Phys. Chem. Chem. Phys. 2021, 23, 12926–12944. [Google Scholar] [CrossRef] [PubMed]
- Grand View Research. Battery Market Size, Share & Trends Analysis Report by Product (Lead Acid, Li-ion, Nickle Metal Hydride, Ni-cd), By Application (Automotive, Industrial, Portable), By Region, And Segment Forecasts, 2020–2027. Available online: https://www.grandviewresearch.com/industry-analysis/battery-market (accessed on 12 December 2020).
- Tran, M.-K.; DaCosta, A.; Mevawalla, A.; Panchal, S.; Fowler, M. Comparative Study of Equivalent Circuit Models Performance in Four Common Lithium-Ion Batteries: LFP, NMC, LMO, NCA. Batteries 2021, 7, 51. [Google Scholar] [CrossRef]
- Samanta, B.K.; Samanta, H.; Deb, N.K.; Saha, H. Battery Storage Technologies: A Review. Intell. Electr. Syst. 2021, 257–268. [Google Scholar]
- Armand, M.; Tarascon, J.-M. Building better batteries. Nature 2008, 451, 652–657. [Google Scholar] [CrossRef]
- Manthiram, A. A reflection on lithium-ion battery cathode chemistry. Nat. Commun. 2020, 11, 1550. [Google Scholar] [CrossRef]
- Keshan, H.; Thornburg, J.; Ustun, T.S. Comparison of lead-acid and lithium ion batteries for stationary storage in off-grid energy systems. In Proceedings of the 4th IET Clean Energy and Technology Conference (CEAT 2016), Kuala Lumpur, Malaysia, 14–15 November 2016. [Google Scholar]
- Podder, S.; Khan, M.Z.R. Comparison of lead acid and Li-ion battery in solar home system of Bangladesh. In Proceedings of the 5th International Conference on Informatics, Electronics and Vision (ICIEV), Dhaka, Bangladesh, 13–14 May 2016; pp. 434–438. [Google Scholar]
- Daoud, A.; Abou El-Khair, M.T.; Shenouda, A.Y.; Fairouz, F.; Mohamed, E.; Abdel Aziz, M.E.; Yanamandra, K.; Gupta, N. Novel Pb alloys based composite foams containing hybrid pores produced by liquid metallurgy for lightweight batteries. Int. J. Lightweight Mater. Manuf. 2022, 5, 44–57. [Google Scholar] [CrossRef]
- Daoud, A.; Abou El-Khair, M.T.; Shenouda, A.Y.; Fairouz, F.; Mohamed, E.; Abdel Aziz, M.E.; Yanamandra, K.; Gupta, N. Aging behavior and thermal expansion of novel Pb alloys reinforced with fly ash cenospheres composite foams. Int. J. Lightweight Mater. Manuf. 2022, 5, 178–187. [Google Scholar] [CrossRef]
- Pavlov, D.; Rogachev, T.; Nikolov, P.; Petkova, G. Mechanism of action of electrochemically active carbons on the processes that take place at the negative plates of lead-acid batteries. J. Power Sources 2009, 191, 58–75. [Google Scholar] [CrossRef]
- Pavlov, D.; Nikolov, P.; Rogachev, T. Influence of carbons on the structure of the negative active material of lead-acid batteries and on battery performance. J. Power Sources 2011, 196, 5155–5167. [Google Scholar] [CrossRef]
- Zhang, W.; Lin, H.; Lu, H.; Liu, D.; Yin, J.; Lin, Z. On the electrochemical origin of the enhanced charge acceptance of the lead–carbon electrode. J. Mater. Chem. A 2015, 3, 4399–4404. [Google Scholar] [CrossRef]
- Yang, H.; Qiu, Y.; Guo, X. Lead oxide/carbon black composites prepared with a new pyrolysis-pickling method and their effects on the high-rate partial-state-of-charge performance of lead-acid batteries. Electrochim. Acta 2017, 235, 409–421. [Google Scholar] [CrossRef]
- Yanamandra, K.; Pinisetty, D.; Daoud, A.; Gupta, N. Recycling of Li-Ion and Lead Acid Batteries: A Review. J. Indian Inst. Sci. 2022. [Google Scholar] [CrossRef]
- Pavlov, D.; Nikolov, P. Lead–carbon electrode with inhibitor of sulfation for lead-acid batteries operating in the HRPSoC duty. J. Electrochem. Soc. 2012, 159, A1215. [Google Scholar] [CrossRef]
- Xiang, J.; Ding, P.; Zhang, H.; Wu, X.; Chen, J.; Yang, Y. Beneficial effects of activated carbon additives on the performance of negative lead-acid battery electrode for high-rate partial-state-of-charge operation. J. Power Sources 2013, 241, 150–158. [Google Scholar] [CrossRef]
- Yin, J.; Lin, N.; Zhang, W.; Lin, Z.; Zhang, Z.; Wang, Y.; Shi, J.; Bao, J.; Lin, H. Highly reversible lead-carbon battery anode with lead grafting on the carbon surface. J. Energy Chem. 2018, 27, 1674–1683. [Google Scholar] [CrossRef] [Green Version]
- Zhang, W.-L.; Yin, J.; Lin, Z.-Q.; Shi, J.; Wang, C.; Liu, D.-B.; Wang, Y.; Bao, J.-P.; Lin, H.-B. Lead-carbon electrode designed for renewable energy storage with superior performance in partial state of charge operation. J. Power Sources 2017, 342, 183–191. [Google Scholar] [CrossRef]
- Moseley, P.T. Consequences of including carbon in the negative plates of Valve-regulated Lead–Acid batteries exposed to high-rate partial-state-of-charge operation. J. Power Sources 2009, 191, 134–138. [Google Scholar] [CrossRef]
- Pavlov, D.; Nikolov, P. Capacitive carbon and electrochemical lead electrode systems at the negative plates of lead–acid batteries and elementary processes on cycling. J. Power Sources 2013, 242, 380–399. [Google Scholar] [CrossRef]
- Fernández, M.; Valenciano, J.; Trinidad, F.; Muñoz, N. The use of activated carbon and graphite for the development of lead-acid batteries for hybrid vehicle applications. J. Power Sources 2010, 195, 4458–4469. [Google Scholar] [CrossRef]
- Saravanan, M.; Ganesan, M.; Ambalavanan, S. A modified lead-acid negative electrode for high-rate partial-state-of-charge applications. J. Electrochem. Soc. 2012, 159, A452. [Google Scholar] [CrossRef]
- Zou, X.; Kang, Z.; Shu, D.; Liao, Y.; Gong, Y.; He, C.; Hao, J.; Zhong, Y. Effects of carbon additives on the performance of negative electrode of lead-carbon battery. Electrochim. Acta 2015, 151, 89–98. [Google Scholar] [CrossRef]
- Kumar, S.M.; Ambalavanan, S.; Mayavan, S. Effect of graphene and carbon nanotubes on the negative active materials of lead acid batteries operating under high-rate partial-state-of-charge operation. RSC Adv. 2014, 4, 36517–36521. [Google Scholar] [CrossRef]
- Geetha, A.; Subramani, C. A comprehensive review on energy management strategies of hybrid energy storage system for electric vehicles. Int. J. Energy Res. 2017, 41, 1817–1834. [Google Scholar] [CrossRef]
- Zhu, J.; Hu, G.; Yue, X.; Wang, D. Study of graphene as a negative additive for valve-regulated lead-acid batteries working under high-rate partial-state-of-charge conditions. Int. J. Electrochem. Sci. 2016, 11, 700–709. [Google Scholar]
- Mahajan, V.; Bharj, R.S.; Bharj, J. Role of nano-carbon additives in lead-acid batteries: A review. Bull. Mater. Sci. 2019, 42, 21. [Google Scholar] [CrossRef] [Green Version]
- Saravanan, M.; Sennu, P.; Ganesan, M.; Ambalavanan, S. Multi-walled carbon nanotubes percolation network enhanced the performance of negative electrode for lead-acid battery. J. Electrochem. Soc. 2012, 160, A70. [Google Scholar] [CrossRef] [Green Version]
- Swogger, S.W.; Everill, P.; Dubey, D.; Sugumaran, N. Discrete carbon nanotubes increase lead acid battery charge acceptance and performance. J. Power Sources 2014, 261, 55–63. [Google Scholar] [CrossRef] [Green Version]
- Yin, J.; Lin, N.; Lin, Z.-Q.; Wang, Y.; Shi, J.; Bao, J.-P.; Lin, H.-B.; Feng, S.-H.; Zhang, W.-L. Towards renewable energy storage: Understanding the roles of rice husk-based hierarchical porous carbon in the negative electrode of lead-carbon battery. J. Energy Storage 2019, 24, 100756. [Google Scholar] [CrossRef]
- Liu, D.; Zhang, W.; Lin, H.; Li, Y.; Lu, H.; Wang, Y. A green technology for the preparation of high capacitance rice husk-based activated carbon. J. Clean. Prod. 2016, 112, 1190–1198. [Google Scholar] [CrossRef]
- Åvall, G.; Mindemark, J.; Brandell, D.; Johansson, P. Sodium-Ion Battery Electrolytes: Modeling and Simulations. Adv. Energy Mater. 2018, 8, 1703036. [Google Scholar] [CrossRef]
- Bai, Q.; Yang, L.; Chen, H.; Mo, Y. Computational studies of electrode materials in sodium-ion batteries. Adv. Energy Mater. 2018, 8, 1702998. [Google Scholar] [CrossRef]
- Chen, X.; Hou, T.; Persson, K.A.; Zhang, Q. Combining theory and experiment in lithium–sulfur batteries: Current progress and future perspectives. Mater. Today 2019, 22, 142–158. [Google Scholar] [CrossRef]
- Chakraborty, S.; Banerjee, A.; Watcharatharapong, T.; Araujo, R.B.; Ahuja, R. Current computational trends in polyanionic cathode materials for Li and Na batteries. J. Phys. Condens. Matter 2018, 30, 283003. [Google Scholar] [CrossRef]
- Wasalathilake, K.C.; Ayoko, G.A.; Yan, C. Effects of heteroatom doping on the performance of graphene in sodium-ion batteries: A density functional theory investigation. Carbon 2018, 140, 276–285. [Google Scholar] [CrossRef]
- Lee, H.W.; Moon, H.S.; Hur, J.; Kim, I.T.; Park, M.S.; Yun, J.M.; Kim, K.H.; Lee, S.G. Mechanism of sodium adsorption on N-doped graphene nanoribbons for sodium ion battery applications: A density functional theory approach. Carbon 2017, 119, 492–501. [Google Scholar] [CrossRef]
- Sulzer, V.; Chapman, S.J.; Please, C.P.; Howey, D.A.; Monroe, C.W. Faster Lead-Acid Battery Simulations from Porous-Electrode Theory: Part I. Physical Model. J. Electrochem. Soc. 2019, 166, A2363–A2371. [Google Scholar] [CrossRef]
- Kresse, G.; Furthmüller, J. Efficient iterative schemes for ab initio total-energy calculations using a plane-wave basis set. Phys. Rev. B 1996, 54, 11169–11186. [Google Scholar] [CrossRef] [PubMed]
- Kresse, G.; Joubert, D. From ultrasoft pseudopotentials to the projector augmented-wave method. Phys. Rev. B 1999, 59, 1758–1775. [Google Scholar] [CrossRef]
- Materials Design Inc. MedeA Version 3.0; MedeA is a Registered Trademark of Materials Design; MedeA: San Diego, CA, USA, 2022; Available online: https://www.materialsdesign.com/medea-software (accessed on 24 January 2022).
- Perdew, J.P.; Burke, K.; Ernzerhof, M. Phys rev lett 77: 3865. Errata 1996, 78, 1396. [Google Scholar]
- Monkhorst, H.J.; Pack, J.D. Special points for Brillouin-zone integrations. Phys. Rev. B 1976, 13, 5188–5192. [Google Scholar] [CrossRef]
- Walker, G.; Marezio, M. Lattice parameters and zone overlap in solid solutions of lead in magnesium. Acta Metall. 1959, 7, 769–773. [Google Scholar] [CrossRef]
- Papaconstantopoulos, D.A.; Mehl, M.J. Tight-Binding Method in Electronic Structure. In Encyclopedia of Condensed Matter Physics; Bassani, F., Liedl, G.L., Wyder, P., Eds.; Elsevier: Oxford, UK, 2005; pp. 194–206. [Google Scholar] [CrossRef]
- Lejaeghere, K.; Van Speybroeck, V.; Van Oost, G.; Cottenier, S. Error Estimates for Solid-State Density-Functional Theory Predictions: An Overview by Means of the Ground-State Elemental Crystals. Crit. Rev. Solid State Mater. Sci. 2014, 39, 1–24. [Google Scholar] [CrossRef] [Green Version]
- Shang, S.L.; Saengdeejing, A.; Mei, Z.G.; Kim, D.E.; Zhang, H.; Ganeshan, S.; Wang, Y.; Liu, Z.K. First-principles calculations of pure elements: Equations of state and elastic stiffness constants. Comput. Mater. Sci. 2010, 48, 813–826. [Google Scholar] [CrossRef]
- The Materials Project. Materials Explorer—Pb. Available online: https://next-gen.materialsproject.org/materials/mp-20483/# (accessed on 24 January 2022).
- Perdew, J.P.; Zunger, A. Self-interaction correction to density-functional approximations for many-electron systems. Phys. Rev. B 1981, 23, 5048. [Google Scholar] [CrossRef] [Green Version]
- Ceperley, D.M.; Alder, B.J. Ground state of the electron gas by a stochastic method. Phys. Rev. Lett. 1980, 45, 566. [Google Scholar] [CrossRef] [Green Version]
- Perdew, J.P.; Burke, K.; Ernzerhof, M. Generalized gradient approximation made simple. Phys. Rev. Lett. 1996, 77, 3865. [Google Scholar] [CrossRef] [PubMed] [Green Version]
- Armiento, R.; Mattsson, A.E. Functional designed to include surface effects in self-consistent density functional theory. Phys. Rev. B 2005, 72, 085108. [Google Scholar] [CrossRef] [Green Version]
- Perdew, J.P.; Ruzsinszky, A.; Csonka, G.I.; Vydrov, O.A.; Scuseria, G.E.; Constantin, L.A.; Zhou, X.; Burke, K. Restoring the density-gradient expansion for exchange in solids and surfaces. Phys. Rev. Lett. 2008, 100, 136406. [Google Scholar] [CrossRef] [Green Version]
- Hammer, B.; Hansen, L.B.; Nørskov, J.K. Improved adsorption energetics within density-functional theory using revised Perdew-Burke-Ernzerhof functionals. Phys. Rev. B 1999, 59, 7413. [Google Scholar] [CrossRef] [Green Version]
- Becke, A.D. Density-functional exchange-energy approximation with correct asymptotic behavior. Phys. Rev. A 1988, 38, 3098. [Google Scholar] [CrossRef]
- Ernzerhof, M.; Scuseria, G.E. Assessment of the Perdew–Burke–Ernzerhof exchange-correlation functional. J. Chem. Phys. 1999, 110, 5029–5036. [Google Scholar] [CrossRef] [Green Version]
- Adamo, C.; Barone, V. Toward reliable density functional methods without adjustable parameters: The PBE0 model. J. Chem. Phys. 1999, 110, 6158–6170. [Google Scholar] [CrossRef]
- Heyd, J.; Scuseria, G.E.; Ernzerhof, M. Hybrid functionals based on a screened Coulomb potential. J. Chem. Phys. 2003, 118, 8207–8215. [Google Scholar] [CrossRef] [Green Version]
- Villars, P.; Daams, J.L.C. Atomic-environment classification of the chemical elements. J. Alloys Compd. 1993, 197, 177–196. [Google Scholar] [CrossRef]
- Simmons, G. Single Crystal Elastic Constants and Calculated Aggregate Properties; Southern Methodist University: Dallas, TX, USA, 1965. [Google Scholar]
- Jiang, D.E.; Carter, E.A. Carbon dissolution and diffusion in ferrite and austenite from first principles. Phys. Rev. B 2003, 67, 214103. [Google Scholar] [CrossRef] [Green Version]
- Henkelman, G.; Uberuaga, B.P.; Jónsson, H. A climbing image nudged elastic band method for finding saddle points and minimum energy paths. J. Chem. Phys. 2000, 113, 9901–9904. [Google Scholar] [CrossRef] [Green Version]
- Urban, A.; Seo, D.-H.; Ceder, G. Computational understanding of Li-ion batteries. Npj Comput. Mater. 2016, 2, 16002. [Google Scholar] [CrossRef]
- Van der Ven, A.; Bhattacharya, J.; Belak, A.A. Understanding Li Diffusion in Li-Intercalation Compounds. Acc. Chem. Res. 2013, 46, 1216–1225. [Google Scholar] [CrossRef]
- Yang, J.; Hu, C.; Wang, H.; Yang, K.; Liu, J.B.; Yan, H. Review on the Research of Failure Modes and Mechanism for Lead–Acid Batteries. Int. J. Energy Res. 2017, 41, 336–352. [Google Scholar] [CrossRef]
Figure 1.
Estimated market share of different batteries in the year 2019 (USD in billions, % market share). Adapted from [16].
Figure 1.
Estimated market share of different batteries in the year 2019 (USD in billions, % market share). Adapted from [16].
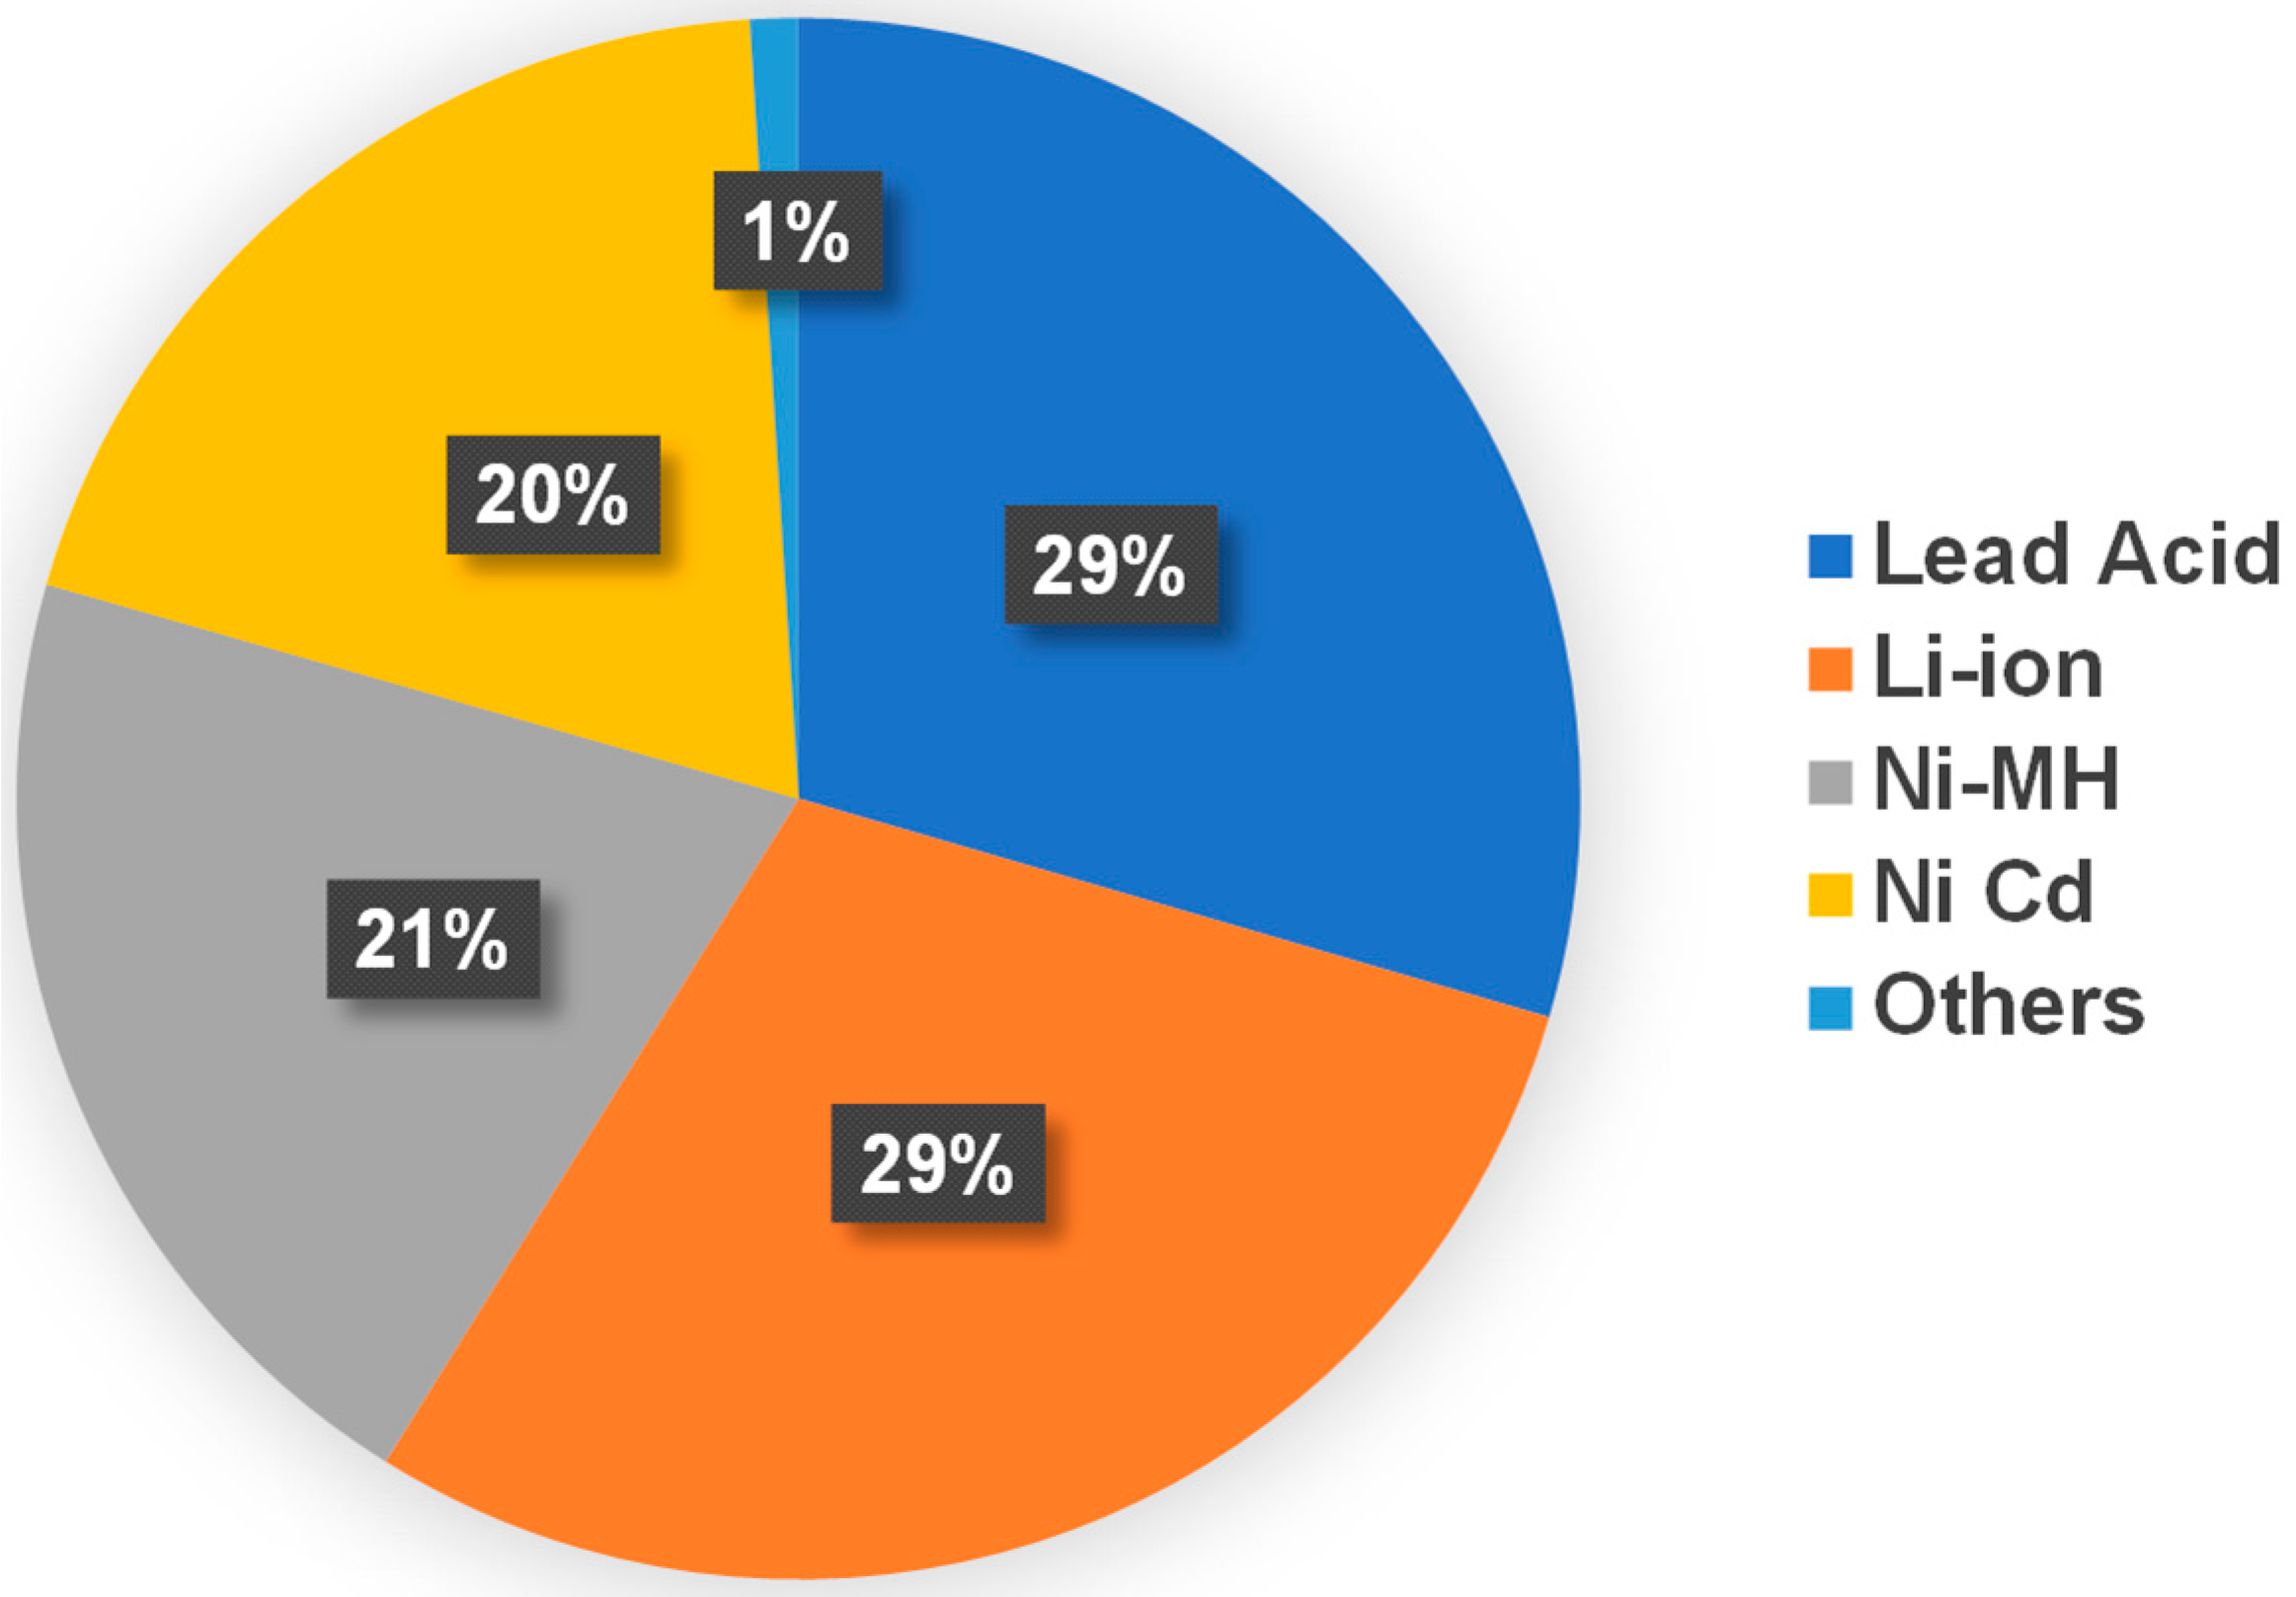
Figure 2.
Schematic of a unit cell of Pb (FCC) showing C at (a) an octahedral interstitial site, and (b) a tetrahedral interstitial site.
Figure 2.
Schematic of a unit cell of Pb (FCC) showing C at (a) an octahedral interstitial site, and (b) a tetrahedral interstitial site.

Figure 3.
Calculated activation energy for diffusion of carbon in a Pb matrix moving from (a) , (b) , (c), and (d) sites (note: Y-axes in the figure are not to the same scale).
Figure 3.
Calculated activation energy for diffusion of carbon in a Pb matrix moving from (a) , (b) , (c), and (d) sites (note: Y-axes in the figure are not to the same scale).
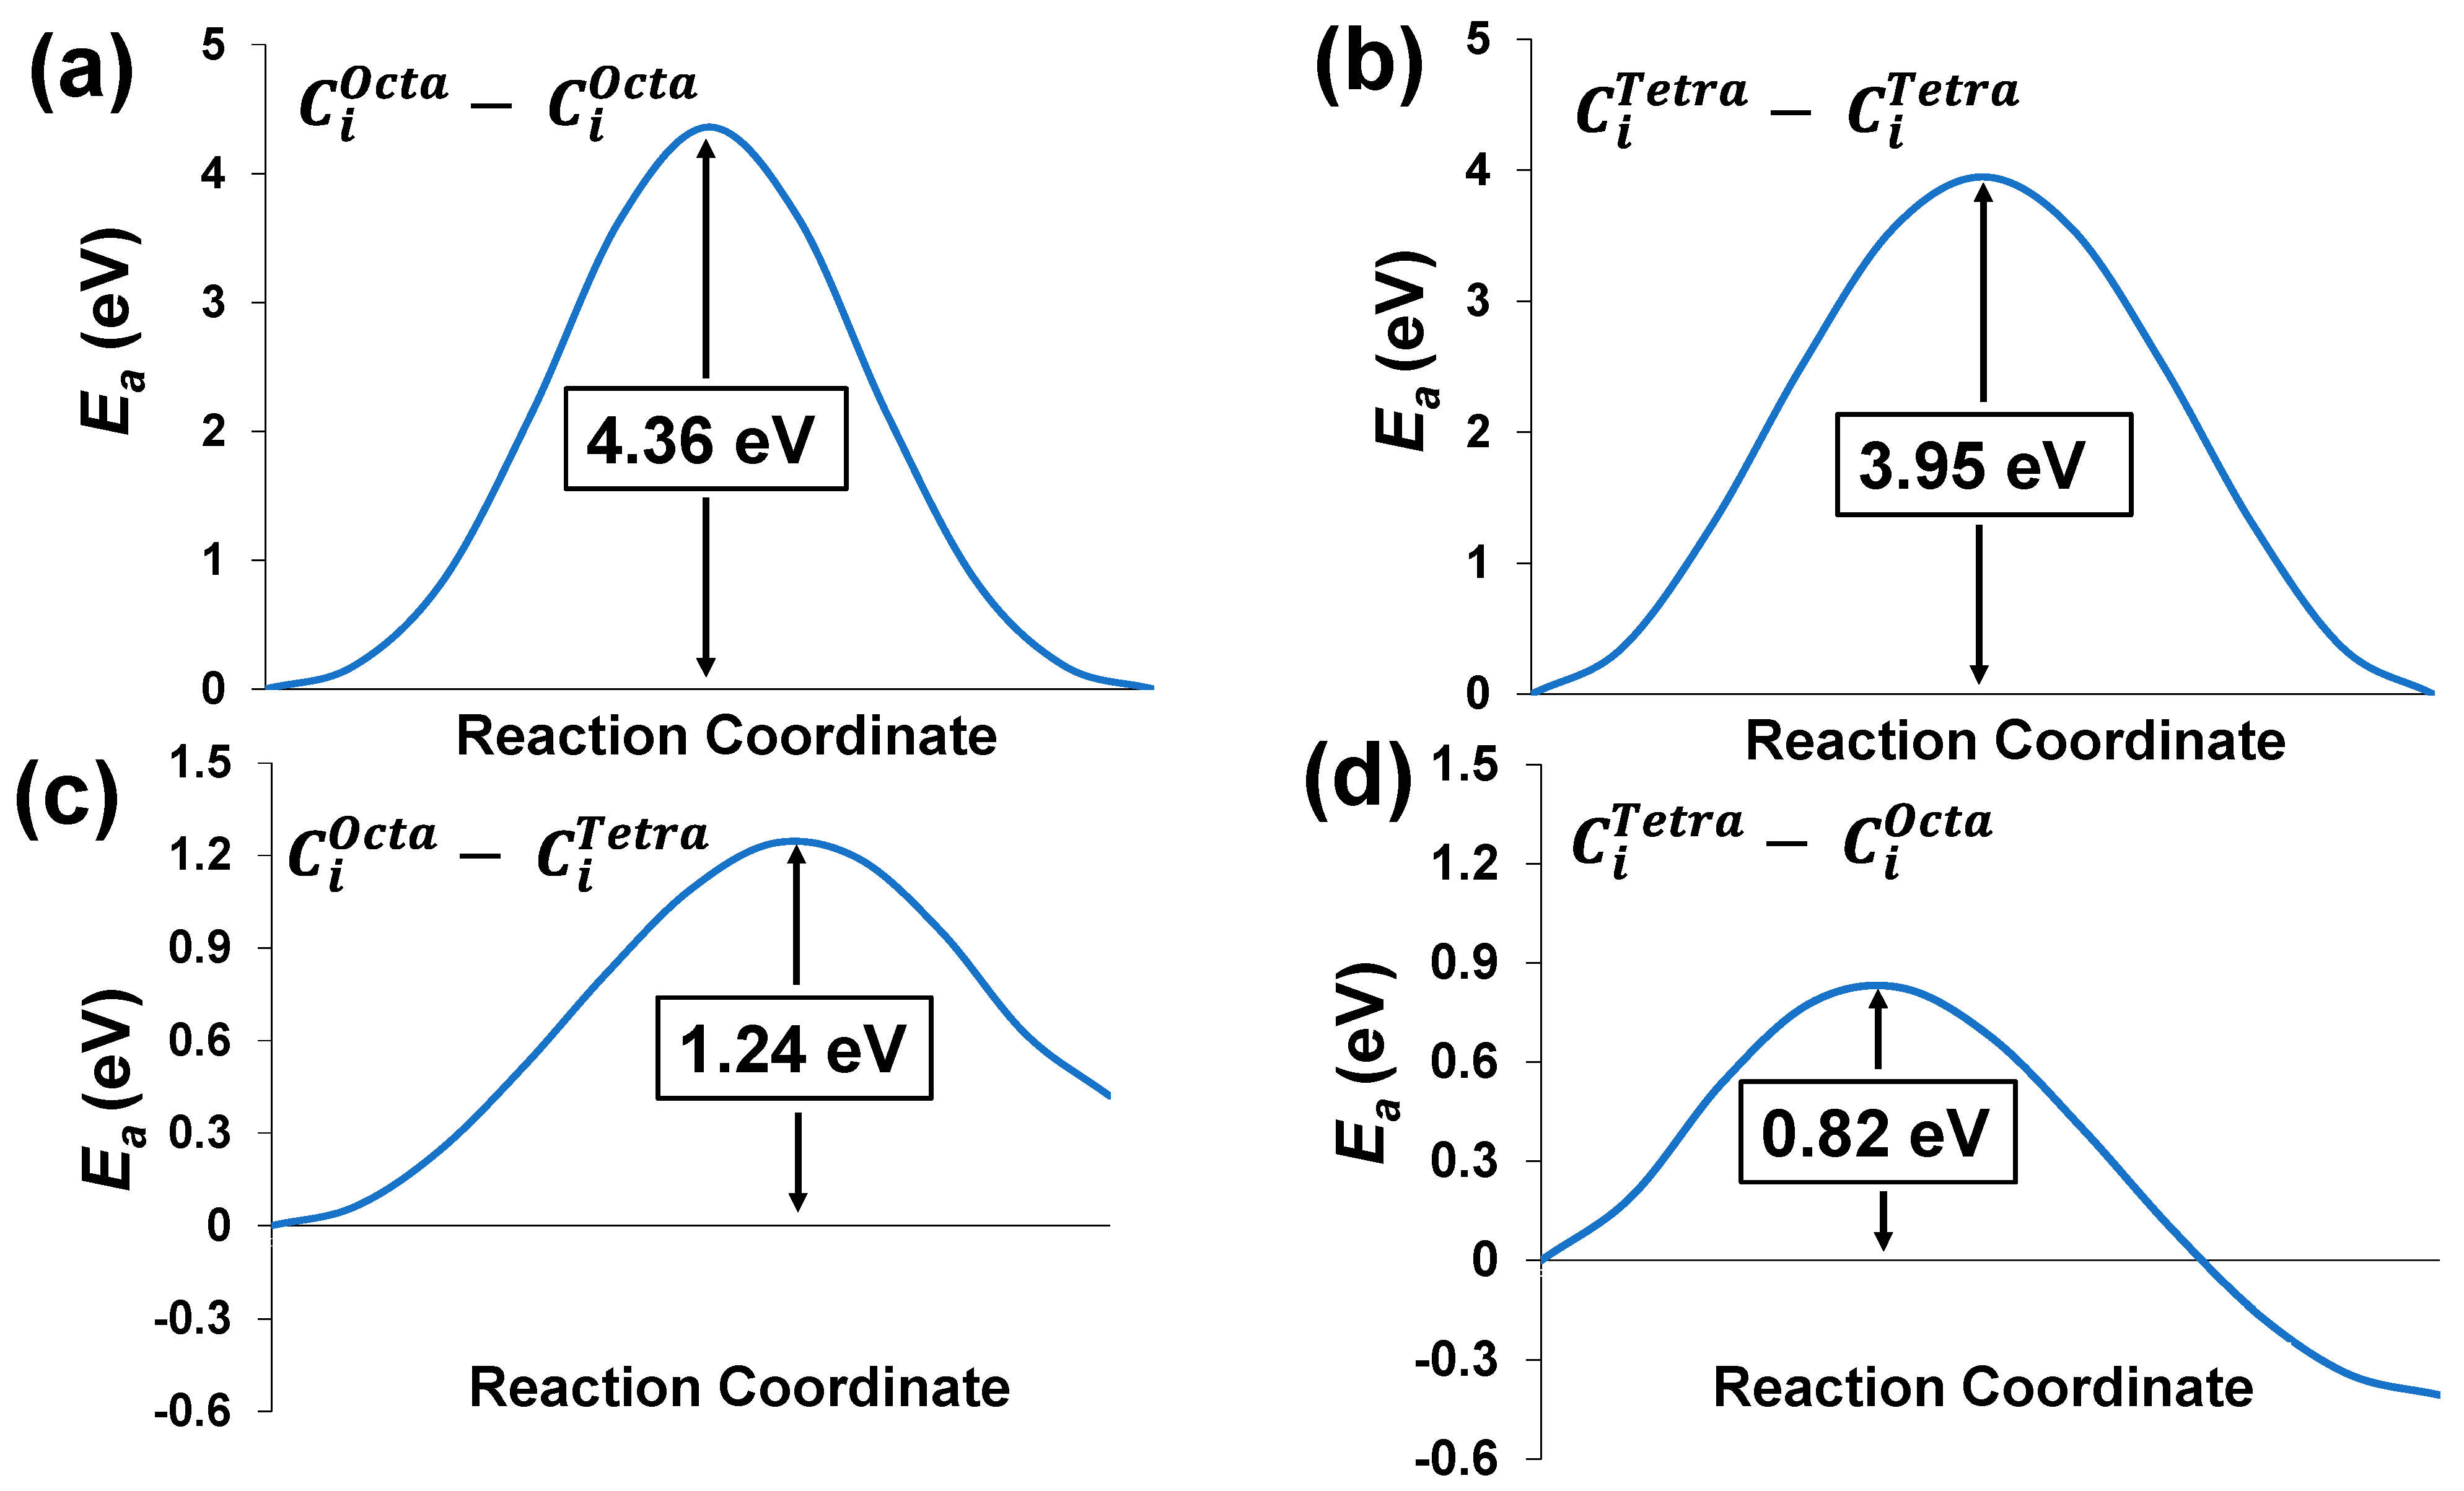
Figure 4.
The predicted diffusion pathway of C in the Pb matrix from an initial octahedral position, to an intermediate tetrahedral position, to a final octahedral position, i.e., .
Figure 4.
The predicted diffusion pathway of C in the Pb matrix from an initial octahedral position, to an intermediate tetrahedral position, to a final octahedral position, i.e., .


Table 1.
Estimation of at% and wt% of C in different Pb supercell sizes simulated.
| Supercell Size (X × Y × Z) | Number of Pb Atoms | Number of C Atoms | at% of C in the Supercell | wt% of C in the Supercell |
|---|---|---|---|---|
| 1 × 1 × 1 | 4 | 1 | 20.00 | 1.43 |
| 2 × 1 × 1 | 8 | 1 | 11.11 | 0.72 |
| 2 × 2 × 1 | 16 | 1 | 5.88 | 0.36 |
| 2 × 2 × 2 | 32 | 1 | 3.03 | 0.18 |
Table 2.
Lattice parameter and mechanical properties estimated for pure Pb using various density functionals and hybrid functionals.
Table 2.
Lattice parameter and mechanical properties estimated for pure Pb using various density functionals and hybrid functionals.
| Data Source | Crystal Structure Related | Elastic Stiffness (Cij) and Bulk Modulus (B) | |||||
|---|---|---|---|---|---|---|---|
| a (Å) | α (°) | Volume (Å3) | C11 (GPa) | C12 (GPa) | C44 (GPa) | B (GPa) | |
| Experiment | 4.9508 | 90.00 | 121.36 | 55.54 # 47.65 † | 45.42 # 40.28 † | 19.42 # 14.41 † | 48.79 #,* 42.73 †,* |
| LDA | 4.8798 | 90.00 | 116.20 | 58.03 | 44.67 | 18.92 | 49.12 |
| GGA-PBE | 5.0319 | 90.00 | 127.41 | 46.04 | 34.04 | 15.59 | 38.04 |
| GGA-AM05 | 4.9360 | 90.00 | 120.26 | 53.45 | 43.33 | −17.46 | 46.70 |
| GGA-PBESol | 4.9265 | 90.00 | 119.57 | 53.88 | 40.61 | 18.36 | 45.03 |
| GGA-rPBE | 5.0987 | 90.00 | 132.55 | 40.86 | 29.42 | 14.05 | 33.23 |
| GGA-BLYP | 5.1730 | 90.00 | 138.43 | 36.77 | 27.55 | 10.46 | 30.62 |
| HSE06 | 4.9645 | 90.00 | 122.36 | 42.25 | 34.15 | −16.25 | 36.85 |
| PBE0 | 4.9598 | 90.00 | 122.01 | 43.83 | 34.11 | −15.77 | 37.35 |
# Stiffness values at 0 K. † Stiffness values at room temperature. * Estimated bulk modulus using (C11 + 2C12)/3.
Publisher’s Note: MDPI stays neutral with regard to jurisdictional claims in published maps and institutional affiliations. |
© 2022 by the authors. Licensee MDPI, Basel, Switzerland. This article is an open access article distributed under the terms and conditions of the Creative Commons Attribution (CC BY) license (https://creativecommons.org/licenses/by/4.0/).
Share and Cite
MDPI and ACS Style
Yanamandra, K.; Behera, R.K.; Daoud, A.; Gupta, N. Migration Barrier Estimation of Carbon in Lead for Lead–Acid Battery Applications: A Density Functional Theory Approach. Solids 2022, 3, 177-187. https://doi.org/10.3390/solids3020012
AMA Style
Yanamandra K, Behera RK, Daoud A, Gupta N. Migration Barrier Estimation of Carbon in Lead for Lead–Acid Battery Applications: A Density Functional Theory Approach. Solids. 2022; 3(2):177-187. https://doi.org/10.3390/solids3020012
Chicago/Turabian StyleYanamandra, Kaushik, Rakesh K. Behera, Atef Daoud, and Nikhil Gupta. 2022. "Migration Barrier Estimation of Carbon in Lead for Lead–Acid Battery Applications: A Density Functional Theory Approach" Solids 3, no. 2: 177-187. https://doi.org/10.3390/solids3020012