
Integrated Artificial Neural Network and Discrete Event Simulation Framework for Regional Development of Refractory Gold Systems


1
Department of Mining and Materials Engineering, McGill University, 3610 University Street, Montreal, QC H3A 0C5, Canada
2
Corem, 1180 Rue de la Minéralogie, Québec, QC G1N 1X7, Canada
*
Author to whom correspondence should be addressed.
Mining 2022, 2(1), 123-154; https://doi.org/10.3390/mining2010008
Submission received: 8 February 2022
/
Revised: 4 March 2022
/
Accepted: 5 March 2022
/
Published: 8 March 2022
(This article belongs to the Topic Interdisciplinary Studies for Sustainable Mining)
Abstract
:Mining trends in the gold sector indicate a growing imbalance in global supply and demand chains, especially in light of accelerated efforts towards industrial electrification and automation. As such, it is important that research and development continue to focus on processing options for more complex and refractory ores. Unlike conventional (i.e., free-milling) ore feeds, refractory gold is not amenable to standard cyanidation, and requires additional pretreatment prior to leaching and recovery. With recent technological advancements, such as sensor-based ore sorting, there is opportunity to advance the development of smaller untapped refractory resources with marginal economics, particularly those in proximity to processing infrastructure within major gold districts. However, it will be critical that the necessary tools are developed to capture the potential system-wide effects caused by varied ore feeds and improve related decision-making processes earlier in the value chain. Discrete event simulation (DES) is a powerful computational technique that can be used to monitor the interactions between important processes and parameters in response to random natural variations; the approach is thus suitable for the modelling of complex mining systems that deal with significant geological uncertainty. This work implements an integrated artificial neural network (ANN) and DES framework for the regional coordination of conventional and preconcentrated refractory gold ores to be processed at a centralized plant. Sample calculations are presented that are based on a generated dataset reflective of sediment-hosted refractory gold systems.
1. Introduction
The rate of new gold discoveries has decreased over the past three decades despite increased exploration spending amidst periods of record gold prices [1]. This is in part due to companies focusing on brownfields and advanced stage exploration prospects (i.e., known deposits). One must also consider that most of the near-surface high-grade gold deposits in easily accessible regions of the world have likely already been found. This notion is reflected in the severe lack of recent world-class gold discoveries, classified as those containing at least 100 metric tons (3.2 Moz) gold. Reports indicate that less than 10% of all gold identified since 1990 can be attributed to major discoveries made over the past decade [1]. Moreover, the average head grades for sizable primary gold deposits (>1 Moz Au) have plummeted from over 10 g/t Au in the 1970s [2,3] to less than 1.5 g/t Au at present [4]. This significant decrease, however, is partly driven by elevated gold prices and new technologies that have allowed for large-scale open-pit operations, both of which have made mining and processing of lower-grade material economically feasible.
Declining trends in rates, sizes and grades of gold discoveries mean that new mining projects being brought online are not replacing declining global reserves at today’s production levels. This assertion is only compounded by volatile market fluctuations, geopolitical and socio-environmental aspects and related administrative hurdles (e.g., permitting). As a result, mine development projects are now facing increased start-up timelines; the average length of time from discovery to commissioning more than doubled between 1995 and 2013 (from 8 to 18 years) and continues to increase [5]. While recycling of jewelry and electrical/electronic wastes (also known as e-wastes) will continue to play an increasing role in the supply of gold [6,7,8], the reality is that there could be significant imbalance in the supply and demand for gold in the relatively near future. As a result, research and development need to continue exploring options to process more complex and refractory ore types, and tools need to be made available that can improve the understanding of potential system-wide effects caused by varied ore feeds and related decision-making processes.
Gold ores can be classified based on their metallurgical response to different processing techniques. Conventional ores are typically considered “free-milling”, meaning they are amenable to direct cyanidation and recovery via carbon-in-pulp/carbon-in-leach processes [5]. Certain low-grade or oxide ores have similar characteristics but are only economic by heap leaching as gold tenors are insufficient to justify tank cyanidation. Conversely, refractory ores are not amenable to standard cyanidation practices (or sale of concentrate) and require additional pretreatment prior to leaching and recovery [5].
Refractory gold sources occur in a variety of geological environments but are most often linked to sediment-hosted deposits with a close association to As-rich sulfide minerals. Though found in many regions of the world, prime examples include the large, disseminated orebodies within the Carlin Trend of Nevada, U.S.A. and along the margins of the Yangtze craton in China. There are three main causes of refractory gold: (1) preg-robbing, which implies adsorption of gold cyanide complexes by carbonaceous material or other minerals in the ore, leading to gold losses that would otherwise bind to activated carbon in the pregnant leach solution [9,10]; (2) variably locked or encapsulated gold grains (i.e., inclusions) requiring further particle size reduction in order to liberate and expose the gold to the leaching solution [11]; (3) “invisible” gold, which can occur as submicron native particles () and/or structurally bound in solid solution () within host minerals, most commonly arsenian pyrite and arsenopyrite [12,13]. Some severely refractory ores can be afflicted by both preg-robbing and invisible gold and are thus called “double refractory”. The strong association of refractory gold with As-rich sulfides and arsenides (or tellurides, antimonides and selenides) also poses additional challenges due to elevated impurity levels and related environmental considerations.
There are a variety of processing options currently available for refractory gold, depending on the nature and level of refractoriness of the ore. Physically locked gold can be further liberated by fine or ultrafine mechanical grinding prior to leaching; however, the increased energy costs for this size reduction usually necessitate concentrated ore feeds (e.g., Kalgoorlie CGM, Australia) [11]. Oxidative processes are the most common approach to pretreating sulfidic refractory ores in the industry. Traditionally, high-temperature roasting was used to oxidize iron sulfides to hematite (), the porous nature of which allows for the penetration of leaching solutions [11]. Increased environmental awareness and regulations have since led many companies to shift focus to newer technologies due to concerns over off-gas (i.e., ) emissions and volatilization of impurities (e.g., ) caused by roasting. Pressure oxidation (POX) is now one of the main methods applied to improve recovery by oxidizing iron sulfides to ferric sulfate or other oxides, thereby exposing the gold for leaching [11]. Biological oxidation (BIOX) is another leading method, wherein bacteria catalyze the conversion of iron sulfides to soluble ferric iron and sulfur to sulfate and ultimately sulfuric acid [11,14]. Both POX and BIOX have limitations when treating carbonaceous sulfidic ores affected by preg-robbing; roasting thus remains the most effective pretreatment option for double refractory ores [11]. However, research and development are highly active in this area and new processes continue to emerge, such as oxidation followed by thiosulfate leaching, the first commercial installation of which was commissioned at Nevada Gold Mines’ Goldstrike deposit in 2014 [5,11].
Regardless of the processing route, refractory ores contribute significantly to world gold production; for instance, estimates have shown refractory ore sources to generate on the order of 25% of the global production [5]. Moreover, refractory gold currently accounts for ~24% of classified ore reserves and ~22% of known resources worldwide [15]. However, the processing of refractory ore requires large capital investments with increased operating costs, often making substantially sizable operations an absolute must. The required installation of infrastructure and equipment to pretreat the ore presents significant cost barriers to smaller mining projects or companies with less financial liquidity. To this end, there are many companies evaluating newer preconcentration developments in order to improve mining projects valuation.
In particular, sensor-based ore sorting has gained considerable interest in the mining space over the past two decades with many pilot plants and full-scale commercial installations worldwide. Most systems are based on individual particle sorting and use a combination of sensors to physically separate (accept/reject) material from heterogenous feeds; the approach has also been extended recently to include bulk-sorting applications [16]. Examples of common diagnostic properties and sensor types include colour, reflection/transparency, X-ray transmission (atomic density), short-wave or near-infrared radiation (mineral detection) and X-ray fluorescence (elemental detection) [16,17,18]. The technology is not exactly new to the minerals industry, with the earliest and most widespread use in the concentration of diamonds spanning a period of more than 70 years, but most of this development was completed in-house [16]. With a lack of confidence towards mineral applications, interest in the technology for other commodity markets did not gain support until the 1990s for industrial materials and the 2000s for base and precious metals [16,17]. In the gold sector, many companies report potential mass reductions in the range of 30–60% coupled with 1.5- to 2-fold grade increases and high gold recoveries (>90%) from ore-sorting testwork [19,20,21], including sulfidic refractory sources (e.g., [22]).
This preconcentration of run-of-mine (ROM) can have a number of benefits, including (1) increased productivity through debottlenecking of milling processes and the potential to raise mining rates equivalent to the amount of ejected waste; (2) reduced mining cut-off grades, which can extend productive mine life or create opportunities to re-process old waste dumps or tailings; (3) decreased tailings generation, which has both economic and environmental implications due to reduced processing and storage of waste materials; (4) decreased capital and operating costs related to equipment and material handling and transportation; (5) increased process efficiencies, thereby reducing the environmental footprint through decreased water, energy and reagent consumption rates [17]. Such considerations may be less pertinent to certain large-scale operations but can be especially important to the evaluation of smaller deposits with marginal economics. Regardless, there will likely be a shift towards such preconcentration technologies in the future by all scales of mining projects due to socio-environmental factors driving the development of more responsible and sustainable approaches to mining.
There are many instances of untapped refractory ores left in the ground, particularly in proximity to active mining operations or processing facilities. Sometimes, this is due to the existence of better prospects for project development, but it can also be related to a lack of appropriate tools to evaluate system design, or the effects on existing system processes. Unfortunately, the latter is all too common among historic or mature mining projects where it could have made sense to extract the material concurrently along with other conventional reserves but would no longer be economical to process on their own. However, there could be opportunities for companies to consolidate these resources within mining camps and process the ore from centralized facilities, or similarly the reprocessing of waste dumps or tailings to recover initial gold losses from mildly to moderately refractory ores. With recent advances in computing power, the necessary tools can be developed to assess mining system dynamics in relation to proposed new or modified processing control strategies that can handle varied ore sources, such as refractory gold.
Discrete event simulation (DES) is an important computational intelligence tool to model complex industrial systems. Quantitative frameworks that use DES are particularly successful in the modelling of mining systems as they can simulate the interactions between key processes and parameters in response to random variations, e.g., geological uncertainty. This is especially important to mineral processing plants receiving varied ore types from multiple sources. By understanding the potential ranges of variability in upcoming ore feeds, appropriate control strategies can be designed or modified according to the anticipated compositions. The DES portion of the framework is crucial in managing deviations from the expected ore attributes by capturing the potential system-wide effects caused by these changing conditions. As a result, the trade-offs between available operational policies can be evaluated, as well as the thresholds that prompt the timing of their execution [23,24,25]. The simulation of extended operating periods allows for the identification of potential deficiencies or bottlenecks in the coordination of unit processes within the target system. DES models are thus useful risk assessment and decision-making tools in the context of any mining system. Furthermore, the integration of predictive machine learning (ML) algorithms can help with decision-making earlier in the value chain. This has also been shown as an effective approach towards the development of online, i.e., real-time, simulation-based digital twin models [26,27,28]. A digital twin is a multidisciplinary virtual representation that uses historic and updated data models to simulate the operational life of the corresponding physical system [29,30]; such tools are becoming increasingly popular in the age of Industry 4.0 and related Internet of things (IoT) systems.
The key objective of this work is to develop a methodology to test novel control strategies, including those enabled by ML methods. The main advantage of our approach is the flexibility of the framework to incorporate a variety of data types, quantitative methods, or more detailed models and submodels, as necessary. By breaking down interdisciplinary barriers, this integrated technique is capable of connecting geological attributes (and related uncertainty) to target downstream process parameters for the development of effective operating policies and control strategies. Such a systems approach can lead to improved overall efficiency and/or stability, and thus project sustainability. In a broader context, there is increasing research interest in ML-assisted operational decision-making processes within industrial systems. However, it is remarkable that there is currently no emerging, unified approach responding to this need within the mining space, particularly with respect to integrated mine-to-mill strategies. There are indeed some excellent highly customized studies that could be better suited to specific functions, but these techniques are often limited by a lack of flexibility. Trying to adapt such methods to new contexts can thus result in a difficult negotiation with the simulation model, rather than designing the framework around the problem at hand.
This study proposes an integrated artificial neural network (ANN) and DES framework for the regional coordination of conventional and refractory gold ores feeding centralized processing facilities. In addition to evaluating potential control strategies, such as stockpiling and blending practices using alternate modes of operation, a conceptual case study is presented that also considers the implementation of site-based ore sorting as a form of preconcentration for more distal satellite orebodies. The paper describes the implemented methods, followed by an overview of DES and related framework development and finally a set of sample calculations for the conceptual case study.
2. Materials and Methods
2.1. Dataset Generation
In order to develop the framework, a set of geochemical, mineralogical and metallurgical data ( 750 samples) was generated for a conceptual new satellite deposit, reflective of a sediment-hosted, structurally controlled orebody. Data ranges for gold and arsenic assays, geochemical elements, mineral phases and potential recoveries were estimated based on data from several studies (e.g., [31,32,33,34]), in addition to author experience. The geochemistry and assay data were populated via random number generation using normal distributions centered around a suitable mean value for each element. In general, geochemical distributions are highly dependent on the specific problem set, sampling media and related protocols. However, a Gaussian distribution was deemed reasonable for the purposes of this study as the dataset is intended to reflect samples collected within localized ore zones hosted by a single lithology and subject to similar depositional conditions and postdepositional processes (i.e., deformation and hydrothermal fluid flow). Variability was controlled using standard deviations of 1.0 wt %, 0.1 wt %, 0.01–0.001 wt % and <0.001 wt % for major, minor, trace and ultratrace elements, respectively, representing typical detection limits for individual elements as a matter of scale. Mineral phase abundances for a selection of hydrothermal alteration and sulfide minerals common to sediment-hosted gold systems were estimated from whole-rock major element data using the “MINSQ” least-squares fitting method after Hermann and Berry, 2002 [35].
Finally, for the gold recoveries, data were sorted according to their Au:As ratio and an arbitrary cutoff of 0.02 was applied; values were randomly assigned using a uniform distribution from 80–100% for samples above this level and from 30–85% for those below. The 0.02 threshold was selected as an extension of the molar solubility limit for solid solution gold contained in As-rich pyrite, as reported by Reich et al. (2005) [13]. In practice, bulk metallurgical testwork is an expensive endeavor; instead, recovery data could be acquired via cheaper and faster alternatives, such as shaker table or bottle roll tests (e.g., [36]), to determine expected metallurgical response to standard cyanide leaching, i.e., level of refractoriness.
A series of basic descriptive statistics (Appendix A) were calculated to summarize the original raw dataset, which consists of data for 16 major elements (Table A1), 50 minor and trace elements (Table A2), 15 mineral phases and 7 gold-related variables (Table A3). Of the total 750 samples, 300 were used for training and validation of the ANN model, meanwhile the remaining 450 samples were set aside as an unseen test set to gauge future performance and generalization.
2.2. Artificial Neural Network Modelling
For the first portion of the study, a feed-forward neural network, also known as a multilayer perceptron (MLP), was developed for predictive regression modelling. The algorithm was written in the Python programming language using the PyTorch machine learning library. The elemental, mineralogical and all but one of the gold-related variables were retained for a total of 87 input features for the predictive model; gold recovery was reserved as the lone target output variable. Data preparation consisted of mean centering and rescaling each variable to unit variance (i.e., standardization); this step is critical to make the data comparable and reduce the effects of artificially inflated feature importance caused by large values and/or ranges. This form of data preprocessing also helps deal with any missing values and can significantly accelerate model convergence.
As noted above, 300 samples were retained for training and model selection, of which 60 samples (20%) were selected via random shuffling for validation purposes. By convention, target labels (i.e., recovery data) were available for both the training and validation subsets; however, the labels were withheld for the validation samples and simply used for metric calculations following prediction. Conversely, though recoveries were generated in building the test dataset ( 450 samples), these were set aside prior to data import to ensure the model was completely blind to testing labels. This allowed for the subsequent calculation of generalization error metrics to better evaluate how the model might perform on new datasets.
A number of model architectures were trialed, but ultimately a fully connected single hidden layer MLP was selected based on correlation and error performance metrics for each of the training, validation and test sets. As shown in Figure 1, the hidden layer (72 nodes) was arranged sequentially between the linear input (87 features) and output (1 target) layers; these features correspond to the variables in the generated dataset (as described above). The hidden layer was configured to use the rectified linear unit (ReLU) activation function to incorporate an aspect of nonlinearity. Accordingly, model weights were initialized using the He (also known as Kaiming) method with a uniform distribution. Details on model architecture design, activation functions and selection of an appropriate number of nodes in the hidden layer(s) are provided in Appendix B (Appendix B.3).
The loss function used to calculate errors and update model weights after each sample batch was based on the mean squared error (MSE), which is common for regression tasks in machine learning. Minimization of the loss function was carried out using the Adam optimizer with an initial learning rate of 0.001; this approach is an extension of stochastic gradient descent that uses adaptive learning rates and decay rates. Minibatches of size 1, 2, 4, 8, 16 and 32 samples were attempted, but it was found the best performance was achieved using single samples. Each training sample “batch” was randomly selected and loaded into the model via shuffling, which helps reduce overfitting.
While there are many regularization approaches to further prevent overfitting, the current model implements early stopping, whereby the model is automatically stopped when validation loss shows no significant improvement (or begins to increase) over a set number (i.e., 10) of epochs. Dropout with a probability of 0.2 was also used on the hidden layer as an additional regularization control.
While this study elected to focus on the MLP algorithm, a general overview and classification scheme for other machine learning (ML) approaches is available in Appendix B. Further details on ANN and MLP model development, training and fine-tuning, as well as relevant mining applications, are also provided.
2.3. Discrete Event Simulations
The DES modelling portion of the study was executed using commercial software (Rockwell Arena®, Version 16.1 Student Edition, Rockwell Automation Technologies, Inc., Milwaukee, WI, USA) with Visual Basic® for Applications (VBA, Version 7.1, Microsoft Corporation, Redmond, WA, USA). The model was verified via event checking and debugging, as well as sensitivity analysis through testing a wide range of values for model inputs and parameters. The use of fixed mass balances to assess potential plant performance is standard practice in the mineral processing sector; this work represents a valid extension beyond static modelling by incorporating pragmatic fluctuations in mass and composition flows, i.e., dynamic imbalances, that would be expected from multiple mining projects.
Though the current set of calculations is conceptual in nature, similar techniques have been successfully applied to Chilean smelter operations using real operational data (e.g., [37]), thus validating the general approach. The framework was calibrated using values typical of small-to-medium-sized underground gold mining and milling operations obtained from publicly available sources to establish realistic and valid data ranges. However, operational data would be available to further validate the model and make necessary modifications to the operational policies in practice. Specifics regarding framework development and related assumptions are further detailed in the context of the present study in Section 3 and Section 4.
3. Discrete Event Simulation and Framework Development
DES is a computer-based method to develop dynamic quantitative frameworks capable of simulating the interactions between important variables and processes within complex systems. The main difference between mining and other industrial systems is the concept of geological uncertainty, i.e., the random natural variability intrinsic to orebodies and their host geological formations. The flexibility of DES to introduce random distributions thus makes it particularly suitable for a wide variety of mining applications across the entire value chain. Recent work focused on concentrator and smelter dynamics has stressed the importance of coupling alternate modes of operation and mass balance with DES in order to develop a robust framework under changing conditions, or as critical thresholds are crossed [23,37,38]. The versatility of this approach is further underscored by a number of recent DES studies dealing with heap leach processes [24], smelter data acquisition modernization [39], tailings dam retreatment [25], oil sands processing [40], gold extraction reagent control [36], rougher flotation cell dynamics [41] and copper mine-to-smelter strategies [42].
The use of integrated DES frameworks in the mining industry remains in its infancy, with earlier implementations mostly focused on equipment selection [43] and availability [44], transport logistics [45] and continuous mine system simulation [46]. Some of the earliest mine-to-mill modelling efforts using DES include the coupling of solar radiation with a semiautogenous grinding (SAG) mill [47] and spectral ore type imaging applications [48]. Artificial intelligence (AI) and ML techniques represent the state of the art in research and development trends toward technological advancement and related process automation. Recent reviews specific to mining highlight the current scope of applications in a variety of areas across the spectrum, from exploration to mine planning, operations and downstream processing. However, these studies also identify a number of key gaps that should be addressed by the industry to support future innovation, including (1) the development of generalizable models that can be adapted to different problems or contexts [49]; (2) the proper integration of ML-acquired data (e.g., soft sensors) into quantitative frameworks that can make use of it [50]; (3) hierarchical model detailing to improve overall system performance [51]. It is thus clear that our flexible and integrated ML–DES approach to test novel control strategies for operational decision-making along the mine-to-mill profile contributes well to this void in the mining literature.
From a broader industrial perspective, there have been other studies that use similar framework architectures, particularly in manufacturing (e.g., [52]) and food processing (e.g., [53]). However, the distinction here is that these contexts are not subject to nearly the same degree of variability inherent to natural systems, such as mineralized orebodies, and therefore the resultant formulations do not consider the likes of geological uncertainty. By contrast, our methodology uses a predictive ML regression algorithm to characterize ore blocks based on expected metallurgical response from geological data collected early in the value chain; these classified blocks are then fed into the DES model to analyze system response to geological uncertainty via Monte Carlo simulation. An important assumption to bear in mind is that it is critical to ensure appropriate ore characterization testwork (e.g., gold deportment studies) has been carried out prior to implementing any predictive modelling tool. In practice, this can be an expensive and time-consuming endeavor, which may present barriers to smaller operations with less available working capital.
There are certainly other approaches to multiobjective optimization in mining systems, e.g., reinforcement learning and bandit algorithms for sequential decision making [54], or integrated sequential mine block selection and smelter feed dopant control using local optimization constraints [55]. These techniques are no doubt important to their specific applications; however, they do not have the appropriate time resolution to capture the frequency of critical threshold crossings required by the framework strategy presented here. Instead, the proposed DES model uses arbitrary time stepping controlled by system processes in response to geological uncertainty of the ore feeds.
DES modelling is especially useful in the design and evaluation of alternative operational policies and related trade-offs and can be applied to any phase of the mining lifecycle. The introduction of alternate operating modes, each with multiple possible configuration rates, allows for adjustments to be made that can stabilize system performance in response to unexpected changes, e.g., ore feed characteristics, caused by geological uncertainty [23]. The timing for switching between configuration rates and/or modes, which is triggered by set threshold crossings (i.e., discrete events), is governed by operational policy. Moreover, key performance indicators (KPIs) can be tracked to optimize the system-wide response by modifying the available operational policies and related thresholds. DES frameworks are powerful risk assessment tools as they can simulate extended periods of operation in order to identify potential deficiencies, bottlenecks, or other operational risks inherent to mining systems. The key to using DES for modelling continuous processes is to ensure that the number and frequency of discrete events are detected over long time variations; this allows realistic distributions to be captured for appropriate risk assessment. Provided adequate testing and validation, confidence intervals can be generated that support decision-making processes such as modified operating practices that mitigate the identified risk factor, i.e., the implementation of operational buffers [23,25] or the installation of new technologies [39].
Similar to recent DES modelling work (e.g., [23,36,40]), this study employs a two-mode model with multiple configuration rates to optimize the mass balancing of ore feed types and stabilize plant throughput. Operational buffers, including stockpiling and ore blending practices, are also implemented with corresponding adjustments made following the observed system response to geological uncertainty in the ore feeds. Under such a model, Mode A is usually considered the productive phase and prioritizes the processing of the most profitable ore type; however, depending on the composition of the deposit, it may not be sustainable to consume such a high proportion of this critical ore indefinitely. To alleviate this stress (i.e., stockout risk), Mode B acts as a replenishment phase by prioritizing the processing of other ore types which are less advantageous, perhaps due to a requirement for pretreatment of the ore prior to conventional milling. Depending on the nature of the pretreatment, this could result in large capital investitures; the trade-off comes in the form of potential significant increases in operating life. Nonetheless, the timing for switching from one mode to the other is dictated by operational policy, which defines the thresholds that indicate a discrete event has taken place, e.g., a negative crossing of the established critical ore level. As switching between modes would typically require a certain retooling of the plant configuration, this can only occur during planned maintenance shutdowns. As a result, each mode has multiple configuration rates that can be implemented as a temporary recourse action in response to a stockout event that has occurred mid-operating campaign.
The current framework has been extended to evaluate system performance for a conceptual regionalized mine-to-mill profile in the context of marginal underground gold mining operations. The concept is based on the possible installation of an autoclave (or similar technology) at an existing integrated gold processing facility for the oxidative pretreatment of refractory gold ores. This customization would thereby allow the plant to receive a combination of conventional, i.e., free-milling, and refractory ore feeds from multiple sources in the general area. The framework also considers the notion of installing ore sorting technology at, or near a collection of, satellite orebodies; the intent would be to preconcentrate classified refractory ores prior to transport to the processing facility. The resultant increase in head grades and waste elimination could render the refractory ore more economical through reduced handling and transportation costs and increased processing efficiencies, e.g., lower energy and water consumption. The general concept for the study is shown in Figure 2. For the purposes of this work, pretreatment of the refractory ore is assumed to consist of a combination of ore sorting, ultrafine (UF) grinding and pressure oxidation (POX).
The overall framework is such that geometallurgical attributes are used to develop an MLP model capable of predicting recoveries from geochemical and mineralogical data collected early in the value chain in order to classify extracted ore into two feed types. These predicted proportions are then fed into the DES model to establish effective operational policies and related control strategies using mass balance. To maximize plant throughput and mitigate stockout risk, the tactical decision has been made to implement both stockpiling and blending practices in response to geological uncertainty caused by the varied ore feeds. The general architecture and data flows for the quantitative framework are depicted in Figure 3. As previously noted, this integrative approach can be used in the development of simulation-based digital twins. Similar to recent work by Wilson et al. [40], the proposed framework is currently intended for offline design and/or early implementation purposes and can thus be termed a “digital model”, a subtype of the digital twin paradigm [56,57]. However, it would be possible to integrate the models into a mine control system, whereby the framework could be gradually migrated to an online state.
4. Sample Calculations
4.1. Case Study: Regionalized Framework for Refractory Gold Systems
The current set of calculations focuses on a conceptual integrated gold mill originally designed for the processing of free-milling gold ores via conventional cyanide leaching. The underground mining operation is relatively small, providing on the order of 692.2 kt at 4.5 g/t Au for 100 koz of gold production per annum. With reserves in decline year over year, the mine is only forecasted to remain in production for another ~5 years. However, recent definition of a sizable satellite orebody (15.55 Mt at 4.5 g/t Au for 2.25 Moz) has significantly increased the resource base of the current operator. As a result, the company is considering upgrades to the current plant infrastructure to increase throughput and extend its operating life by bringing the new deposit online.
A potential limiting drawback is the mixed nature of the new resources; gold here occurs as native free grains in quartz-carbonate vein sets, coarse-to-fine inclusions in disseminated pyrite and both physically and chemically locked in disseminated fine-grained arsenian pyrite and arsenopyrite. The ore is mainly concentrated within a series of evenly spaced parallel subvertical structures within and adjacent to a broad shear zone spanning a major regional contact zone between mafic volcanic and sedimentary rock units. Detailed mineralogical, gold deportment and metallurgical testwork indicate that ~70% of the ore is refractory, with recoveries ranging from 30 to 99% by standard cyanidation. However, further testing has shown improved recoveries (>97%) for the refractory ore using a combination of concentrate flotation, ultrafine grinding and pressure oxidation.
Distal to the contact zone, the nature of gold mineralization is clear; whereas ore hosted within the mafic volcanics is generally free-milling, sediment-hosted refractory gold is strongly associated with As-bearing sulfides and related minerals. Unfortunately, the vast majority of the deposit occurs within the sedimentary units to the west of the main lithologic contact. Conventional and refractory ores are thus best delineated using mineral distributions and geochemical signatures that can define irregular domains of arsenic enrichment that are not clear upon visual inspection, i.e., ore type and grade calls are extremely difficult for the mine geologist. It would be both unproductive and unsustainable to perform expensive and time-consuming characterization testwork at the stope face following each round of blasting. Instead, the company has opted to undertake a major ore characterization program using drill core samples for geochemical, mineralogical and corresponding metallurgical response determinations. This data could then be used for predictive modelling of future ore block recoveries using data collected from drill core samples during routine definition drilling programs; this would allow for expedited decision-making earlier in the value chain, thereby improving mine planning.
However, given the high capital costs to upgrade the metallurgical plant, it remains unclear how the processing facility will respond to the varied ore types from multiple sources. Moreover, the operator is considering an ore sorting preconcentration step for the refractory ore prior to transport, which adds further complexity to the overall mass balance. There are also questions as to how to effectively design operating policies that will stabilize plant throughput against the significant potential for geological variability both within and between mining blocks from the new heterogeneous orebody. The overall concept for the calculations is summarized in Figure 4; average ore compositions expected at the central mill facility include a 40–60% mass pull for refractory type ore resulting from the sorting process (see details in Section 4.3). For the sake of clarity, the producing mine and new satellite deposit are herein referred to as Mines I and II, respectively.
This work implements stockpiling and blending practices using alternate modes of operation that can balance the ore feeds from the two mines in response to geological uncertainty. Ore type proportions for mining blocks from Mine II are based on predictive ML modelling of gold recoveries (using MLP regression), which are then combined with extracted ore from Mine I and fed into the DES portion of the framework to simulate system response. Adjustments can then be made to the available operational policies and related control strategies to maximize throughput and mitigate identified operational risks, e.g., ore stockouts.
4.2. Multilayer Perceptron Regression Model
With the selected model architecture and hyperparameter tuning (see Section 2.2), the model yielded its best performance with a training length on the order of 500 epochs, i.e., iterations through the entire training ( 240 samples) and validation ( 60 samples) sets. Plots of coefficient of determination ( score) and root-mean-square-error (RMSE) values show diminishing returns or reversals around this point for both training and validation subsets (Figure 5). Overall, the extremely high scores (>99%) and low RMSE values (<1.0) indicate that the model has performed very well on the current dataset. Moreover, the agreement between the training and validation metrics suggests that it is not overfitting to statistical noise and should thus generalize well to new data.
The model also performed quite well on the testing set, with and RMSE values of 0.82 and 7.07, respectively. This indicates reasonable generalization to unseen datasets derived from similar geological environments and sampling protocols. Predictions from the final model (training length of 500 epochs) are shown with respect to the withheld observed (i.e., labeled) recoveries in Figure 6, and comparative descriptive statistics are summarized in Table 1. The predictive power of the model appears best in the mid-to-upper recovery ranges (~65–95%), which is positive as the most difficult and critical ore type classifications would occur in this span.
The decreased accuracy and higher error observed for the test set is not surprising, especially considering the relatively small training set size; in practice, a robust predictive model should be built on much larger datasets to improve confidence, particularly with the significant variability inherent to geological-based data. However, this exercise has shown the powerful predictive capability of MLP regression models for structured, i.e., tabular, datasets common to the mining industry. Regardless, the exact nature of the ML model is not what is important here. The key is that the presented model, despite performing rather well on the generated datasets, can be modified or replaced within the flexible DES framework to suit the needs or scope of the specific problem at hand.
It is critical for any sort of predictive modelling tool that appropriate ore characterization is established prior to implementation. This will often require an upfront surplus of sampling and analyses in order to adequately understand the nature of ore feeds; however, with sufficient time and validation of a robust predictive model, sampling frequency can likely be significantly reduced, in addition to more targeted analyses, both of which can result in long-term cost savings. Furthermore, with coupled analytical streams (e.g., geochemistry and mineralogy), additional savings may eventually be seen by employing other tools that could eliminate an analysis type altogether. For instance, with sufficient characterization, normative mineral phase calculations from geochemical data could possibly replace the need for mineralogical studies entirely.
In this study, the outputs of the MLP model, i.e., predicted recoveries, are used to determine relative proportions of conventional and refractory ore within each mining block from the new satellite deposit (Mine II). These proportions then serve as inputs for the DES framework in order to evaluate system-wide response to the varied ore feeds from both mines, under geological uncertainty.
4.3. Discrete Event Simulations
Ore type classifications for Mine II were based on the predicted recoveries made on the test set ( 450 samples). Ore with >90% recovery was deemed free-milling, whereas lower recovery rates were considered of the refractory type; these are herein abbreviated as FMO and RTO, respectively. In the context of this study, the test set also corresponded to the first 150 mining blocks (~3 years of production) forecasted for extraction from Mine II, allowing for a minimum of three samples per block. From a practical perspective, a much greater number of samples would be required for appropriate ore characterization; however, this setup was deemed sufficient for demonstrative purposes. Due to the limited number of samples available for ore characterization, natural background noise, i.e., geological uncertainty, was added to the relative proportions of FMO and RTO via random number generation using a normal distribution with a standard deviation of 3%.
Simplified mid-range mine plans were generated for each of Mines I and II, corresponding to ~3 years of operations. Both mines are expected to produce similar ore tonnages, on the order of 500 kt/y, from similarly sized stopes averaging ~10 kt each. According to these rates, each mine plan comprises 150 mining blocks; tonnages were randomly assigned using a uniform distribution between 5 and 15 kt. For Mine I, all ore was assumed to be free-milling; for Mine II, the relative proportions of FMO and RTO were determined as above. Moreover, the portion of RTO from Mine II was subject to a random mass pull in the range of 40–60% (with an assumed two-fold grade increase) by also applying a uniform distribution.
Additionally, a total of 100 of these mine plans, i.e., statistical scenarios, were created for each of the mines in order to evaluate system-wide effects in response to a range of potential distributions. This approach is critical to proper risk assessment and to improve confidence in the design of robust operational policies and practices under geological uncertainty. Finally, the two sets of mine plans were then combined using weighted averages to reflect the overall ore feed that would be received at the central processing plant, assuming similar production rates at Mines I and II. In this manner, a 70–30 tonnage split of FMO and RTO (recall Figure 4) is expected as ore feed at the mill on average, bearing in mind that the refractory type ore has already undergone preconcentration via ore sorting. The proposed mining rates allow for a ~25% reduction in corporate guidance levels for Mine I, thereby extending operating life and providing more time to replace reserves through planned exploration. With the new production from Mine II, however, the result would be an approximate 50% increase in overall plant output to ~150 koz/y.
To handle the varied ore feeds, the proposed framework implements blending and stockpiling practices to mitigate the effects of unexpected changes in ore characteristics caused by geological uncertainty. These control strategies are described by two distinct operational modes, each governed by its own set of operating policies. Under Mode A, the mill receives 1245 t/d of ore from Mine I and 755 t/d of ore from Mine II; under Mode B, the mill receives 1370 t/d of ore from Mine I and 830 t/d of ore from Mine II. As summarized in Table 2, the overall mass balance is such that Mode A is anticipated to deplete the RTO stockpile by 100 t/d, whereas Mode B is expected to replenish RTO by 220 t/d. Though Mode B achieves a higher overall throughput, Mode A is generally the preferred plant configuration as it produces an additional ~10 koz Au/y based on increased grades associated with a higher proportion of ore-sorted, i.e., preconcentrated, RTO. However, it is not sustainable to operate in Mode A indefinitely due to the rapid depletion of RTO using its assigned configuration rates. The decision to switch between modes is made at the end of 4-week production campaigns and is based on a determined threshold. When stockpiled RTO drops below this critical level at the end of a campaign, the planned one-day shutdown provides an opportunity for the necessary retooling of key equipment to apply Mode B, which acts as a replenishment phase.
Plant configuration rates for each mode, i.e., the absolute and relative proportions of FMO and RTO, are assessed with respect to geological forecasts of the combined ore feed from the two mines using mass balancing. Following the approach of Navarra et al. [23], a deterministic analysis of the proposed configuration rates indicates that Mode A should be applied 2.2 times as frequently as Mode B, for an average throughput of 2062.5 t/d. However, this naïve calculation ignores the risk of stockout caused by geological uncertainty. The primary aim of the framework is to simultaneously maximize throughput and minimize target stockpile levels, meanwhile ensuring stable ore feed streams to mitigate stockout risk and avoid the disruption of continuous plant production. It is important to minimize stockpile levels as much as possible to reduce costs associated with excessive material handling and storage.
The framework implements two control variables in the decision-making process, including a critical RTO level and the target total stockpile level, computed as the sum of available FMO and RTO. Deterministic calculations indicate minimum threshold values of 2700 t and 5940 t for these variables, respectively. The critical ore level is determined as a function of campaign length (27 days) and rate of change under Mode A (100 t/d); the target total stockpile level is determined as the maximum rate of change between available FMO and RTO under either mode (220 t/d), also as a function of campaign duration. A negative threshold crossing for either of these variables represents a discrete event, which elicits a decision in the framework. Depending on the observed system response during simulations, these control variables can be adjusted by raising the threshold values as a form of operational buffer against geological uncertainty. Each simulation trial begins in Mode A as it is the more productive of the available operational modes; it is assumed that each combined ore feed block is processed to completion prior to loading the next parcel.
Recourse actions are also included in the model to handle situations in which one of the ore types is entirely depleted during a production campaign. When the target total stockpile level decreases below the set threshold prior to a planned shutdown, either a contingency mode or mining surge is enacted depending on the current system state. When the critical ore (RTO) is fully depleted under Mode A, a contingency mode is triggered, such that the configuration rate is reduced and only the available ore type (FMO) is processed for a brief 1-day period to allow RTO to temporarily replenish. Conversely, a depletion of FMO under Mode A requires a mining surge, which causes the total available ore to increase above the target level and is fed directly to the processing facility. When corresponding depletions occur under Mode B, these recourse actions are reversed. While these responses are important to relieve system stress caused by insufficient stockpile availability, they are generally unfavorable due to significantly reduced production throughputs; for instance, this study has opted to set production rates of 60% and 65% for the contingency modes under Modes A and B, respectively. As a result, adequately high threshold values for the two control variables must be selected to minimize the occurrence of such events, while balancing this risk against increased costs related to the additional infrastructure, equipment and handling required by larger stockpiles [23,25]. The overall decision-making logic for the model is shown in Figure 7.
Representative graphical outputs from the DES framework are shown in Figure 8, demonstrating the fluctuations in FMO and RTO feed stockpiles over operating periods of 500 days (Figure 8a) and 250 days (Figure 8b). The application of Mode A is indicated when FMO levels are increasing and RTO levels are decreasing; Mode B is reflected by increasing RTO levels and diminishing FMO levels. The alternation of these modes is key to the stable functioning of the processing plant by providing relief to the system before it comes under stress via suitably selected threshold values (e.g., Figure 8a). When these critical levels are set too low, the system is repeatedly stressed by inadequate ore availability, thus requiring immediate recourse actions which are both less productive and unsustainable. Figure 8b illustrates a mine surging event caused by total depletion of FMO under Mode A ( 300 days), wherein the additional ore is fed directly to the plant, in addition to three contingency mode segments caused by the depletion of RTO also under Mode A ( 360, 420, 480 days). The jagged nature of the line segments in both plots is indicative of the significant geological uncertainty in combined ore feeds from both mines.
To select appropriate values for the two control variables, a series of simulations were run with varied combinations of RTO and target total ore levels attempted. Data from an initial set of six simulations are summarized in Table 3; for these trials, the critical RTO level was held constant at 2700 t (deterministic result) and the target total ore level was varied between 5940 t and 12,150 t. This first pass was carried out on a single replication, i.e., one statistical realization or “mine plan”, in order to find a reasonable ore ratio range for further testing. In terms of throughput, it is clear that simulations 2, 3 and 4, corresponding to FMO:RTO ratios of 1.5, 2 and 2.5, respectively, performed the best. Despite a decrease in throughput, simulation 5 (3:1 ore ratio) was also retained based on a lower stockout risk. While simulation 6 did not experience any stockouts, it was ignored from further trials as stockpile levels would become unmanageably large as the critical ore level is raised. It is also notable that in general, the proportion of time spent in the more productive Mode A appears to vary directly with the FMO:RTO ratio.
A second round of simulations then focused on raising the critical RTO level by factors of 2, 3 and 4 for each of the retained ore type ratios, i.e., FMO:RTO values of 1.5, 2, 2.5 and 3. These trials were executed using all 100 statistical replications in order to better gauge throughput rates and operational stockout risk over a range of distributions; the resulting data are summarized in Figure 8 and Figure 9. Throughputs for all of the ore ratio configurations appear to stabilize at a minimum critical RTO level of 8100 t (Figure 9a) and target total ore levels in the range of 20–30 kt (Figure 9b). While all of the ratios reached similar throughput rates, notably higher than the deterministic result of 2062.5 t/d, the two lowest ratios managed these levels with substantially smaller total ore stockpiles (differences on the order of 5–10 kt).
Considering the total tonnage from all 100 replications (~238.7 Mt) and the simulated average throughput rates, the resulting absolute numbers of operating days and ore stockout events were used to calculate the frequency of stockouts for each ore ratio. From these, monthly stockout probabilities were computed for each scenario, as shown in Figure 10. These trends show that a 2:1 ratio of FMO and RTO generally reduces operational stockout risk (on a monthly basis) to near zero with the smallest ore feed stockpile levels. As a result, the final selected model for this study implements threshold values of 8100 t and 24,300 t for the critical RTO and target total ore control variables, respectively.
A histogram of modal time proportions (Figure 11) compares the average performance of the final enhanced model vs. a naïve model that uses the deterministic values for both critical RTO (2700 t) and target total ore (5940 t) levels over 100 replications. It is evident that the enhanced model processes more ore under the more productive Mode A; moreover, this scenario results in less system stress resulting from ore feed depletions as evidenced by negligible application of contingency segments under either mode.
The stability of the final model allows for the efficient processing of 447.5 koz of gold (averaged over the 100 statistical replications) in ~3.15 years, which is just under the target annual guidance level of 150 koz. By comparison, the naïve scenario would take an additional ~2 weeks to process a similar number of ounces and would effectively be unsustainable due to chronic ore feed shortages. Armed with the confidence of stable system functioning using alternate modes of operation and the selected operational policies, a company is much better-positioned to proceed with a detailed project evaluation.
For demonstrative purposes, a high-level economic analysis using pretax net present value (NPV) was conducted to assess the value of bringing the new satellite deposit (Mine II) online. Under Option 1, the company simply continues to process the remaining ~500 koz of gold reserves at Mine I at a target annual guidance level of 100 koz; barring a significant resource expansion through underground exploration, the mine is thus projected to shut down in ~5 years. Under Option 2, guidance levels at Mine I are reduced to 75 koz Au/y, and Mine II is put into production at an equal guidance level for a target total of 150 koz Au/y. This would extend mine life at Mine I to just under 7 years, which also provides more opportunity to replace reserves. Once Mine I is fully depleted, guidance levels for Mine II would be increased to at least 150 koz Au/y to make up the difference.
To compare the two options, NPV was calculated as follows:
where is the number of periods, is the current time period, is the net cash flow (i.e., revenue less costs) and is the discount rate. Various gold prices from USD 1200/oz to USD 1900/oz were used as a form of sensitivity study to observe the relative trade-off. For Option 1, it was assumed that 100 koz Au are produced per annum at an all-in sustaining cost (AISC) of USD 850/oz. AISC is a non-GAAP (“generally accepted accounting principles”) measure frequently employed in the gold sector to improve transparency with stakeholders and provide a better comparative valuation scale for companies and/or mining projects. The AISC measure includes all operating costs, general and administrative site and corporate expenses, freight, treatment/refining costs, royalties, hedging effects, write-downs, sustaining capital (including near-mine exploration) and reclamation costs. The resulting NPV calculations for Option 1 are shown in Table 4.
To evaluate Option 2, it is necessary to determine an approximate life-of-mine (LOM) for Mine II. Advanced deposit definition has identified 15.55 Mt at 4.5 g/t Au for a total of ~2.25 Moz of contained gold in reserves and indicated resources. The subvertical mineralized zones are expected to be extracted via the long hole stoping mining method. Using Taylor’s Rule [59], this corresponds to an estimated mine life of ~12.5 years, assuming recovery and dilution factors of 85% and 15%, respectively. However, this option requires significant capital investment to increase capacity at the central processing plant and install an autoclave for the oxidative pretreatment of refractory ore. Community, permitting, distal exploration and nonsustaining capital costs are considered as “profit and loss” (P&L) investments, and are not typically included in AISC disclosures. An initial investment of USD 235M has thus been included at time in the NPV calculations for Option 2, as shown in Table 5. This amount includes USD 150M for a smaller industrial autoclave and USD 85M for the start-up costs at Mine II, in line with the upper range of average costs for an underground operation using long hole stoping with shaft access [59]. In this scenario, both mines are operational for the first 7 years and the mill produces 150 koz Au/y at an assumed AISC of USD 1050/oz. Following depletion of gold reserves at Mine I, target guidance levels at Mine II are increased for the remaining 6 years with the mill continuing to produce 150 koz Au/y at an assumed AISC of USD 950/oz. Payback periods (in years) were also calculated based on cumulative NPV for each gold price.
Figure 12 shows the relative trade-off between Options 1 and 2 over the range of gold prices considered for the current study. The breakeven point for bringing Mine II online appears to occur at a gold price of ~USD 1450/oz, with a payback period of ~5 years. The sensitivity to gold price could be further reduced by expanding the resource/reserve base at Mine II, in addition to further increases in mill capacity. This economic assessment is fairly crude in nature and relies on a number of assumptions; in practice, a much more elaborate evaluation would be completed using detailed capital and operating costs, coupled with historic and updated operational data from the plant in question.
5. Discussion and Future Work
As previously described, declining trends related to new gold discoveries are driving an emerging imbalance in the replacement of global gold reserves against forecasted production. However, technological advancements are improving not only the economic feasibility, but the overall sustainability of processing more complex and refractory ores to help fill the growing gap in supply and demand chains. Sensor-based sorting is one such method being evaluated or applied in the industry as it allows for the preconcentration of target minerals based on physicochemical heterogeneities between ore and waste streams. This approach is particularly attractive for remote projects or satellite orebodies as it can significantly cut down on handling and transportation costs, in addition to improving cost and energy efficiencies at the processing plant. Moreover, environmental footprints are also greatly reduced by keeping a higher volume of ultimate waste at the mine site, thereby minimizing unnecessary tailings accumulations.
Refractory ore zones are relatively common in many gold-mining districts, especially in deposits hosted along or proximal to major lithological contacts with sedimentary basins. However, often times these zones are cast aside due to the metallurgical implications and only the free-milling ores are extracted for processing. As more efficient methods to improve the recovery of refractory gold and handle impurities of concern (e.g., arsenic) are developed, there will be increased opportunity to process these zones concurrently with conventional sources. An interesting case could also be made to consolidate these untapped refractory zones from a collection of deposits within a mature or historic mining camp for processing at a centralized facility. Regardless, a processing plant receiving ores from multiple sources will undoubtedly face significant variations in ore feed attributes which must be considered in the design of operational policies. Computational intelligence tools are thus needed to assess mining system dynamics with respect to proposed new or modified control strategies that could mitigate operational risks presented by significant geological uncertainty.
As identified in recent reviews [49,50,51], our approach fills a particular gap in the mining literature by focusing on generalizable framework development with the flexibility to incorporate different data types and quantitative methods (e.g., machine learning) to test novel process control strategies. This paper explored a regional-based mine-to-mill strategy for the development of varied gold ore types from multiple sources using an integrated ANN and DES framework. The methodology uses predicted outputs from the ANN model to classify ore feeds based on metallurgical response to standard cyanidation, which are then fed into the DES model to evaluate the system-wide response to geological uncertainty. A critical caveat is that appropriate ore characterization testwork (e.g., gold deportment) must be carried out prior to implementing any predictive tool, which can be a fairly expensive and time-consuming process in practice. The current quantitative framework provides a pathway to evaluate potential mineral processing routes using mass balance and alternate modes of operation. Adjustments can then be made to operating practices and parameters towards the development of effective operational policies. This study implemented stockpiling and blending as control measures to manage ore stockout risk caused by unexpected changes in ore feeds, i.e., geological uncertainty. A further level of complexity was also added by introducing uncertainty to the tonnages resulting from preconcentration of classified refractory ores (via ore sorting) into the overall mass balance. Results from sample calculations based on a conceptual scenario offer insight into the applicability of such a framework within a gold mining context and warrant further study of similar strategies. As an example, computations carried out in parallel with and without preconcentration to evaluate system performance with respect to ore stocks and flows (and ultimately the resultant NPV) could make for interesting case studies to support or oppose the installation of an ore sorter at a given mining project. The real key is that the developed tool can improve confidence in stable mining system design, which allows for further detailed project evaluation and strategic decision-making.
Moreover, this work highlights the use of such integrated models as a suitable approach to develop dynamic simulation-based digital twins. Currently intended for design and implementation purposes, the present framework would technically be considered a digital model as data flows between the “physical” and virtual realms are made manually in an offline state. However, armed with updated ore characterization and operational data from an active mining project, the model could eventually evolve into a full digital twin (automatic two-way data transfers) by incorporation into a mine control system. While the current framework was presented in the context of system-wide response to geological uncertainty at a single plant being fed from multiple ore sources, future work could also consider a whole network of mines and processing facilities. An even more elaborate scheme could incorporate geospatial attribute data for predictive 3D modelling of distinct geometallurgical units and subsequent ore block classifications. Regardless, it is clear from current mining trends that research and development must continue to be advanced in the gold sector in order to meet future demand in the age of Industry 4.0 and related IoT systems.
Author Contributions
Conceptualization, R.W., P.H.J.M. and A.N.; methodology, R.W. and A.N.; data curation, R.W.; investigation, R.W.; formal analysis, R.W.; validation, R.W.; visualization, R.W.; writing—original draft preparation, R.W.; writing—reviewing and editing, P.H.J.M. and A.N.; supervision, A.N. All authors have read and agreed to the published version of the manuscript.
Funding
Funding for this work was provided by NSERC, grant no. 2020-04605, supported by the Government of Canada.
Data Availability Statement
The data presented in this study are available on request from the corresponding author.
Conflicts of Interest
The authors declare no conflict of interest.
Appendix A

Table A1.
Summary of descriptive statistics for major elemental compositions in 750 samples.
| Elemental Compositions (wt %) | |||||
|---|---|---|---|---|---|
| Element | Min | Max | Median | Mean | Std. Dev. |
| SiO2 | 39.80 | 87.30 | 62.70 | 61.60 | 8.25 |
| TiO2 | 0.02 | 1.56 | 0.59 | 0.61 | 0.35 |
| Al2O3 | 1.43 | 27.74 | 14.85 | 14.26 | 4.28 |
| Fe2O3 | 0.02 | 14.76 | 4.82 | 5.30 | 2.92 |
| MnO | 0.01 | 0.82 | 0.14 | 0.19 | 0.17 |
| MgO | 0.21 | 7.08 | 2.07 | 2.29 | 1.22 |
| CaO | 0.02 | 14.09 | 3.80 | 4.31 | 2.62 |
| Na2O | 0.17 | 6.63 | 1.51 | 1.71 | 0.96 |
| K2O | 0.11 | 4.80 | 2.63 | 2.60 | 0.95 |
| P2O5 | 0.01 | 0.51 | 0.11 | 0.13 | 0.09 |
| Cr2O3 | 0.00 | 0.12 | 0.02 | 0.03 | 0.03 |
| BaO | 0.01 | 0.17 | 0.06 | 0.06 | 0.04 |
| SrO | 0.01 | 0.13 | 0.04 | 0.04 | 0.03 |
| LOI | 0.05 | 21.30 | 6.41 | 6.99 | 4.26 |
| Total C | 0.02 | 4.49 | 1.09 | 1.36 | 1.02 |
| Total S | 0.10 | 6.60 | 1.41 | 1.55 | 0.92 |
Table A2.
Summary of descriptive statistics for minor and trace elemental compositions in 750 samples.
Table A2.
Summary of descriptive statistics for minor and trace elemental compositions in 750 samples.
| Elemental Compositions (ppm) | Elemental Compositions (ppm) | ||||||||||
|---|---|---|---|---|---|---|---|---|---|---|---|
| Element | Min | Max | Median | Mean | Std. Dev. | Element | Min | Max | Median | Mean | Std. Dev. |
| Ag | 0.01 | 53.33 | 1.24 | 4.38 | 9.00 | Nd | 0.25 | 72.15 | 17.97 | 19.76 | 12.18 |
| Ba (%) | 0.00 | 0.17 | 0.06 | 0.06 | 0.04 | Ni | 11.92 | 199.69 | 91.40 | 94.79 | 47.04 |
| Bi | 0.01 | 2.63 | 0.58 | 0.71 | 0.61 | Pb | 0.25 | 254.12 | 9.59 | 15.95 | 38.33 |
| Cd | 0.25 | 2.90 | 0.25 | 0.35 | 0.42 | Pr | 0.45 | 18.89 | 4.56 | 5.06 | 3.14 |
| Ce | 0.05 | 148.40 | 35.62 | 39.79 | 25.55 | Rb | 1.89 | 141.50 | 87.29 | 81.92 | 30.97 |
| Co | 2 | 80 | 22 | 23 | 12 | Re | 0.00 | 0.01 | 0.00 | 0.00 | 0.00 |
| Cr | 18 | 665 | 161 | 178 | 118 | Sb | 0.02 | 101.87 | 11.13 | 19.14 | 21.65 |
| Cs | 0.3 | 28.2 | 13.9 | 13.3 | 6.0 | Sc | 0.25 | 43.04 | 13.26 | 14.23 | 8.36 |
| Cu (%) | 0.00 | 0.32 | 0.01 | 0.02 | 0.02 | Se | 0.0 | 1.4 | 0.2 | 0.3 | 0.3 |
| Dy | 0.13 | 13.28 | 2.21 | 2.47 | 1.85 | Sm | 0.15 | 10.64 | 3.43 | 3.61 | 1.67 |
| Er | 0.03 | 8.12 | 1.26 | 1.40 | 1.13 | Sn | 0.24 | 2.56 | 1.01 | 1.00 | 0.37 |
| Eu | 0.05 | 2.32 | 0.81 | 0.88 | 0.45 | Sr (%) | 0.005 | 0.062 | 0.034 | 0.035 | 0.011 |
| Fe3+ (%) | 0.01 | 15.59 | 3.64 | 4.18 | 3.40 | Ta | 0.05 | 1.32 | 0.36 | 0.38 | 0.28 |
| Ga | 0.5 | 33.2 | 20.4 | 19.5 | 5.6 | Tb | 0.01 | 1.89 | 0.43 | 0.47 | 0.35 |
| Gd | 0.87 | 8.35 | 2.80 | 2.96 | 1.21 | Te | 0.01 | 4.33 | 0.31 | 0.66 | 0.88 |
| Ge | 2.50 | 2.50 | 2.50 | 2.50 | 0.00 | Th | 0.005 | 6.070 | 2.882 | 2.820 | 1.354 |
| Hf | 0.05 | 4.69 | 3.23 | 3.02 | 0.96 | Tl | 0.005 | 0.137 | 0.039 | 0.042 | 0.028 |
| Hg | 0.00 | 0.34 | 0.01 | 0.03 | 0.05 | Tm | 0.01 | 1.44 | 0.17 | 0.26 | 0.29 |
| Ho | 0.02 | 2.82 | 0.51 | 0.55 | 0.43 | U | 0.01 | 2.00 | 0.83 | 0.80 | 0.45 |
| In | 0.00 | 0.13 | 0.02 | 0.03 | 0.03 | V | 2.8 | 319.5 | 109.3 | 117.5 | 63.3 |
| La | 0.20 | 67.08 | 18.29 | 18.84 | 11.75 | W | 1.00 | 48.26 | 13.55 | 15.21 | 9.12 |
| Li | 5.1 | 130.7 | 43.1 | 48.5 | 26.5 | Y | 1.00 | 81.01 | 12.16 | 13.51 | 10.74 |
| Lu | 0.01 | 1.13 | 0.15 | 0.23 | 0.26 | Yb | 0.01 | 5.29 | 1.14 | 1.22 | 0.81 |
| Mo | 0.25 | 28.12 | 1.06 | 2.14 | 4.24 | Zn | 1.0 | 1120.5 | 70.4 | 179.2 | 235.3 |
| Nb | 1.01 | 7.24 | 4.58 | 4.45 | 1.22 | Zr | 2.9 | 175.6 | 122.1 | 115.2 | 35.9 |
Table A3.
Summary of descriptive statistics for mineral phase abundances, determined using the MINSQ least-squares fitting method and an assortment of gold-related variables in 750 samples.
Table A3.
Summary of descriptive statistics for mineral phase abundances, determined using the MINSQ least-squares fitting method and an assortment of gold-related variables in 750 samples.
| Mineral Phase Abundances (wt %) | |||||
|---|---|---|---|---|---|
| Mineral | Min | Max | Median | Mean | Std. Dev. |
| Quartz | 4.80 | 80.82 | 39.43 | 39.23 | 11.00 |
| K feldspar | 0.00 | 27.54 | 5.48 | 6.74 | 6.77 |
| Albite | 0.00 | 48.98 | 0.00 | 1.97 | 6.06 |
| Muscovite | 0.00 | 39.43 | 11.24 | 12.99 | 11.62 |
| Paragonite | 0.00 | 48.81 | 19.32 | 19.31 | 8.94 |
| Fe Chlorite | 0.00 | 22.89 | 1.37 | 3.36 | 4.64 |
| Mg Chlorite | 0.00 | 20.43 | 0.24 | 2.18 | 3.43 |
| Calcite | 0.00 | 20.49 | 1.28 | 2.98 | 3.97 |
| Ankerite | 0.00 | 41.48 | 2.32 | 4.59 | 6.47 |
| Dolomite | 0.00 | 30.86 | 3.33 | 4.67 | 5.34 |
| Rutile | 0.00 | 1.54 | 0.58 | 0.60 | 0.35 |
| Pyrite | 0.00 | 11.55 | 2.21 | 2.44 | 1.74 |
| Arsenopyrite | 0.00 | 3.64 | 0.33 | 0.79 | 0.91 |
| Chalcopyrite | 0.00 | 0.93 | 0.05 | 0.06 | 0.06 |
| Sphalerite | 0.00 | 0.49 | 0.04 | 0.07 | 0.07 |
| Variable | Min | Max | Median | Mean | Std. Dev. |
| Sulfide_Obs (wt %) | 1 | 14 | 5 | 6 | 3 |
| Sulfide_Calc (wt %) | 0.1 | 13.8 | 3.3 | 3.4 | 1.9 |
| Au (ppm) | 1.0 | 43.0 | 5.6 | 9.3 | 10.7 |
| As (ppm) | 50 | 16950 | 1557 | 3822 | 4288 |
| Au:As Ratio | 0.00 | 0.52 | 0.00 | 0.03 | 0.06 |
| Au Grain Size (µm) | 0.1 | 18.7 | 4.7 | 5.3 | 4.9 |
| Au Recovery (%) | 31.5 | 99.8 | 71.9 | 72.3 | 15.7 |
Appendix B
Appendix B.1. Machine Learning Overview and Classification
Artificial intelligence (AI) is a branch of computer science focused on the development of “intelligent agents”, i.e., systems that are capable of perceiving their environment and acting in such a way that maximizes the probability of achieving a set of goals [60]. Machine learning (ML) is a division of AI concerned with the design of algorithms that aim to optimize the performance of a specific task by learning from examples and/or past history [61]. In other words, machine learning comprises a set of techniques that can be used to solve specific problems within a given system. With digitalization and automation trends (e.g., Industry 4.0), coupled with significant improvements in computing power, the increasing availability of large datasets (i.e., “big data”) has driven a recent surge in ML algorithm research and development. As a result, ML approaches are now successfully applied to a variety of classification, regression, clustering and dimensionality reduction tasks [62,63]. In particular, ML techniques are capable of extracting hidden relationships from large multivariate datasets accumulated in complex and dynamic environments (e.g., industrial systems) [62,64]. A key advantage of ML algorithms over classic statistical methods, such as multiple linear regression, is the ability to model and learn nonlinear relationships. This is particularly important to industrial systems, wherein the final system outputs are usually produced from the initial inputs via a series of coordinated unit processes, each with their own specific operating policies and related parameters.
Machine learning tasks can be divided into three main categories, including supervised, unsupervised and reinforcement learning techniques (Figure A1). Supervised learning involves model training with paired data for both input and target output variables (i.e., labeled examples) in order to map relationships between the two spaces; the derived function is then used to classify the example, or predict a continuous value (regression). In unsupervised learning, model training is carried out on unlabeled examples, i.e., input data have no corresponding target output value(s). Unsupervised methods can also be further subdivided into clustering and association tasks. Whereas clustering entails the grouping of examples based on similarities (distance in the sample space), an association rule determines relationships between variables such as the likelihood that the value of a particular feature can be predicted given that of another feature [65]. Reinforcement learning falls somewhere between supervised and unsupervised learning as the algorithm is told when the answer is wrong, but not how to correct it [63]; the technique explores multiple different sequences in order to maximize a reward by a combination of optimal or sufficiently good individual actions [62]. Of course, there are also a number of hybrid or ensemble ML methods that combine elements from any of these base model approaches.
Figure A1.
General classification scheme for different machine learning approaches.

Compared to other industries, the mining sector has been relatively slow to adopt machine learning approaches in common practice [49,66]. Regardless, a recent surge in research and development over the last few years has shown that ML techniques can be successfully applied to a broad spectrum of the mineral value chain, from greenfield exploration through to production, mine closure and site reclamation. There are a number of review papers available that summarize a variety of ML applications in the mining space (e.g., [49,50,67,68,69]), including mineral exploration and resource evaluation, strategic mine planning, machine operations and related automation, drilling and blasting optimization and ore beneficiation, among others. However, there is little published work related to the integration of ML techniques into mine-to-mill framework strategies. This study aims to incorporate an artificial neural network (ANN), a type of supervised ML algorithm, into a DES framework in order to develop a regionalized approach for the processing of multiple gold ore types from various source orebodies.
Appendix B.2. Artificial Neural Networks and Multilayer Perceptrons
According to recent reviews, ANNs are among the most popular ML approaches used in many industries, such as manufacturing [70], maintenance [71], solid-state materials [62] and mining [49,67]. The underlying concept for ANN models is based on the functioning of the human brain, wherein activated neurons (cell structures) “fire” to transfer electrical signals (i.e., information) to other parts of the brain via synaptic connections. The term “ANN” actually refers to a broad umbrella of models that determine mappings between inputs and outputs by composing differentiable functions into any number of directed acyclic graphs [72]. The simplest of these arrangements is a chain called a feed-forward neural network or multilayer perceptron (MLP), which is one of the most suitable ML techniques for structured or tabular data as it assumes the input is a fixed-dimensional vector [72]. Moreover, as a supervised ML technique, MLPs can be applied to a wide variety of classification and regression tasks. There are many great resources that cover the mathematical and probabilistic underpinnings of the MLP algorithm, e.g., [61,63,72,73]; as such, this overview is presented from more of an applied perspective.
At a high level, an MLP can be defined as any feed-forward network comprising at least three layers: the input layer, the hidden layer(s) and the output layer. While the classification of MLPs is somewhat arbitrary, most practitioners consider networks with just one hidden layer as “shallow” and those with two or more as “deep learning” models. Each hidden layer in an MLP is fully connected to the preceding and proceeding layers via a series of nodes, or neurons, as shown in Figure A2a. The nodes in the input and output layers correspond to the column-wise features in the dataset and the target variable(s) for classification or regression, respectively. Each neuron in the hidden layer(s) acts as an individual perceptron, a local function of its inputs, and connection weights, [61]. Analogous to neurons “firing” in the brain, the decision to activate an artificial neuron is based on the weighted sum of all inputs (+ a fixed nonzero bias term, ), which is then fed through an activation (i.e., threshold) function to determine the output, [61,63] (Figure A2b; modified after [74]).
Figure A2.
Schematic diagrams of a feed-forward artificial neural network at the (a) model architecture and (b) neuron levels (modified after [74]).
Figure A2.
Schematic diagrams of a feed-forward artificial neural network at the (a) model architecture and (b) neuron levels (modified after [74]).
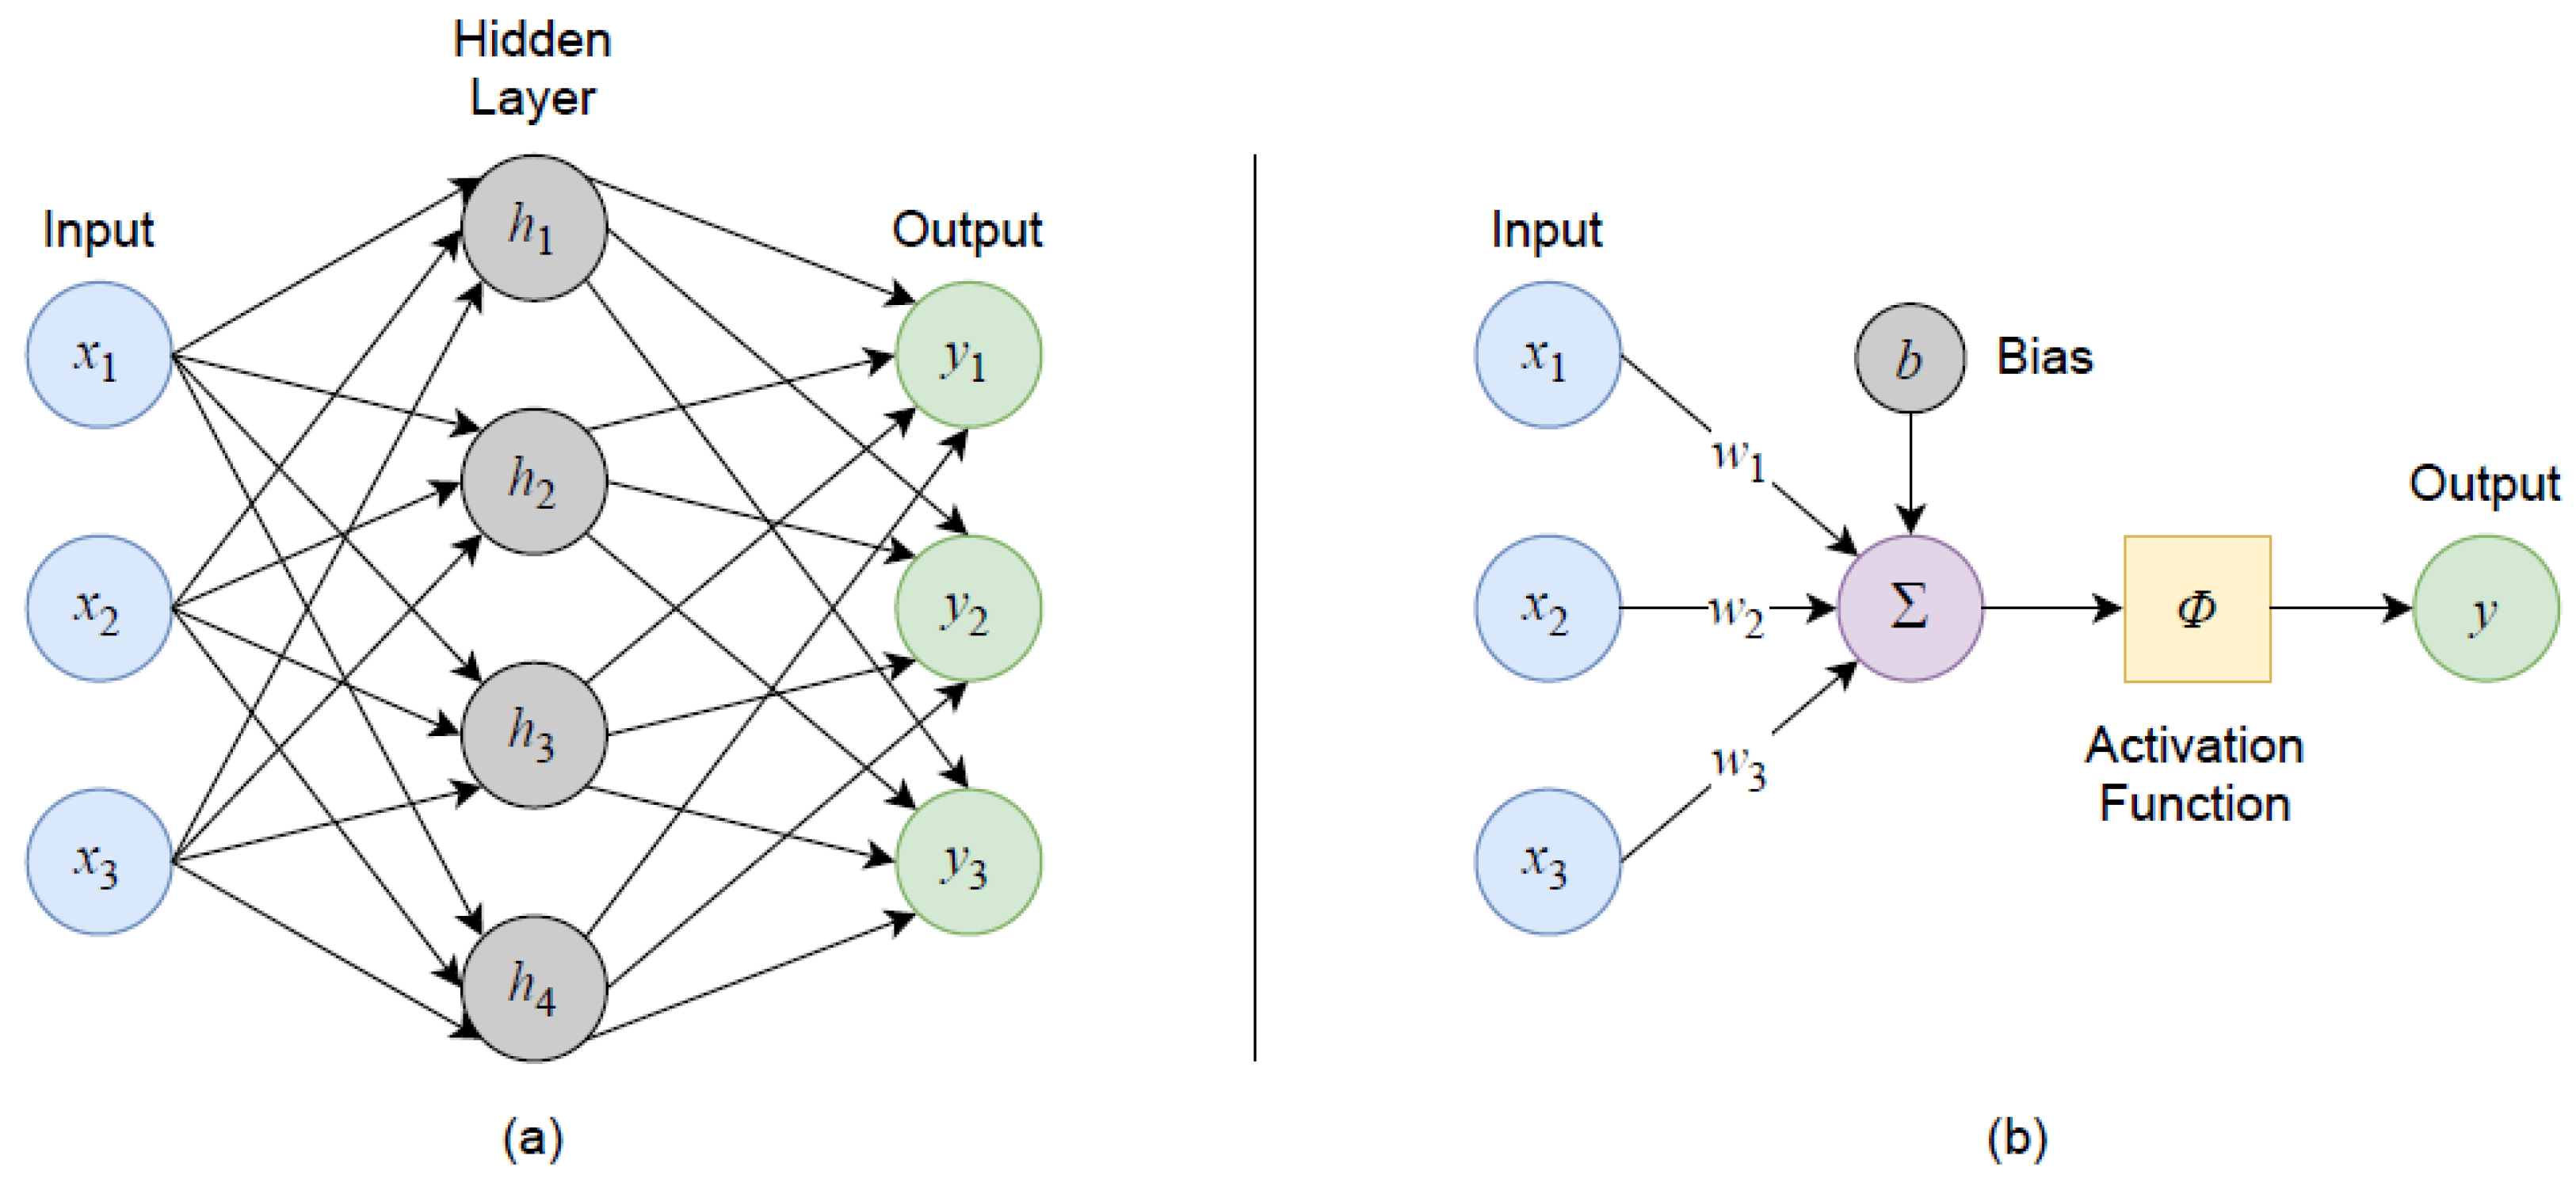
In general, MLPs can use either linear or nonlinear activation functions [73]. However, because the final target output is a linear combination of the basis function values computed by the hidden perceptron units, the hidden layers would not be useful if their intermediate outputs were also linear [61]. In other words, the hidden units can typically be thought of as making a nonlinear transformation of the initial sample inputs, which are then linearly combined by the final output layer. The basic functioning of the MLP algorithm can be summarized as follows (after [63]):
- A vector of structured data is fed into the nodes of the input layer;
- The inputs are propagated forward through the network, i.e., there are no cyclic connections that allow direct feedback to current or preceding layers;
- The inputs and weights to each layer are used to determine whether each node will be activated or not, following the artificial neuron model described above;
- The final network outputs are used to compute an error metric with respect to the known (labeled) target data;
- This error is propagated backwards through the network to successively update the weights of each preceding layer prior to the next iteration of sample data processing.
The last step in this sequence, known as backpropagation, is fundamental to the training of the neural network, i.e., it is how the model “learns”. Backpropagation is an optimization algorithm that aims to minimize a selected loss function by approximating the gradient of the error resulting from the network outputs via the chain rule and following it downslope [61,63,72]. Essentially, a model is said to have “converged” to a solution once the loss has settled within an acceptable error range, i.e., further training will not improve model performance.
While steepest gradient descent is generally an effective approach to optimization problems, it can only guarantee finding a local minimum. As a result, variations of the algorithm have been developed to help avoid getting stuck in local optima. MLPs were originally designed as a batch algorithm, in which all of the training samples are passed through the network prior to computing the average error; weight updates are thus only carried out once per epoch, defined as one iteration through the entire training set [63]. Alternatively, stochastic gradient descent (SGD) sequentially calculates the error and updates weights accordingly following each individual training sample. Though not as efficient as the batch method, SGD is better at avoiding local minima due to a higher degree of error inherent to each gradient estimate being based on a single input vector [63]. SGD is also not as computationally expensive as the batch approach, which is a consideration for larger datasets. A balanced approach between these two extremes is to use minibatches, wherein error computations and weight updates occur following the iterative passing of randomly selected training sample subsets of predetermined size.
In the basic SGD algorithm, learning rate, , is essentially the only hyperparameter that can be “tuned” to improve model performance. The learning rate, i.e., step size, is an important term (generally in the range of 0 to 1) in the weight update rule that controls how fast the network learns. Whereas an overly large learning rate can lead to model instability, an overly small learning rate can result in underfitting; in either case, the model is likely to fail to converge [72]. A simple approach to select a static learning rate is to begin with a small value (e.g., 0.00001) and increase it by order of magnitude, meanwhile evaluating performance in terms of overall model loss. Once a reasonable range has been established, smaller increments can be tested to identify an “optimal” value with the lowest loss. However, the learning rate does not need to remain constant; more elaborate methods also implement scheduled or adaptive learning rate approaches [72].
There are also a number of stochastic optimization variants that can increase the likelihood of finding the global minimum, in addition to accelerating the rate of convergence. One of the most important advances in SGD formulation is the inclusion of a momentum term, . By analogy, a rolling object is less likely to run out of energy and get stuck in a small valley (i.e., a local minimum) with the extra weight needed to generate enough momentum to get over the next hill. This concept is implemented into the neural network by including a portion from the previous weight change (commonly by a factor of 0.9) to the current update. Not only is the object now less prone to getting trapped in local minima, but it is more likely to find the global optimum by moving more directly to the “valley bottom” [63]. As shown in Figure A3, this can stabilize the optimization pathway by reducing the effect of oscillations, thereby improving and accelerating overall convergence.
Figure A3.
Schematic gradient contour map comparing SGD without (blue dotted line) and with (green solid line) momentum. Note the reduction in oscillations in the second case, which helps avoid local minima by taking a more direct path to the valley bottom, thus improving and accelerating convergence.

Other well-known extensions to SGD include the adaptive gradient (AdaGrad) [75], root-mean-squared propagation (RMSProp) [76] and adaptive moment estimation (Adam) [77] optimization algorithms. Unlike momentum-assisted SGD, which relies on first moment gradient estimates, these methods utilize second moment estimates of the gradients coupled with adaptive learning rates (AdaGrad) and decay rates (RMSProp) to handle sparse data features and speed up convergence, respectively [77]. The Adam optimizer combines these approaches by using both first and second moment gradient estimates to implement momentum, adaptive learning rates and decay rates; as such, Adam is one of the most popular ML optimization algorithms in use today [78]. However, while adaptive optimizers have been a recent area of research interest to accelerate model training, they do not generalize as well as momentum-assisted SGD, and may even fail to converge due to certain instabilities and extreme learning rates [79].
Appendix B.3. MLP Design, Training and Mining Applications
There are also a number of other factors to consider in the design and implementation of any MLP. Network architecture, which includes the number of hidden layers and associated hidden nodes, is critical to building a valid and generalizable model. It has been shown that an MLP with just one hidden layer can approximate any continuous function to any target level of accuracy, provided a sufficient number of hidden nodes; this is called the universal approximation theorem [72,80]. However, there are a variety of studies that show deep networks work better than shallow ones because the deeper layers can take advantage of features already learned by shallow layers [72]. There is no steadfast rule to guide depth selection, but very complex problems may require deeper networks; nonetheless, Occam’s razor tells us that we should prefer the simplest model capable of learning the problem set and approximating a solution. Unnecessarily deep networks can actually lead to overfitting of the training data, wherein the model also “learns” from background noise and therefore becomes poorly generalizable to new data. In terms of model width, i.e., the number of hidden nodes, there is no real theory to guide this selection; there are several rules of thumb in practice (e.g., ~ between the number of inputs and outputs), but ultimately the choice comes down to trial and error and observing the effect on model performance.
An MLP with a single hidden layer contains weights, where are the number of nodes in the input, hidden and output layers, respectively [63]. Depending on the problem set, this can result in an exponentially large number of weights; as such, the importance of weight initialization and choice of activation function cannot be overstated. There are a number of nonlinear activation functions that can be used in the hidden layers of an MLP, including logistic (sigmoid), hyperbolic tangent (tanh) and rectified linear unit (ReLU) functions. However, the sigmoid and tanh functions are often subject to the “vanishing gradient” problem. This occurs because the error is propagated through a series of layers which sequentially diminish the gradients towards zero, thereby saturating the weights and causing improper weight updates [72,81]; in other words, the model does not get properly trained, resulting in poor performance.
ReLU addresses this issue by effectively turning off negative inputs and only passing unchanged positive values [72]; it has also been shown to perform significantly faster [81] and is thus the most commonly employed activation function in neural networks. A limitation can occur when a large portion of the inputs are forced to zero, thereby rendering the corresponding neurons inactive, which means a significant portion of the input may not contribute to network training; this is known as the “dead ReLU” problem. Variants, such as leaky ReLU (LReLU) or parametric ReLU (PreLU), have been devised in response [72,81]. Before training a neural network, the weights must also be initialized to small random values; to this end, there are two methods that are widely used in practice, including Xavier initialization [82] and He (or Kaiming) initialization [83]. Both approaches can be implemented using either normal or uniform distributions and have been shown as effective weight initialization techniques for training shallow neural networks. However, He initialization was developed specifically for use with nonlinear ReLU activation functions, and is particularly suitable for deeper networks [81,83].
As noted above, overfitting is a major concern for training any type of neural network. Aside from appropriate model architecture, there are several tools available to limit the effects of statistical noise in training data and improve overall model generalization. Weight regularization is likely the most commonly used approach to control excessive gradient fluctuations. There are two main techniques, namely L1 and L2 regularization, i.e., lasso and ridge regression, respectively. In lasso regression, the L1-norm (absolute values) of the weights is added as a penalty term to the error function; in ridge regression, the penalty term is replaced by the L2-norm (squared values) of the weights [72]. In either case, a rate constant, , is multiplied by the penalty term and acts as a hyperparameter that can be tuned by the user to adjust the regularization effect. In practice, lasso regression tends to force the weight coefficients of some features to zero and is therefore useful for feature selection; ridge regression diminishes the coefficients towards (close to but not exactly) zero more evenly among features and is thus useful for problems dealing with multicollinear input variables [72]. Moreover, these “weight decay” methods can also help mitigate the effects of the “exploding gradient” problem, wherein similar to vanishing gradients, the propagation of error through several layers can amplify the size of gradients to levels that cause numerical instabilities or simply fail to converge [72].
Another form of regularization common to neural networks is known as “dropout”. In this technique, nodes and their connections are randomly dropped (i.e., deactivated) from the network during training, which helps prevent coadaptation [72,84]. A tuning hyperparameter allows the user to specify the probability with which outputs are dropped from each layer. As a result, the model learns from a number of thinned networks (akin to subsampling), thereby reducing the effects of overfitting to training data noise. The approach has been shown to yield significant improvements over other types of regularization, with state-of-the-art results obtained on many benchmark datasets [84].
Finally, training length is also an important consideration to combat overfitting. Neural network training typically involves the splitting of available labeled data into training and validation subsets. These splits should be selected at random but can also be stratified for datasets with constraints imposed by different sample types. In practice, 80–20 training–validation splits are common, but other techniques, such as -fold cross-validation, are also widely used to further minimize bias. The training set is used for fitting the model, i.e., learning, meanwhile the validation set is retained for model selection. Training and validation losses are then tracked for each epoch during training. The model continues to learn as long as training loss is decreasing across epochs. Validation loss should follow a similar trend; however, a reversal is a strong indicator that the model is beginning to overfit the training data. It is at this point that the training should be stopped, and the selected model should include the maximum number of training epochs prior to the change in validation loss sign. This final model can then be applied to unseen test sets, keeping the model completely blind to the target output variable labels to evaluate future performance and generalization, or newly generated data altogether.
Research into ANN applications in the mining industry has exploded across the entire value chain over the past two decades. Recent reviews have shown that neural networks and deep learning models account for ~25% of all ML approaches used in the mining space, with support vector machines (23%) and ensemble methods (22%) close behind [67]. ANNs have been especially useful in mineral resource estimation (e.g., [85,86,87]), comprising ~46% of the ML techniques used in this area [68]. Other prominent applications include mineral prospecting and mapping [88,89], geophysics and remote sensing [90,91], ore classification [92,93], drilling and blasting operations [94,95], mining method selection, equipment utilization and production planning [96,97], ore beneficiation and mineral recovery [98,99] and mine site reclamation [100,101], among others.
As previously noted, this work is focused on the integration of a predictive ANN model (specifically the MLP algorithm) into a DES framework for the regional development of multiple gold ore sources using a centralized processing facility. The overall architecture is such that predicted outputs from the ANN model are used to classify the various ore feeds, which are then fed into the DES framework to design and evaluate control strategies in response to geological uncertainty.
References
- S&P Global. Gold Price Increase Drives Surge of Smaller Discoveries. Available online: https://www.spglobal.com/marketintelligence/en/news-insights/research/gold-price-increase-drives-surge-of-smaller-discoveries (accessed on 8 July 2021).
- Schodde, R. Recent trends in gold discovery. In Proceedings of the 2011 NewGenGold Conference, Perth, Australia, 22–23 November 2011. [Google Scholar]
- Mudd, G.M. Global trends in gold mining: Towards quantifying environmental and resource sustainability? Resour. Policy 2007, 32, 42–56. [Google Scholar] [CrossRef]
- Metals Focus. Gold Focus 2020; Metals Focus: London, UK, 2020. [Google Scholar]
- Adams, M.D. Overview of the Gold Mining Industry and Major Gold Deposits. In Gold Ore Processing—Project Development and Operations; Adams, M.D., Ed.; Elsevier B.V.: Cambridge, MA, USA, 2016; pp. 25–30. [Google Scholar]
- World Gold Council. Available online: https://www.gold.org/ (accessed on 8 November 2021).
- Tabelin, C.B.; Park, I.; Phengsaart, T.; Jeon, S.; Villacorte-Tabelin, M.; Alonzo, D.; Yoo, K.; Ito, M.; Hiroyoshi, N. Copper and critical metals production from porphyry ores and E-wastes: A review of resource availability, processing/recycling challenges, socio-environmental aspects, and sustainability issues. Resour. Conserv. Recycl. 2021, 170, 105610. [Google Scholar] [CrossRef]
- Forti, V.; Baldé, C.P.; Bel, G. The Global E-Waste Monitor 2020: Quantities, Flows and the Circular Economy Potential; United Nations University: Bonn, Germany; United Nations Institute for Training and Research, International Telecommunication Union: Geneva, Switzerland; International Solid Waste Association: Rotterdam, The Netherlands, 2020. [Google Scholar]
- Ng, W.S.; Wang, Q.; Chen, M. A review of preg-robbing and the impact of chloride ions in the pressure oxidation of double refractory ores. Miner. Process. Extr. Metall. Rev. 2020, 43, 69–96. [Google Scholar] [CrossRef]
- Marsden, J.; House, I. The Chemistry of Gold Extraction; Society for Mining, Metallurgy & Exploration (SME): Englewood, CO, USA, 2006. [Google Scholar]
- Baron, J.Y.; Choi, Y.; Jeffrey, M. Double-Refractory Carbonaceous Sulfidic Gold Ores. In Gold Ore Processing—Project Development and Operations; Elsevier B.V.: Cambridge, MA, USA, 2016; pp. 909–918. [Google Scholar]
- Kusebauch, C.; Gleeson, S.A.; Oelze, M. Coupled partitioning of Au and As into pyrite controls formation of giant Au deposits. Sci. Adv. 2019, 5, 1–8. [Google Scholar] [CrossRef] [PubMed] [Green Version]
- Reich, M.; Kesler, S.E.; Utsunomiya, S.; Palenik, C.S.; Chryssoulis, S.L.; Ewing, R.C. Solubility of gold in arsenian pyrite. Geochim. Cosmochim. Acta 2005, 69, 2781–2796. [Google Scholar] [CrossRef]
- Afidenyo, J.K. Microbial Pre-Treatment of Double Refractory Gold Ores. Master’s Thesis, Queen’s University, Kingston, ON, Canada, 2008. [Google Scholar]
- McKinsey & Company. Refractory Gold Ores: Challenges and Opportunities for a Key Source of Growth. Available online: https://www.mckinsey.com/industries/metals-and-mining/our-insights/refractory-gold-ores-challenges-and-opportunities-for-a-key-source-of-growth (accessed on 10 November 2021).
- Wotruba, H.; Robben, C. Sensor-based ore sorting in 2020. Automatisierungstechnik 2020, 68, 231–238. [Google Scholar] [CrossRef]
- Robben, C.; Wotruba, H. Sensor-Based Ore Sorting Technology in Mining—Past, Present and Future. Minerals 2019, 9, 523. [Google Scholar] [CrossRef] [Green Version]
- Kern, M.; Tusa, L.; Leibner, T.; van den Boogaart, K.G.; Gutzmer, J. Optimal sensor selection for sensor-based sorting based on automated mineralogy data. J. Clean. Prod. 2019, 234, 1144–1152. [Google Scholar] [CrossRef]
- Tomra Sorting GmbH. XRT Sorting Technology Adds Value to Your Sulphide-Associated Gold Mining. Available online: https://www.tomra.com/en/sorting/mining/segments/non-ferrous-metal-sorting/gold/sulphide-associated-gold (accessed on 10 November 2021).
- GlobeNewswire. Osisko Development Announces Ore Sorting Test Results Significantly Increase Concentrator and Mill Grades While Reducing Carbon Footprint, Water and Land Use. Available online: https://www.globenewswire.com/en/news-release/2021/04/22/2215030/0/en/Osisko-Development-Announces-Ore-Sorting-Test-Results-Significantly-Increase-Concentrator-and-Mill-Grades-While-Reducing-Carbon-Footprint-Water-and-Land-Use.html (accessed on 10 November 2021).
- International Mining. COREM, Steinert Ore Sorting Tests Present Opportunities for Cartier at Chimo Gold Project. Available online: https://im-mining.com/2021/04/09/corem-steinert-ore-sorting-tests-present-opportunities-for-cartier-at-chimo-gold-project/ (accessed on 10 November 2021).
- Gowest Gold Ltd. NI 43-101 Technical Report and Prefeasibility Study for the Bradshaw Gold Deposit, Timmins, Ontario; TSX Group Inc.: Toronto, ON, Canada, 2015. [Google Scholar]
- Navarra, A.; Alvarez, M.; Rojas, K.; Menzies, A.; Pax, R.; Waters, K. Concentrator operational modes in response to geological variation. Miner. Eng. 2019, 134, 356–364. [Google Scholar] [CrossRef]
- Saldaña, M.; Toro, N.; Castillo, J.; Hernandez, P.; Navarra, A. Optimization of the heap leaching process through changes in modes of operation and discrete event simulation. Minerals 2019, 9, 421. [Google Scholar] [CrossRef] [Green Version]
- Wilson, R.; Toro, N.; Naranjo, O.; Emery, X.; Navarra, A. Integration of geostatistical modeling into discrete event simulation for development of tailings dam retreatment applications. Miner. Eng. 2021, 164, 106814. [Google Scholar] [CrossRef]
- Atreya, H.N.; Sridhar, S. Using Discrete Event Simulation as a Step Towards Creating a Digital Twin; Department of Industrial and Materials Science, Chalmers University of Technology: Gothenburg, Sweden, 2019. [Google Scholar]
- Greasley, A. Architectures for Combining Discrete-event Simulation and Machine Learning. In Proceedings of the 10th International Conference on Simulation and Modeling Methodologies, Technologies and Applications (SIMULTECH 2020), Lieusaint, France, 8–10 July 2020. [Google Scholar]
- Lektauers, A.; Pecherska, J.; Bolshakov, V.; Romanovs, A.; Grabis, J.; Teilans, A. A Multi-Model Approach for Simulation-Based Digital Twin in Resilient Services. WSEAS Trans. Syst. Control 2021, 16, 133–145. [Google Scholar] [CrossRef]
- Glaessgen, E.H.; Stargel, D.S. The digital twin paradigm for future NASA and U.S. Air Force Vehicles. In Proceedings of the 53rd Structures, Structural Dynamics, and Materials Conference, Honolulu, HI, USA, 23–26 April 2012; American Institute of Aeronautics and Astronautics: Reston, VA, USA, 2012. [Google Scholar]
- Boschert, S.; Rosen, R. Digital Twin—The Simulation Aspect. In Mechatronic Futures; Hehenberger, P., Bradley, D., Eds.; Springer International Publishing: Cham, Switzerland, 2016; pp. 59–74. [Google Scholar]
- Patterson, L.M.; Muntean, J.L. Multi-element geochemistry across a Carlin-type gold district Jerritt Canyon, Nevada. In Proceedings of the Great Basin Evolution and Metallogeny—Geological Society of Nevada Symposium 2010 Proceedings, Reno, NV, USA, 14–22 May 2010; Steininger, R.C., Pennell, W.M., Eds.; DEStech Publications, Inc.: Lancaster, PA, USA, 2011; pp. 1119–1151. [Google Scholar]
- Christiansen, W.N.; Hofstra, A.H.; Zohar, P.B.; Tousignant, G. Geochemical and Stable Isotopic Data on Barren and Mineralized Drill Core in the Devonian Popovich Formation, Screamer Sector of the Betze-Post Gold Deposit, Northern Carlin Trend, Nevada: U.S. Geological Survey Open-File Report 2010-1077; U.S. Geological Survey: Reston, VA, USA, 2011.
- Li, Z.; Peters, S.G. Comparative Geology and Geochemistry of Sedimentary-Rock-Hosted (Carlin-Type) Gold Deposits in the People’s Republic of China and in Nevada, USA: U.S. Geological Survey Open-File Report 98–466; U.S. Geological Survey: Reston, VA, USA, 1998.
- Bao, Z. Geochemistry of the Sediment-Hosted Disseminated Gold Deposits in Southwestern Guizhou Province, China. Ph.D. Thesis, Université du Québec à Chicoutimi, Chicoutimi, QC, Canada, 2001. [Google Scholar]
- Hermann, W.; Berry, R.F. MINSQ—A least squares spreadsheet method for calculating mineral proportions from whole rock major element analyses. Geochem. Explor. Environ. Anal. 2002, 2, 361–368. [Google Scholar] [CrossRef]
- Órdenes, J.; Wilson, R.; Peña-Graf, F.; Navarra, A. Incorporation of geometallurgical input into gold mining system simulation to control cyanide consumption. Minerals 2021, 11, 1023. [Google Scholar] [CrossRef]
- Navarra, A.; Marambio, H.; Oyarzun, F.; Parra, R.; Mucciardi, F. System dynamics and discrete event simulation of copper smelters. Miner. Metall. Process 2017, 34, 96–106. [Google Scholar] [CrossRef]
- Navarra, A.; Rafiei, A.; Waters, K. A systems approach to mineral processing based on mathematical programming. Can. Metall. Q. 2017, 56, 35–44. [Google Scholar] [CrossRef]
- Navarra, A.; Wilson, R.; Parra, R.; Toro, N.; Ross, A.; Nave, J.-C.; Mackey, P.J. Quantitative methods to support data acquisition modernization within copper smelters. Processes 2020, 8, 1478. [Google Scholar] [CrossRef]
- Wilson, R.; Mercier, P.H.J.; Patarachao, B.; Navarra, A. Partial Least Squares Regression of Oil Sands Processing Variables Within Discrete Event Simulation Digital Twin. Minerals 2021, 11, 689. [Google Scholar] [CrossRef]
- Saldaña, M.; Neira, P.; Flores, V.; Moraga, C.; Robles, P.; Salazar, I. Analysis of the Dynamics of Rougher Cells on the Basis of Phenomenological Models and Discrete Event Simulation Framework. Metals 2021, 11, 1454. [Google Scholar] [CrossRef]
- Wilson, R.; Perez, K.; Toro, N.; Parra, R.; Mackey, P.J.; Navarra, A. Mine-to-smelter integration framework for regional development of porphyry copper deposits within the Chilean context. Can. Metall. Q. 2021, 61, 48–62. [Google Scholar] [CrossRef]
- Awuah-Offei, K.; Osei, B.A.; Askari-Nasab, H. Improving truck-shovel energy efficiency through discrete event modeling. In Proceedings of the 2012 SME Annual Meeting and Exhibit, Seattle, WA, USA, 19–22 February 2012; Society for Mining, Metallurgy & Exploration Inc. (SME): Englewood, CO, USA, 2012; pp. 1–6. [Google Scholar]
- Gbadam, E.; Awuah-Offei, K.; Frimpong, S. Investigation into Mine Equipment Subsystem Availability & Reliability Data Modeling Using DES. In Application of Computers and Operations Research in the Mineral Industry; Bandopadhyay, S., Ed.; Society for Mining, Metallurgy & Exploration, Inc. (SME): Englewood, CO, USA, 2015. [Google Scholar]
- Greberg, J.; Salama, A.; Gustafson, A.; Skawina, B. Alternative process flow for underground mining operations: Analysis of conceptual transport methods using discrete event simulation. Minerals 2016, 6, 65. [Google Scholar] [CrossRef] [Green Version]
- Vagenas, N. Applications of discrete-event simulation in Canadian mining operations in the nineties. Int. J. Surf. Min. Reclam. Environ. 1999, 13, 77–78. [Google Scholar] [CrossRef]
- Pamparana, G.; Kracht, W.; Haas, J.; Diaz-Ferran, G.; Palma-Behnke, R.; Roman, R. Integrating photovoltaic solar energy and a battery energy storage system to operate a semi-autogenous grinding mill. J. Clean. Prod. 2017, 165, 273–280. [Google Scholar] [CrossRef]
- Nageshwaraniyer, S.; Kim, K.; Son, Y.J. A mine-to-mill economic analysis model and spectral imaging-based tracking system for a copper mine. J. S. Afr. I Min. Metall. 2018, 118, 7–14. [Google Scholar] [CrossRef]
- Ali, D.; Frimpong, S. Artificial intelligence, machine learning and process automation: Existing knowledge frontier and way forward for mining sector. Artif. Intell. Rev. 2020, 53, 6025–6042. [Google Scholar] [CrossRef]
- McCoy, J.T.; Auret, L. Machine learning applications in minerals processing: A review. Miner. Eng. 2019, 132, 95–109. [Google Scholar] [CrossRef]
- Cisternas, L.A.; Lucay, F.A.; Botero, Y.L. Trends in Modeling, Design, and Optimization of Multiphase Systems in Minerals Processing. Minerals 2019, 10, 22. [Google Scholar] [CrossRef] [Green Version]
- Lidberg, S.; Aslam, T.; Pehrsson, L.; Ng, A.H.C. Optimizing real-world factory flows using aggregated discrete event simulation modelling. Flex. Serv. Manuf. 2020, 32, 888–912. [Google Scholar] [CrossRef] [Green Version]
- Sobottka, T.; Kamhuber, F.; Faezirad, M.; Sihn, W. Potential for Machine Learning in Optimized Production Planning with Hybrid Simulation. Procedia Manuf. 2019, 39, 1844–1853. [Google Scholar] [CrossRef]
- Koch, P.-H.; Rosenkranz, J. Sequential decision-making in mining and processing based on geometallurgical inputs. Miner. Eng. 2020, 149, 106262. [Google Scholar] [CrossRef]
- Qaeze, F.; Guillaume, R.; Thierry, C. A Collaborative Planning Model to Coordinate Mining and Smelting Furnace. In Proceedings of the 16th Working Conference on Virtual Enterprises (PROVE), Albi, France, 5–7 October 2015; Springer: Cham, Switzerland, 2015. [Google Scholar]
- Resman, M.; Protner, J.; Simic, M.; Herakovic, N. A Five-Step Approach to Planning Data-Driven Digital Twins for Discrete Manufacturing Systems. Appl. Sci. 2021, 11, 3639. [Google Scholar] [CrossRef]
- Singh, M.; Fuenmayor, E.; Hinchy, E.P.; Qiao, Y.; Murray, N.; Devine, D. Digital Twin: Origin to Future. Appl. Syst. Innov. 2021, 4, 36. [Google Scholar] [CrossRef]
- Peña-Graf, F.; Órdenes, J.; Wilson, R.; Navarra, A. Discrete Event Simulation for Machine-Learning Enabled Mine Production Control with Application to Gold Processing. Metals 2022, 12, 225. [Google Scholar] [CrossRef]
- Camm, T.W.; Stebbins, S.A. Simplified Cost Models for Underground Mine Evaluation: A Handbook for Quick Prefeasibility Cost Estimates; Mining Engineering Department—Montana Technological University: Butte, MT, USA, 2020. [Google Scholar]
- Poole, D.L.; Mackworth, A.K.; Goebel, R. Computation Intelligence: A Logical Approach; Oxford University Press: New York, NY, USA, 1998. [Google Scholar]
- Alpaydin, E. Introduction to Machine Learning, 3rd ed.; The MIT Press: Cambridge, MA, USA, 2014. [Google Scholar]
- Schmidt, J.; Marques, M.R.G.; Botti, S.; Marques, M.A.L. Recent advances and applications of machine learning in solid-state materials science. Comput. Mater. 2019, 5, 83. [Google Scholar] [CrossRef]
- Marsland, S. Machine Learning: An Algorithmic Perspective, 3rd ed.; CRC Press (Taylor & Francis Group, LLC): Boca Raton, FL, USA, 2015. [Google Scholar]
- Wuest, T.; Weimer, D.; Irgens, C.; Thoben, K.-D. Machine learning in manufacturing: Advantages, challenges, and applications. Prod. Manuf. Res. 2016, 4, 23–45. [Google Scholar] [CrossRef] [Green Version]
- Chaudhary, S.; Yadav, S.; Kushwaha, S.; Shahi, S.R.P. A Brief Review of Machine Learning and its Applications. SAMRIDDHI J. Phys. Sci. Eng. Technol. 2020, 12 (Suppl. S1), 218–223. [Google Scholar]
- Narendran, T.V.; Weinelt, B. Digital Transformation Initiative—Mining and Metals Industry; World Economic Forum: Cologny/Geneva; Switzerland, 2017. [Google Scholar]
- Jung, D.; Choi, Y. Systematic Review of Machine Learning Applications in Mining: Exploration, Exploitation, and Reclamation. Minerals 2021, 11, 148. [Google Scholar] [CrossRef]
- Dumakor-Dupey, N.K.; Arya, S. Machine Learning—A Review of Applications in Mineral Resource Estimation. Energies 2021, 14, 4079. [Google Scholar] [CrossRef]
- Jang, H.; Topal, E. A review of soft computing technology applications in several mining problems. Appl. Soft Comput. 2014, 22, 638–651. [Google Scholar] [CrossRef]
- Fahle, S.; Prinz, C.; Kuhlenkötter, B. Systematic review on machine learning (ML) methods for manufacturing processes—Identifying artificial intelligence (AI) methods for field application. Procedia CIRP 2020, 93, 413–418. [Google Scholar] [CrossRef]
- Carvalho, T.P.; Soares, F.A.A.M.N.; Vita, R.; Francisco, R.D.P.; Basto, J.P.; Alcalá, S.G.S. A systematic literature review of machine learning methods applied to predictive maintenance. Comput. Ind. Eng. 2019, 137, 106024. [Google Scholar] [CrossRef]
- Murphy, K.V. Probabilistic Machine Learning—An Introduction; The MIT Press: Cambridge, MA, USA, 2022. [Google Scholar]
- Goodfellow, I.; Bengio, Y.; Courville, A. Deep Learning; The MIT Press: Cambridge, MA, USA, 2016. [Google Scholar]
- Emmert-Streib, F.; Yang, Z.; Feng, H.; Tripathi, S.; Dehmer, M. Introductory Review of Deep Learning for Prediction Models with Big Data. Front. Artif. Intell. 2020, 3, 1–23. [Google Scholar] [CrossRef] [PubMed] [Green Version]
- Duchi, J.; Hazan, E.; Singer, Y. Adaptive subgradient methods for online learning and stochastic optimization. J. Mach. Learn. Res. 2011, 12, 2121–2159. [Google Scholar]
- Tieleman, T.; Hinton, G. Lecture 6.5—RMSProp: Divide the Gradient by a Running Average of Its Recent Magnitude. COURSERA: Neural Netw. Mach. Learn. 2012, 4, 26–31. [Google Scholar]
- Kingma, D.P.; Ba, J.L. Adam: A Method for Stochastic Optimization. In Proceedings of the 3rd International Conference on Learning Representations (ICLR), San Diego, CA, USA, 7–9 May 2015. [Google Scholar]
- Norouzi, S.; Ebrahimi, M.R. A Survey on Proposed Methods to Address Adam Optimizer Deficiencies. Available online: http://www.cs.toronto.edu/~sajadn/sajad_norouzi/ECE1505.pdf (accessed on 1 December 2021).
- Landro, N.; Gallo, I.; La Grassa, R. Combining Optimization Methods Using an Adaptive Meta Optimizer. Algorithms 2021, 14, 186. [Google Scholar] [CrossRef]
- Hornik, K. Approximation capabilities of multilayer feedforward networks. Neural Netw. 1991, 4, 251–257. [Google Scholar] [CrossRef]
- Datta, L. A Survey on Activation Functions and their relation with Xavier and He Normal Initialization. arXiv 2020, arXiv:2001.06632. [Google Scholar]
- Glorot, X.; Bengio, Y. Understanding the difficulty of training deep feed forward neural networks. In Proceedings of the 13th International Conference on Artificial Intelligence and Statistics, Sardinia, Italy, 13–15 May 2010; Volume 9, pp. 249–256. [Google Scholar]
- He, K.; Zhang, X.; Ren, S.; Sun, J. Delving deep into rectifiers: Surpassing human-level performance on imagenet classification. In Proceedings of the IEEE International Conference on Computer Vision (ICCV), Santiago, Chile, 7–13 December 2015; IEEE Computer Society: Washington, DC, USA, 2015. [Google Scholar]
- Srivastava, N.; Hinton, G.; Krizhevsky, A.; Sutskever, I.; Salakhutdinov, R. Dropout: A Simple Way to Prevent Neural Networks from Overfitting. J. Mach. Learn. Res. 2014, 15, 1929–1958. [Google Scholar]
- Jalloh, A.B.; Kyuro, S.; Jalloh, Y.; Barrie, A.K. Integrating artificial neural networks and geostatistics for optimum 3D geological block modeling in mineral reserve estimation: A case study. Int. J. Min. Sci. Technol. 2016, 26, 581–585. [Google Scholar] [CrossRef]
- Kaplan, U.E.; Topal, E. A New Ore Grade Estimation Using Combined Machine Learning Algorithms. Minerals 2020, 10, 847. [Google Scholar] [CrossRef]
- Abuntori, C.A.; Al-Hassan, S.; Mireku-Gyimah, D. Assessment of Ore Grade Estimation Methods for Structurally Controlled Vein Deposits—A Review. Ghana Min. J. 2021, 21, 31–44. [Google Scholar] [CrossRef]
- Leite, E.P.; de Souza Filho, C.R. Artificial neural networks applied to mineral potential mapping for copper-gold mineralization in the Carajás Mineral Province, Brazil. Geophys. Prospect. 2009, 57, 1049–1065. [Google Scholar] [CrossRef]
- Oh, H.J.; Lee, S. Application of artificial neural network for gold-silver deposits potential mapping: A case study of Korea. Nat. Resour. Res. 2010, 19, 103–124. [Google Scholar] [CrossRef]
- Du, Q.; Yasin, Q.; Ismail, A. A comparative analysis of artificial neural network and rock physics for the estimation of shear wave velocity in a highly heterogeneous reservoir. In Proceedings of the SEG 2018—88th Annual Meeting & International Exposition, Anaheim, CA, USA, 17 October 2018. [Google Scholar]
- Yadav, A.; Yadav, K.; Sircar, A. Feedforward Neural Network for joint inversion of geophysical data to identify geothermal sweet spots in Gandhar, Gujarat, India. Energy Geosci. 2021, 2, 189–200. [Google Scholar] [CrossRef]
- Xiao, D.; Li, H.; Jiang, G. Spectral and BP Neural Network Research on Classification of Iron Ore. In Proceedings of the 2019 International Conference on Artificial Intelligence and Computer Science, Wuhan, China, 12–13 July 2019; Association for Computing Machinery: New York, NY, USA, 2019. [Google Scholar]
- Yang, Y.; Li, C.; Liu, S.; Min, H.; Yan, C.; Yang, M.; Yu, J. Classification and identification of brands of iron ores using laser-induced breakdown spectroscopy combined with principal component analysis and artificial neural networks. Anal. Methods 2020, 12, 1316–1323. [Google Scholar] [CrossRef]
- Lashari, S.Z.; Takbiri-Borujeni, A.; Fathi, E.; Sun, T.; Rahmani, R.; Khazaeli, M. Drilling performance monitoring and optimization: A data-driven approach. J. Pet. Explor. Prod. Technol. 2019, 9, 2747–2756. [Google Scholar] [CrossRef] [Green Version]
- Al-Bakri, A.Y.; Sazid, M. Application of Artificial Neural Network (ANN) for Prediction and Optimization of Blast-Induced Impacts. Mining 2021, 1, 315–334. [Google Scholar] [CrossRef]
- Baek, J.; Choi, Y. Deep Neural Network for Ore Production and Crusher Utilization Prediction of Truck Haulage System in Underground Mine. Appl. Sci. 2019, 9, 4180. [Google Scholar] [CrossRef] [Green Version]
- Pham, Q.T.; Phan, T.K.D. Apply Neural Network for Improving Production Planning at Samarang Petrol Mine. Int. J. Intell. Comput. Cybern. 2016, 9, 126–143. [Google Scholar] [CrossRef]
- Wang, J.S.; Han, S. Feed-Forward neural network soft-sensor modeling of flotation process based on particle swarm optimization and gravitational search algorithm. Comput. Intell. Neurosci. 2015, 6, 1–10. [Google Scholar] [CrossRef]
- Nie, W.; Fang, J.; Wen, S.; Feng, Q.; He, Y.; Yang, X. Estimation and improvement of recovery of low grade copper oxide using sulfide activation flotation method based on GA–BPNN. Processes 2021, 9, 583. [Google Scholar] [CrossRef]
- Amato, F.; Havel, J.; Gad, A.-A. Remotely Sensed Soil Data Analysis Using Artificial Neural Networks: A Case Study of El-Fayoum Depression, Egypt. ISPRS Int. J. Geo-Inf. 2015, 4, 677–696. [Google Scholar] [CrossRef] [Green Version]
- Abaidoo, C.A.; Osei Jnr, E.M.; Arko-Adjei, A.; Prah, B.E.K. Monitoring the Extent of Reclamation of Small Scale Mining Areas Using Artificial Neural Networks. Heliyon 2019, 5, 1–21. [Google Scholar] [CrossRef] [PubMed] [Green Version]
Figure 1.
Schematic representation of the final selected MLP architecture, consisting of one hidden layer (72 nodes) arranged sequentially between the input (87 feature nodes) and output (1 target node) layers. The input features correspond to the elemental, mineralogical and gold-related variables in the generated dataset, less gold recovery, which was retained as the lone target output variable. Details on selection of the number of nodes in the hidden layer are available in Appendix B (Appendix B.3).
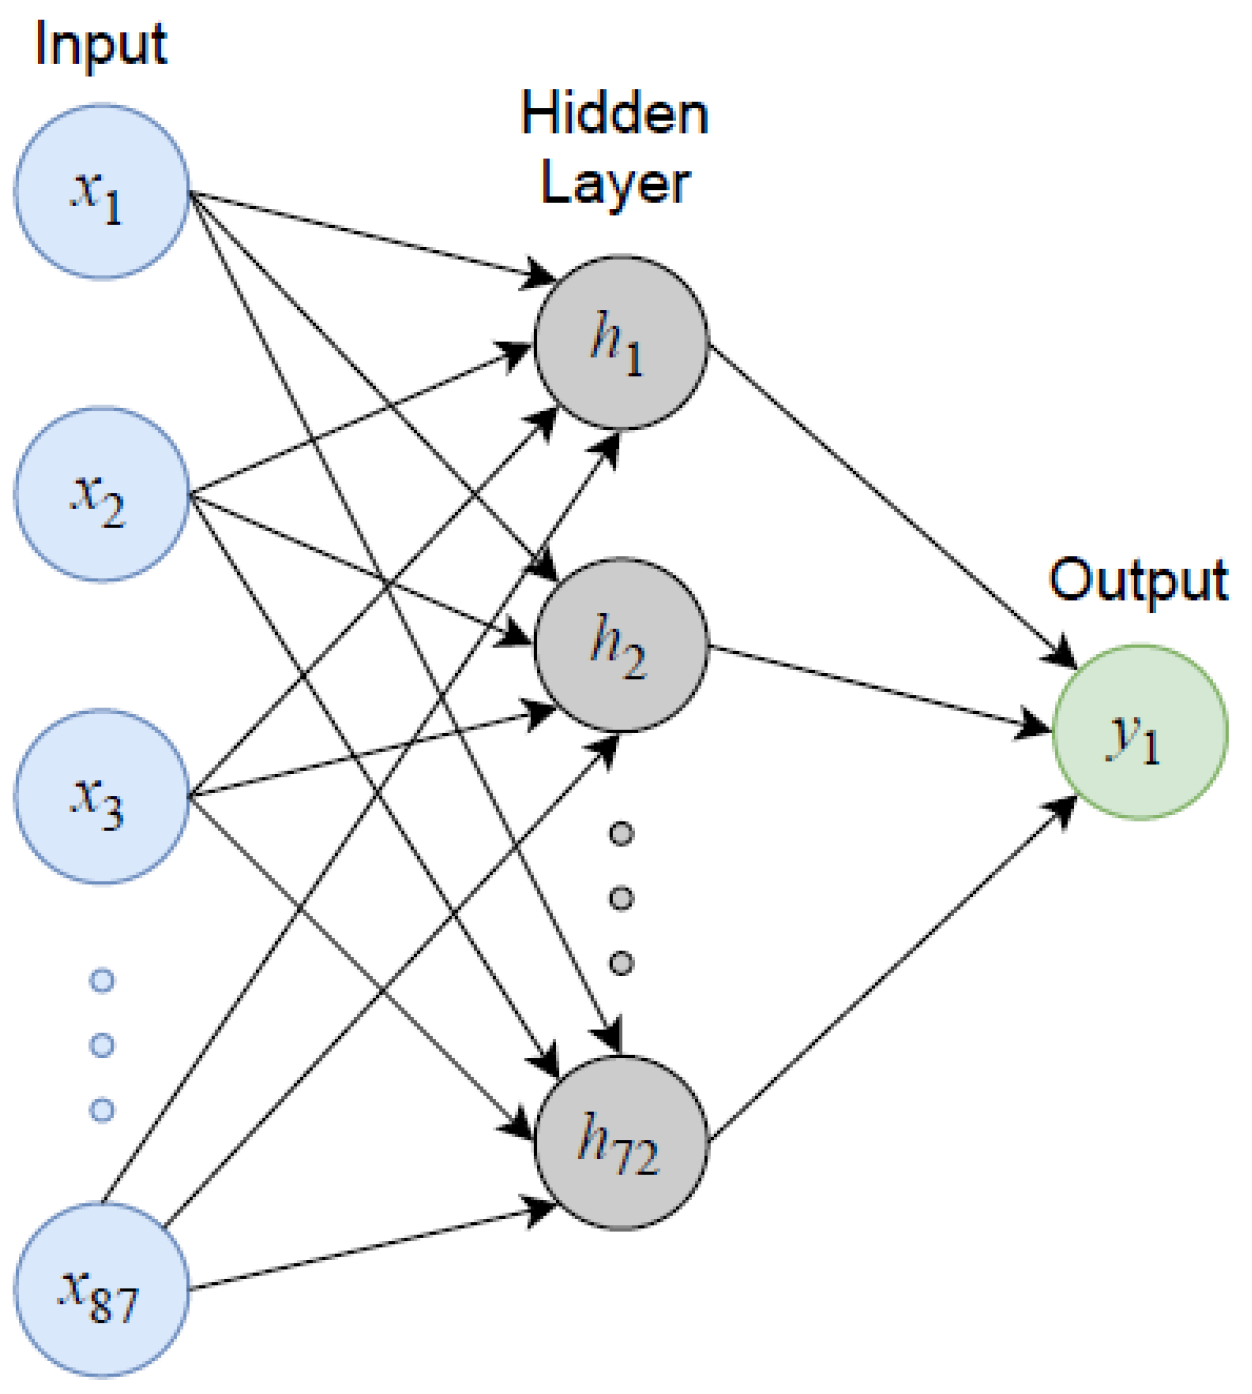
Figure 2.
Schematic flow chart showing the developed regionalized framework strategy for handling conventional and refractory gold ore sources at a central processing facility. Abbreviations: UF = ultrafine, POX = pressure oxidation.
Figure 2.
Schematic flow chart showing the developed regionalized framework strategy for handling conventional and refractory gold ore sources at a central processing facility. Abbreviations: UF = ultrafine, POX = pressure oxidation.

Figure 3.
Flow chart showing the architecture and data flows for the developed quantitative framework (modified after [40]).
Figure 3.
Flow chart showing the architecture and data flows for the developed quantitative framework (modified after [40]).

Figure 4.
Diagram illustrating the problem concept for the current set of sample calculations. Mine I refers to the producing mine with which the mill is currently integrated; Mine II refers to the satellite deposit under consideration. Expected ore compositions are only approximate and do not account for geological uncertainty.

Figure 5.
MLP regression model performance metrics for training and validation subsets, including (a) coefficients of determination () and (b) root mean-square-error (RMSE) values. Note the reversal in improvement at 500 epochs for both metrics.
Figure 5.
MLP regression model performance metrics for training and validation subsets, including (a) coefficients of determination () and (b) root mean-square-error (RMSE) values. Note the reversal in improvement at 500 epochs for both metrics.

Figure 6.
Plot of predicted vs. labeled recoveries from MLP regression on the unseen test set. Samples are sorted based on the target labels to highlight residual distances; predictive power appears best in the mid-to-upper recovery ranges (~65–95%).
Figure 6.
Plot of predicted vs. labeled recoveries from MLP regression on the unseen test set. Samples are sorted based on the target labels to highlight residual distances; predictive power appears best in the mid-to-upper recovery ranges (~65–95%).
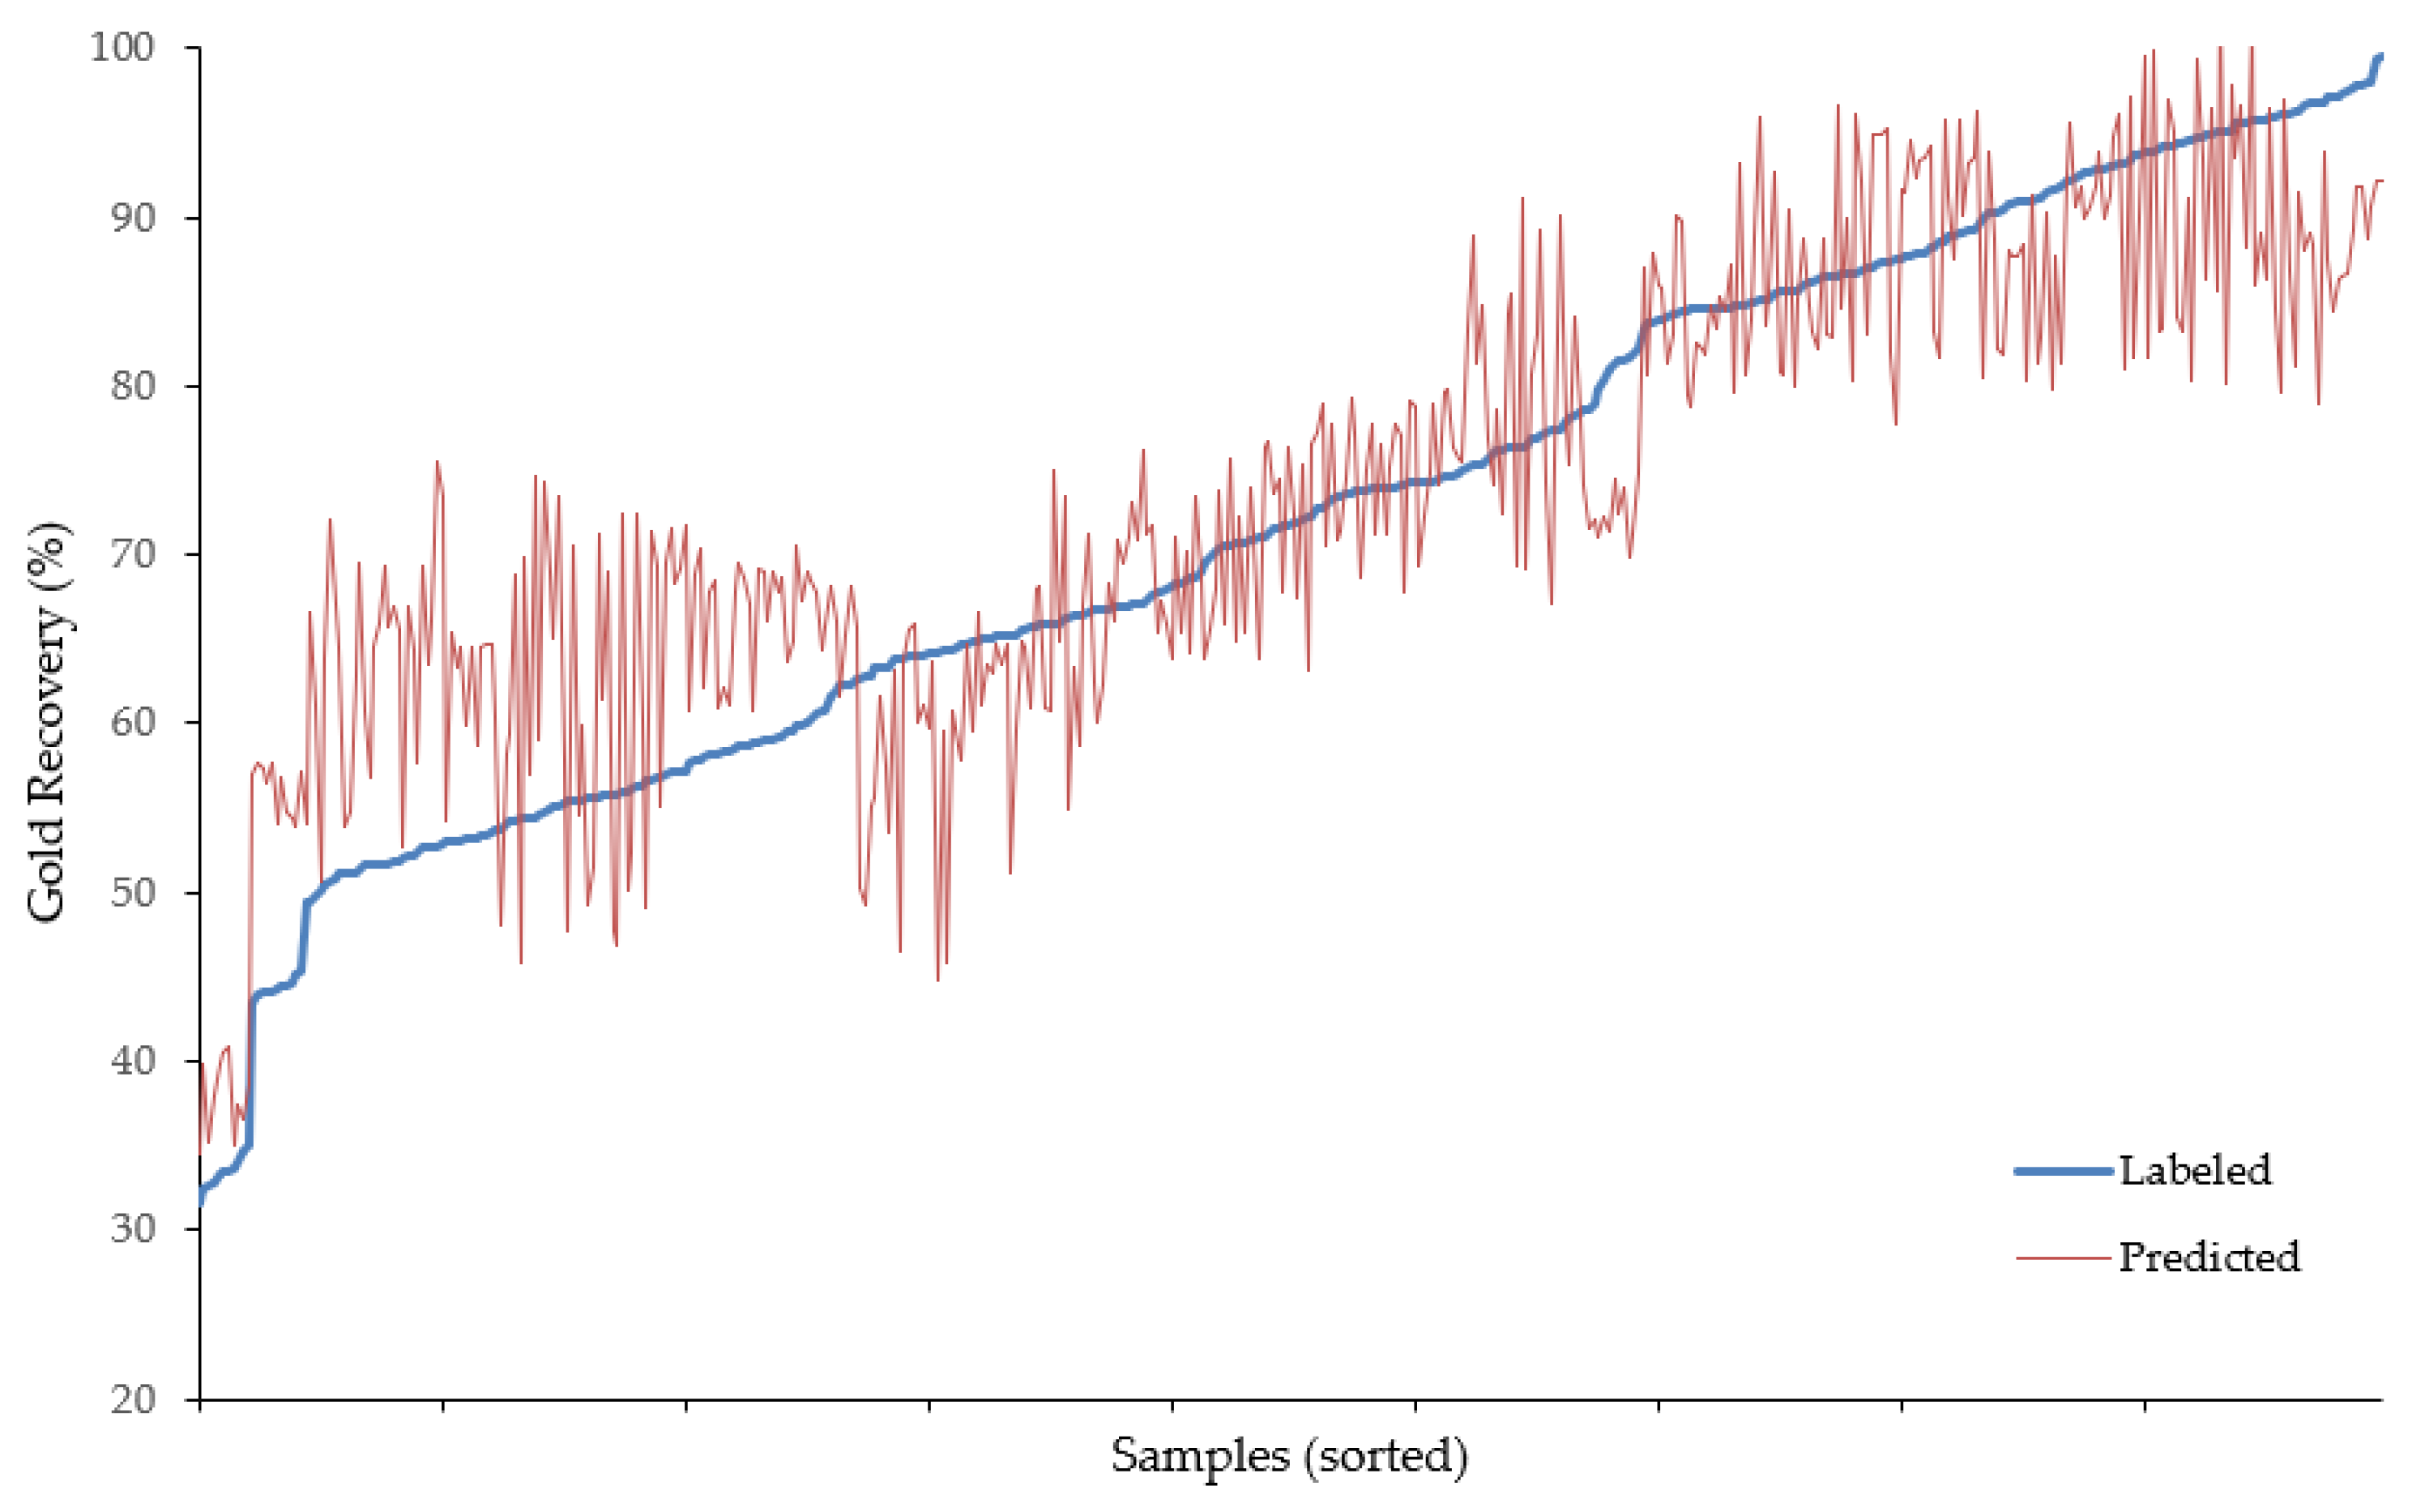
Figure 7.
Generalized flow chart of the DES framework showing decision-making logic for parcel loading and termination, operational mode changes and configuration rate changes (i.e., recourse actions). Abbreviations: ML = machine learning, TOSL = target ore stockpile level. Image from Peña-Graf et al. [58].
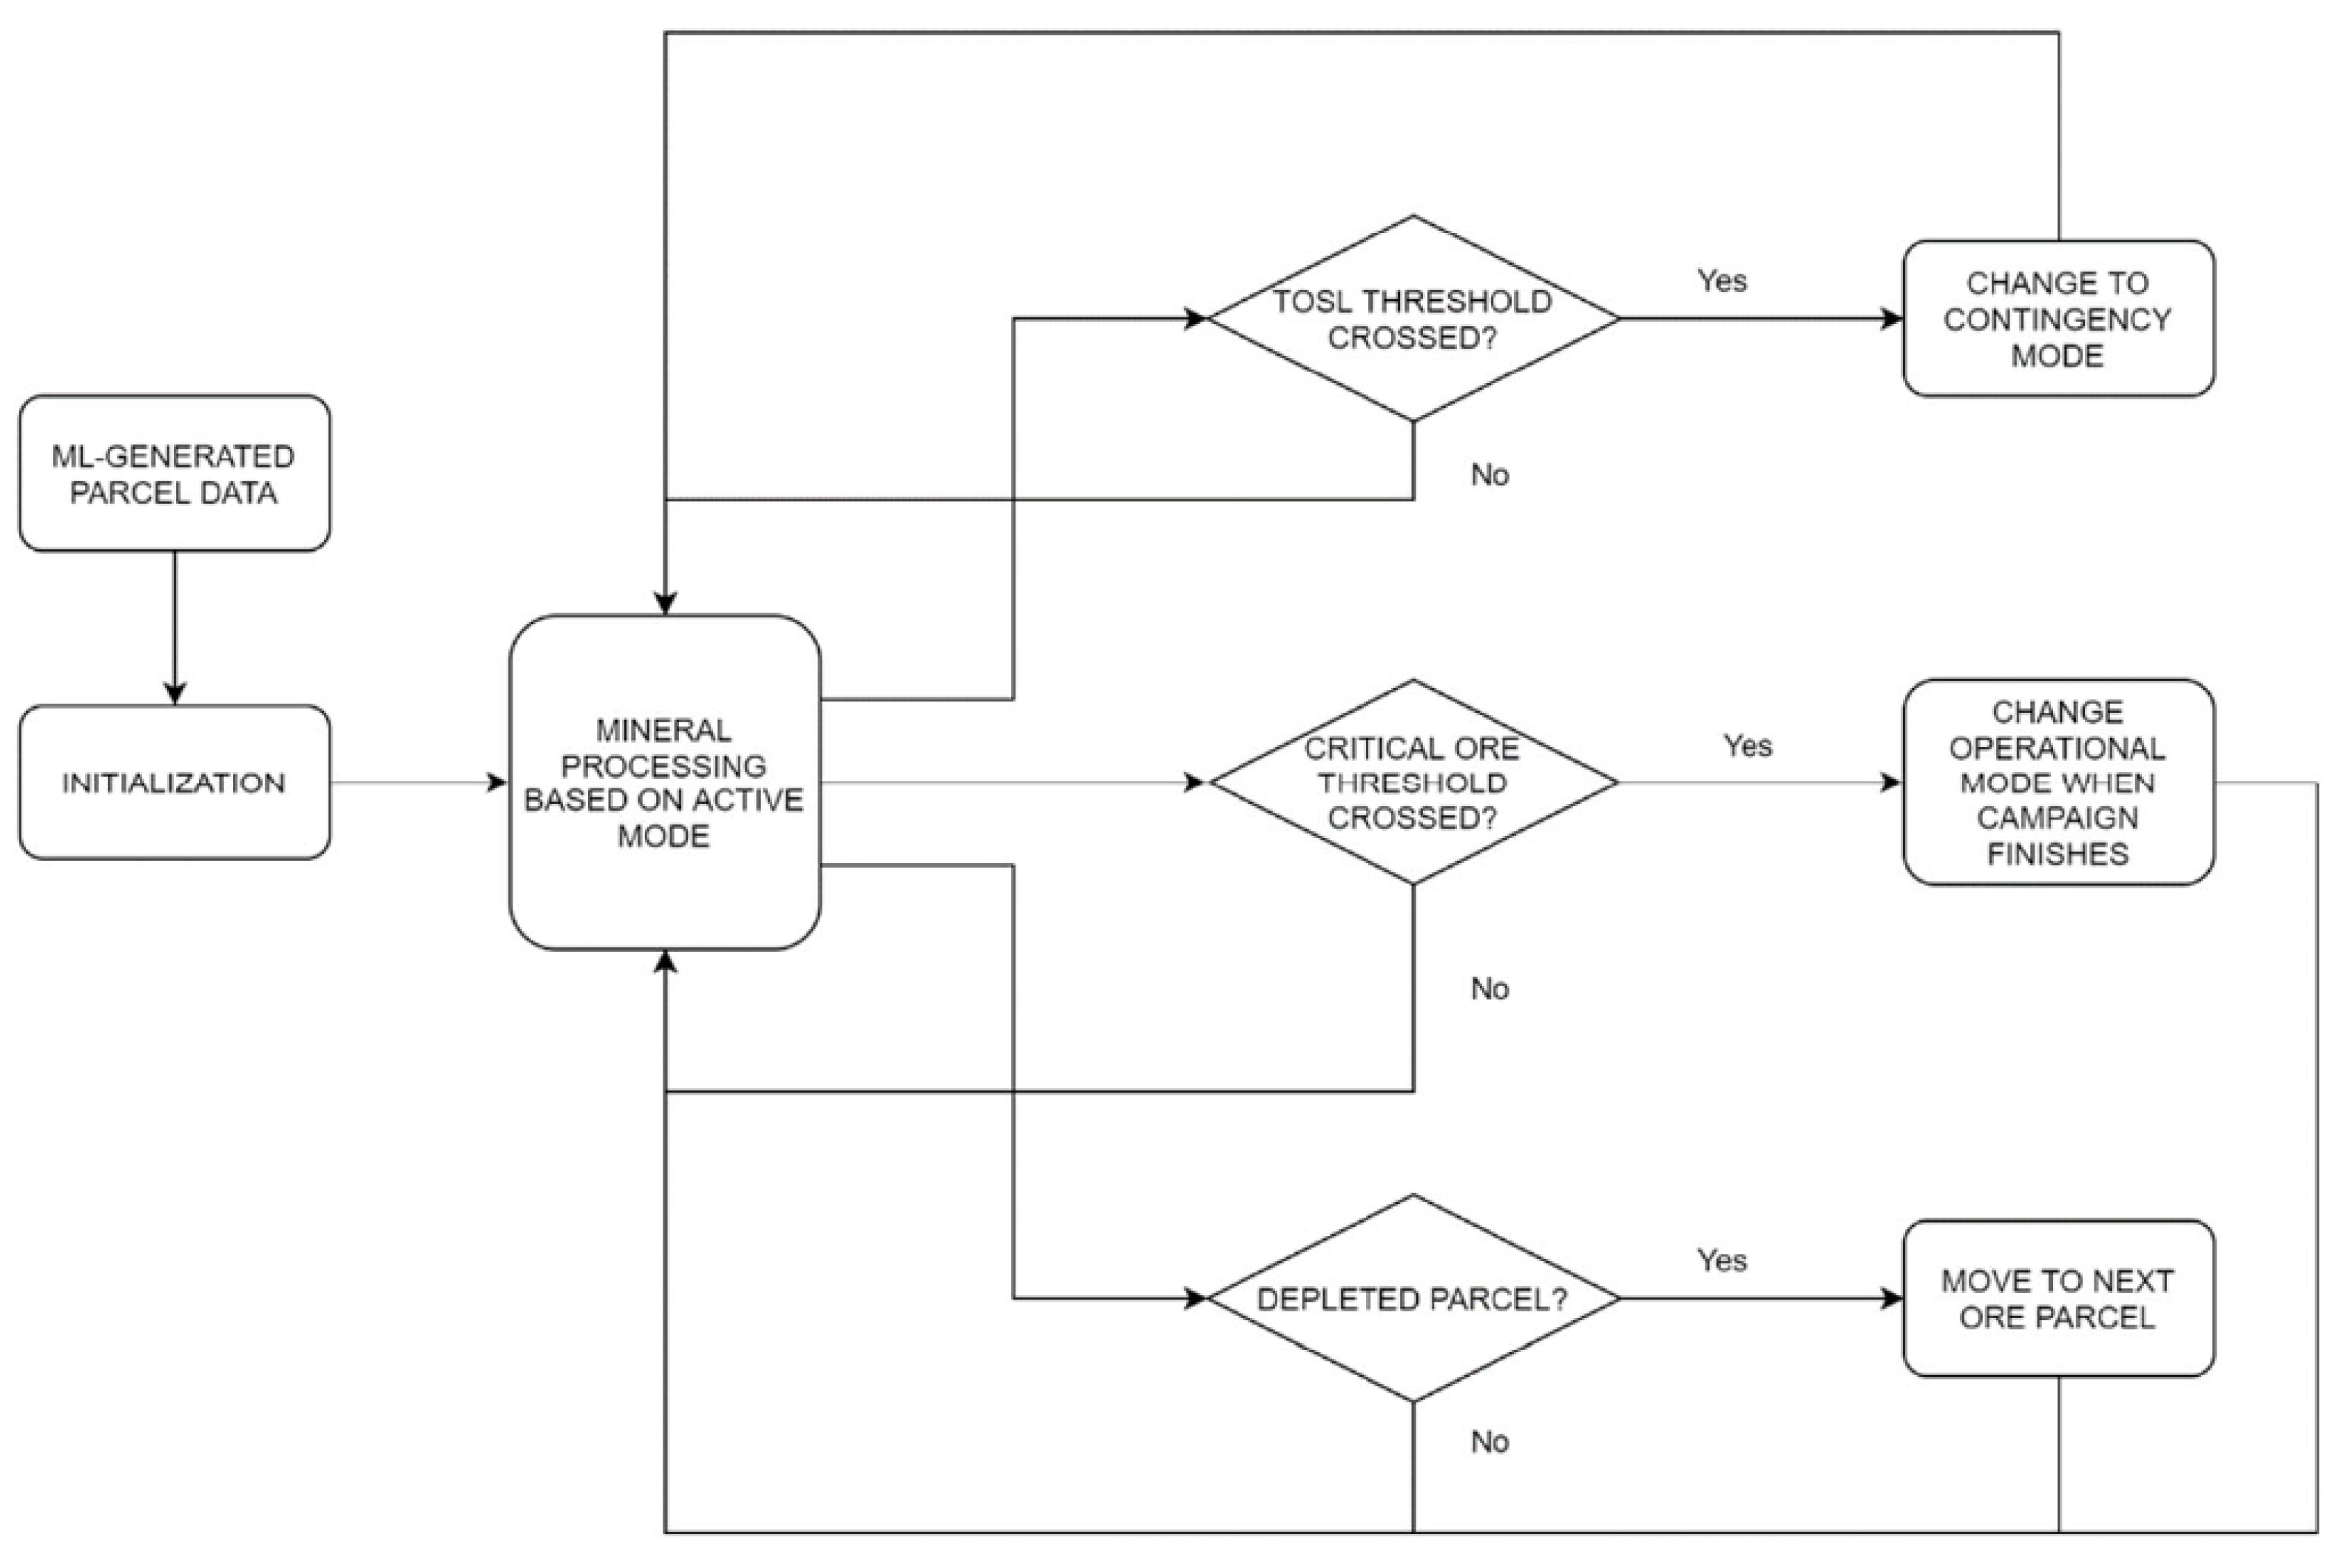
Figure 8.
Representative graphical outputs from the DES framework, showing (a) stable plant operation with alternation between Modes A (green) and B (blue) over a period of 500 operating days (critical RTO level = 8100 t; target total ore level = 24,300 t); (b) system under stress with one mine surging event (red “S”) and three contingency modes (green “C”) triggered by inadequate FMO and RTO levels, respectively, over 250 operating days (critical RTO level = 2700 t; target total ore level = 8100 t).
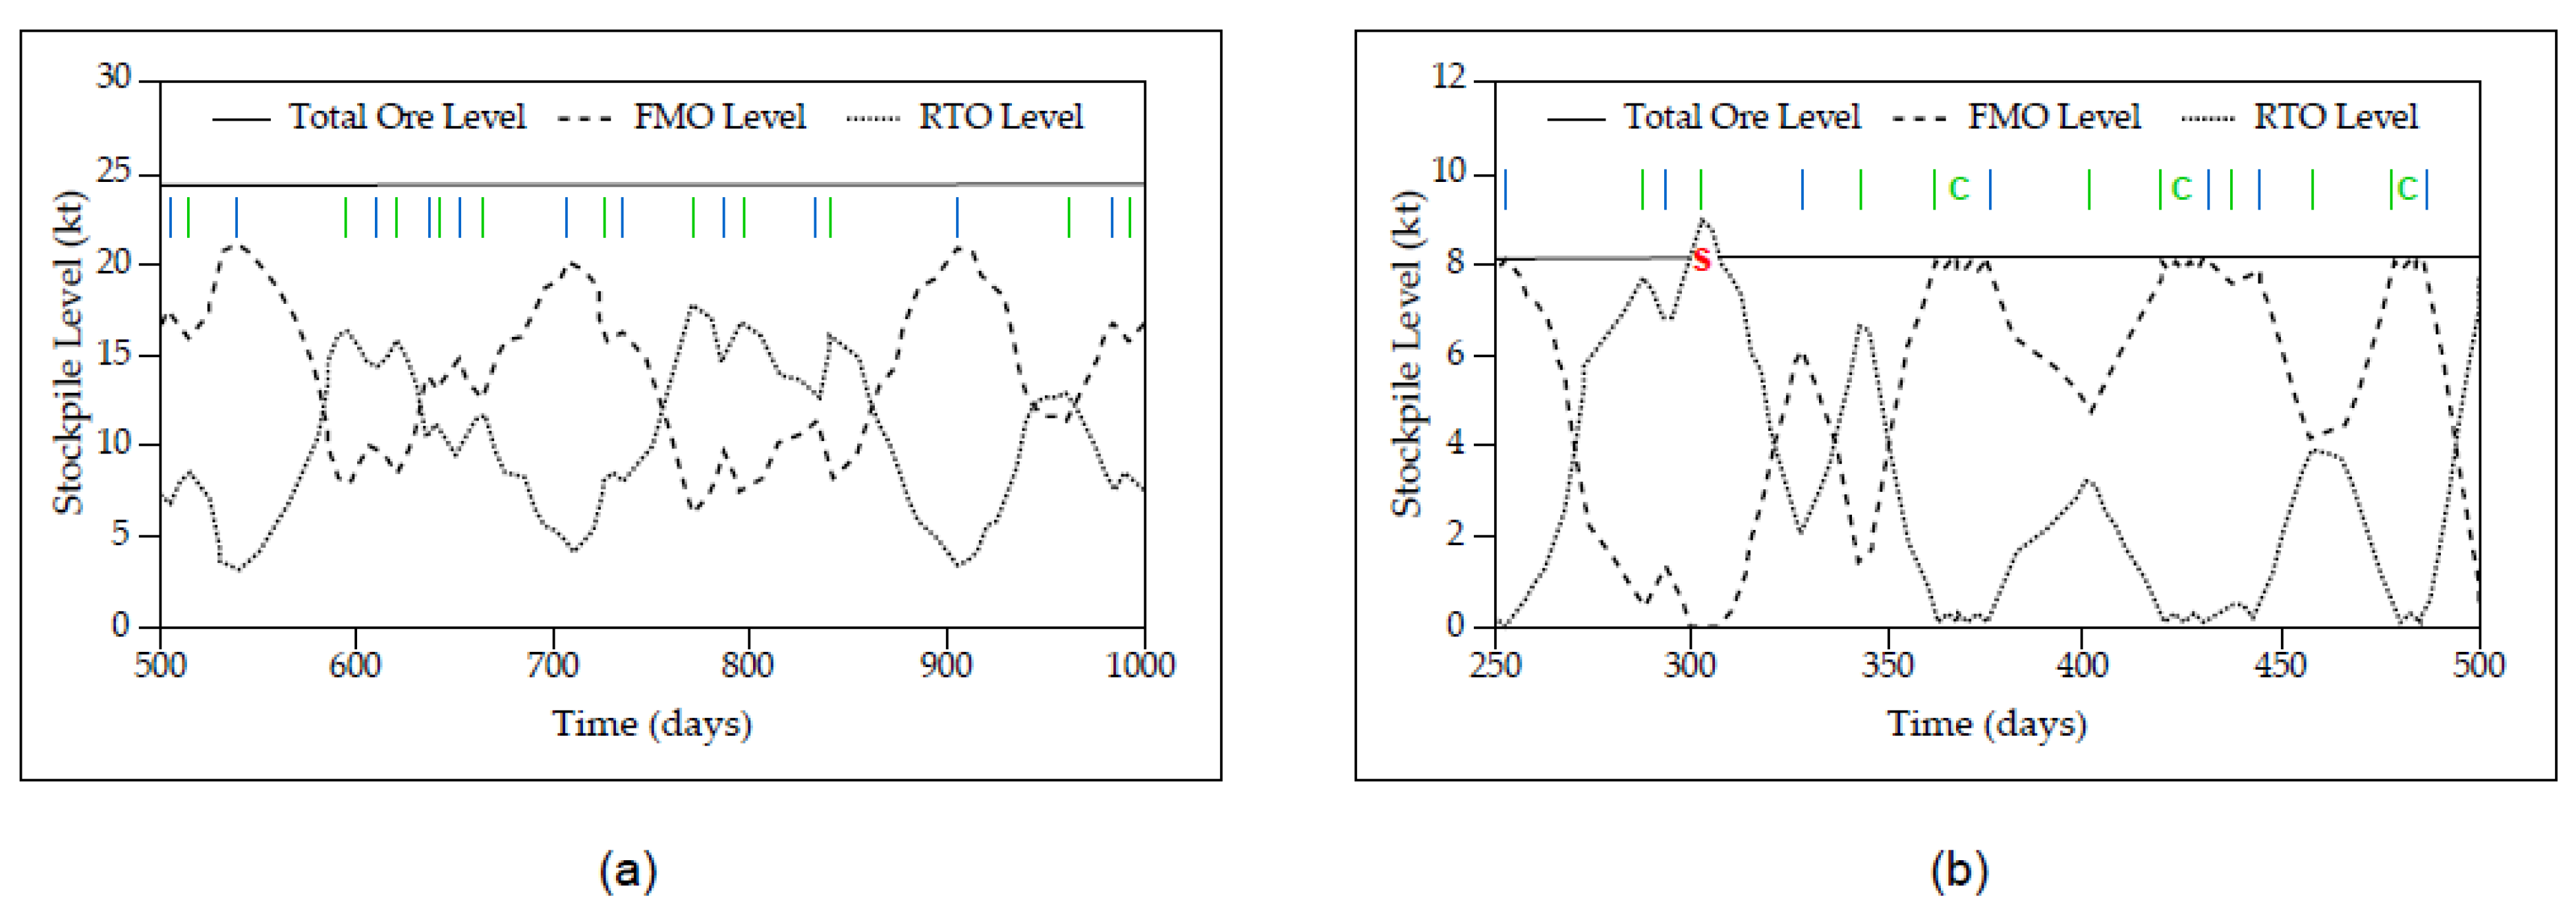
Figure 9.
Plots of throughput rates (t/d) versus (a) critical RTO level and (b) target total ore level for a variety of simulated ore type ratios over 100 statistical replications.
Figure 9.
Plots of throughput rates (t/d) versus (a) critical RTO level and (b) target total ore level for a variety of simulated ore type ratios over 100 statistical replications.
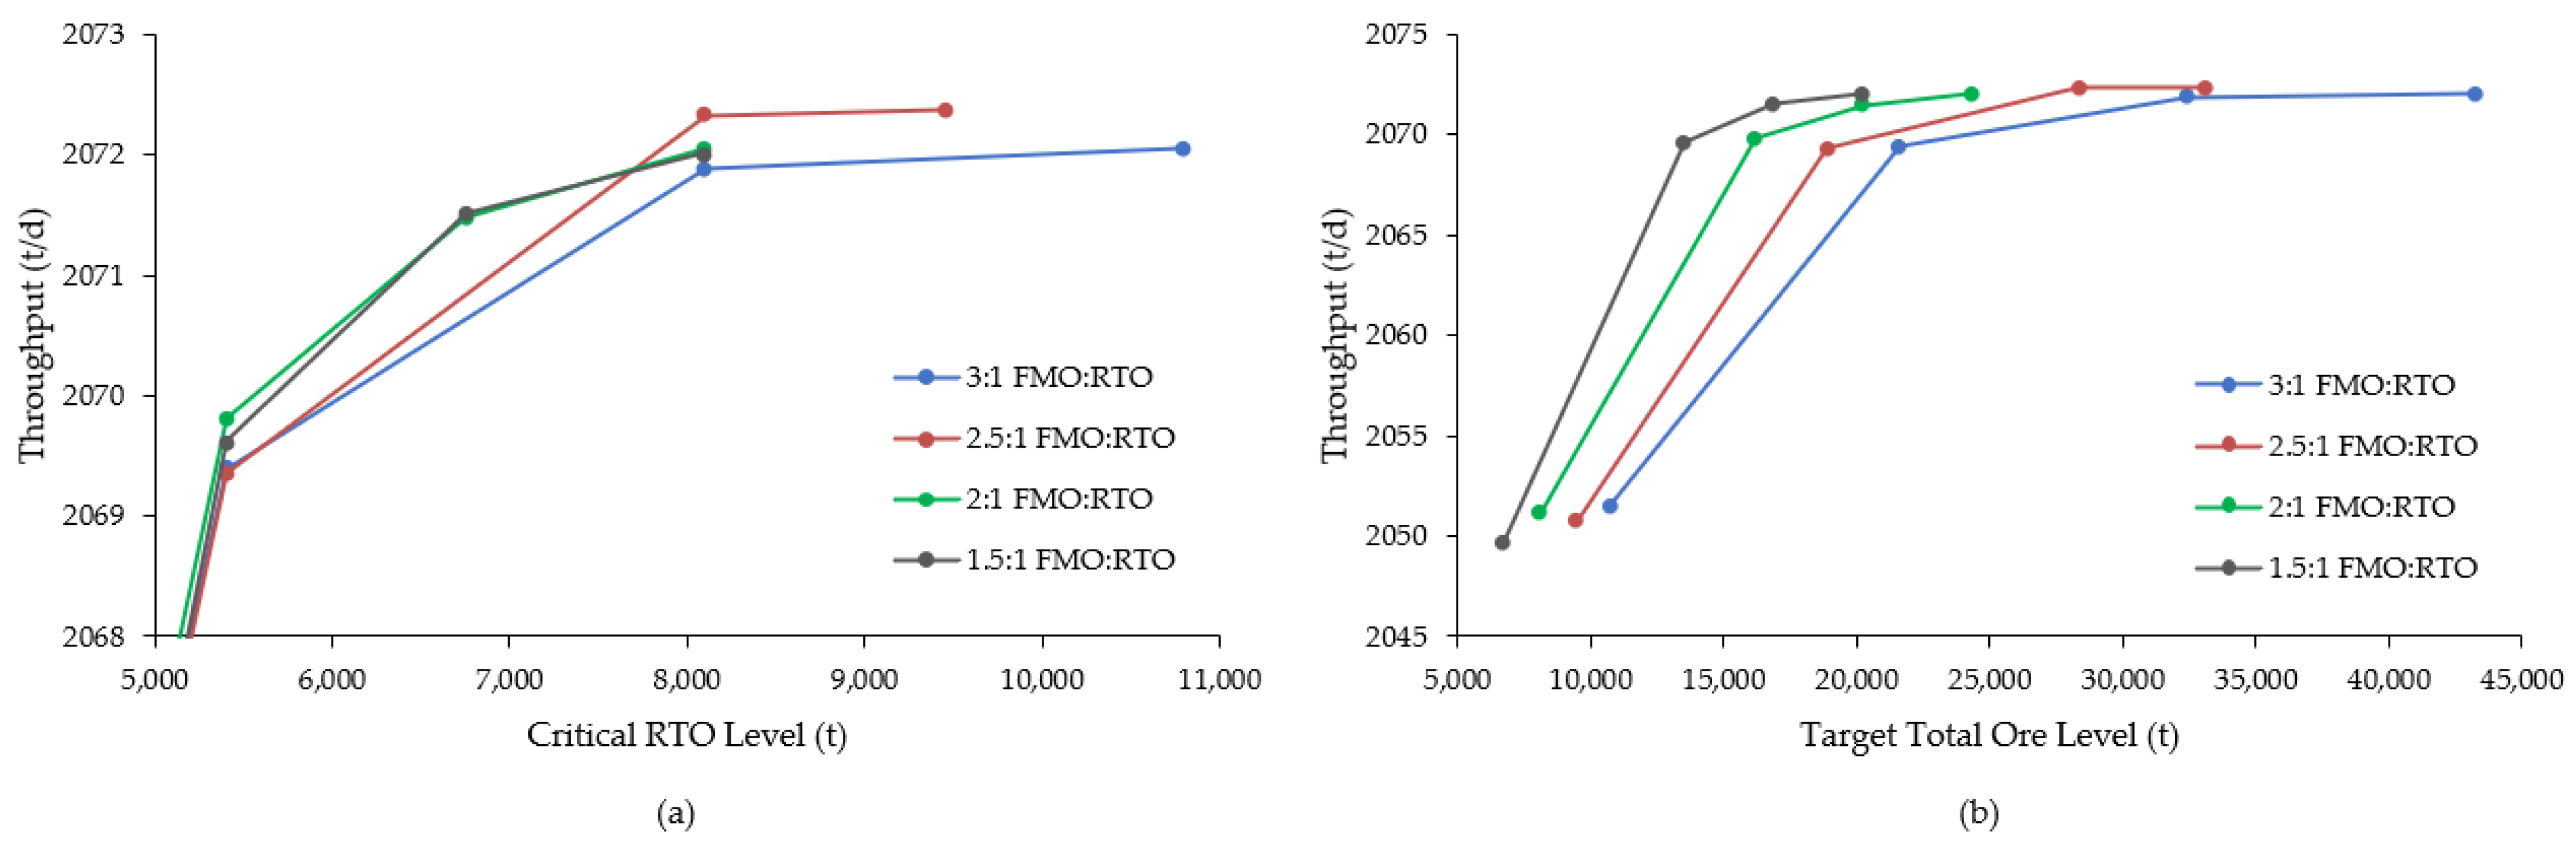
Figure 10.
Plots of monthly stockout probability (%) versus (a) critical RTO level and (b) target total ore level for a variety of simulated ore type ratios over 100 statistical replications.
Figure 10.
Plots of monthly stockout probability (%) versus (a) critical RTO level and (b) target total ore level for a variety of simulated ore type ratios over 100 statistical replications.
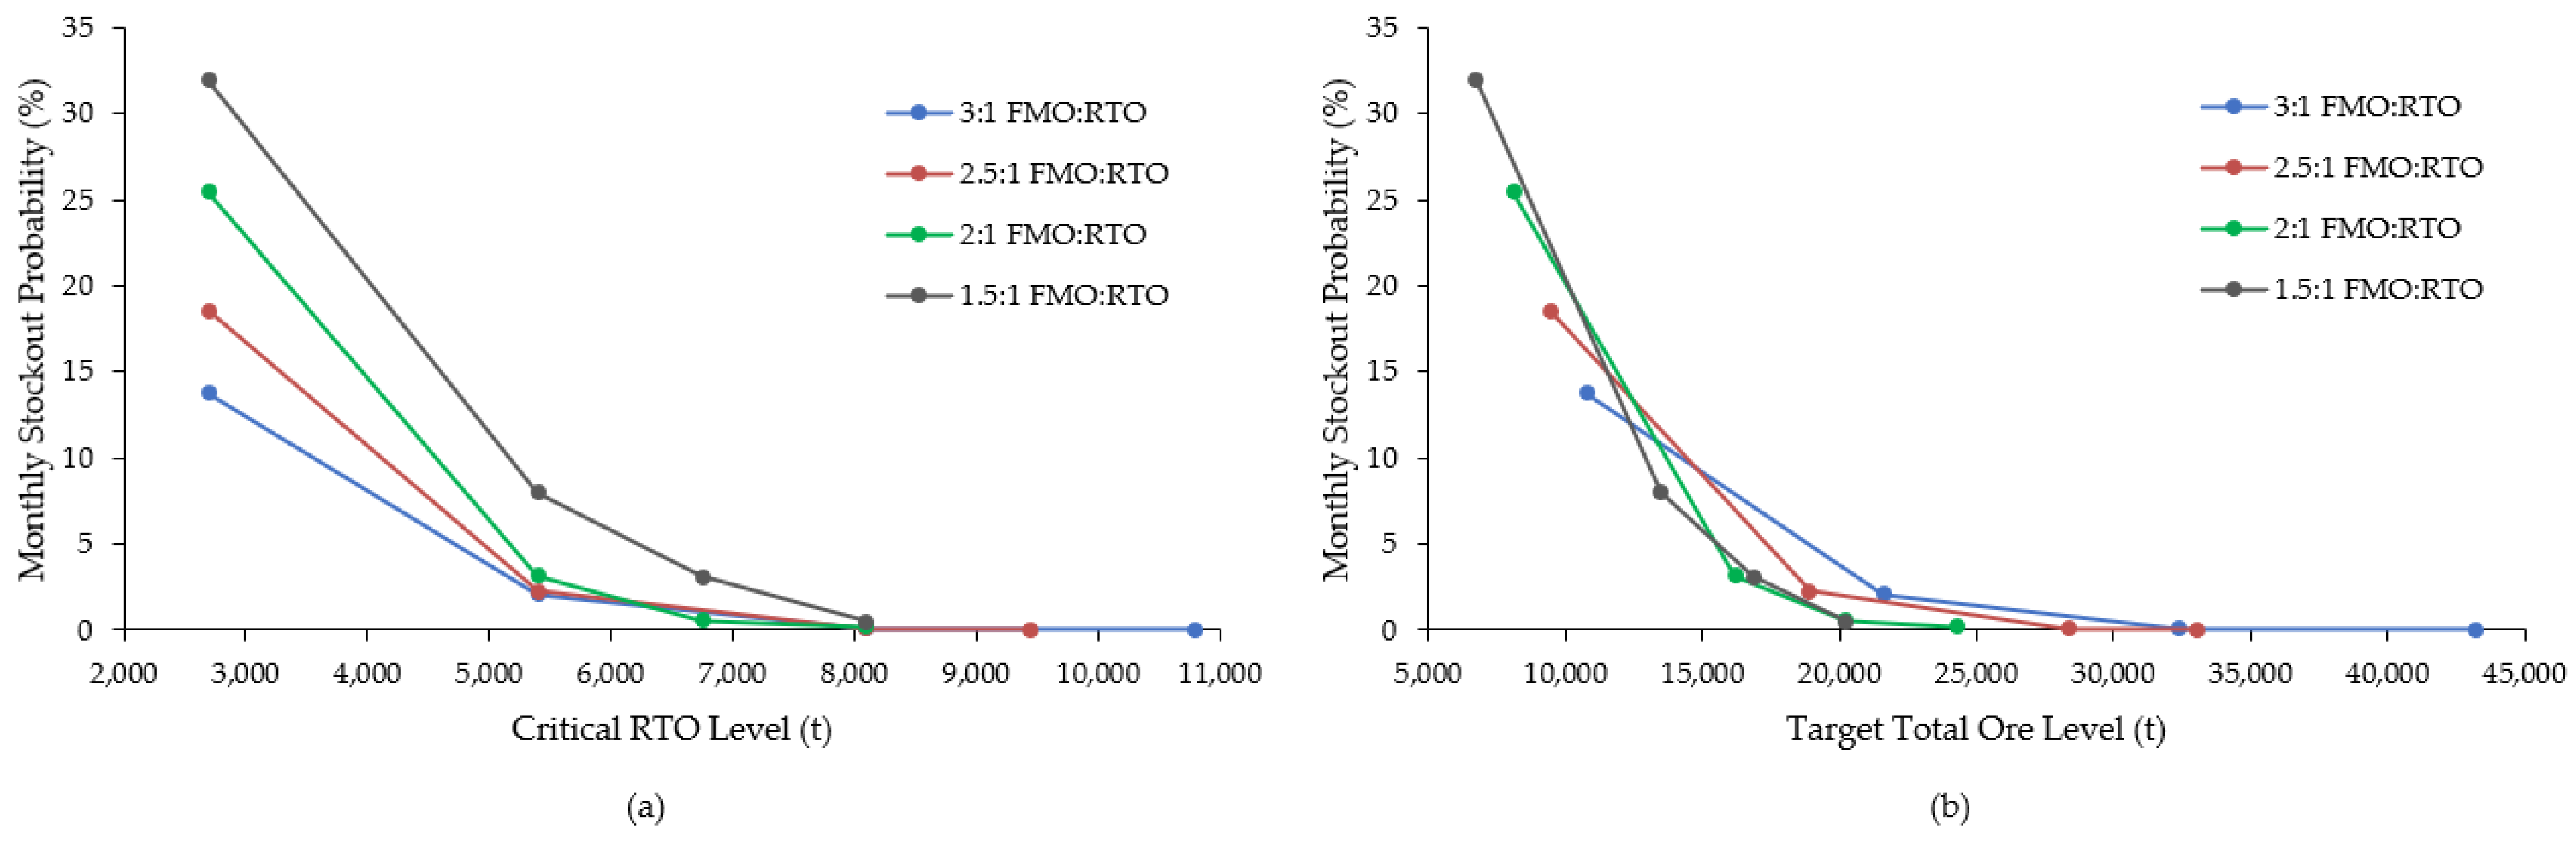
Figure 11.
Histogram showing the relative modal time proportions of the final enhanced model vs. a naïve model that uses the deterministic values for critical RTO (2700 t) and target total ore (5940 t) levels over 100 replications.
Figure 11.
Histogram showing the relative modal time proportions of the final enhanced model vs. a naïve model that uses the deterministic values for critical RTO (2700 t) and target total ore (5940 t) levels over 100 replications.
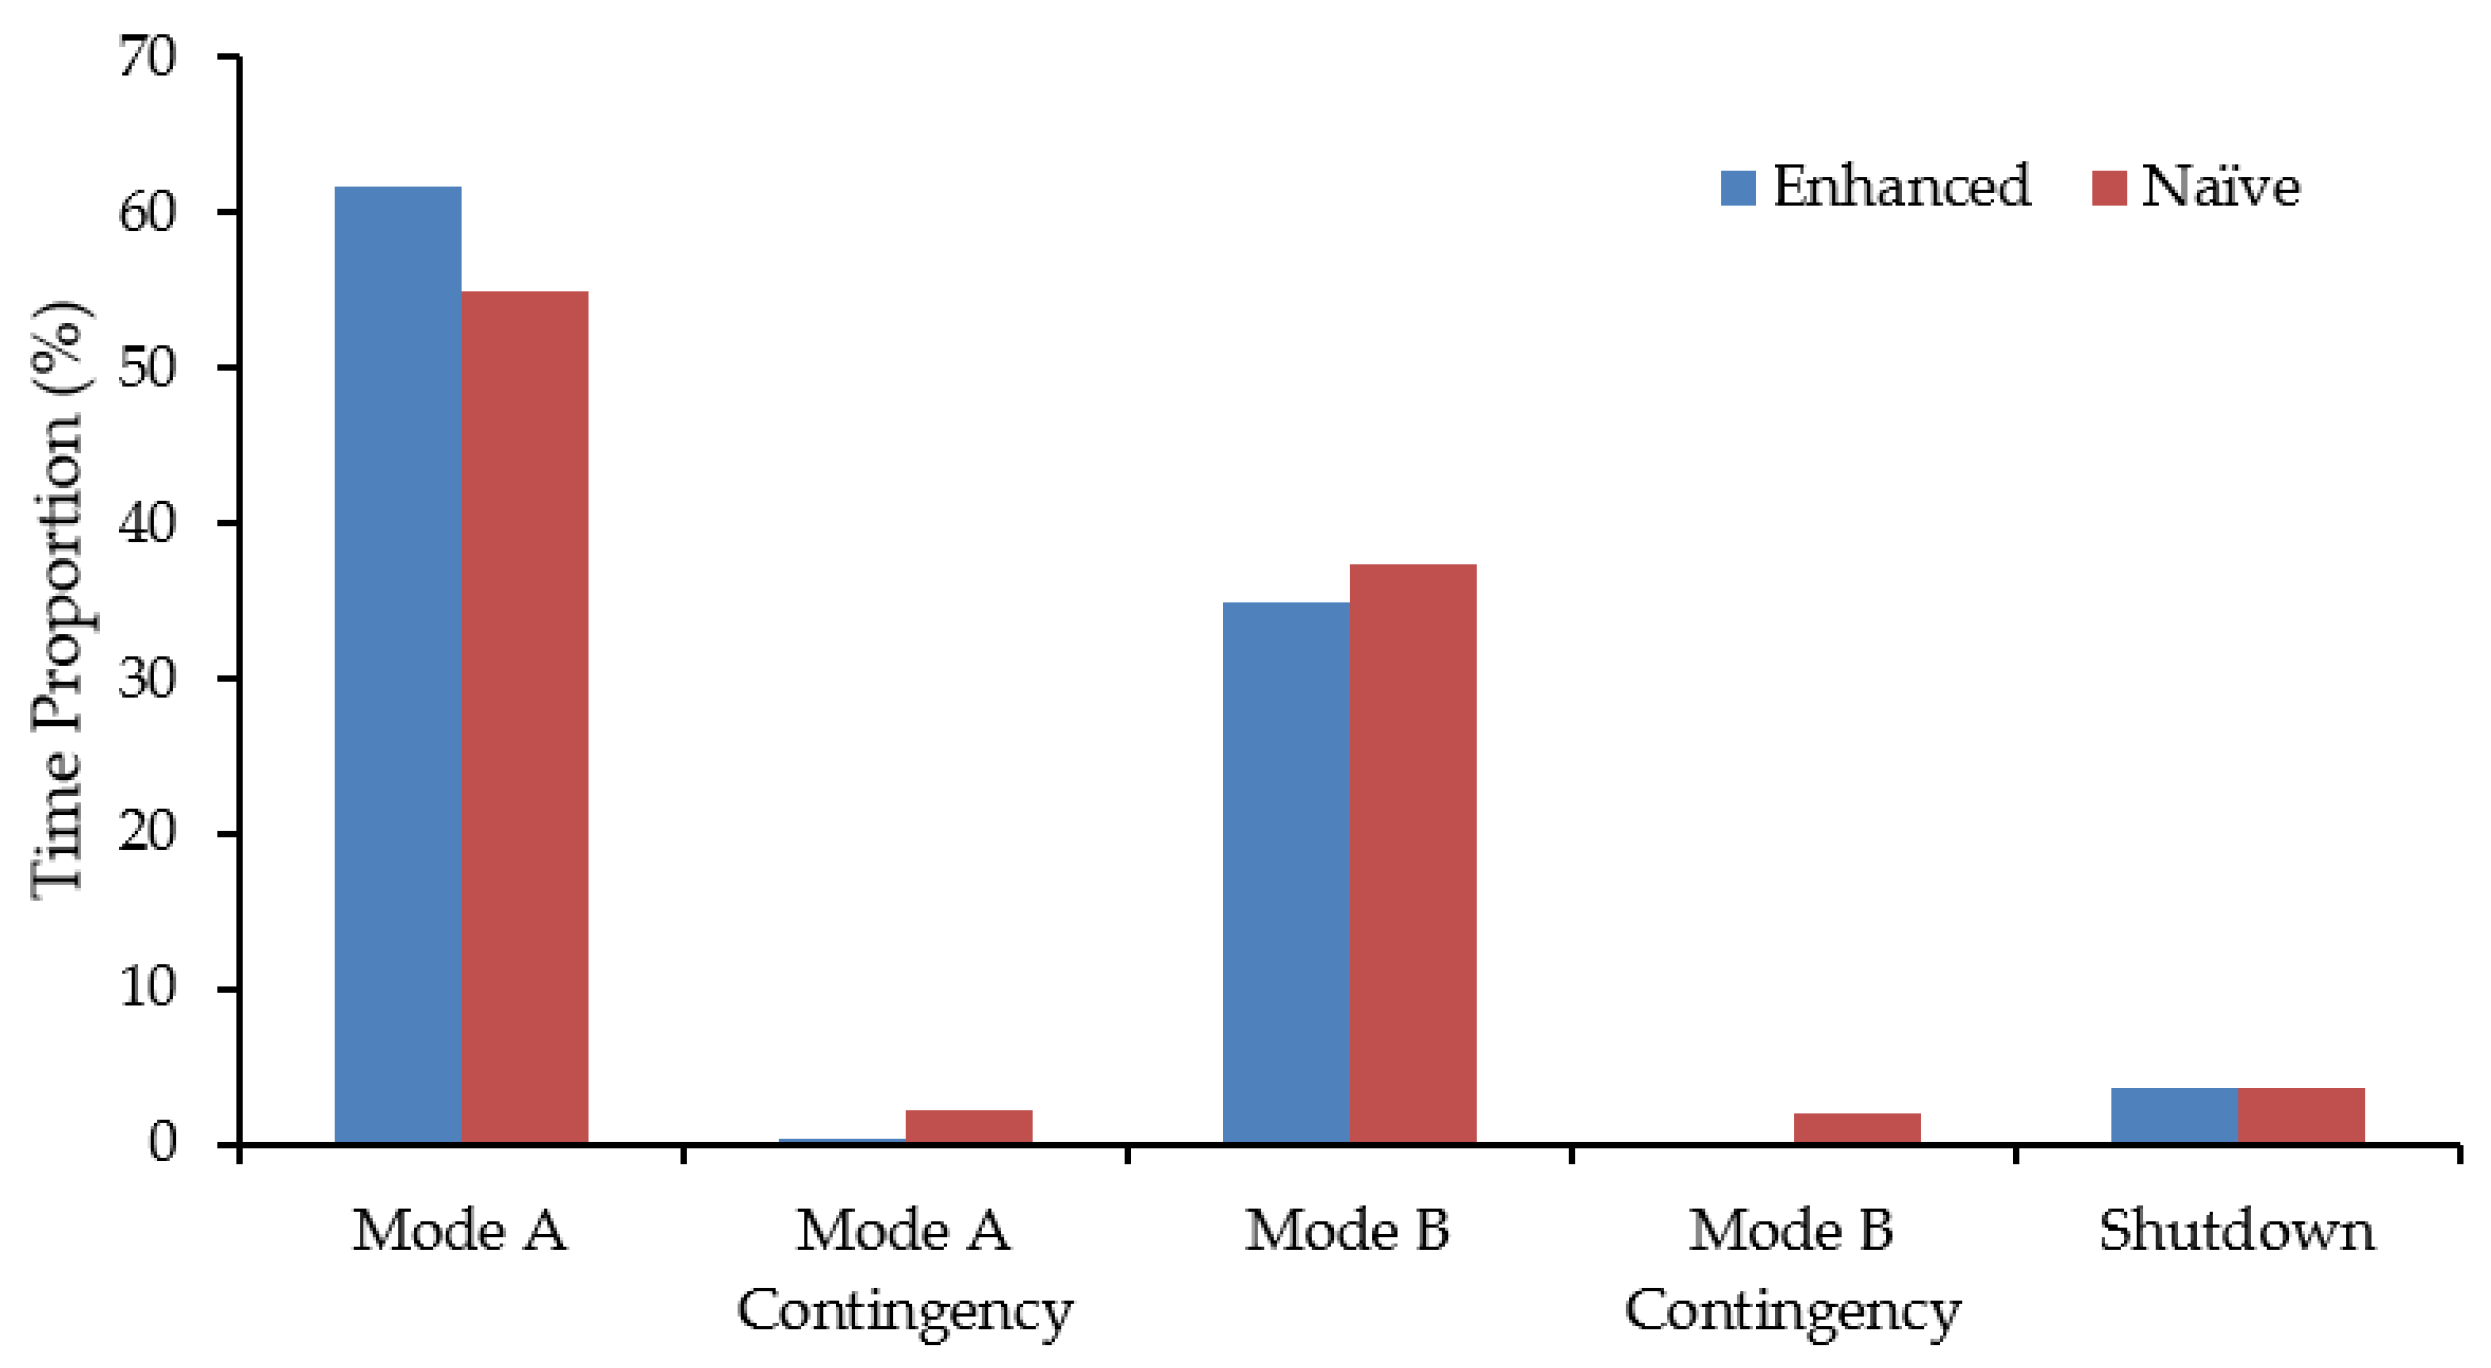
Figure 12.
Plot showing the relative trade-off between Options 1 and 2 for gold prices ranging from USD 1200/oz to USD 1900/oz. The breakeven point for bringing Mine II online occurs at a price of ~USD 1450/oz, with a payback period of ~5 years (data labels).
Figure 12.
Plot showing the relative trade-off between Options 1 and 2 for gold prices ranging from USD 1200/oz to USD 1900/oz. The breakeven point for bringing Mine II online occurs at a price of ~USD 1450/oz, with a payback period of ~5 years (data labels).
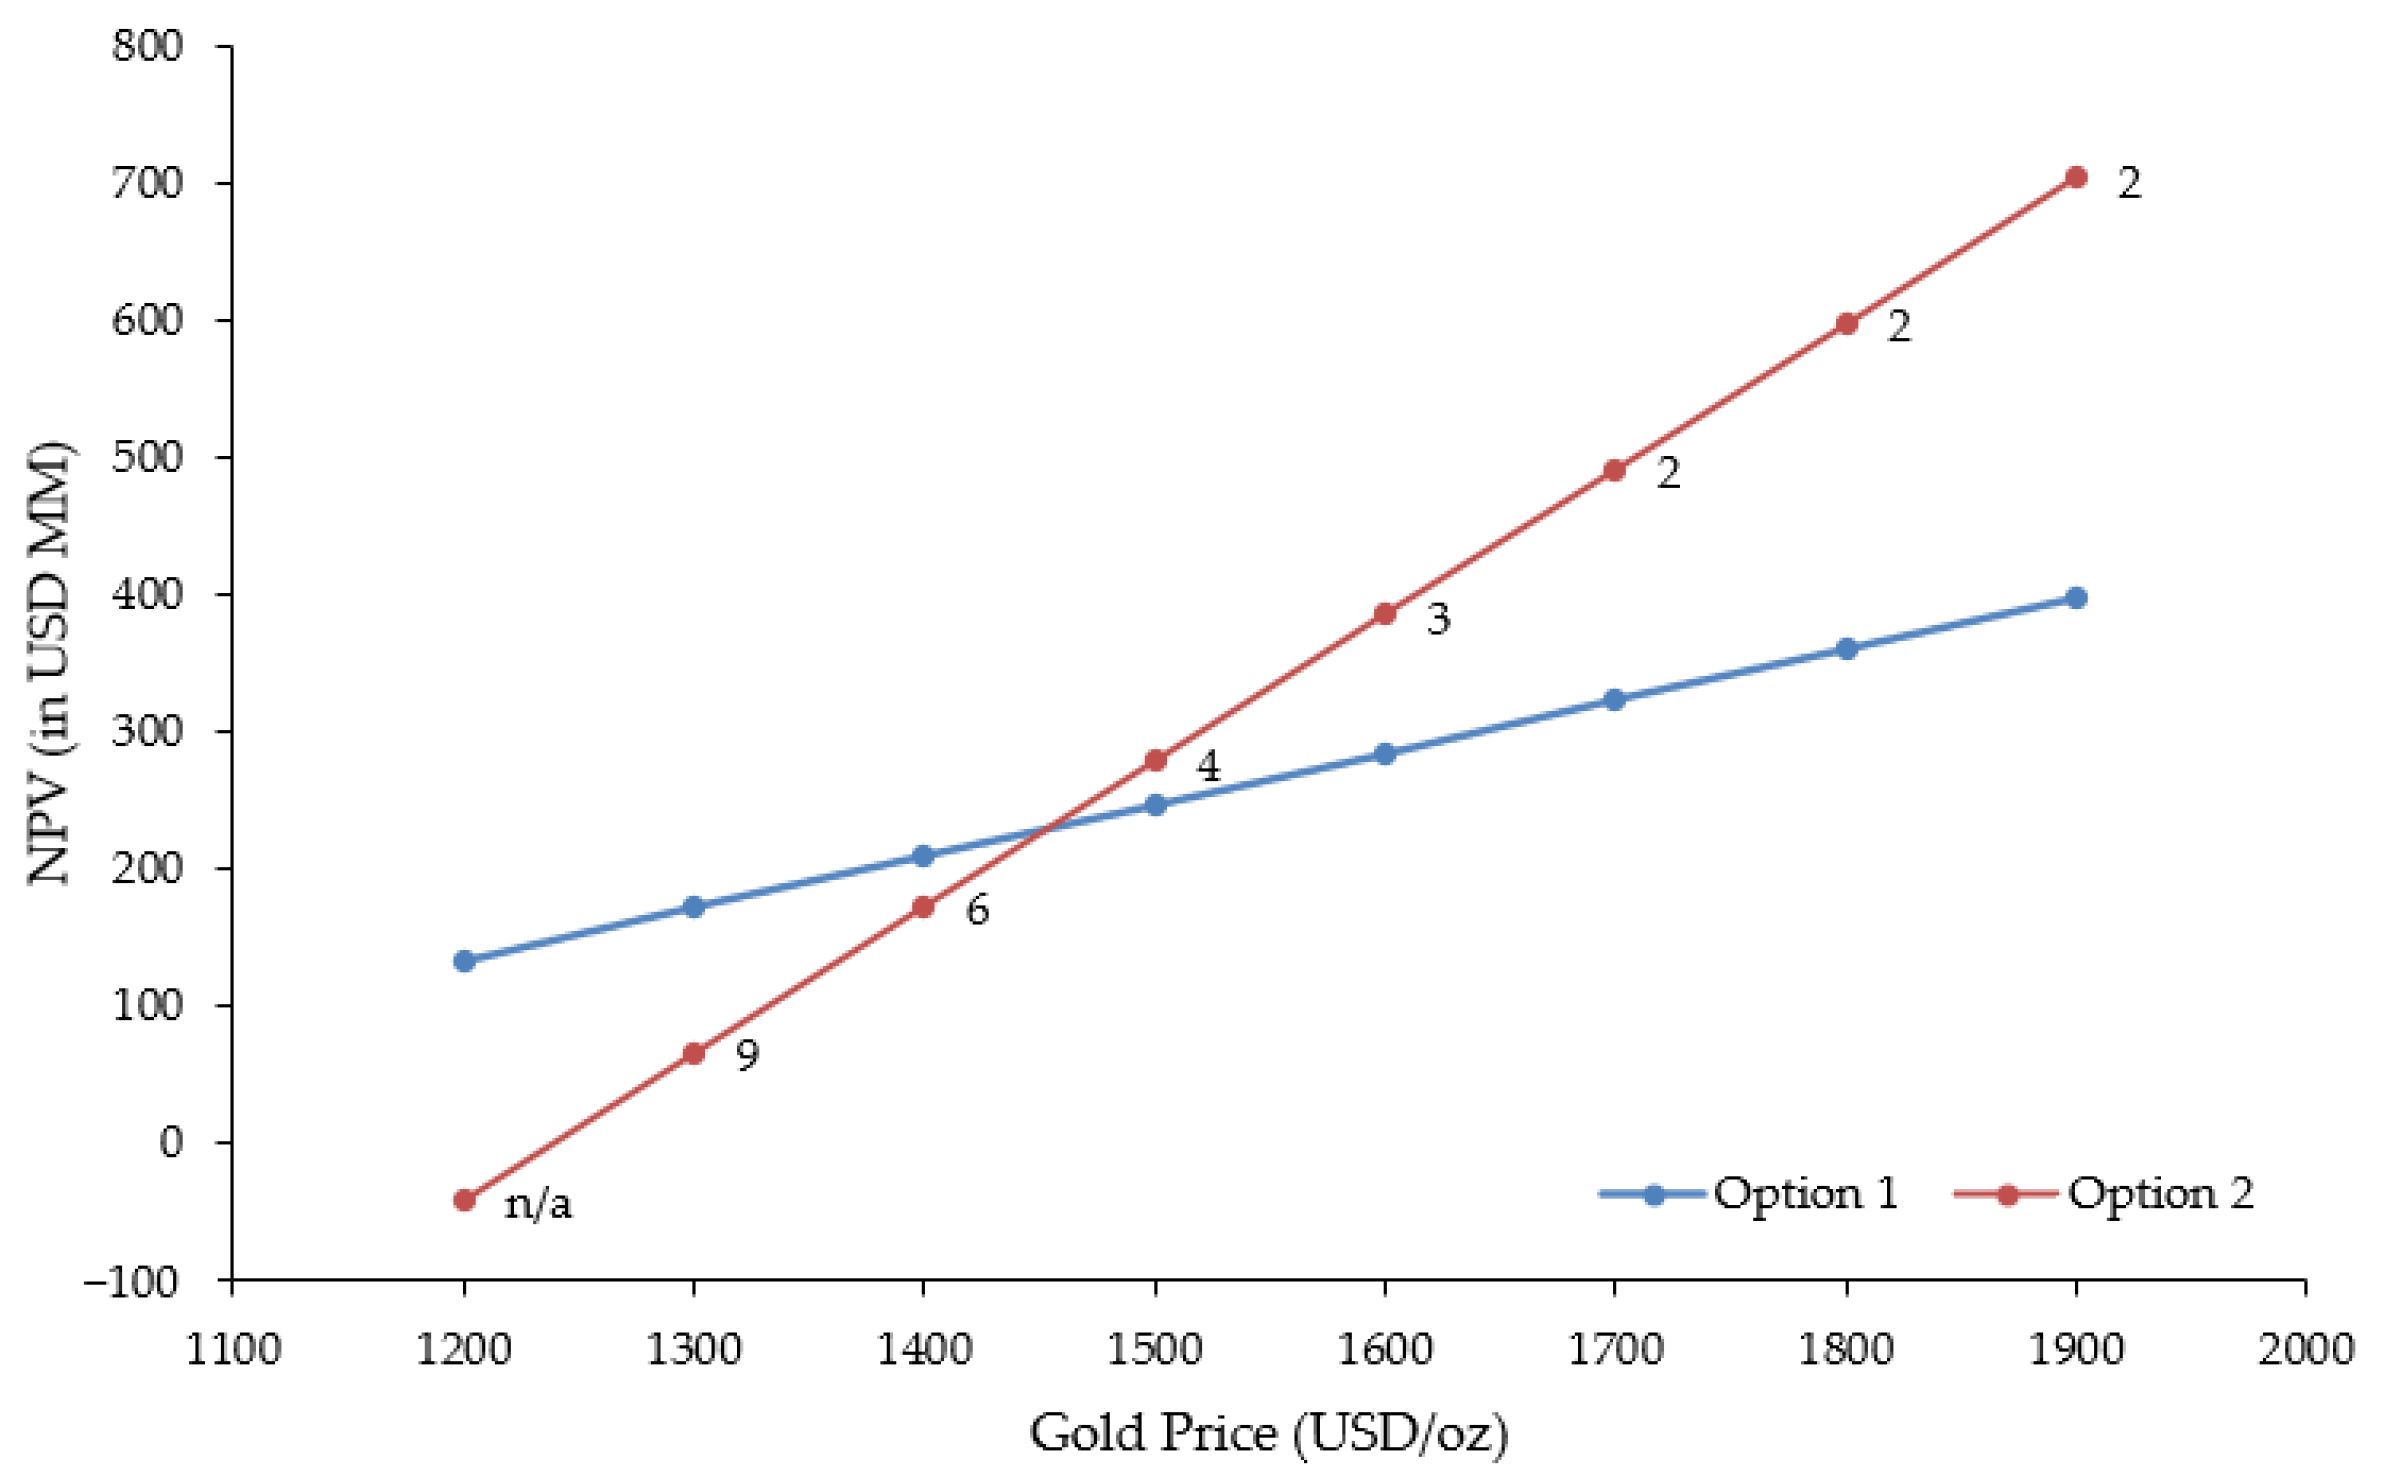
Table 1.
Comparison of summary statistics for labeled and predicted gold recoveries from MLP regression (500 epochs) on the test set ( 450 samples).
Table 1.
Comparison of summary statistics for labeled and predicted gold recoveries from MLP regression (500 epochs) on the test set ( 450 samples).
| Metric | Labeled Values (Y) | Predicted Values (Ŷ) |
|---|---|---|
| Min (%) | 31.54 | 34.45 |
| Max (%) | 99.51 | 100.00 |
| Median (%) | 71.80 | 72.24 |
| Mean (%) | 72.11 | 73.42 |
| St. Dev. (%) | 16.19 | 13.87 |
Table 2.
Summary of the overall mass balance of FMO and RTO expected at the processing plant (expressed in t/d) under the available operational modes, ignoring geological uncertainty.
Table 2.
Summary of the overall mass balance of FMO and RTO expected at the processing plant (expressed in t/d) under the available operational modes, ignoring geological uncertainty.
| Mode | FMO (Deposit Grade) | RTO (Upgraded) | ||||||
|---|---|---|---|---|---|---|---|---|
| Mine I | Mine II | Into Mill | Balance | Mine I | Mine II | Into Mill | Balance | |
| A | 1245 | 155 | 1300 | 100 | 0 | 600 | 700 | −100 |
| B | 1370 | 170 | 1760 | −220 | 0 | 660 | 440 | 220 |
Table 3.
Summary of modal time proportions, throughput rates and number of stockout events for simulations with varied ore type ratios using a constant critical RTO level of 2700 t (deterministic result).
Table 3.
Summary of modal time proportions, throughput rates and number of stockout events for simulations with varied ore type ratios using a constant critical RTO level of 2700 t (deterministic result).
| Sim | # Reps | Crit Ore Level (t) | Total Ore (t) | Ore Ratio | Mode A (%) | Mode A Cont (%) | Mode B (%) | Mode B Cont (%) | Shutdown (%) | Throughput (t/d) | No. of Stockouts |
|---|---|---|---|---|---|---|---|---|---|---|---|
| 1 | 1 | 2700 | 5940 | 1.2 | 57.14 | 1.99 | 35.52 | 1.83 | 3.51 | 2046.30 | 15 |
| 2 | 1 | 2700 | 6750 | 1.5 | 58.21 | 1.18 | 35.59 | 1.50 | 3.52 | 2055.13 | 13 |
| 3 | 1 | 2700 | 8100 | 2 | 62.88 | 1.28 | 32.09 | 0.22 | 3.52 | 2054.61 | 7 |
| 4 | 1 | 2700 | 9450 | 2.5 | 64.49 | 1.06 | 30.82 | 0.10 | 3.52 | 2054.49 | 5 |
| 5 | 1 | 2700 | 10,800 | 3 | 64.08 | 2.15 | 30.23 | 0.04 | 3.51 | 2044.59 | 4 |
| 6 | 1 | 2700 | 12,150 | 3.5 | 64.27 | 2.03 | 30.19 | 0.00 | 3.51 | 2045.74 | 0 |
Table 4.
Summary of net present value (NPV) calculations for a range of potential gold prices under Option 1, assuming a production rate of 100 koz Au/y and all-in sustaining costs (AISC) of USD 850/oz.
Table 4.
Summary of net present value (NPV) calculations for a range of potential gold prices under Option 1, assuming a production rate of 100 koz Au/y and all-in sustaining costs (AISC) of USD 850/oz.
| Gold Price (USD/oz) | |||||||||
|---|---|---|---|---|---|---|---|---|---|
| Year | Metric 1 | USD 1200 | USD 1300 | USD 1400 | USD 1500 | USD 1600 | USD 1700 | USD 1800 | USD 1900 |
| 1 | PV | 31.818 | 40.909 | 50.000 | 59.091 | 68.182 | 77.273 | 86.364 | 95.455 |
| 2 | PV | 28.926 | 37.190 | 45.455 | 53.719 | 61.983 | 70.248 | 78.512 | 86.777 |
| 3 | PV | 26.296 | 33.809 | 41.322 | 48.835 | 56.349 | 63.862 | 71.375 | 78.888 |
| 4 | PV | 23.905 | 30.736 | 37.566 | 44.396 | 51.226 | 58.056 | 64.886 | 71.716 |
| 5 | PV | 21.732 | 27.941 | 34.151 | 40.360 | 46.569 | 52.778 | 58.988 | 65.197 |
| Total | NPV | 132.678 | 170.585 | 208.493 | 246.401 | 284.309 | 322.217 | 360.125 | 398.033 |
1 Dollar amounts for present value (PV) and NPV are shown in millions.
Table 5.
Summary of net present value (NPV) calculations for a range of potential gold prices under Option 2, assuming a production rate of 150 koz Au/y and all-in sustaining costs (AISC) of USD 1050/oz for the first 7 years and USD 950/oz for the final 6 years.
Table 5.
Summary of net present value (NPV) calculations for a range of potential gold prices under Option 2, assuming a production rate of 150 koz Au/y and all-in sustaining costs (AISC) of USD 1050/oz for the first 7 years and USD 950/oz for the final 6 years.
| Gold Price (USD/oz) | |||||||||
|---|---|---|---|---|---|---|---|---|---|
| Year | Metric 1 | USD 1200 | USD 1300 | USD 1400 | USD 1500 | USD 1600 | USD 1700 | USD 1800 | USD 1900 |
| 0 | PV | (235.000) | (235.000) | (235.000) | (235.000) | (235.000) | (235.000) | (235.000) | (235.000) |
| 1 | PV | 20.455 | 34.091 | 47.727 | 61.364 | 75.000 | 88.636 | 102.273 | 115.909 |
| 2 | PV | 18.595 | 30.992 | 43.388 | 55.785 | 68.182 | 80.579 | 92.975 | 105.372 |
| 3 | PV | 16.905 | 28.174 | 39.444 | 50.714 | 61.983 | 73.253 | 84.523 | 95.793 |
| 4 | PV | 15.368 | 25.613 | 35.858 | 46.103 | 56.349 | 66.594 | 76.839 | 87.084 |
| 5 | PV | 13.971 | 23.285 | 32.598 | 41.912 | 51.226 | 60.540 | 69.854 | 79.167 |
| 6 | PV | 12.701 | 21.168 | 29.635 | 38.102 | 46.569 | 55.036 | 63.503 | 71.970 |
| 7 | PV | 11.546 | 19.243 | 26.941 | 34.638 | 42.336 | 50.033 | 57.730 | 65.428 |
| 8 | PV | 17.494 | 24.492 | 31.489 | 38.487 | 45.484 | 52.482 | 59.480 | 66.477 |
| 9 | PV | 15.904 | 22.265 | 28.627 | 34.988 | 41.350 | 47.711 | 54.072 | 60.434 |
| 10 | PV | 14.458 | 20.241 | 26.024 | 31.807 | 37.590 | 43.374 | 49.157 | 54.940 |
| 11 | PV | 13.144 | 18.401 | 23.658 | 28.916 | 34.173 | 39.431 | 44.688 | 49.945 |
| 12 | PV | 11.949 | 16.728 | 21.508 | 26.287 | 31.067 | 35.846 | 40.625 | 45.405 |
| 13 | PV | 10.862 | 15.207 | 19.552 | 23.897 | 28.242 | 32.587 | 36.932 | 41.277 |
| Total | NPV | (41.650) | 64.900 | 171.450 | 278.001 | 384.551 | 491.101 | 597.652 | 704.202 |
| Payback | (years) | n/a | 9 | 6 | 4 | 3 | 2 | 2 | 2 |
1 Dollar amounts for present value (PV) and NPV are shown in millions.
Publisher’s Note: MDPI stays neutral with regard to jurisdictional claims in published maps and institutional affiliations. |
© 2022 by the authors. Licensee MDPI, Basel, Switzerland. This article is an open access article distributed under the terms and conditions of the Creative Commons Attribution (CC BY) license (https://creativecommons.org/licenses/by/4.0/).
Share and Cite
MDPI and ACS Style
Wilson, R.; Mercier, P.H.J.; Navarra, A. Integrated Artificial Neural Network and Discrete Event Simulation Framework for Regional Development of Refractory Gold Systems. Mining 2022, 2, 123-154. https://doi.org/10.3390/mining2010008
AMA Style
Wilson R, Mercier PHJ, Navarra A. Integrated Artificial Neural Network and Discrete Event Simulation Framework for Regional Development of Refractory Gold Systems. Mining. 2022; 2(1):123-154. https://doi.org/10.3390/mining2010008
Chicago/Turabian StyleWilson, Ryan, Patrick H. J. Mercier, and Alessandro Navarra. 2022. "Integrated Artificial Neural Network and Discrete Event Simulation Framework for Regional Development of Refractory Gold Systems" Mining 2, no. 1: 123-154. https://doi.org/10.3390/mining2010008