Article

Multiwalled Carbon Nanotube-Coated Poly-Methyl Methacrylate Dispersed Thermoplastic Polyurethane Composites for Pressure-Sensitive Applications

by
Syed Muhammad Imran
1,
Gwang-Myeong Go
2,
Manwar Hussain
2,* and
Mamdouh A. Al-Harthi
3
1
Department of Chemical Engineering, Lahore Campus, COMSATS University Islamabad, Defense Road, Lahore 5400, Pakistan
2
Department of Materials Science and Chemical Engineering, College of Engineering Sciences, Hanyang University, Ansan 426-791, Korea
3
Department of Chemical Engineering, King Fahad University of Petroleum and Minerals, Dhahran 31261, Saudi Arabia
*
Author to whom correspondence should be addressed.
Macromol 2022, 2(2), 211-224; https://doi.org/10.3390/macromol2020014
Submission received: 27 April 2022 / Revised: 30 May 2022 / Accepted: 31 May 2022 / Published: 6 June 2022

Abstract

:
Thermoplastic polyurethane (TPU) is a widely used polymer for a variety of pressure sensing applications because of its softness and shape memory. This work reports the synthesis of novel TPU-based three-dimensional structured (3D) pressure-sensitive composites via the melt mixing method. Poly-methyl methacrylate (PMMA) microbeads of different sizes (5, 10, and 20 µm) were first coated with multi-walled carbon nanotubes (MWCNT) and then incorporated into the TPU matrix for achieving an early electro conductive percolation threshold compared to without PMMA beads. The addition of MWCNT coated PMMA beads reduced the TPU insulated areas by creating a 3D conductive network that finally reflected the early percolation threshold during external pressure. Raman microscopy and XRD results confirmed the MWCNT coated nicely on the surface of PMMA beads. The pressure sensitivity results also confirmed the decrease in resistance of the composites with the increase in the applied external pressure. Composites with 10 µm PMMA bead size showed the most linear responses to the decrease in resistance with increasing pressure and showed a higher strain gauge factor value (3.15) as compared to other composites, which had values of 2.78 and 2.42 for 20 and 5 µm, respectively. Microstructure analysis of the composites by SEM, capacitance, permeability, and thermal conductivity measurements was also investigated to support the above evidence. The results support the suitability of this novel composite as a potential candidate for pressure sensing applications.

1. Introduction

Thermoplastic polyurethane (TPU) exhibits good flexibility, excellent mechanical strength, outstanding abrasion resistance, lower cost, and environmental resistance, thus allowing for the fabrication of high-performance, flexible piezoresistive sensors [1,2]. Like most polymers and rubbers, TPU is also thermally and electrically insulating, but with the addition of an electroconductive material as a second phase in the polymer matrix, it can act as an electroconductive polymer in certain ranges by creating an electroconductive network upon external pressure, causing significant variation in conductivity [3,4]. Thus, the conductive filler dispersed piezoresistive sensors have great importance in many areas, such as artificial skin, robot arms, and healthcare devices [5,6,7].
Carbon nanofillers such as multi-walled carbon nanotubes (MWCNTs) are extremely important electroconductive nanomaterials because of their extraordinary structural properties. Due to their superior thermal, electrical, and mechanical properties, they are widely used as reinforcing electroconductive filler materials in high-performance polymer composites [8,9]. However, many challenges remain in the research on using MWCNTs, such as agglomeration, inhomogeneous dispersion in the polymer matrix because of very high surface area and surface energy, the random orientation of MWCNTs, and their poor interaction with the polymers. All these factors have a significant effect on the final properties of the composites [10,11].
At the low loading of an electroconductive filler in the TPU polymer matrix, electrical resistivity is higher as compared to the higher conducting filler loading [12,13]. Thus, the fabrication of composites showing a decrease in electrical resistivity with an increase in external load is important for their use in pressure-sensitive applications. This can be demonstrated by the fact that percolation paths form within these composites when pressure is applied to them, causing a sudden decrease in measured electrical resistivity even with very low filler volume content. With increases in applied pressure, the total volume of the composite decreases, increasing the volume fraction of the filler [14,15]. Conductive filler-filled composites also exhibit electroconductive responses by electron hopping to nearby conductive filler and tunneling effect. Even though the MWCNTs are not physically connected, neighboring electron transfer by electron jumping is possible. Thus, interparticle spacing/distance (IPS) plays a very important role in conductivity measurements [16].
Over the last decade, many scientists have studied the pressure dependence of electrical resistivity changes for various polymer composites [17,18,19,20,21]. X. Sun et al. [22] recently reported flexible tactile electronic skin sensors based on CNT/Polydimethylsiloxane (PDMS) composites. These composites have shown high sensitivity with fast response and improved consistency. Another study, by M. Charara et al. [23], reported highly sensitive pressure sensors based on PDMS/CNT composites, showing high sensitivity at lower strain values. Hussain et al. [24,25,26] studied the pressure sensitivity of silicon rubber/carbon dispersed micro-ball composites systems. Rathod et al. [27] demonstrated the pressure dependence properties of TiO2 doped with poly-vinyl alcohol/chitosan (CN)–Li at different applied loads and temperatures. Z. Tang et al. [28] reported the flexible pressure sensors with a piezoresistive effects based on CNT and fumed silica nanoparticles as a conductive filler in the viscoelastic silicone rubber solution. These sensors were used in grasp sensing and gait monitoring. Wang et al. [29] measured the electrical resistivity of carbon black-filled silicone composites. Shrivastava et al. [30] synthesized PMMA using in situ bulk polymerization of commercial PMMA beads in the presence of MWCNTs. Variation of PMMA bead sizes from 80 to 120 µm and bead content (50, 60, 70, and 80 wt.%) to achieve early percolation thresholds was also investigated. Y. Zhuang et al. [31] studied synthesis via solution blending and ball milling of TPU/CNT-based composite-based pressure sensors. These sensors were ideal for the detection of plantar pressure distribution in human feet.
In our previous study [32], we fabricated MWCNTs and PMMA dispersed in TPU and showed the effect of differently sized PMMA beads on the variation in electrical and thermal properties with an external force. In this study, however, we added MWCNT-coated PMMA microbeads in the TPU matrix to create a three-dimensional conductive network along the PMMA bead grain boundaries to achieve an early percolation threshold. MWCNT-coated PMMA beads of different sizes (5, 10, and 20 μm) were added with a constant MWCNT loading of 3.0 wt.% to investigate the size effect of PMMA beads on the electrical and thermal sensitivity of the composites and to maintain their mechano-elastic behavior. Fabricated composites exhibited excellent sensitivity in response to the changing pressure, which shows that they can be used for pressure-sensing applications. The evaluation of the effect of MWCNT-coated PMMA bead size on the pressure-sensing properties in terms of electrical resistivity measurement of TPU-MWCNT composites for pressure-sensing applications has not previously been reported.

2. Experimental Details

2.1. Materials

Chemicals used in this study were of commercial analytical laboratory grade and used without further purification. Polymeric matrix TPU was purchased from Austin Novel Materials Co., Ltd. (Jiangsu, China). MWCNTs were procured from Hanwha Nanotech Corp. (Seoul, South Korea). Dimethylformamide (DMF) was procured from Junsei (Kyoto city, Japan). PMMA beads of different sizes were procured from Sunjin Chemicals (Ansan-shi, South Korea).

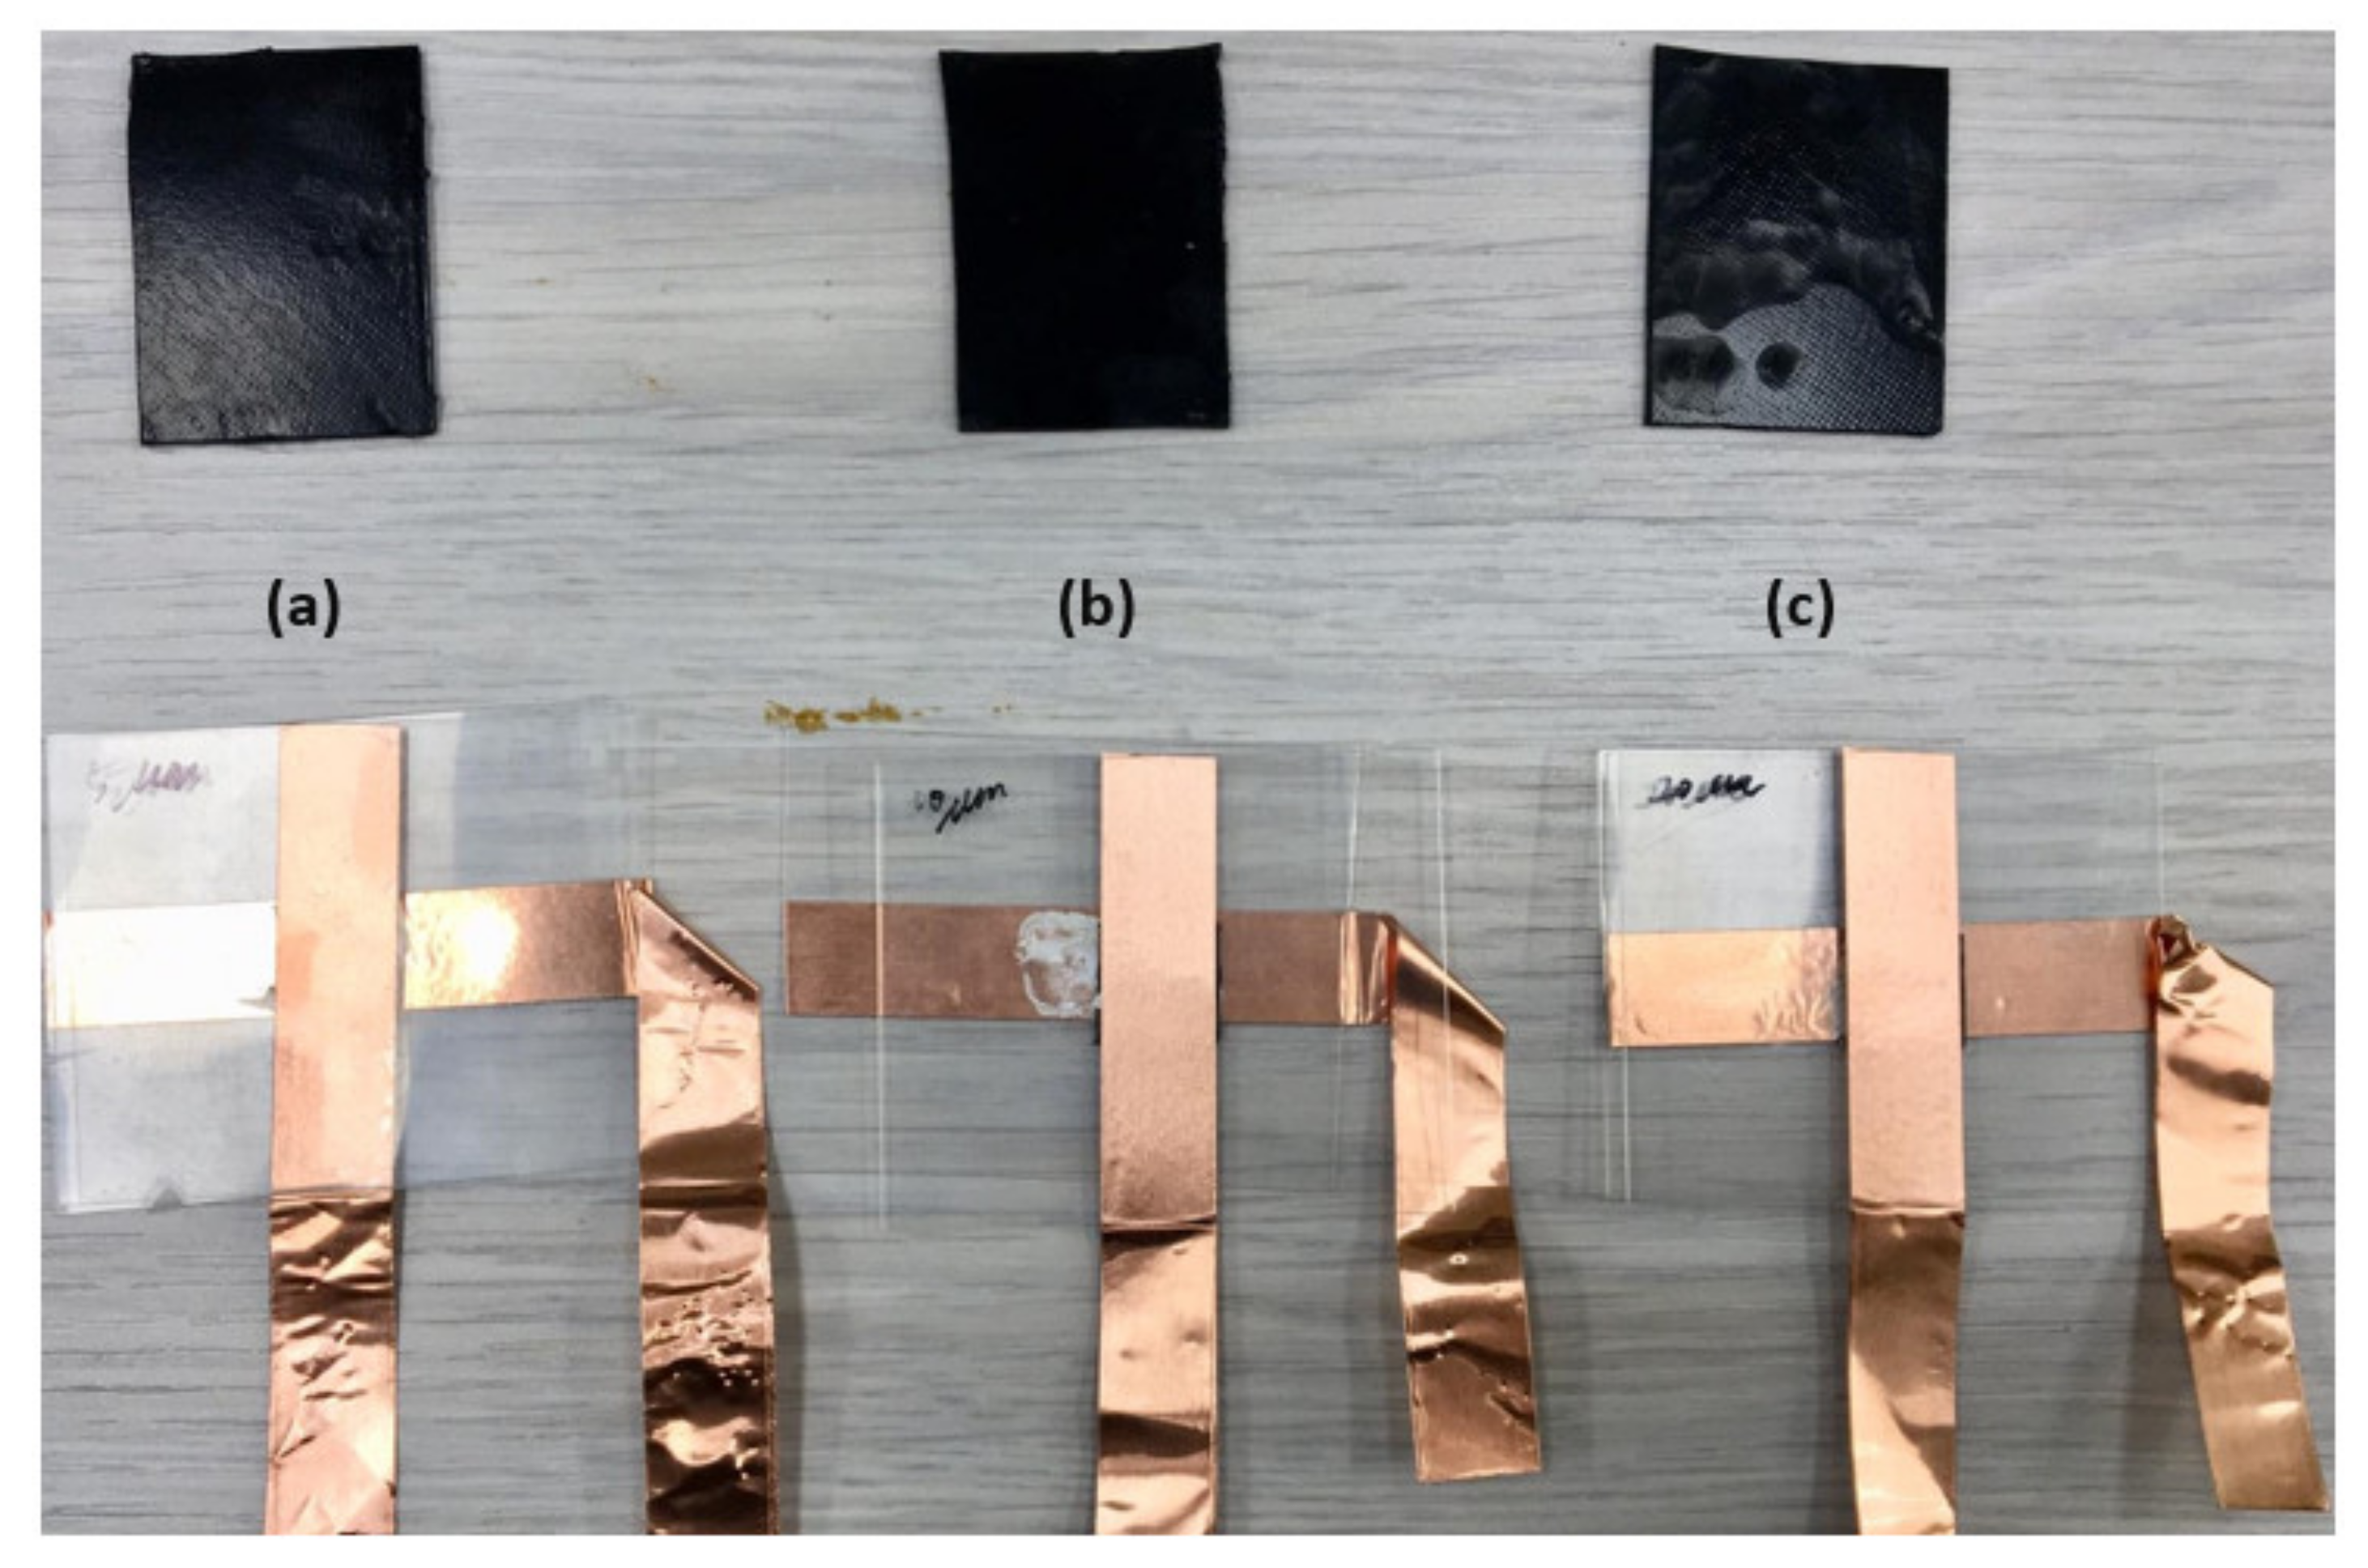
2.2. Fabrication of Composites

The MWCNTs were coated on PMMA particles by using a solution mixing and drying process. The MWCNT-coated PMMA particles were prepared by dispersing 0.5 g of MWCNTs in PMMA (8 g) dispersed ethanol solvent bath through sonication for 2 h. The mix was then stirred for 12 h at 1000 rpm using a conventional magnetic stir bar in a beaker. After completion of stirring, a gray-colored mud-like slurry precipitated, while a small number of particles remained floating on the solvent. The solution was then centrifuged for 30 min at 15,000 rpm to separate the residues. The resultant mixture was then completely dried at 60 °C in a vacuum oven for an hour. A specific amount of MWCNT-coated PMMA microbeads was added to the TPU matrix (3 wt.% relative to TPU) of different sizes (5, 10, and 20 μm) and pressed using a hot press machine (Auto M-NE, H 3891, Carver, USA) at 200 °C. The fabricated composites were removed and cut for testing. A schematic of the fabrication of MWCNT-coated PMMA composites is shown in Figure 1.

2.3. Characterization

The electrical resistivity of the fabricated composites was measured under various applied loads using a Metrotech tester operating at 220 V, 60 Hz, and 30 W (TC21206C, South Korea) and Force Tester (MCT2150, AANDD Japan). Sample morphologies were examined by using scanning electron microscopy (SEM; JEOL JSM-6330F, Japan) and the Raman point mapping method with a 100x objective lens. Figure 6 shows a graph of interparticle distance as a function of PMMA particle size for the composites, as measured by using SEM images and analyzing them through GeoDict® simulation software. Thermal conductivities of the test samples were measured using a thermal tester (MV 100PR, South Korea).

3. Results and Discussion

MWCNT-coated PMMA beads of different sizes were dispersed into a TPU matrix to determine the effect of additive volume fraction on the pressure sensitivity of the resulting composites. Figure 1 shows a schematic diagram of the process for synthesis of pressure-sensitive polymer composites.

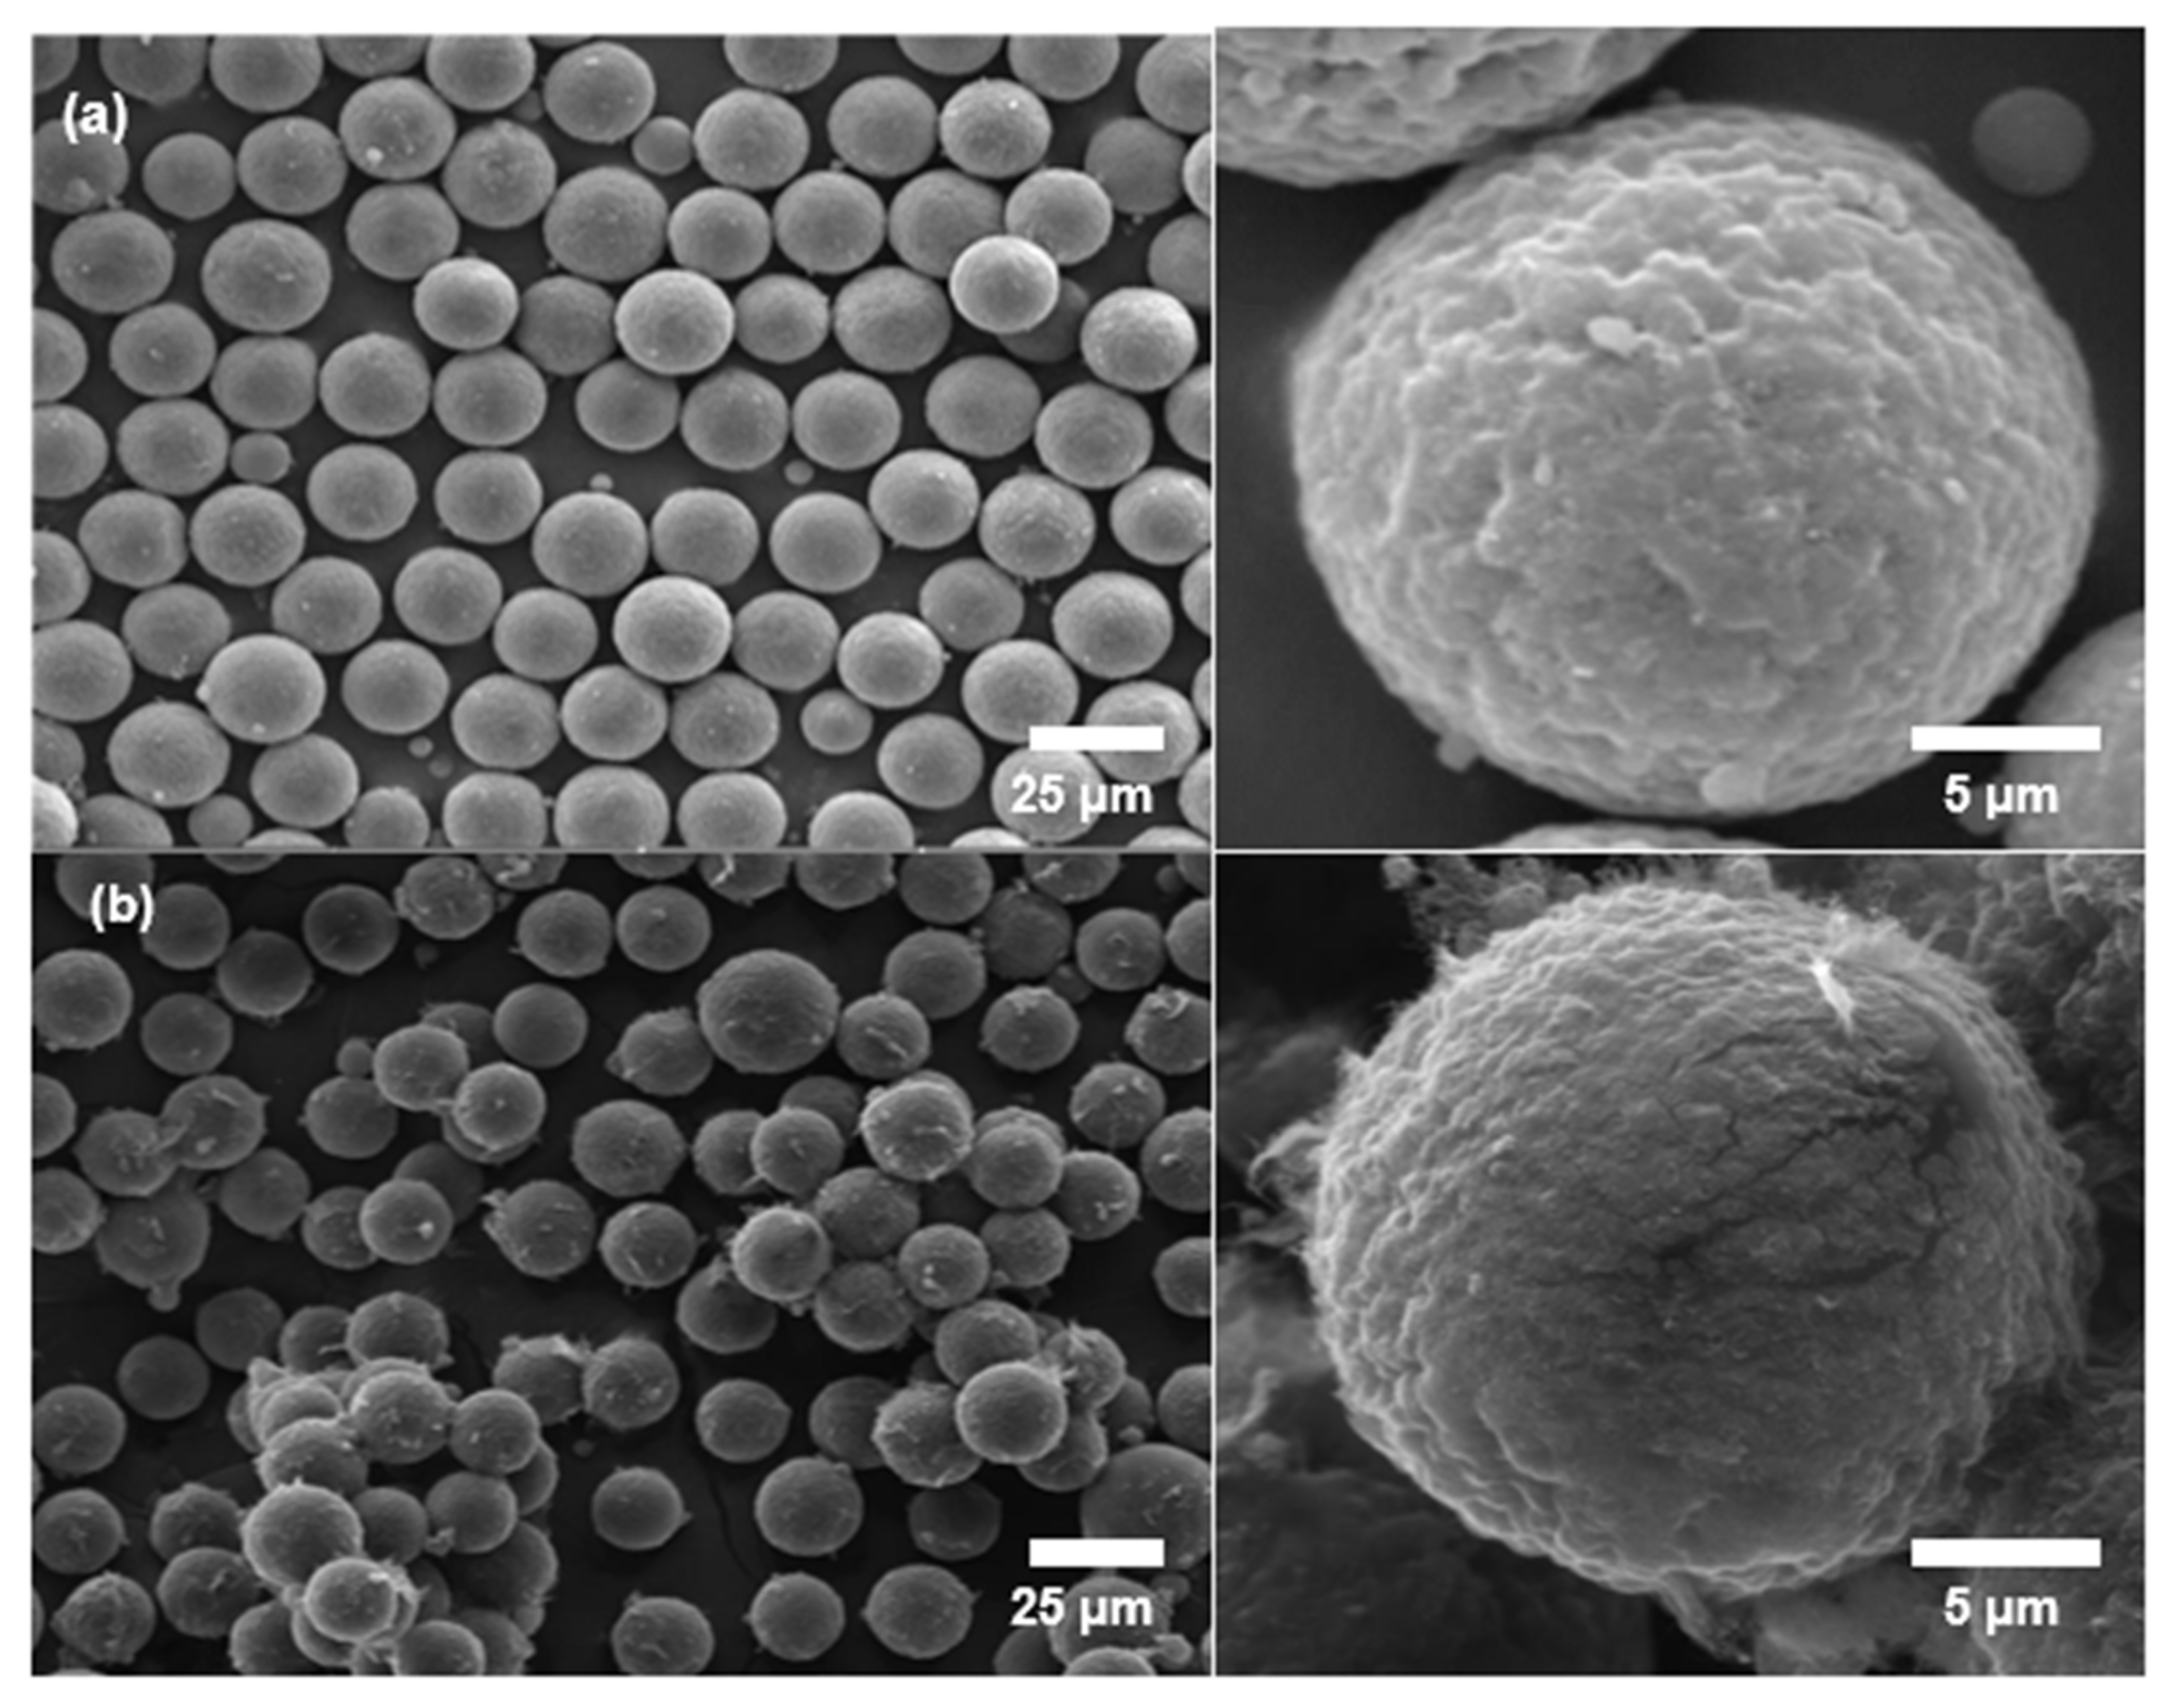
3.1. Scanning Electron Microscopy (SEM) of PMMA Beads

To confirm the MWCNT coating on the PMMA beads, SEM images of 3 wt.% MWCNT coating were obtained, as shown in Figure 2. Figure 2a shows SEM micrographs of the uncoated beads, while Figure 2b shows the MWCNT-coated PMMA beads. The presence of MWCNTs was observed on the surface of the PMMA beads. Coating of MWCNT onto the surface of PMMA beads was also confirmed by Raman spectroscopy.

3.2. Raman Spectroscopy

Raman spectroscopy was performed, and the results indicated the presence of MWCNTs on the surface of the PMMA beads, as shown in Figure 3. The Raman mapping was focused on only one MWCNT-coated PMMA bead, clearly showing the layers (blue colors) of MWCNTs on the surface of the PMMA bead. The MWCNT and PMMA interface was also clearly observed, showing up in red in the Raman mapping in Figure 3. So, from the SEM and Raman spectroscopy results, it can be concluded that the MWCNT was successfully coated on the surface of PMMA beads.

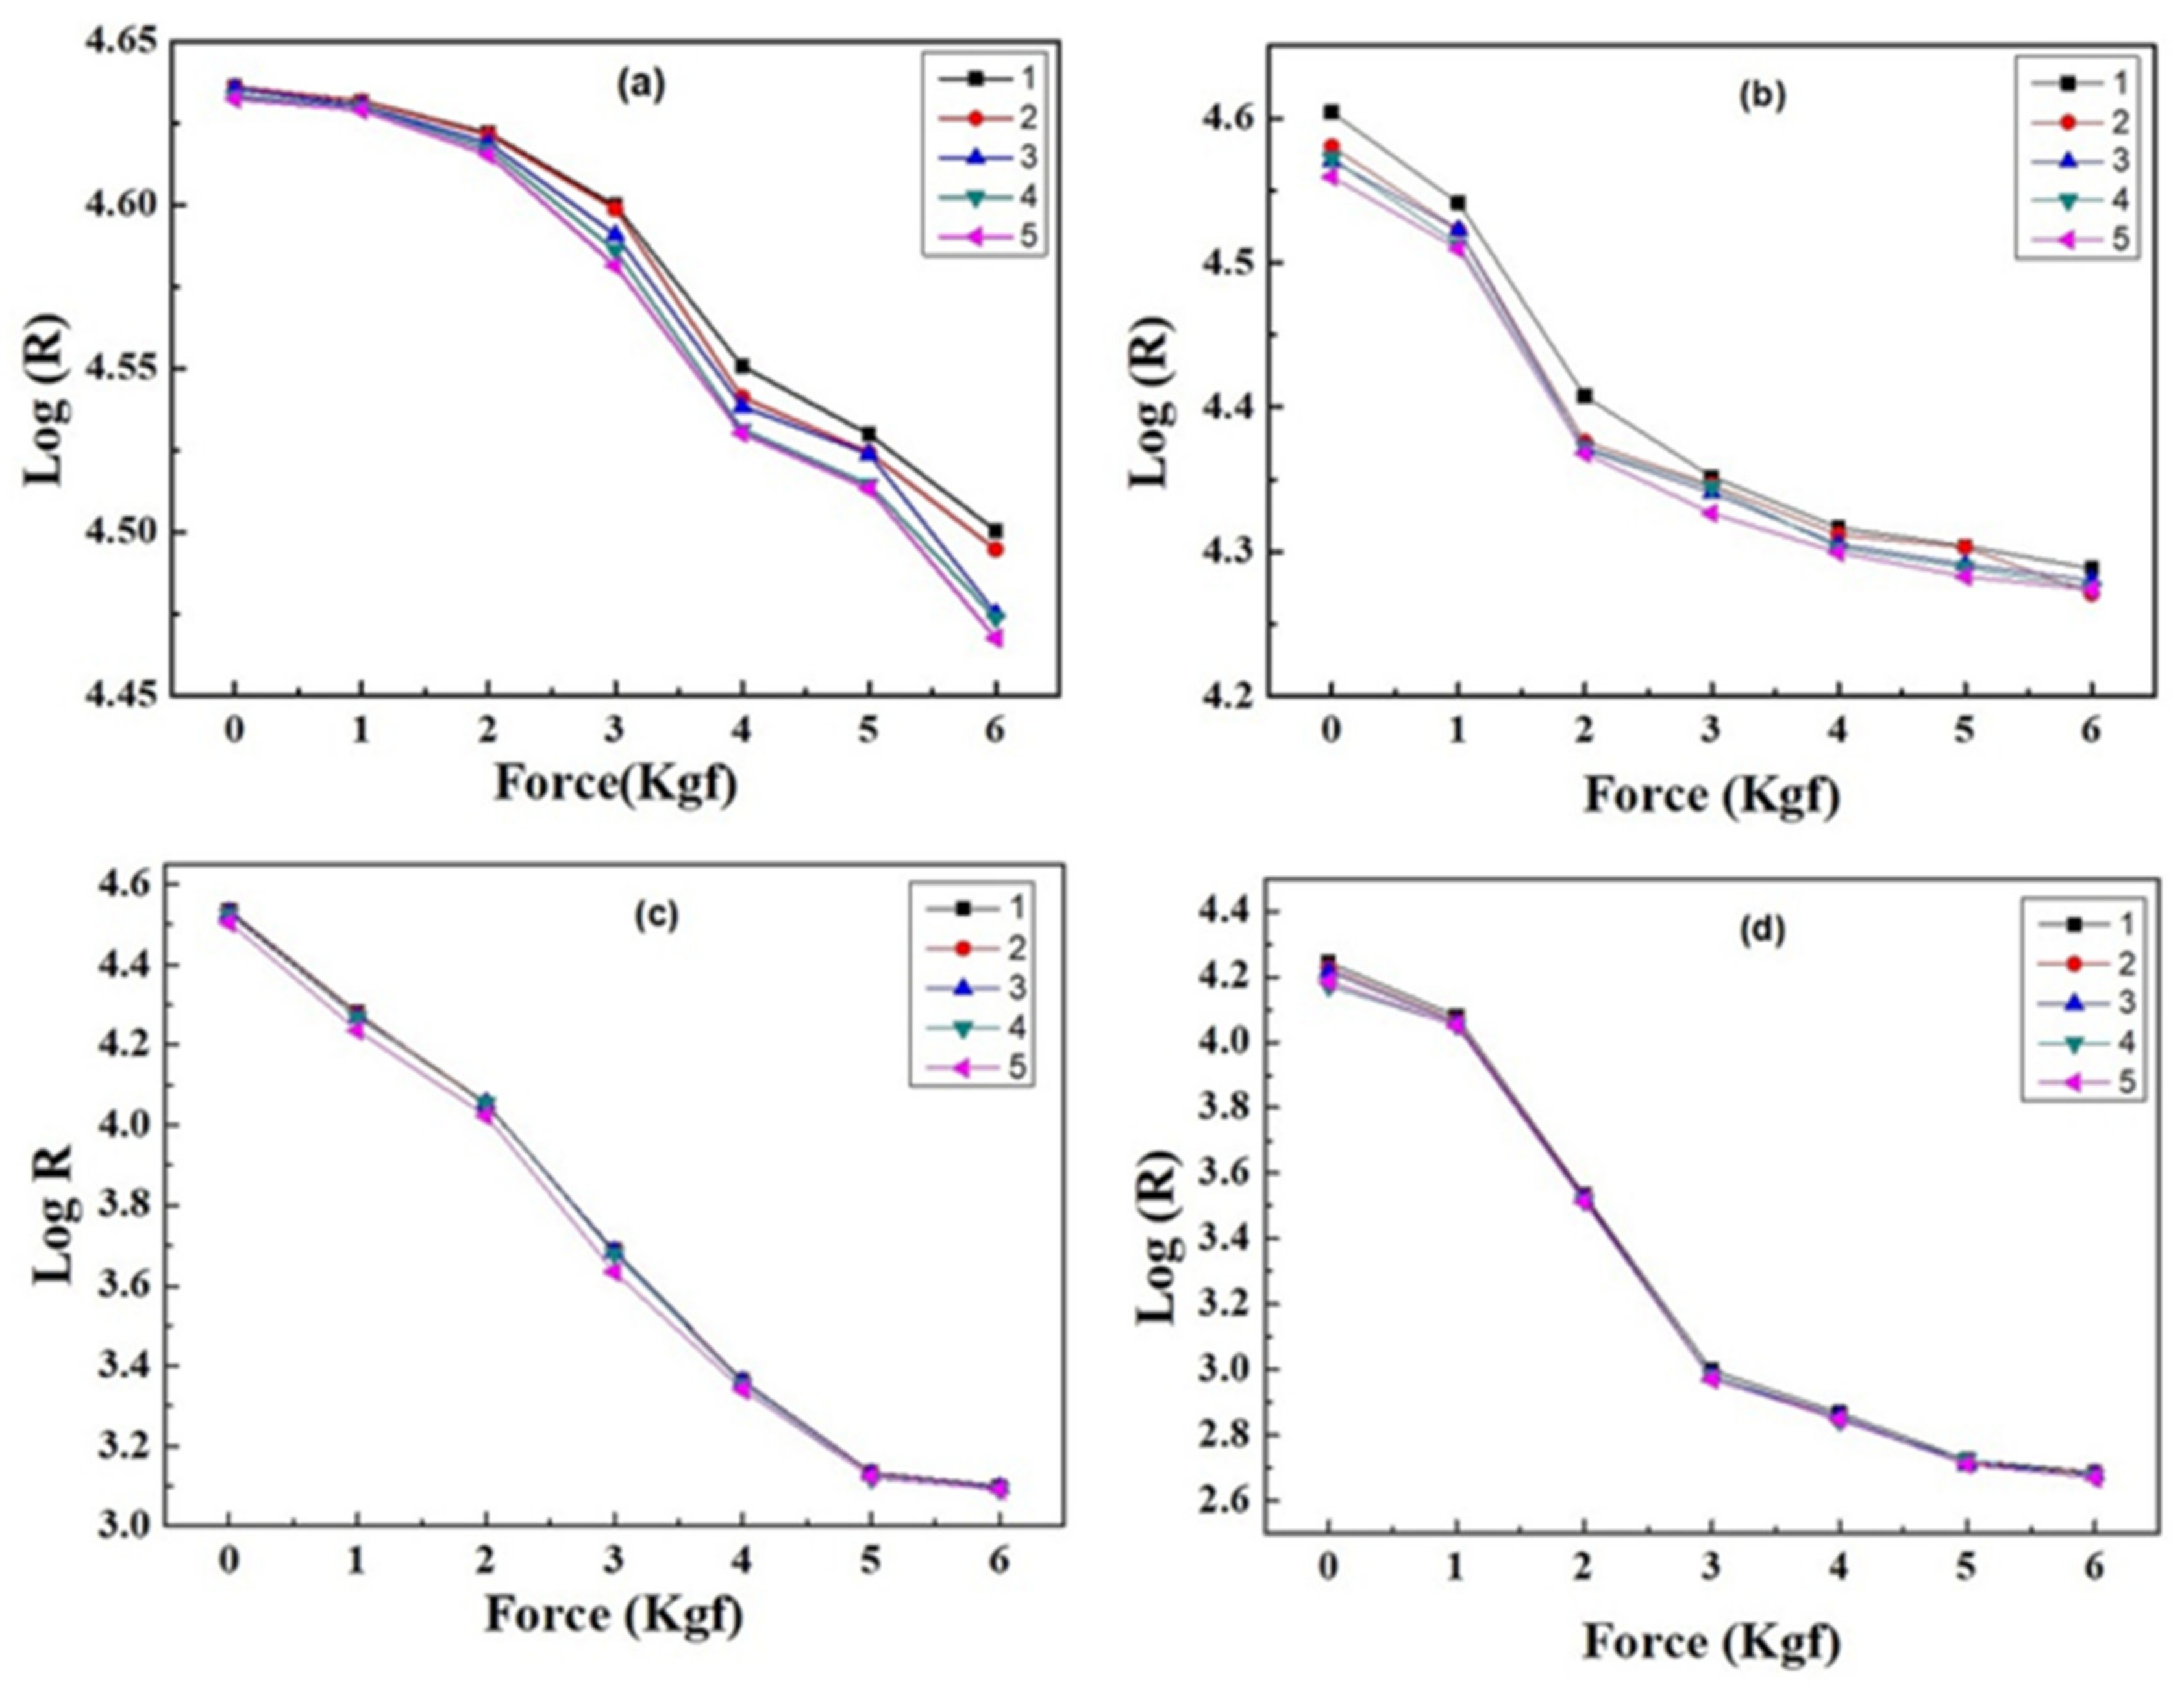
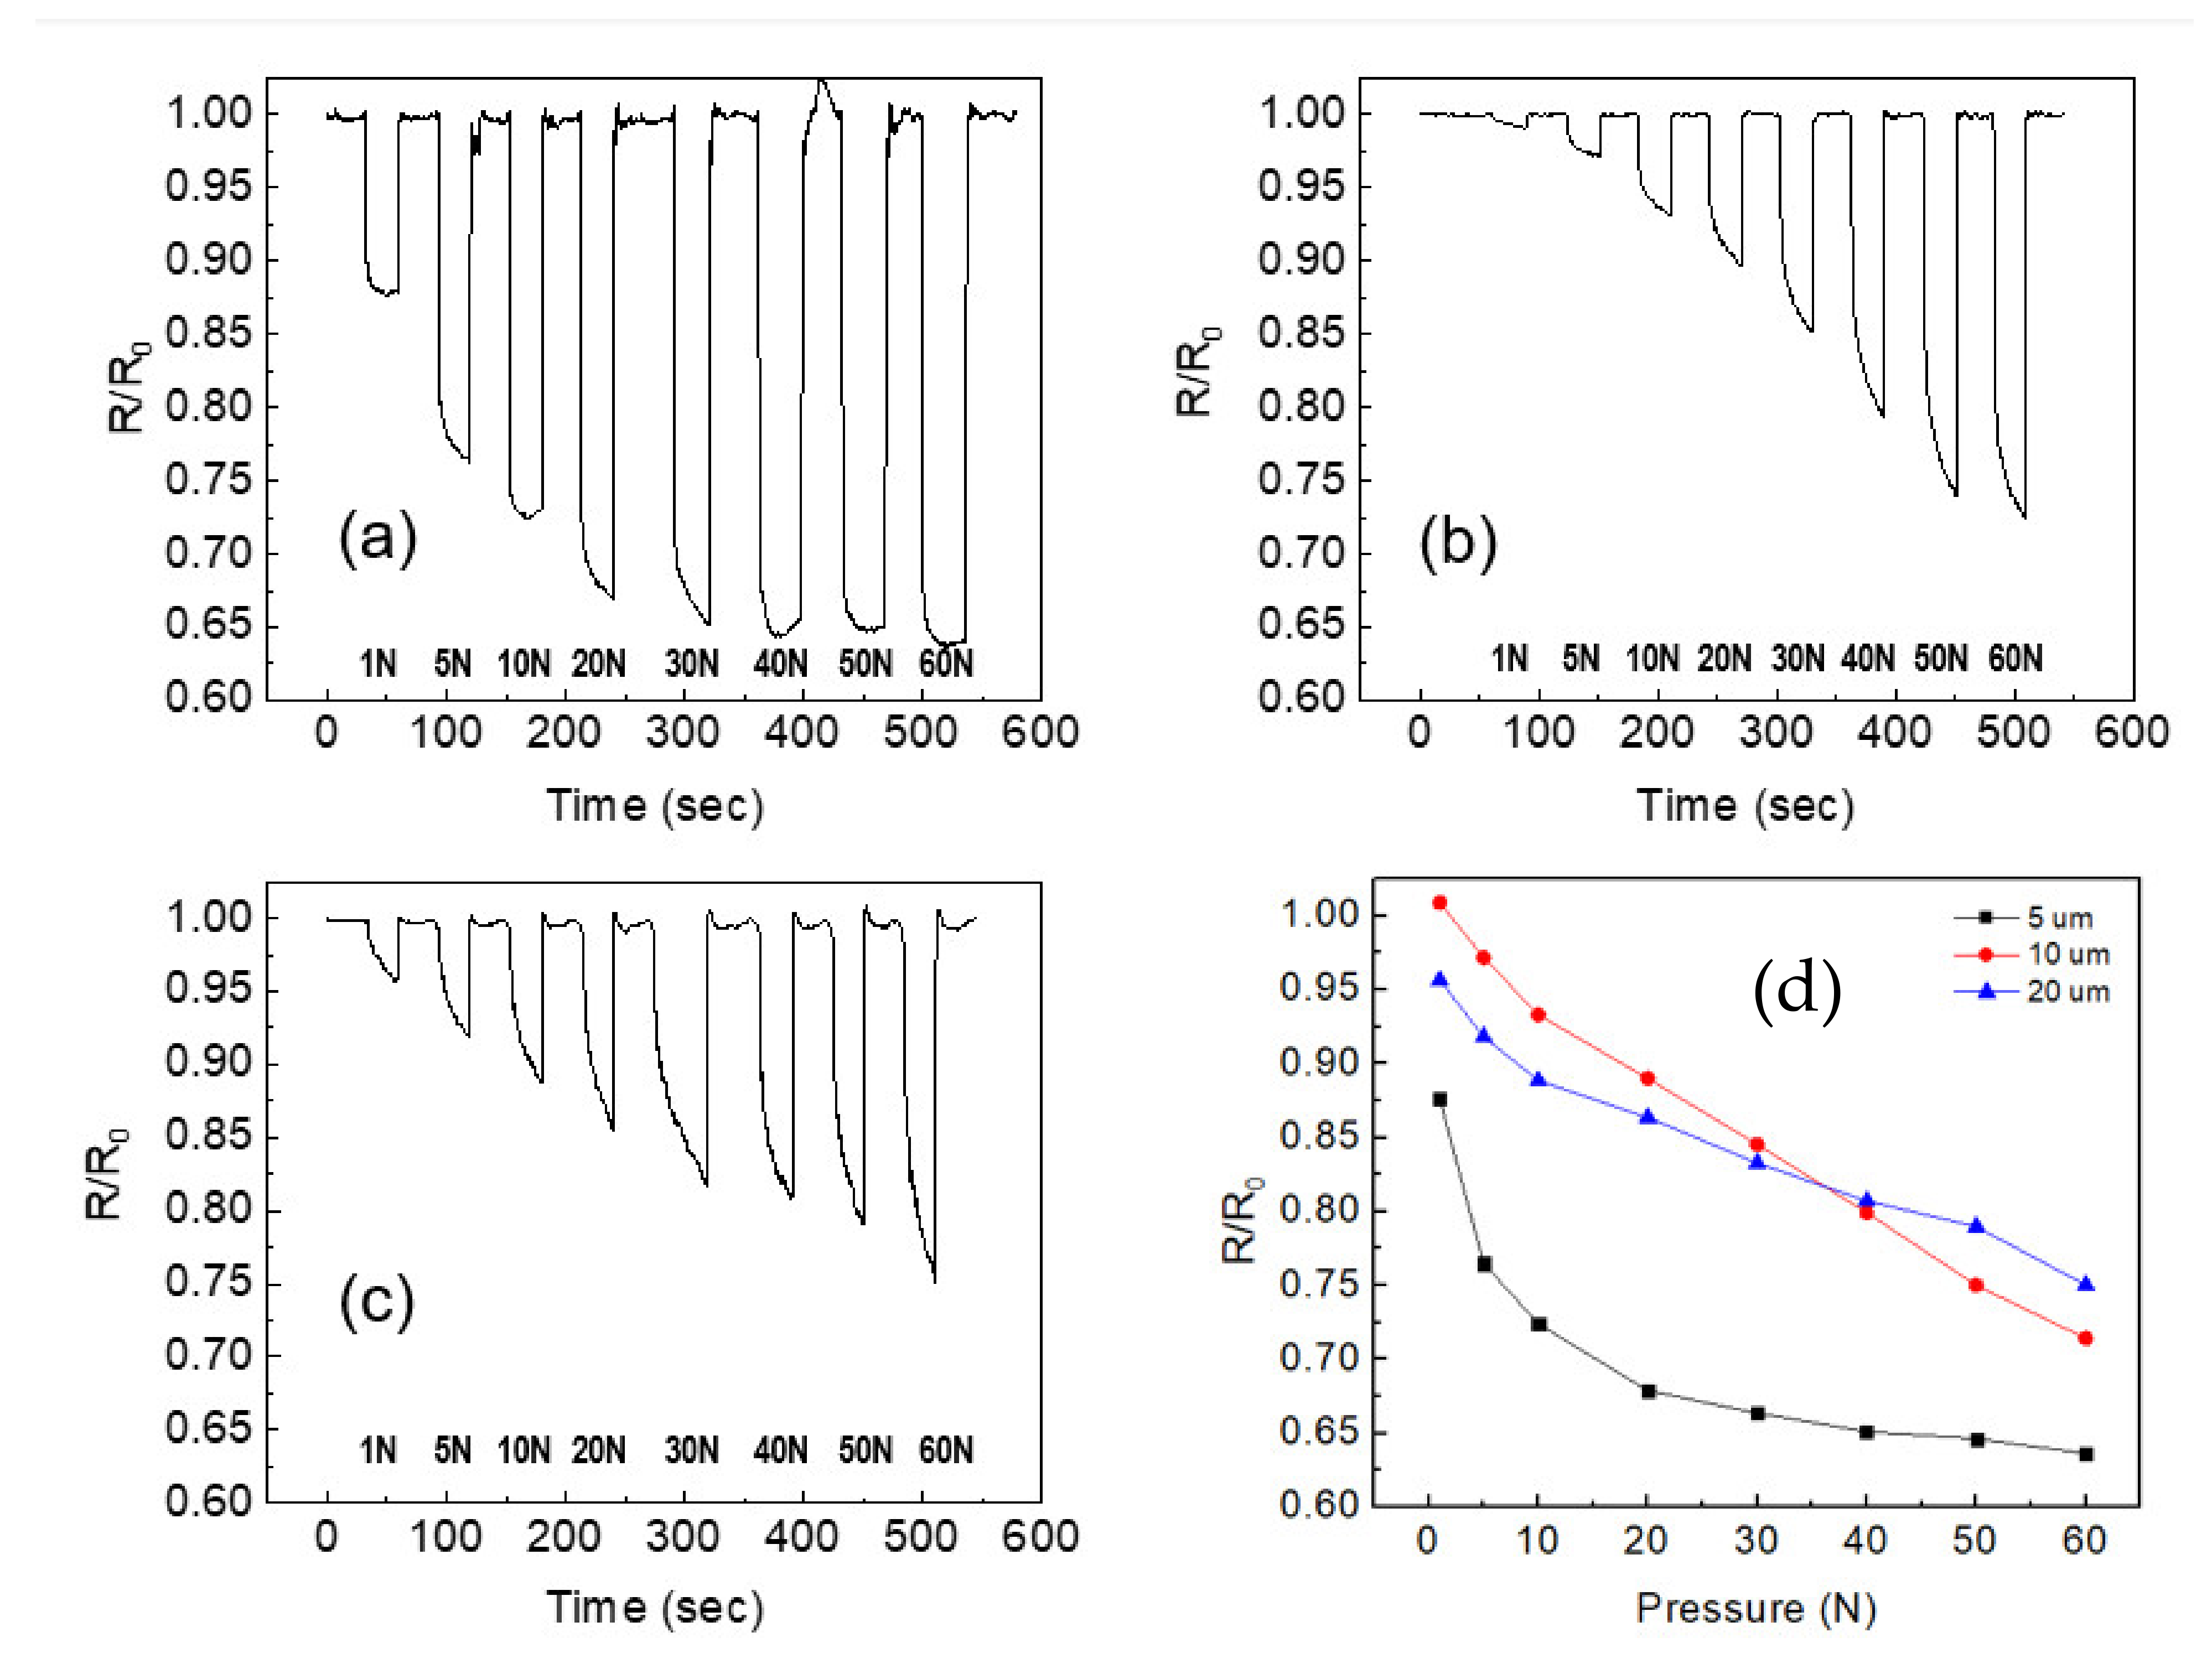
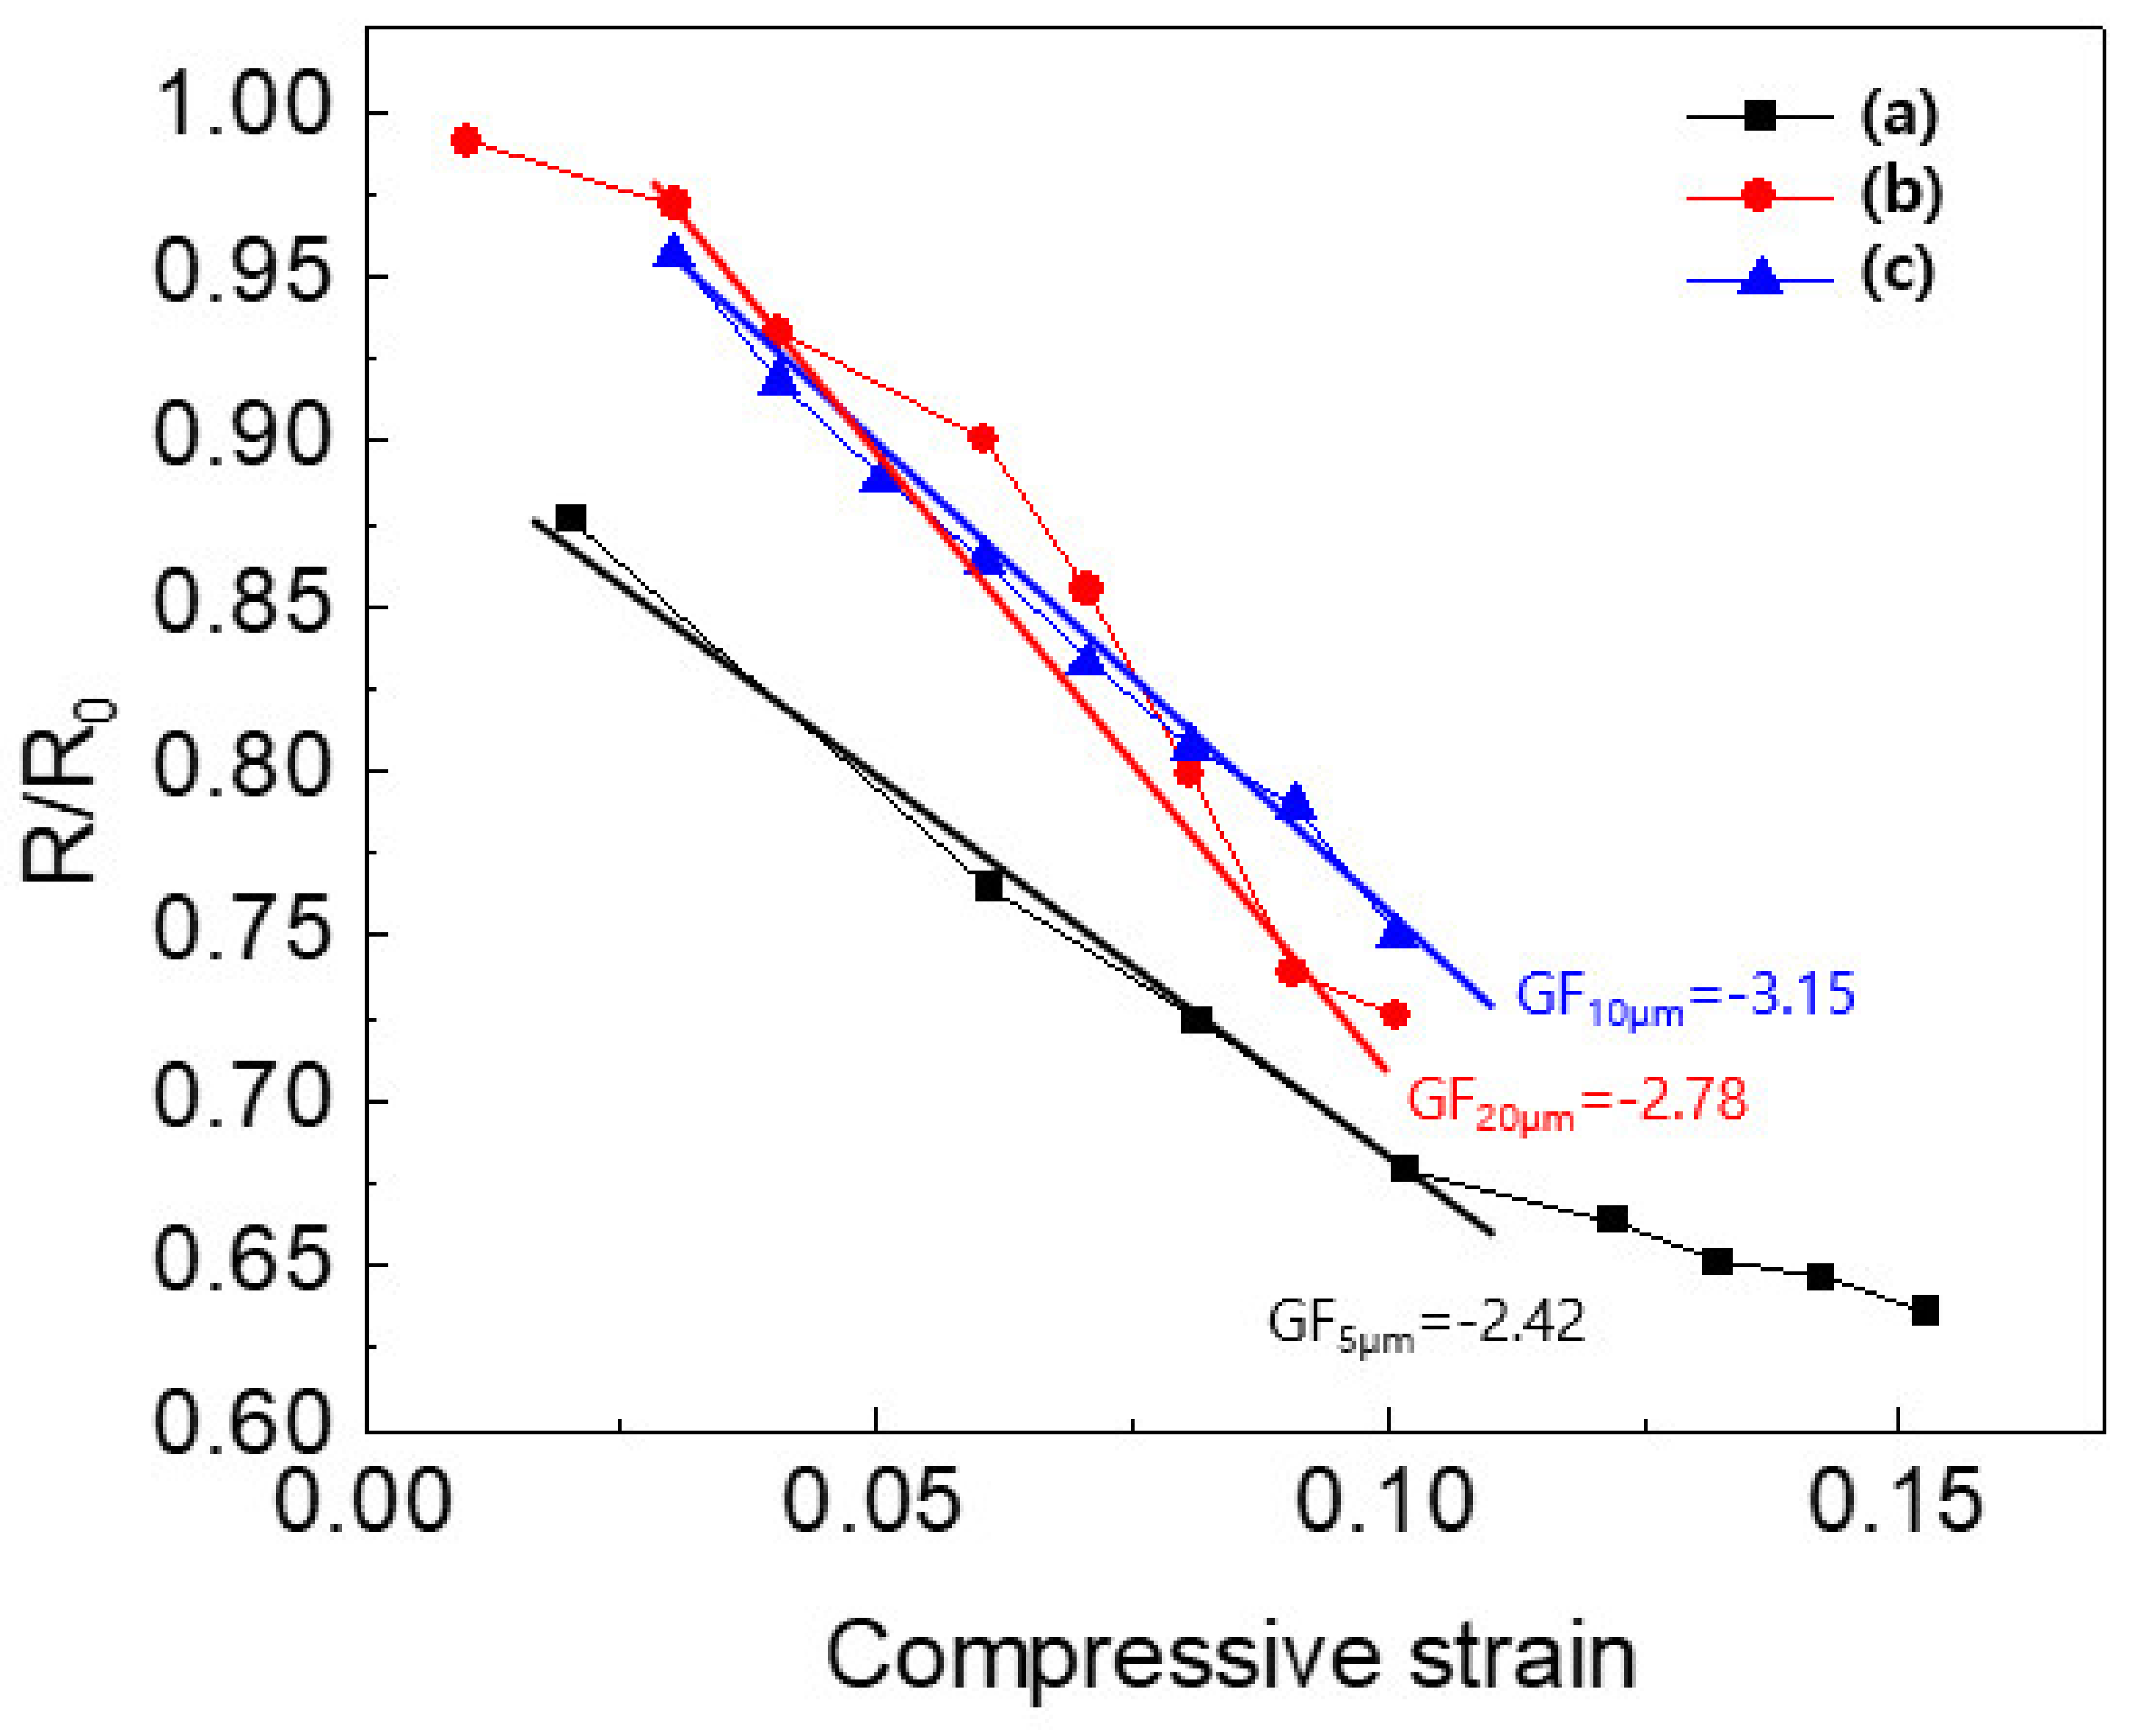
3.3. Pressure Sensing Properties-Strain Gauge Factors

The electrical resistivity of the composites fabricated with TPU and MWCNT and those fabricated with MWCNT-coated PMMA beads/TPU were measured and compared. The electrical resistivity values of the composites and a blank sample that did not contain PMMA beads were measured by increasing external pressure. There were differences between the composites in the trend of decrease in electrical resistivity with increasing external pressure (Figure 4A a–d). It can be seen from Figure 4Aa that there was an abrupt decrease in electrical resistivity in the region of 2 kgf pressure when only CNT was added to the TPU matrix, with a percolation threshold of around 2–4 kgf. The electrical resistivity then changed gradually as further pressure was applied. No large variations were observed at low pressure in any of the five measurements; however, there were large variations between successive electrical resistivity measurements at higher pressure, suggesting that the elastic recovery of the matrix was slow or that the conductive network structure of MWCNTs was broken. The resistive behavior of the 5 μm MWCNT-coated polymer composite was different from that of the composite without PMMA beads. When the pressure of 1 kgf was applied to the composite, the coated CNTs easily moved close to each other because the PMMA microbeads occupied a certain volume of the polymer matrix (known as the excluded volume). By increasing the excluded volume, the MWCNT-coated PMMA beads came closer to each other and formed a three-dimensional conducting network through the dispersed CNT and the CNT coating. During composite fabrication, the MWCNT-coated PMMA beads lost some CNTs, which were distributed into the TPU polymer matrix. Thus, even under no pressure, the electrical resistivity of the composites was found to be around log(R) = 4.6. However, when external pressure was applied, the coated beads formed a conductive network around the beads and bead interfaces. When further pressure was applied, the coated beads moved even closer, and the electrical resistivity fell further. As the bead size increased, the excluded volume also increased, and thus the bead-to-bead interface distance decreased, allowing easier formation of a conductive three-dimensional network even at low pressures. Therefore, three different resistivity vs. pressure relationships were observed as the bead sizes changed, as shown in Figure 4Ab. As shown in Figure 4Ab, the 5 μm MWCNT-coated beads had a different electrical resistivity curve compared to the MWCNT-polymer composites with no added beads, as was the case for the composites containing MWCNT-coated PMMA beads (10 and 20 μm) in Figure 4Ac,d. Force was applied and removed five times on each composite to confirm the repeatability of the pressure-sensing response of the composites.
Figure 4B shows the real-time measurement of the change in resistance with time under different applied pressures. For sample (a) with 5 μm PMMA beads, the resistance decreased with the increase in pressure up to 30 N, but after that, there was not much variation in resistance with increasing pressure. This suggests that the composite did not show pressure sensitivity at higher pressures. Additionally, in the case of sample c with 20 μm PMMA beads, the resistance decreased with the increase in pressure but there was not much difference in the resistance values at higher pressures. That result also suggests that sample (c) with 20 μm PMMA beads did not show high-pressure sensitivity at higher pressure values. In the case of sample (b) with 10 μm PMMA beads, the decrease in resistance with increasing pressure was higher, and the variation in values for resistance at higher pressures of 30 N and above were higher. From these results, it can be concluded that the sensitivity response of samples with 10 μm beads was superior as compared to the other two samples. This can also be confirmed from Figure 4Bd, as the composite with 10 μm PMMA beads showed a steep decrease in resistance as compared to the other two samples [33,34].
The strain gauge factor of the synthesized composites was also calculated and is shown in Figure 4C. Among the fabricated pressure sensors, the composite with 10 nm PMMA beads had a higher gauge factor of 3.15, calculated by taking the slope from Figure 4C. The calculated sensitivity and the gauge factor of the composite showed high sensitivity of the pressure sensor, which suggested its suitability as a pressure sensing material [35].

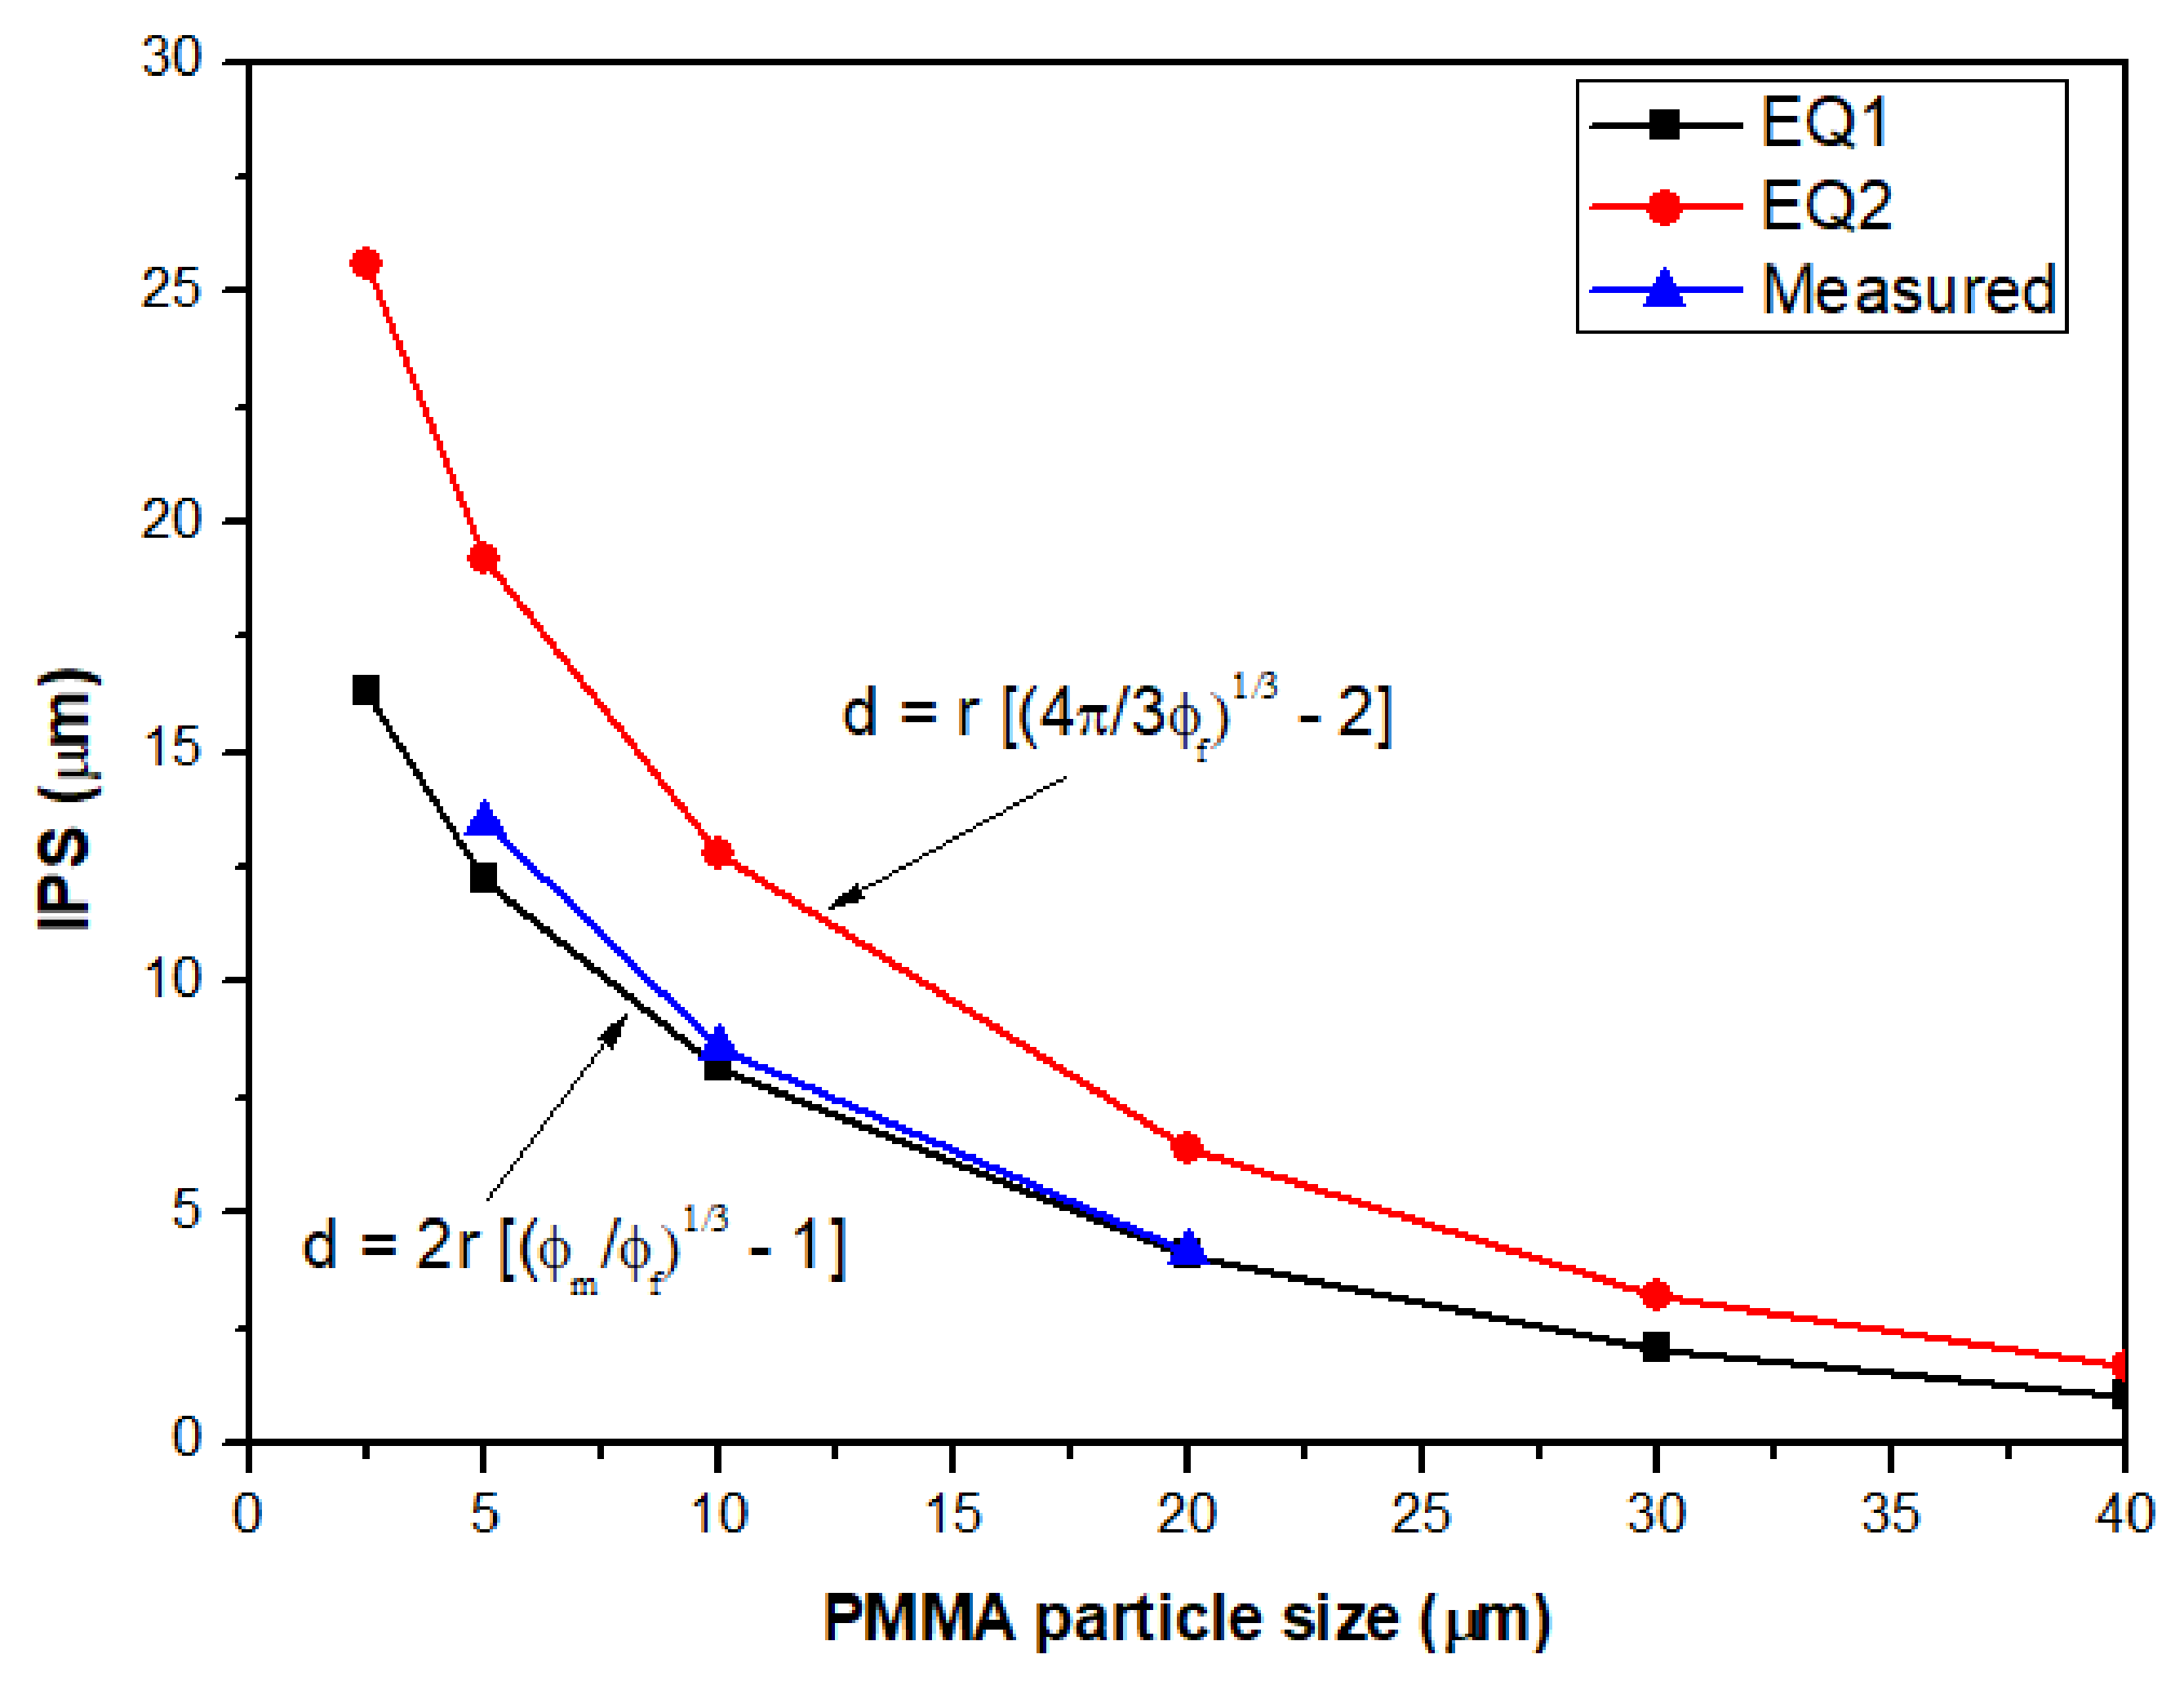
3.4. Calculations of Inter-Particle Distances

The variation in excluded volume changes with changing bead size was investigated by calculations using two different equations as shown below [22,23].
IPDav = r [(4 π/3Φf)1/3 − 2]
IPDpac = 2r [(Φmf)1/3 − 1]
Using Equation (1), the average interparticle distance (IPD av) was calculated, where r is PMMA radius, Φf is the volume fraction of PMMA beads, and Φm is the fractional mass. In Equation (2), practical interparticle distance (IPDpac) was calculated. PMMA particles are considered as well packed. From one PMMA particle volume and the total area, IPD of several PMMA beads was calculated. The variation in interparticle distance with PMMA particle size is represented in Figure 5. It is evident from Figure 5 that the smaller diameter of PMMA yielded a larger interparticle distance than that of the larger particle sizes. Measure data were well fitted with Equation (1), suggesting the particles were well dispersed and nicely distributed.
Figure 6 shows the image of prepared composites along with their assembly for pressure measuring equipment. The composites showed considerable differences in electrical resistivity around the pressure of 1 kgf, along with a sharp fall known as the percolation threshold. After 2 kgf pressure, the electrical resistivity decreased gradually. The early percolation threshold compared to that shown in Figure 4Aa was a result of the presence of PMMA beads, which created an additional excluded volume in the polymeric matrix. This enabled conductive networking at an early stage because the presence of PMMA in the composites helped achieve contact between CNTs, even at low CNT loadings [12]. There were also large variations between successive measurements of electrical resistivity. This might be explained by the fact that due to the presence of many small PMMA beads, the polymer matrix had reduced elastic recovery or took longer to regenerate. For the composites with larger beads of 10 µm, a percolation threshold was observed at 1 kgf, but the electrical resistivity gradually decreased linearly with an external load. The variation in successive measurements was not significant. This might suggest that when 10 μm beads were used, the beads were homogeneously dispersed in the polymer matrix, and either the elastic recovery of the polymer was consistent with time or the polymer itself became slightly harder and thus gained more elasticity. Similarly, the 20 μm MWCNT-coated beads resulted in a sharp percolation threshold at 1 kgf load. The electrical resistivity of these composites was much lower (4.1 at 2 kgf and 2.6 at 6 kgf) than that of the others because the larger beads occupied more volume and created a three-dimensional conductive network through the interfaces between the beads and the MWCNTs in the polymer itself. Because the excluded volume increased when larger PMMA beads were added, the concentration of MWCNTs in the remaining volume of the polymer matrix also increased, hence increasing the composite’s conductivity by bringing the MWCNTs closer to each other, which allowed them to form three dimensional conductive paths [24,25,26,27,28]. No variation in the electrical resistivity was observed for repeated measurements, which indicates these composites are reproducible and reliable for pressure-sensing applications.

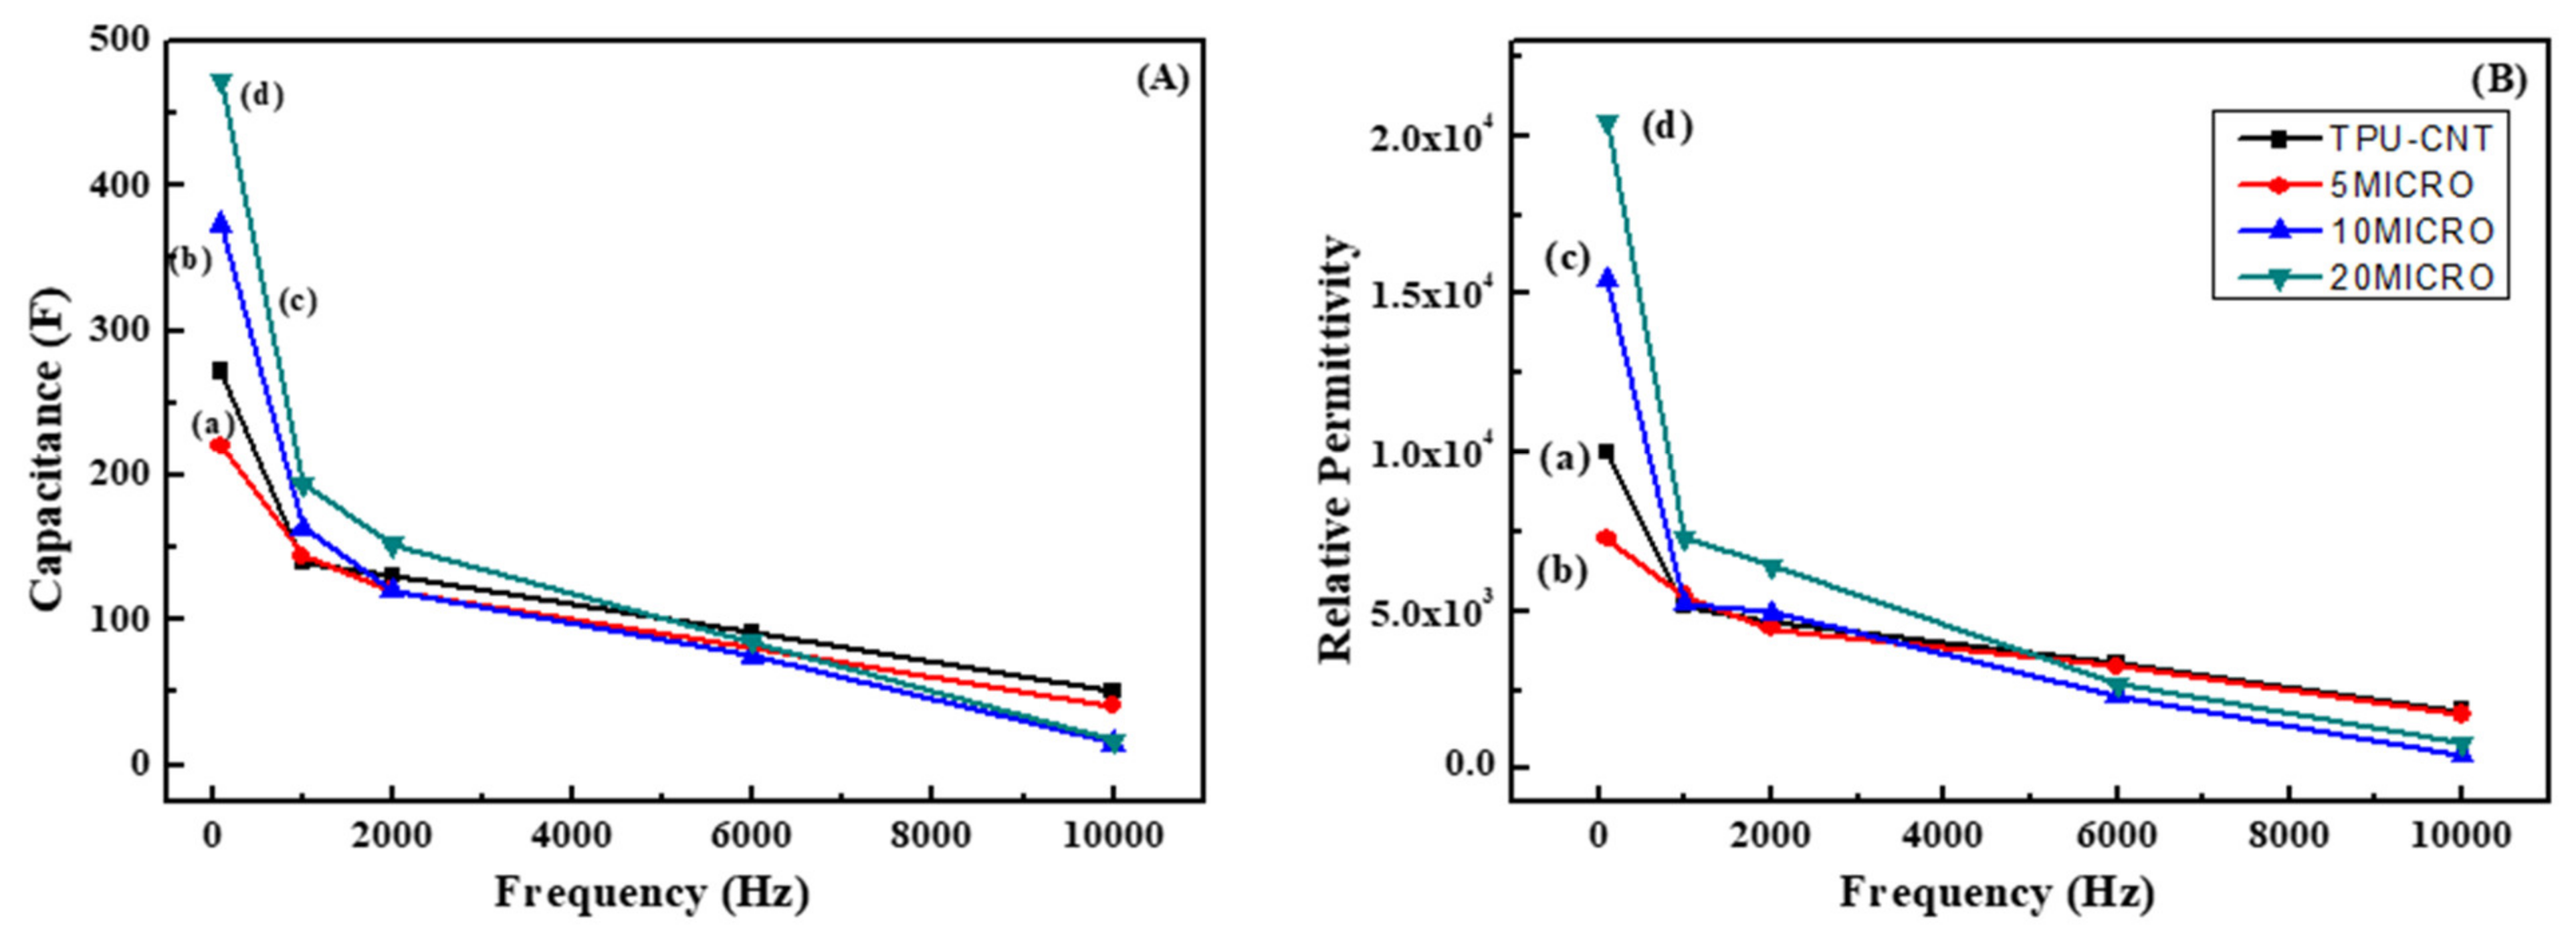
3.5. Capacitance and Relative Permittivity

Figure 7a–d shows the capacitance and dielectric constant of the prepared samples. The dielectric properties of a polymer composite depend on the addition of high (such as ceramic and glass) or low (such as organic material) dielectric constant materials into the polymer matrix to increase or decrease the composite’s permittivity. However, the interfaces created when dispersing high-surface-energy particles such as nanoparticles into a low-surface-energy polymer can conduct charge. The presence of conductive particles in a polymer typically results in a decrease in breakdown strength, beginning at quite low volume concentrations [36]. The breakdown strength of the composites can be improved by the addition of particles that are resistive and have a low dielectric constant [37,38,39]. All samples in this study showed higher dielectric constants at low frequency, which decreased with increasing frequency. This was simply due to the addition of conductive MWCNT particles into the polymer matrix. However, the differences in capacitance and relative permittivity due to the addition of different PMMA beads can be explained in various ways. The samples with 10 and 20 μm PMMA beads showed the greatest dielectric constant over several frequencies. There are a few possible explanations for this increase in dielectric constant relative to the samples with no beads and those with 5 µm PMMA beads. The first could be the good dispersion of 5 μm PMMA beads in the TPU matrix, which means that the MWCNT-coated PMMA beads were not as close to each other. The second is the formation of slow conductive paths because a wider percolation threshold at higher pressure (3 kgf) was observed and confirmed by the electrical resistivity versus pressure curves for the composite samples (Figure 4Aa). On the other hand, this was not the case for the 10 and 20 μm MWCNT-coated PMMA bead composites, firstly due to the formation of a good three-dimensional conductive network with the presence of the MWCNT coatings, and secondly due to the accumulation of large interfacial or grain boundary charges at the interfaces between PMMA-MWCNT and TPU polymer, which is known as the Maxwell–Wagner–Sillars (MW) effect [39,40].

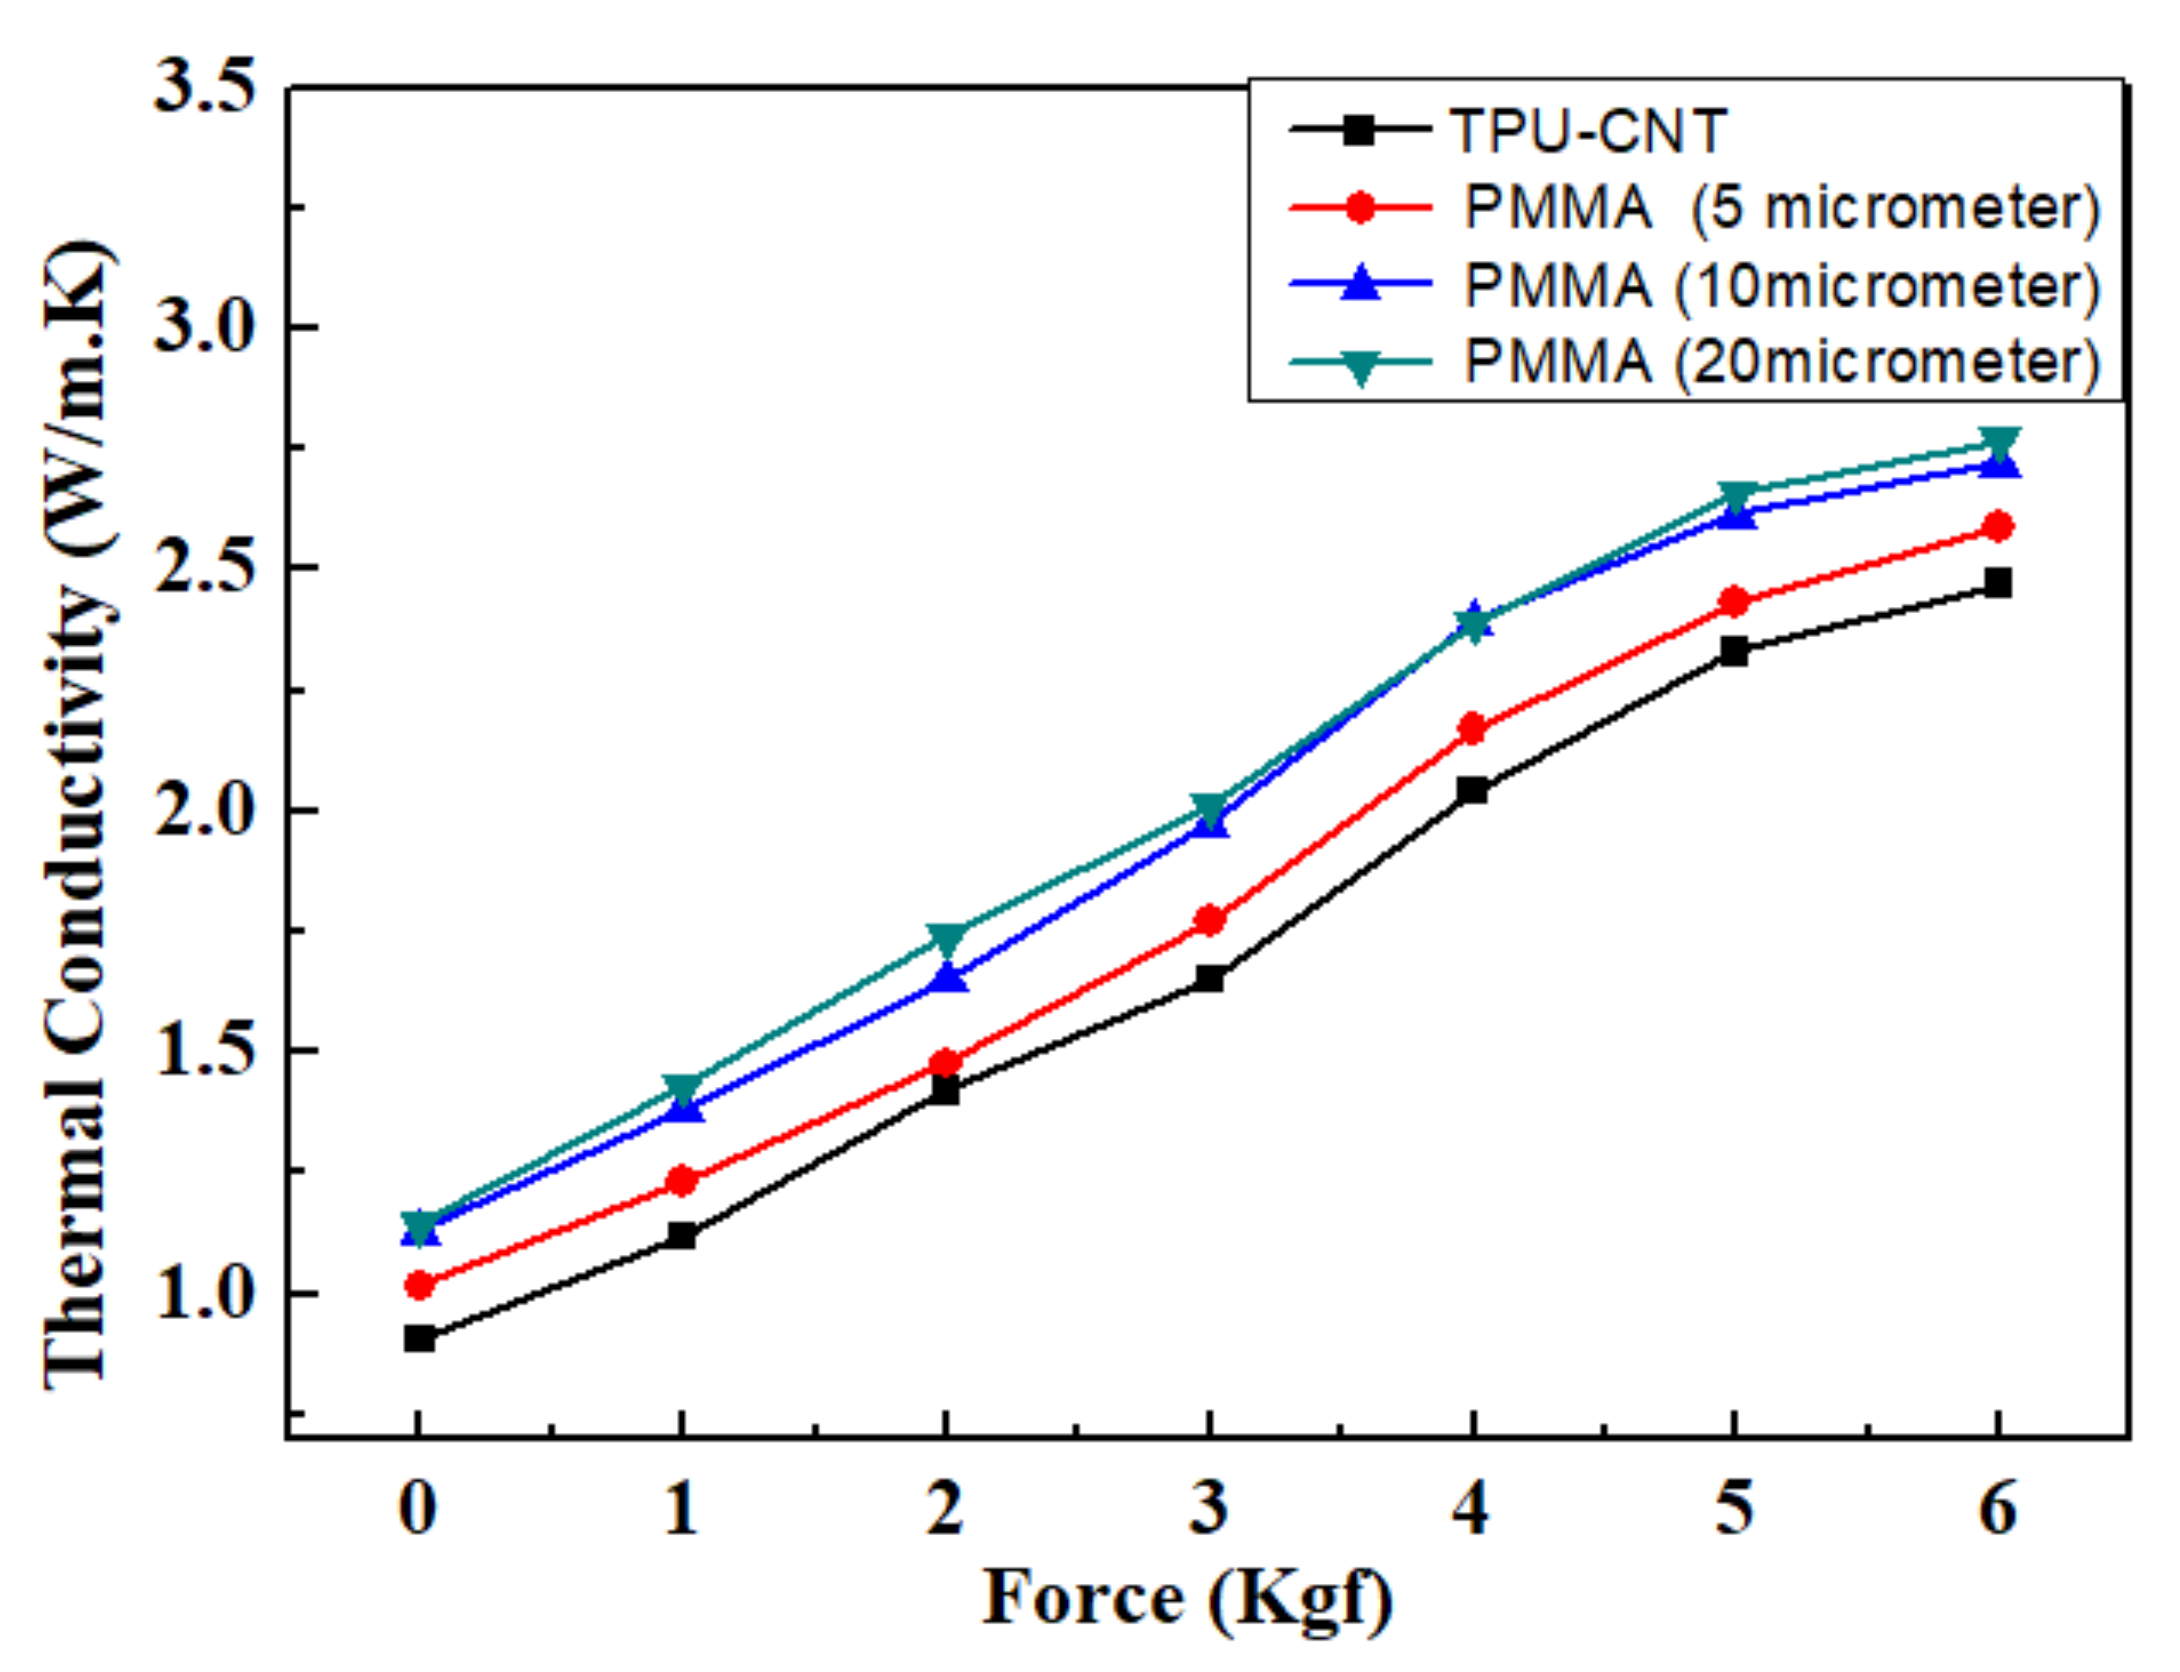
3.6. Thermal Conductivity

Figure 8 shows thermal conductivity variations with applied pressure at room temperature for the composites. It can be observed that there was a gradual increase in the thermal conductivity of the composites up to 5 kgf of applied pressure. The addition of PMMA beads of various sizes to the composites significantly improved the thermal conductivity; among the composites fabricated and tested, the one with 20 µm beads exhibited the highest thermal conductivity values. The values were slightly higher than we observed in our previous work [41,42,43], in which the PMMA beads were not coated with MWCNTs. This reinforces the electrical resistivity findings for the composites with 10 and 20 µm PMMA beads, which did not deviate from each other and showed a linear decrease in electrical resistivity with increasing pressure.

3.7. SEM Images of MWCNT-Coated PMMA/TPU Composites

Figure 9a–c shows SEM images of the dispersed PMMA bead composites in successive measurements. In the 5 μm PMMA bead composites, the beads were found to be well bonded with the TPU, although a few beads were pulled out (forming holes). This suggests that these bead pull-outs caused variation in the electrical resistivity measurements. No such phenomenon was observed in the 10 and 20 μm PMMA bead composites, and, therefore, no clear deviation in electrical resistivity was observed. Moreover, the thermal conductivity also increased linearly.
The mechanism whereby the MWCNT-coated PMMA beads enable resistance reduction at low CNT concentration is shown in Figure 10. In a typical three-dimensional network structure, the PMMA beads inside the TPU polymer matrix occupy a certain volume, and when pressure is applied, the total volume of the elastomeric matrix decreases, thereby bringing the PMMA beads in the matrix closer to each other and creating conductive paths more easily throughout the matrix (with CNTs) and the PMMA-CNT interfaces. Thus, even at low loadings, conductive paths can form that allow an electric current to pass easily and enhanced electroconductive and pressure-sensing properties to be achieved.
Based on the findings, it can be inferred that the fabricated MWCNT-PMMA-based TPU composites have the potential to be used as pressure-sensitive materials and that 10 µm PMMA beads have shown promising results for these applications (since 5 and 20 μm PMMA beads had sharp falls between 1–3 kgf load). The 10 µm beads exhibited a very gradual response to the decrease in electrical resistivity with increasing pressure and showed the highest thermal conductivity among the other composites; furthermore, the strain gauge factor of composites with 10 µm PMMA beads was the highest (3.15) among other composites. Such a unique linear electrical response and repeatable pressure sensing in response to variation in external force are crucial for the reliable application of the composites to the fabrication of pressure-sensitive devices.

4. Conclusions

PMMA beads of different sizes (5, 10, and 20 μm) were first coated with MWCNTs and then dispersed in the TPU matric using the melt mixing method. The effect of PMMA bead size on pressure sensitivity was measured and compared. The pressure sensitivity results show that with the increase in applied pressure on the composites, the MWCNT-coated PMMA beads present in the TPU matrix moved closer to each other and formed three-dimensional conducting network structures at the percolation threshold through the MWCNT-coated PMMA interfaces. The presence of PMMA beads facilitated the achievement of early contact even at low MWCNT loadings. The resulting composites also exhibited improved thermal conductivity. The real-time measurement of the change in resistance with time under different applied pressures showed that for the composite with 10 μm PMMA beads, the decrease in resistance with increasing pressure was higher and the variations in the values of resistance at higher pressures of 30 N and above were also higher, which means that the sensitivity response of composite with 10 μm PMMA beads was superior as compared to the other composites and that the composite with 10 µm PMMA beads had a higher gauge factor of 3.15 relative to the other composites. Pressure sensitivity and strain gauge factor results demonstrated that the resulting composite with 10 µm bead size was more reliable with repeatable pressure sensitivity and thus could be an ideal candidate for pressure-sensing applications. This kind of reliability and gradual fall in electrical response with increasing pressure is significantly important for pressure-sensing applications.

Author Contributions

S.M.I., writing—original draft preparation, G.-M.G. (original draft preparation), M.H. (resources, review and editing) and M.A.A.-H. (Review and editing). All authors have read and agreed to the published version of the manuscript.

Funding

This research received no external funding.

Institutional Review Board Statement

Not applicable.

Informed Consent Statement

Not applicable.

Data Availability Statement

All the data is given in the manuscript.

Acknowledgments

This research was supported by Nano Material Technology Development Program through the National Research Foundation of Korea (NRF) funded by the Ministry of Science, ICT and Future Planning (No. 2016M3A7B4900044), Korea.

Conflicts of Interest

The authors declare no conflict of interest.

References

  1. Wang, C.; Xia, K.; Wang, H.; Liang, X.; Yin, Z.; Zhang, Y. Advanced carbon for flexible and wearable electronics. Adv. Mater. 2019, 31, 1801072. [Google Scholar] [CrossRef]
  2. Farirzadeh, I.; Samani, M.R.; Toghraie, D. Lead removal from aqueous medium using fruit peels and polyaniline composites in aqueous and non-aqueous solvents in the presence of polyethylene glycol. Chin. J. Chem. Eng. 2020, 44, 253–259. [Google Scholar] [CrossRef]
  3. Hadipeykani, M.; Aghadavoudi, F.; Toghraie, D. Thermomechanical Properties of the Polymeric Nanocomposite Predicted by Molecular Dynamics. ADMT J. 2019, 12, 25–32. [Google Scholar]
  4. Liu, H.; Gao, J.; Huang, W.; Dai, K.; Zheng, G.; Liu, C.; Shen, C.; Yan, X.; Guo, J.; Guo, Z. Electrically conductive strain sensing polyurethane nanocomposites with synergistic carbon nanotubes and graphene bifillers. Nanoscale 2016, 8, 12977–12989. [Google Scholar] [CrossRef]
  5. Hadipeykani, M.; Aghadavoudi, F.; Toghraie, D. A molecular dynamics simulation of the glass transition temperature and volumetric thermal expansion coefficient of thermoset polymer-based epoxy nanocomposite reinforced by CNT: A statistical study. Phys. A Stat. Mech. Its Appl. 2020, 546, 123995. [Google Scholar] [CrossRef]
  6. Qin, W.; Kolooshani, A.; Kolahdooz, A.; Saber-Samandari, S.; Khazaei, S.; Khandan, A.; Ren, F.; Toghraie, D. Coating the magnesium implants with reinforced nanocomposite nanoparticles for use in orthopedic applications. Colloids Surf. A Physicochem. Eng. Asp. 2021, 621, 126581. [Google Scholar] [CrossRef]
  7. Rafiaee, S.; Samani, M.R.; Toghraie, D. Removal of hexavalent chromium from aqueous media using pomegranate peels modified by polymeric coatings: Effects of various composite synthesis parameters. Synth. Met. 2020, 265, 116416. [Google Scholar] [CrossRef]
  8. Samani, M.R.; Toghraie, D. Using of Polyaniline–Polyvinyl Acetate Composite to Remove Mercury from Aqueous Media. Int. J. Environ. Res. 2020, 14, 303–310. [Google Scholar] [CrossRef]
  9. Ren, M.; Zhou, Y.; Wang, Y.; Zheng, G.; Dai, K.; Liu, C.; Shen, C. Highly stretchable and durable strain sensor based on carbon nanotubes decorated thermoplastic polyurethane fibrous network with aligned wave-like structure. Chem. Eng. J. 2019, 360, 762–777. [Google Scholar] [CrossRef]
  10. Zheng, Y.; Li, Y.; Dai, K.; Liu, M.; Zhou, K.; Zheng, G.; Liu, C.; Shen, C. Conductive thermoplastic polyurethane composites with tunable piezo resistivity by modulating the filler dimensionality for flexible strain sensors. Compos. Part A Appl. Sci. Manuf. 2017, 101, 41–49. [Google Scholar] [CrossRef]
  11. Shokrollahi, K.D.; Karimipour, A.; Toghraie, D. Investigation of Porosity and Permeability of Resin Flow Inside the Mold with Woven Carbon Fibers: Numerical and Experimental Approaches. Fibers Polym. 2021, 22, 2269–2280. [Google Scholar] [CrossRef]
  12. Shokrollahi, K.D.; Toghraie, D.; Hashemian, M. Experimental and Numerical Investigation of Resin Flow Within Different Shapes in the Process of Composite Construction by Using of the Resin Transfer Method. Fibers Polym. 2020, 21, 571–582. [Google Scholar] [CrossRef]
  13. Yousefzadeh, S.; Akbari, A.; Najafi, M.; Akbari, O.A.; Toghraie, D. Analysis of buckling of a multi-layered nanocomposite rectangular plate reinforced by single-walled carbon nanotubes on elastic medium considering nonlocal theory of Eringen and variational approach. Indian J. Phys. 2020, 94, 1009–1023. [Google Scholar] [CrossRef]
  14. Yang, Y.; Gao, W. Wearable and flexible electronics for continuous molecular monitoring. Chem. Soc. Rev. 2018, 48, 1465–1491. [Google Scholar] [CrossRef]
  15. Ma, Z.; Wei, A.; Ma, J.; Shao, L.; Jiang, H.; Dong, D.; Ji, Z.; Wang, Q.; Kang, S. Lightweight, compressible, and electrically conductive polyurethane sponges coated with synergistic multiwalled carbon nanotubes and graphene for piezoresistive sensors. Nanoscale 2018, 10, 7116–7126. [Google Scholar] [CrossRef]
  16. Li, J.; Bao, R.; Tao, J.; Peng, Y.; Pan, C. Recent progress in flexible pressure sensor arrays: From design to applications. J. Mater. Chem. C 2018, 6, 11878–11892. [Google Scholar] [CrossRef]
  17. Barick, A.; Tripathy, D.K. Preparation, characterization and properties of acid functionalized multi-walled carbon nanotube reinforced thermoplastic polyurethane nanocomposites. Mater. Sci. Eng. B 2011, 176, 1435–1447. [Google Scholar] [CrossRef]
  18. Scognamillo, S.; Gioffredi, E.; Piccinini, M.; Lazzari, M.; Alzari, V.; Nuvoli, D.; Sanna, R.; Piga, D.; Malucelli, G.; Mariani, A. Synthesis and characterization of nanocomposites of thermoplastic polyurethane with both graphene and graphene nanoribbon fillers. Polymer 2012, 53, 4019–4024. [Google Scholar] [CrossRef]
  19. Wang, M.; Sun, Y.; Yang, X.; Zhao, J. Sensitive determination of Amaranth in drinks by highly dispersed CNT in graphene oxide “water” with the aid of small amounts of ionic liquid. Food Chem. 2015, 179, 318–324. [Google Scholar] [CrossRef]
  20. Zare, Y. Modeling of tensile modulus in polymer/carbon nanotubes (CNT) nanocomposites. Synth. Met. 2015, 202, 68–72. [Google Scholar] [CrossRef]
  21. Wang, C.; Hou, X.; Cui, M.; Yu, J.; Fan, X.; Qian, J.; He, J.; Geng, W.; Mu, J.; Chou, X. An ultra-sensitive and wide measuring range pressure sensor with paper-based CNT film/interdigitated structure “Development of electrical conductivity with minimum possible percolation threshold in multi-wall carbon nanotube/polystyrene composites. Carbon 2011, 49, 4571–4579. [Google Scholar] [CrossRef]
  22. Sun, X.; Sun, J.; Li, T.; Zheng, S.; Wang, C.; Tan, W.; Zhang, J.; Liu, C.; Ma, T.; Qi, Z.; et al. Flexible Tactile Electronic Skin Sensor with 3D Force Detection Based on Porous CNTs/PDMS Nanocomposites. Nano-Micro Lett. 2019, 11, 57. [Google Scholar] [CrossRef] [PubMed] [Green Version]
  23. Charara, M.; Abshirini, M.; Saha, M.C.; Altan, M.C.; Liu, Y. Highly sensitive compression sensors using three-dimensional printed polydimethylsiloxane/carbon nanotube nanocomposites. J. Intell. Mater. Syst. Struct. 2019, 30, 1216–1224. [Google Scholar] [CrossRef]
  24. Hussain, M.; Choa, Y.H.; Niihara, K. Effects of nano ceramics on electrical resistivity of carbon filled rubber materials. Scr. Mater. 2001, 44, 1203–1206. [Google Scholar] [CrossRef]
  25. Hussain, M.; Choa, Y.H.; Niihara, K. Conductive rubber materials for pressure sensors. J. Mater. Sci. Lett. 2001, 20, 525–527. [Google Scholar] [CrossRef]
  26. Hussain, M.; Choa, Y.-H.; Niihara, K. Fabrication process and electrical behavior of novel pressure-sensitive composites. Compos. Part A Appl. Sci. Manuf. 2001, 32, 1689–1696. [Google Scholar] [CrossRef]
  27. Rathod, S.G.; Bhajantri, R.F.; Ravindrachary, V.; Sheela, T.; Pujari, P.K.; Naik, J.; Poojary, B. Pressure sensitive dielectric properties of TiO2 doped PVA/CN-Li nanocomposite. J. Polym. Res. 2015, 22, 57. [Google Scholar] [CrossRef]
  28. Tang, Z.; Jia, S.; Zhou, C.; Li, B. 3D Printing of Highly Sensitive and Large-Measurement-Range Flexible Pressure Sensors with a Positive Piezoresistive Effect. ACS Appl. Mater. Interfaces 2020, 12, 28669–28680. [Google Scholar] [CrossRef]
  29. Wang, L.; Ma, F.; Shi, Q.; Liu, H.; Wang, X. Study on compressive resistance creep and recovery of flexible pressure sensitive material based on carbon black filled silicone rubber composite. Sens. Actuators A Phys. 2011, 165, 207–215. [Google Scholar] [CrossRef]
  30. Shrivastava, N.K.; Kar, P.; Maiti, S.; Khatua, B.B. A facile route to develop electrical conductivity with minimum possible multi-wall carbon nanotube (MWCNT) loading in poly(methyl methacrylate)/MWCNT nanocomposites. Polym. Int. 2012, 61, 1683–1692. [Google Scholar] [CrossRef]
  31. Zhuang, Y.; Guo, Y.; Li, J.; Jiang, K.; Yu, Y.; Zhang, H.; Liu, D. Preparation and laser sintering of a thermoplastic polyurethane carbon nanotube composite-based pressure sensor. RSC Adv. 2020, 10, 23644–23652. [Google Scholar] [CrossRef]
  32. Imran, S.M.; Shao, G.; Haider, M.S.; Hwang, H.J.; Choa, Y.-H.; Hussain, M.; Kim, H.T. Carbon nanotube-based thermoplastic polyurethane-poly(methyl methacrylate) nanocomposites for pressure sensing applications. Polym. Eng. Sci. 2016, 56, 1031–1036. [Google Scholar] [CrossRef]
  33. Zhao, L.; Jiang, B.; Huang, Y. Self-healable polysiloxane/graphene nanocomposite and its application in pressure sensor. J. Mater. Sci. 2019, 54, 5472–5483. [Google Scholar] [CrossRef]
  34. Salman, A.; Sasikala, S.P.; Kim, I.H.; Kim, J.T.; Lee, G.S.; Kim, J.G.; Kim, S.O. Tungsten nitride-coated graphene fibers for high-performance wearable supercapacitors. Nanoscale 2020, 12, 20239–20249. [Google Scholar] [CrossRef]
  35. Hou, Y.; Wang, D.; Zhang, X.-M.; Zhao, H.; Zha, J.-W.; Dang, Z.-M. Positive piezoresistive behavior of electrically conductive alkyl-functionalized graphene/polydimethylsilicone nanocomposites. J. Mater. Chem. C 2013, 1, 515–521. [Google Scholar] [CrossRef]
  36. Cao, Y.; Irwin, P.C.; Younsi, K. The future of nanodielectrics in the electrical power industry. IEEE Trans. Dielectr. Electr. Insul. 2004, 11, 797–807. [Google Scholar] [CrossRef]
  37. Ishimoto, K.; Tanaka, T.; Ohki, Y.; Sekiguchi, Y.; Murata, Y.; Gosyowaki, M. Comparison of Dielectric Properties of Low-density Polyethylene/MgO Composites with Different Size Fillers. In Proceedings of the 2008 Annual Report Conference on Electrical Insulation and Dielectric Phenomena, Quebec, QC, Canada, 26–29 October 2008. [Google Scholar] [CrossRef]
  38. Yao, Y.; Ning, N.; Zhang, L.; Nishi, T.; Tian, M. Largely improved electromechanical properties of thermoplastic polyurethane dielectric elastomer by carbon nanospheres. RSC Adv. 2015, 5, 23719–23726. [Google Scholar] [CrossRef]
  39. Gallone, G.; Carpi, F.; De Rossi, D.; Levita, G.; Marchetti, A. Dielectric constant enhancement in a silicone elastomer filled with lead magnesium niobate–lead titanate. Mater. Sci. Eng. C 2007, 27, 110–116. [Google Scholar] [CrossRef]
  40. Hao, T.; Riman, R.E. Calculation of interparticle spacing in colloidal systems. J. Colloid Interface Sci. 2006, 297, 374–377. [Google Scholar] [CrossRef]
  41. Imran, S.M.; Kim, Y.; Shao, G.N.; Hussain, M.; Choa, Y.-H.; Kim, H.T. Enhancement of electroconductivity of polyaniline/graphene oxide nanocomposites through in situ emulsion polymerization. J. Mater. Sci. 2014, 49, 1328–1335. [Google Scholar] [CrossRef]
  42. Ryu, S.H.; Cho, H.-B.; Moon, J.W.; Kwon, Y.-T.; A Eom, N.S.; Lee, S.; Hussain, M.; Choa, Y.-H. Highly conductive polymethly(methacrylate)/multi-wall carbon nanotube composites by modeling a three-dimensional percolated microstructure. Compos. Part A Appl. Sci. Manuf. 2016, 91, 133–139. [Google Scholar] [CrossRef]
  43. Segal, E.; Tchoudakov, R.; Narkis, M.; Siegmann, A. Thermoplastic polyurethane–carbon black compounds: Structure, electrical conductivity and sensing of liquids. Polym. Eng. Sci. 2002, 42, 2430–2439. [Google Scholar] [CrossRef]
Figure 1. Schematic representation of the fabrication of MWCNT-coated PMMA polymer composites.
Macromol 02 00014 g001
Figure 2. SEM micrographs of (a) uncoated PMMA beads and (b) MWCNT-coated PMMA beads.
Macromol 02 00014 g002
Figure 3. Raman micrographs of MWCNT-coated PMMA bead with Raman spectrum of PMMA, CNT, and interface.
Macromol 02 00014 g003
Figure 4A. Applied force versus Log resistivity. (a) TPU-MWCNT, (b) TPU-(MWCNT-PMMA) (5µm), (c) TPU-(MWCNT-PMMA) (10 µm) and (d) TPU-(MWCNT-PMMA) (20 µm).
Macromol 02 00014 g004a
Figure 4B. Sensitivity of the fabricated composite sensors. Change in R/R0 versus time and applied force: (a) TPU-(MWCNT-PMMA) (5 µm), (b) TPU-(MWCNT-PMMA) (10 µm), and (c) TPU-(MWCNT-PMMA) (20 µm). (d) R/RO vs. pressure curve for TPU-(MWCNT-PMMA) (5, 10 and 20 µm).
Macromol 02 00014 g004b
Figure 4C. Strain gauge factor of (a) TPU-(MWCNT-PMMA) (5 µm), (b) TPU-(MWCNT-PMMA) (10 µm) and (c) TPU-(MWCNT-PMMA) (20 µm).
Macromol 02 00014 g004c
Figure 5. Variation in inter-particle distance with PMMA bead size.
Macromol 02 00014 g005
Figure 6. Pressure-sensitive polymer composites and their assembly for pressure sensitivity measuring equipment. (a) TPU-(MWCNT-PMMA) (5 µm), (b) TPU-(MWCNT-PMMA) (10 µm), and (c) TPU-(MWCNT-PMMA) (20 µm).
Macromol 02 00014 g006
Figure 7. Capacitance (A) and relative permittivity (B) of (a) TPU-MWCNT, (b) TPU-(MWCNT-PMMA) (5 µm), (c) TPU-(MWCNT-PMMA) (10 µm) and (d) TPU-(MWCNT-PMMA) (20 µm).
Macromol 02 00014 g007
Figure 8. Thermal conductivity curve as a function of external pressure.
Macromol 02 00014 g008
Figure 9. SEM images of composites (a) 5 µm (b) 10 µm and (c) 20 µm PMMA bead composites.
Macromol 02 00014 g009
Figure 10. Schematic diagram of the formation of three-dimensional conductive networks.
Macromol 02 00014 g010
Publisher’s Note: MDPI stays neutral with regard to jurisdictional claims in published maps and institutional affiliations.

