
Study of Two Upper Cold Lows and Their Relationship with Locally Intense Rain †

Atmospheric Physics Center, Institute of Meteorology, Havana 11200, Cuba
†
Presented at the 4th International Electronic Conference on Atmospheric Sciences, 16–31 July 2021; Available online: https://ecas2021.sciforum.net .
Environ. Sci. Proc. 2021, 8(1), 42; https://doi.org/10.3390/ecas2021-10323
Published: 22 June 2021
(This article belongs to the Proceedings of The 4th International Electronic Conference on Atmospheric Sciences)
Abstract
:The main objective of the research was to determine the synoptic and mesoscale conditions, which, under the influence of two Upper Cold Lows (UCL), favor the occurrence of locally intense rain in Cuba. From the outputs of the Rapid Refresh (RAP) model, the characteristics of two UCL with four cases of locally intense rain associated with them were analyzed. The variables that were studied are relative humidity, temperature, geopotential height, vertical speed, wind force, divergence and vorticity. Mesoscale conditions were analyzed by using the Weather Research and Forecast System (WRF) model. Vertical cuts, numerical soundings and analysis of radar observations and satellite images were carried out. The CAPE shows extreme values higher than 6000 J/kg near the center of both systems and the LI reaches −13. The cases were developed in an environment of weak vertical wind shear in the surface layer −500 hPa and moderate to strong in the upper troposphere. High relative humidity values were identified at low levels, a dry layer was identified at medium levels and an increase in relative humidity was identified in the 300–200 hPa layer.
1. Introduction
Intense rains are a dangerous meteorological phenomenon, as they tend to cause notable floods of bodies of water, associated with significant floods of fluvial origin, affecting natural ecosystems and human intervention [1]. At the national level, there are several authors who dedicate their research to the subject of heavy rain. As an example, we can quote [2,3], who identified the synoptic patterns capable of generating intense rain for the dry and rainy periods, respectively, in the provinces from Ciego de Ávila to Guantánamo.
Ref. [2] described the mesoscale behavior of air temperature, relative humidity and wind, as well as the internal structure of storms, which favor the occurrence of locally intense rain in six hours in the dry period for the eastern half of Cuba. In addition, ref. [4] determines the synoptic and mesoscale conditions that favor the occurrence of locally intense rain associated with Severe Local Storms (SLS).
In the summer months, when the occurrence of locally intense rain is more frequent, the presence of a semi-permanent trough in the upper troposphere over the Atlantic and Pacific oceans is denoted as the Upper Tropical Tropospheric Vaguada (TUTT), for its acronym in English. Cyclonic vortices known as UCL are generated within this system [5].
Several research studies have been carried out in Cuba about UCL, their characteristics and how they influence the development of severe weather. Ref. [6] analyzed the relationship between these systems and Severe Local Storms (SLS). This is followed by more recent research, such as that of [7], who identified the UCL as a favorable synoptic environment for the occurrence of tornadoes in the rainy season.
Ref. [5] performed a climatology of the UCL that influence the Cuban territory, as well as an analysis of their characteristics and temporal and seasonal behavior. According to Benhamrouche and [8], the UCL are systems that encourage the occurrence of locally intense rain, which in turn can take place in a season due to local factors, not occurring in the surrounding territories [7]. Therefore, the general objective of the research is to determine the synoptic and mesoscale conditions that under the influence of two Upper Cold Lows (UCL) favor the occurrence of locally intense rain in Cuba.
2. Materials and Methods
2.1. Sample Selection
The study area covered the entire Cuban territory. The selection of the case studies was based on the analysis of the General Weather (EGT) reports, prepared by the Weather Forecast Center of the Institute of Meteorology of Cuba (INSMET). The first criterion for the search of the case studies focused on the selection of those days in which there was locally intense rain under a UCL pattern that was located on or near Cuba. However, in order to determine the influence of the systems, mechanisms and processes of the different meteorological scales and their interaction, it was proposed as a second requirement that the case studies should include at least three days under the influence of the weather. The same synoptic pattern and, in at least one, the event in question were generated.
Two study cases were selected, each with three consecutive days, which were 2, 3 and 4 July 2016 and 16, 17 and 18 August 2016 (Table 1), reporting locally intense rain in the first two days of each case. In three of them, there were accumulations of more than 100 mm in 24 h collected by the Network of Rain Gauges of the National Institute of Hydraulic Resources (INRH), and in one, 50 mm in 12 h recorded by the Batabanó meteorological station.
2.2. Computing Tools
During the three consecutive days in which each UCL influenced Cuba and where there were cases of locally intense rain, a synoptic analysis with a higher spatial and temporal resolution was needed to identify the changes that occurred in the UCL. Due to this fact, the outputs of the High-Resolution Rapid Refresh (RAP) Numerical Weather Prediction Model (MNPT) and the Grid Analysis and Display System (GrADS) computational tool were used.
Because a storm cloud can be less than the 13 km spatial resolution of the RAP model, it was necessary to work with the Atmospheric Weather Research and Forecast System (WRF) model with a resolution of 3 km and up to 1 km. This way, it was possible to make a more exhaustive study of the storms that produced the locally intense rains.
2.3. Programming Language and Software Used
For the work with the data of the RAP and WRF model, the implementation of the mathematical algorithm that was developed in order to determine the different parameters and variables, as well as for the graphical outputs of the results, the Python programming language was used on its 2.7 and 3.6 versions. Meanwhile, for the interpolation and graphical output of the precipitation, the software programs System Automated Geoscientific Analyzes (SAGA) and Quantum Geographic Information System (QGIS) and MS-Access for the organization of the data were used.
2.4. Methods
The variables used, both for the mesoscale analysis and for the synoptic analysis, were extracted directly from the WRF and RAP models, respectively. Through these, other variables were obtained from the solution of mathematical equations, with the aim of having a greater amount of data for a better characterization of the UCL and their influence on locally intense rain.
With the RAP model, the variables were analyzed from the surface to the level of 100 hPa, emphasizing the 700–200 hPa layer, as this is where the UCL have the best representation [9]. More emphasis was placed on temperature, geopotential and wind force, as well as its vertical speed, since, according to [6] for the study of UCL, these fields can be used successfully. In addition, the maximum, minimum and average values in the domain of the UCL were calculated, considering the last closed isohypsa. The WRF model was used for the surface layer—500 hPa, in order to analyze the storms that produced the locally intense rains.
3. Results and Discussion
3.1. Synoptic Description
The origin of the UCL corresponding to the case study of 2, 3 and 4 July took place within a deep trough that extended from an upper low, associated with a system of extratropical low pressures. The UCL corresponding to the case study of 16, 17 and 18 August originated within the TUTT on the Western Atlantic. According to the criterion of [10], the UCL that are reflected from the upper troposphere up to 500 hPa are classified as wet, and those that remain above that level are classified as dry. Taking this criterion into account, it was possible to classify the UCL of 2, 3 and 4 July as humid, having representation up to 500 hPa. On the other hand, the UCL that affected during 16, 17 and 18 August is classified as dry, because it remained above 500 hPa (Figure 1). The wet UCL lasted for a period of 8 days, and the dry one for 5 days; both moved to the west and at the end of their evolution, to the northwest, which caused them to affect the entire Cuban territory.
3.2. Analysis of the UCL from the RAP Model
From the data of the RAP model, an analysis of the UCL was carried out in order to characterize them in greater depth and see their possible influence on the generation of locally intense rain.
3.3. Temperature
Because UCL are better defined at 200 and 300 hPa, these two levels were analyzed in greater depth. From now on, the first value will always correspond to the 200 hPa level and the second to the 300 hPa level. The UCL corresponding to 2, 3 and 4 July had an absolute minimum temperature of −58.24 and −38.50 °C.
The average value determined in the downstream domain was also calculated, taking as a reference the last closed isohypsa, which turned out to be −54.10 and −33.60 °C. The UCL corresponding to August 16, 17 and 18 had an absolute minimum temperature of −56.36 and −38.50 °C, the average values in the domain of the system considering the last closed isohypsa were −52.97 and −33.12 °C. In both cases, the variable had its best representation at 300 hPa, although a core of maximum temperature values is observed from 200 to below 500 hPa (Figure 2).
The cold air mass associated with the UCL in their respective centers generated a strong vertical temperature gradient greater than 6.7 × 10⁻³ (°C/m), between the surface and the level of 500 hPa. This, along with mesoscale mechanisms, was able to produce strong convective activity in the afternoon. Consequently, great positive buoyancy was generated in the atmosphere surrounding these systems, favoring the rise of the air mass and creating synoptic conditions conducive to the convective development of cloudiness.
Another feature to highlight is the warm core that was observed in both UCL above the 200 hPa level, having its best representation at 150 hPa (Figure 3). This coincides with what was found by [5] in his climatological study of 479 UCL, which suggested the existence of positive anomalies towards the lower stratosphere. [3] described the observed warming in the lower stratosphere as a great enigma.
3.4. Geopotential Height
The geopotential height of the UCL for the month of July presented absolute minimum values of 12,341 and 9644 mgp, the area that enclosed the last closed isohypsa had significant values of 12,427 and 9714 mgp. The August UCL presented absolute minimums of 12,365 and 9650 mgp, the significant values in the UCL domain reached 12,418 and 9696 mgp. In the two systems analyzed, this variable had its best representation at 200 hPa (Figure 4), being able to be seen in a general way from 125 to 450 hPa.
A three-dimensional analysis of the two UCL was performed between the 150 hPa levels, at 400 hPa in the case of temperature and from 100 hPa to 400 hPa in the case of geopotential height (Figure 5). This showed the deformation of both of the fields’ variables had as they descended in altitude, which represents the fall of the values towards the center of the system, where the extremes meet. The behavior is similar in the two cases, since they decrease proportionally, however, the temperature at the 150 hPa level increases towards the central region.
3.5. Wind Speed
The wind-speed analysis reflected that the circulation of both systems was present from 125 to 450 hPa, being better defined at 200 hPa (Figure 6), where the maximum values of wind speed occurred with 121 km/h for the UCL for July and 95 km/h for the August. These were always found in the northwestern part of the UCL, which coincided with the driest sector of it. The highest value corresponded to the UCL for the month of July, which also had the lowest temperatures and geopotential height. This evidenced the direct relationship of these two variables with respect to the circulation of the system, since their increase generated a decrease in wind speed.
3.6. Relative Vorticity
The level of 200 hPa was where the cyclonic vorticity generated by both systems was best represented (Figure 7), because its circulation was better defined on this. The UCL for the month of July had an absolute maximum value of 3.94 × 10⁻³ s−1 at the level of 200 hPa, higher than that presented by the UCL for August with 2.5 × 10⁻³ s−1. The positive vorticity values found in the 200–450 hPa layer favored the upward movements at these levels, encouraging the convection that began in the lower atmosphere from this altitude.
The highest accumulated precipitation occurred in the case study corresponding to 2, 3 and 4 July (Figure 8), which could be related to the fact that the UCL that affected during those days had a better representation in the fields and variables analyzed. This also indicates a close relationship between the characteristics of the UCL and the occurrence of intense rain and therefore the dependence of these events on the prevailing synoptic system. Precipitation was more numerous on 3 July and 16 August, surely related to the position and intensity of the UCL.
3.7. CAPE and LI
The CAPE and the LI had their most representative values in the area that enclosed the last closed isohypsa of the UCL, being more significant for the case corresponding to days 2, 3 and 4 of July (Figure 9a,b). The CAPE values in this ranged between 4500 and 6200 J/kg and the LI between −10 and −15. In the case corresponding to 16, 17 and 18 August, the values were between 3500 and 4800 J/kg and −9 and −13, respectively (Figure 9c,d).
This shows that the UCL is a synoptic system capable of generating a large amount of energy and stimulating the upward movement of large air masses. The CAPE and LI values confirm that the UCL of 2, 3 and 4 July was more intense, thus generating greater instability in the environment surrounding it.
3.8. Precipitable Water
Precipitable water was higher in the sectors corresponding to the first and second quadrant of the two cases of UCL analyzed (Figure 10). The highest values were present in the UCL for the month of July, which ranged between 60 and 68 kg/m2, while those corresponding to the other case ranged between 50 and 65 kg/m2. The field of this variable was well represented with respect to the position of the UCL, thus demonstrating that they are synoptic systems that are directly related to the generation of precipitation.
As a summary, it can be said through the analysis with the RAP model that the UCL for the month of July turned out to be more intense, since the temperature, geopotential height, flow and vorticity fields demonstrate it, while the thermodynamic variables indicate that this UCL contributed to a greater instability to the synoptic environment. Temperature and geopotential height had a more symmetric representation in the UCL of July and more asymmetric in the UCL of August, which could be linked to the intensity and origin of formation of the systems.
Ref. [11] raised the existence of necessary and sufficient conditions, this being the space–time simultaneity of the former, which intervene in the generation, development and dissipation of a severe local event. The authors demonstrated that, although the atmosphere is conducive to convective development, such as the presence of UCL, if the cloud is not formed, the phenomenon which rises to severity and precipitation does not arise, hence the importance of studying the processes that occur at the mesoscale.
3.9. Mesoscale Analysis of Variables and Indices from the WRF Model
In the four cases analyzed, two wet layers were present in the tropospheric column: one of them was located between 1000 and 800 hPa, with values greater than 70%; and the other one was between 300 and 200 hPa, with a magnitude greater than 60%. In addition, a dry layer could be seen that extended from 700 to 300 hPa, with values lower than 45%, coinciding with the results obtained by [2] and [4].
High relative humidity values at low levels are a necessary condition for deep convection and even for severity within it [11]. This variable represented well the cells that produced the locally intense rain, showing columns of air with values higher than 90% from low levels to 200 hPa (Figure 11). This was more representative in the case corresponding to July 3 at Colón town, which registered the highest accumulated precipitation.
Some of the convective cells that generated the locally intense rain had updrafts that exceeded the 200 hPa level, even the 150 hPa level. This accounts for the penetrating caps observed in satellite images in the visible channel and the height of the maximum caps in radar observations (Figure 12). The speeds reached by the updrafts were between 5 and 12 m/s, and those by the descending currents were between −2 and −5 m/s. These values were higher than those obtained by [2] on his analysis of locally intense rain under anticyclonic influence.
The vertical wind shear for the 200–850 hPa layer ranged between 8 and 20 m/s, with values higher than 30 m/s in the case of 2 July, located in the municipality of La Sierpe. This was the only case that strictly coincided with the position of the maximum wind speed generated by the UCL on its right sector, hence the magnitude of this variable.
The high shear values created positive vorticity in the atmosphere, especially in the 200–350 hPa layer. This caused the separation of the ascending and descending currents, which in turn contributed to the generation of cells of longer duration and intensity. This moderate to strong vertical shear stimulated the formation of several convective cells in the same location. The direction of the shear vector in the 200–850 hPa layer responded to a large extent to the circulation of the UCL. The most representative case was that of August 16 in El Salvador, which was located south of the UCL. The shear vector had a southeast direction, but the movement of the system towards the west generated a change in the direction of the vector towards the east (Figure 13).
The relative vorticity presented positive values in the places where locally intense rain occurred (Figure 14). These values ranged between 0.00151/s and 0.0051/s, while the negatives were between −0.00121/s and −0.0041/s and were modularly higher than those obtained by [3]. In the zonal cuts, it was observed that generally at the 200 hPa level, positive relative vorticity predominated, which is due to the presence of the UCL, which at this level generated cyclonic vorticity.
The divergence represented very well the breeze front and the streak fronts of the storms (Figure 15) and their values ranged between −0.0031/s and 0.0051/s. In the graphical outputs of this variable, it was possible to see areas where negative divergence, that is, convergence, between the breeze front and the predominant flow occurred. Small circular areas with positive values were appreciated that indicated the place where the downdrafts of the cells interacted with the surface and created a divergent flow that only converged at the border of the gust fronts that were generated precisely by this interaction.
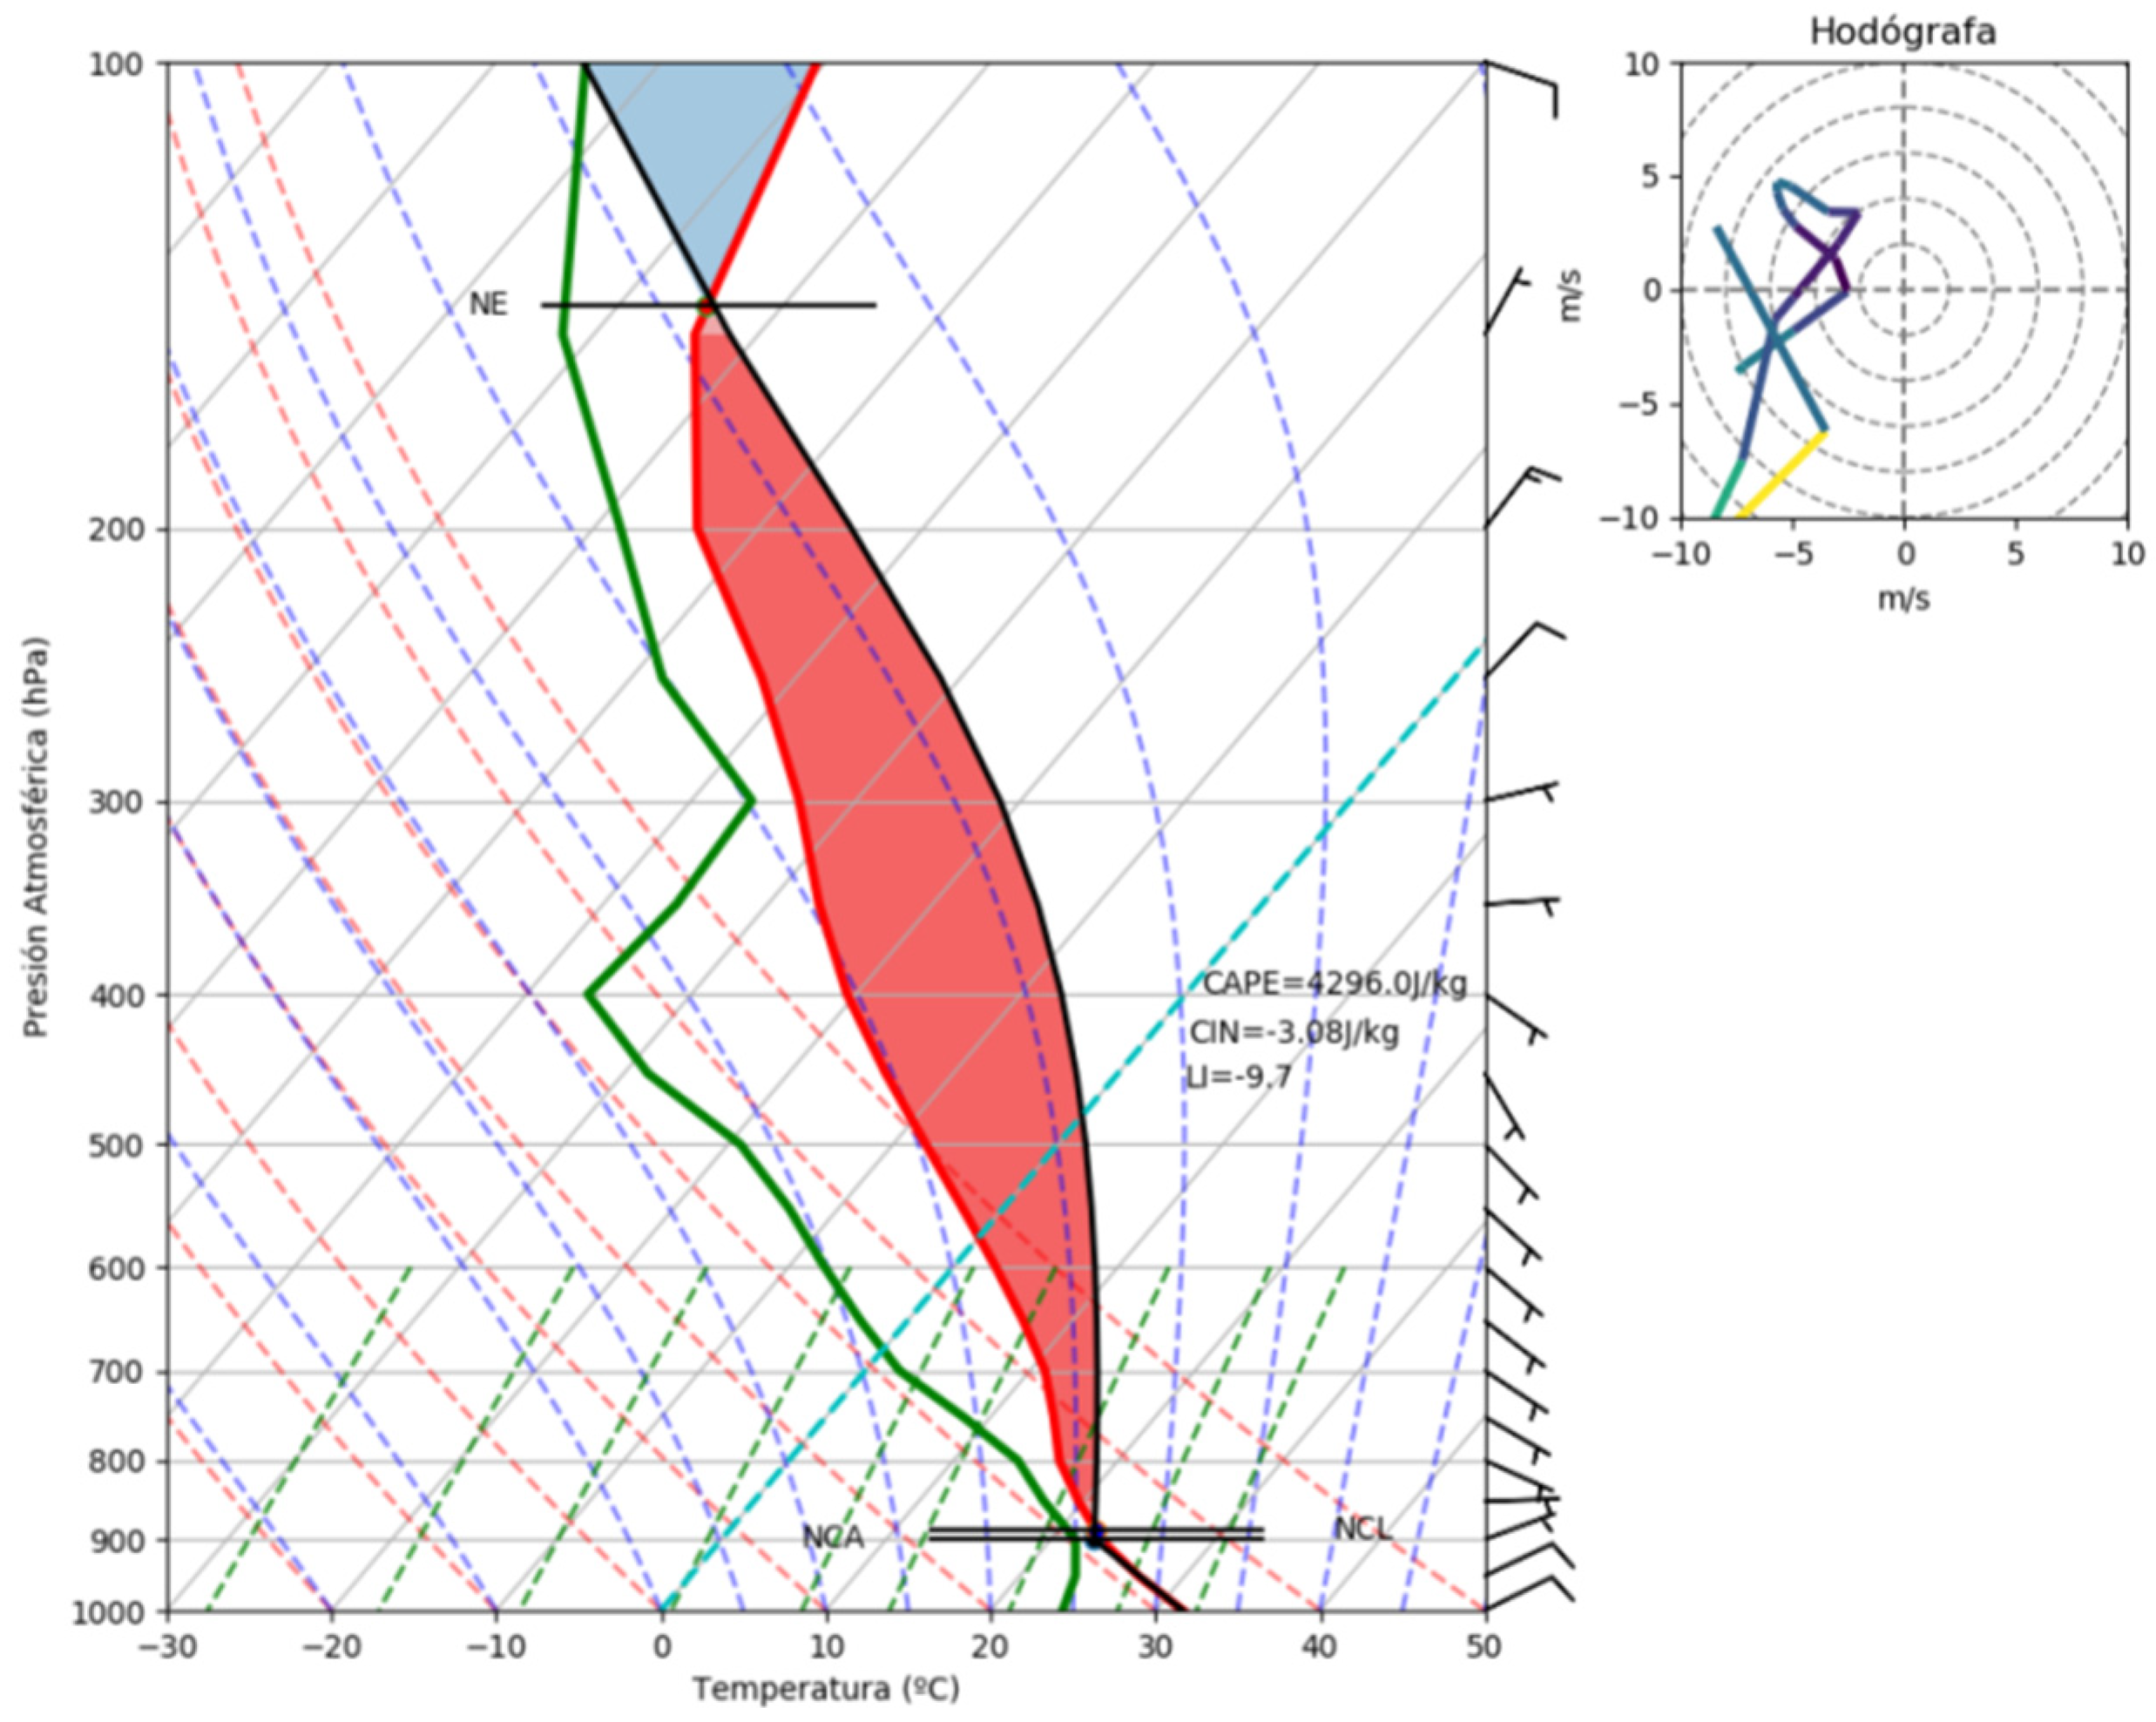
In the four cases analyzed, the CAPE was above 2360 J/kg, reaching a maximum value of 4296 J/kg (Figure 16), which coincided with the highest accumulated precipitation. This shows that this system is capable of generating a large amount of energy in the surrounding atmosphere, which is noticeable from the mesoscale, thus contributing to a more unstable atmosphere and conducive to producing heavy rain. The LI ranged between −5.5 and −10, values lower than those obtained by [3] and [2]. The CAPE values observed in the present investigation were higher than those obtained in these studies, which is related to the presence of UCL.
4. Conclusions
- From the RAP model, it can be seen that the presence of the UCL generates an unstable synoptic environment and potentially favorable for the development of deep convection, with vertical temperature gradients greater than 6.7 × 10⁻³ (°C/m) in hours in the afternoon between the surface and the level of 500 hPa. The CAPE shows extreme values above 6000 J/kg close to the center of the system, and the LI reaches −13. Furthermore, the relative vorticity at the 200 hPa level oscillates between 2.5 × 10⁻³ s−1 and 3.9 × 10⁻³ s−1 in the right sector of the UCL, while the vertical speed describes upward movements to the south and east of the system, with values between −1.97 and −3.76 Pa/s.
- The wet UCL is characterized by being more intense than the dry one, and, although the direct influence of both increases the temporal distribution of rainfall in Cuba, it is higher with the wet UCL. The highest accumulated are reported near the center of both systems. The highest number of reports of locally intense rain occurs in the western region of the lowlands, with three of the four cases, behavior similar to that of other dangerous phenomena, such as SLS.
- According to the output of the WRF model, the cases of intense rain are generated in an environment of weak vertical wind shear in the middle and lower troposphere, being moderate to strong in the upper troposphere. High relative humidity values greater than 70% predominate in the surface layer—800 hPa and a dry layer between 700 and 300 hPa, with values lower than 45%. The temperature in 500 hPa ranges between −6 and −10 °C, and the isotherm of 0 °C is located above 600 hPa. As for the CAPE, it is above 2300 J/kg in the four cases, with an LI that varies between −5 and −10. Using the 1 km spatial resolution of the WRF model, upward velocities within the cloud that reached 24 m/s can be determined.
- The interaction of the pre-existing storm gusts or sea breeze fronts with the Horizontalez HCR Convective Rolls constitutes the main trigger for deep and organized convection. The storms that are generated are characterized by presenting maximum reflectivity values greater than 50 dBz in the four cases analyzed; the stops are greater than 12 km in height, exceeding 19 km in two of the cases; and the height of the maximum reflectivity oscillates between 3 and 5 km. In all cases, the locally intense rain is generated by the influence of several convective cells. The Batabanó case is affected by four cells, while Colón and La Sierpe are affected by five and three, respectively.
Funding
This research received no external funding.
Institutional Review Board Statement
Not applicable.
Informed Consent Statement
Not applicable.
Data Availability Statement
Satellite data: http://www.bou.class.noaa.gov/saa/products/welcome, Radar data: Camaguey Radar Center, Cuba (accessed on 10 May 2021), Model RAP: https://www.ncdc.noaa.gov/data-access/model-data/mo-del-datasets/rapid-refresh-rap, Model WRF: Atmospheric Physics Center, Institute of Meteorology, Havana, Cuba (accessed on 10 May 2021).
References
- Planos, E. The Great Precipitations and the Intense Precipitations in Cuba: Causes and Characteristics (Ramal Program “Analysis and Forecast of the Weather and the Terrestrial and Space Climate”); Institute of Meteorology, Ministry of Science, Technology and Environment: Havana, Cuba, 2007. [Google Scholar]
- Armas, O. Mesoscale Study of Locally Intense Rain Events for the Dry Season in the Eastern Half of Cuba. Bachelor’s Thesis, Faculty of Environment, Higher Institute of Technologies and Applied Sciences, Havana, Cuba, 2016. [Google Scholar]
- Irañeta, J.M. Mesoscale Study of Locally Intense Rain Events for the Dry Season in the Western Half of Cuba. Bachelor’s Thesis, Faculty of Environment, Higher Institute of Technologies and Applied Sciences, Havana, Cuba, 2016. [Google Scholar]
- Peino, E. Locally Intense Rains Associated with Severe Local Storms in the Central and Eastern Regions of Cuba during the Rainy Season. Bachelor’s Thesis, Faculty of Environment, Higher Institute of Technologies and Applied Sciences, Havana, Cuba, 2018. [Google Scholar]
- Laguardia, I. The Superior Cold Lows on or near Cuba and its relationship with Severe Local Storms. Bachelor’s Thesis, Faculty of Environment, Higher Institute of Technologies and Applied Sciences, Havana, Cuba, 2011. [Google Scholar]
- Alfonso, A.P. Upper cold lows and severe local storms. Analysis of the case July 29–30, 1981. In Revista Cubana de Meteorología, no1; INSMET: Habana, Cuba, 1990; pp. 81–100. [Google Scholar]
- Acosta, G. Tornadoes in Cuba. Analysis of Some Favorable Conditions for Their Formation. Bachelor’s Thesis, Faculty of Environment, Higher Institute of Technologies and Applied Sciences, Havana, Cuba, 2008. [Google Scholar]
- Benhamrouche, A.; Martín-Vide, J. Spatial distribution of the daily concentration of precipitation in the province of Alicante. Geogr. Res. 2012, 56, 113–129. [Google Scholar]
- Carlson, T.N. Structure of a Steady-State Cold Low. Mon. Weather Rev. 1967, 95, 763–777. [Google Scholar] [CrossRef]
- Frank, N. On the Nature of Upper Tropospheric Cold Core Cyclones Over the Tropical Atlantic. Ph.D. Thesis, Florida State University, Tallahassee, FL, USA, 1970. [Google Scholar]
- Carnesoltas, M.; Sierra, M.; Rabelo, D.; Fernández, D. Physical Factors That Influence the Fall of Hail and the Aerovalanches over Cuba; Result Report; Institute of Meteorology, Ministry of Science, Technology and Environment: Havana, Cuba, 2013.
Figure 1.
Geopotential height at levels 200 and 500 hPa corresponding to (a,b) 30 June at 0600 UTC and (c,d) 17 August at 1200 UTC.
Figure 1.
Geopotential height at levels 200 and 500 hPa corresponding to (a,b) 30 June at 0600 UTC and (c,d) 17 August at 1200 UTC.
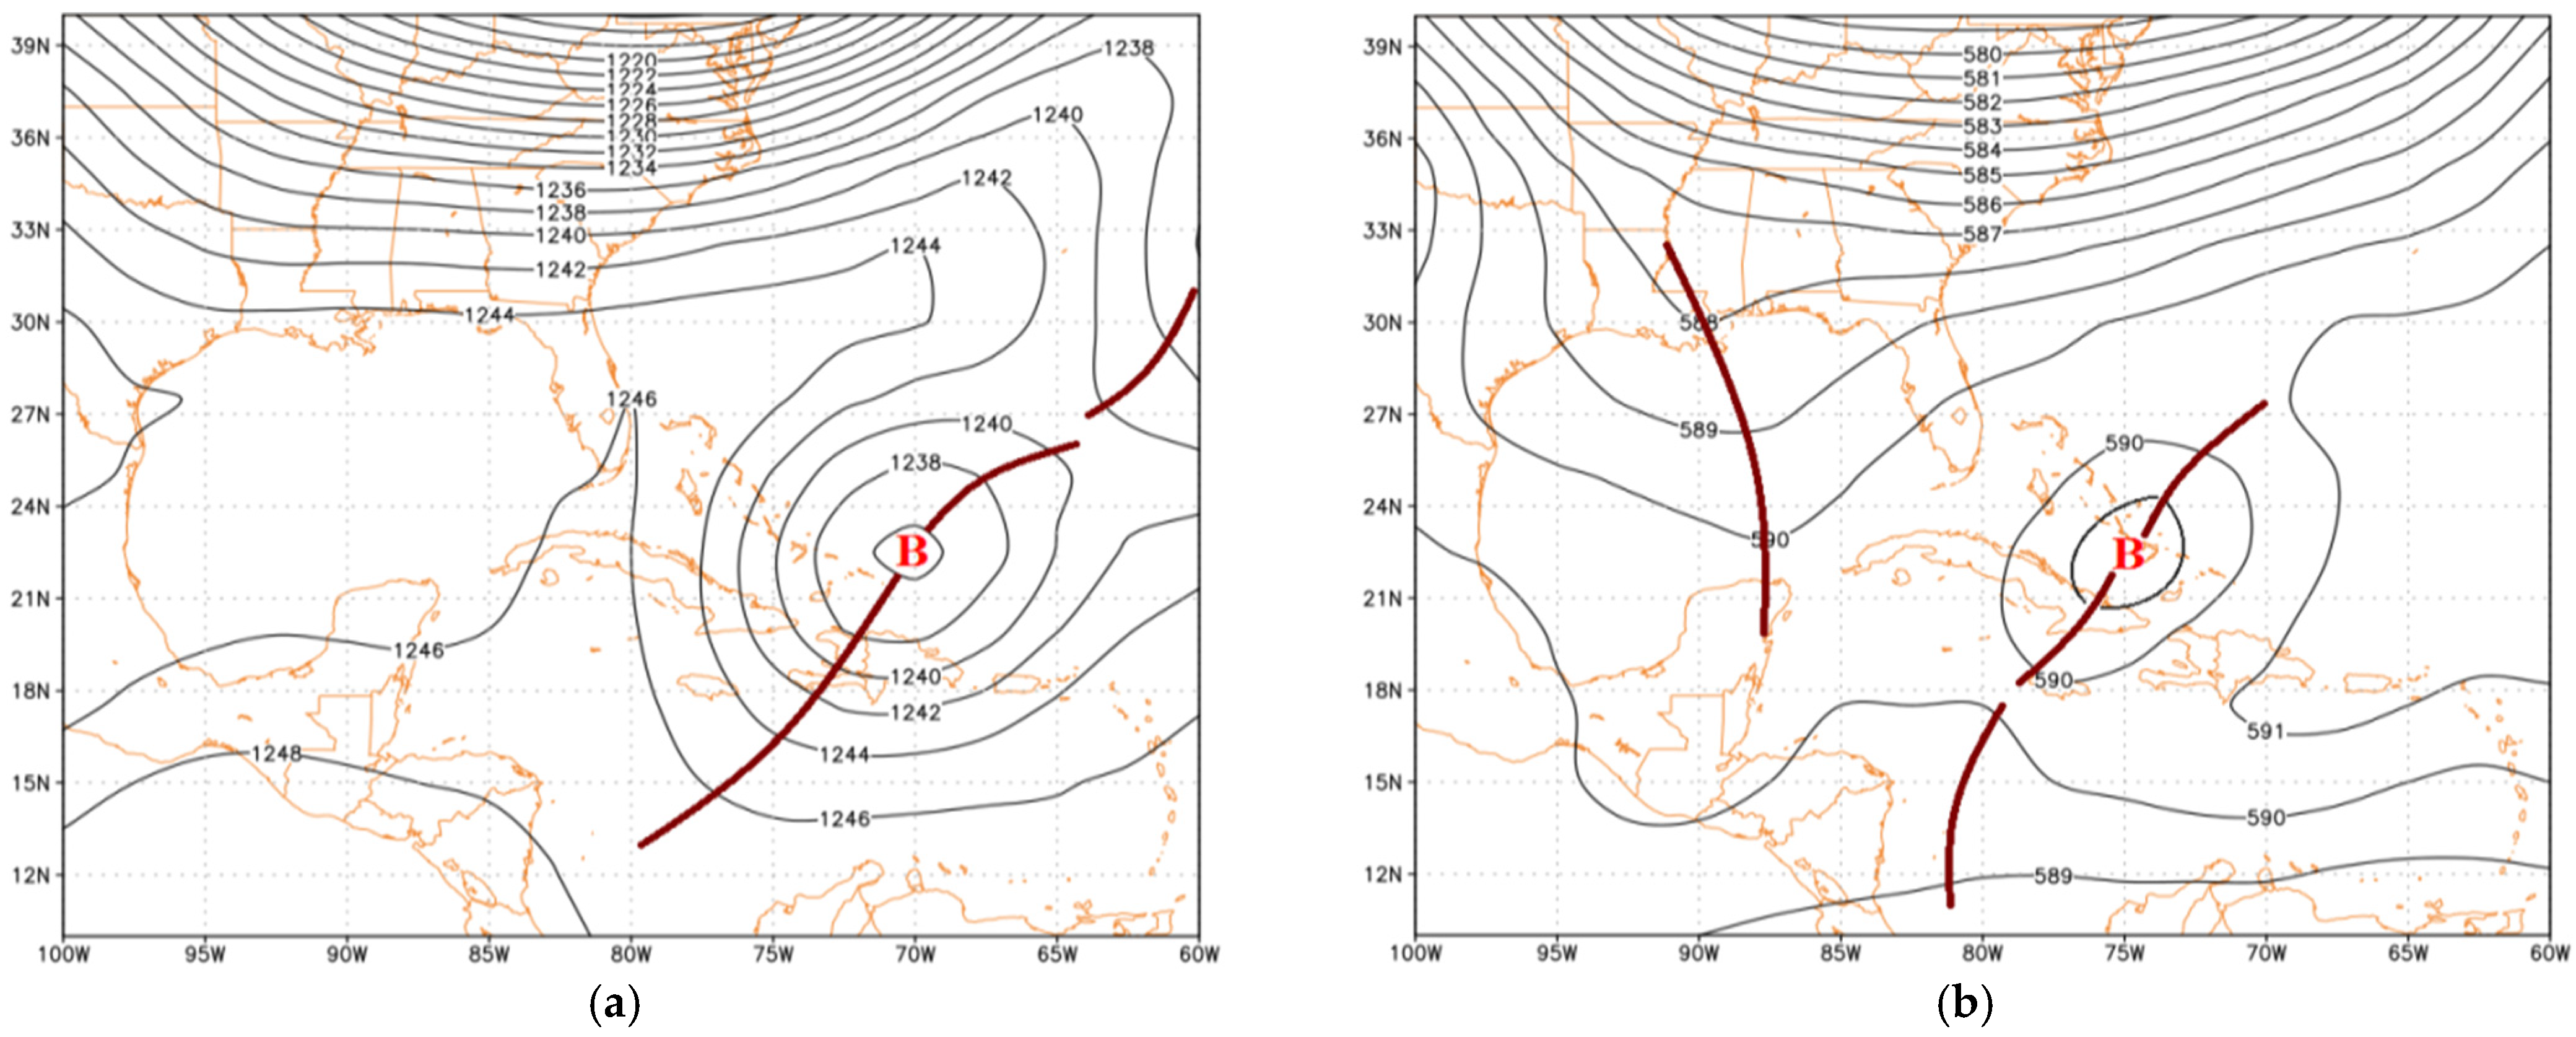

Figure 2.
Temperature at the level of 300 and 500 hPa, corresponding to (a,c) 2 July at 1400 UTC and (b,d) 16 August, at 1300 UTC.
Figure 2.
Temperature at the level of 300 and 500 hPa, corresponding to (a,c) 2 July at 1400 UTC and (b,d) 16 August, at 1300 UTC.
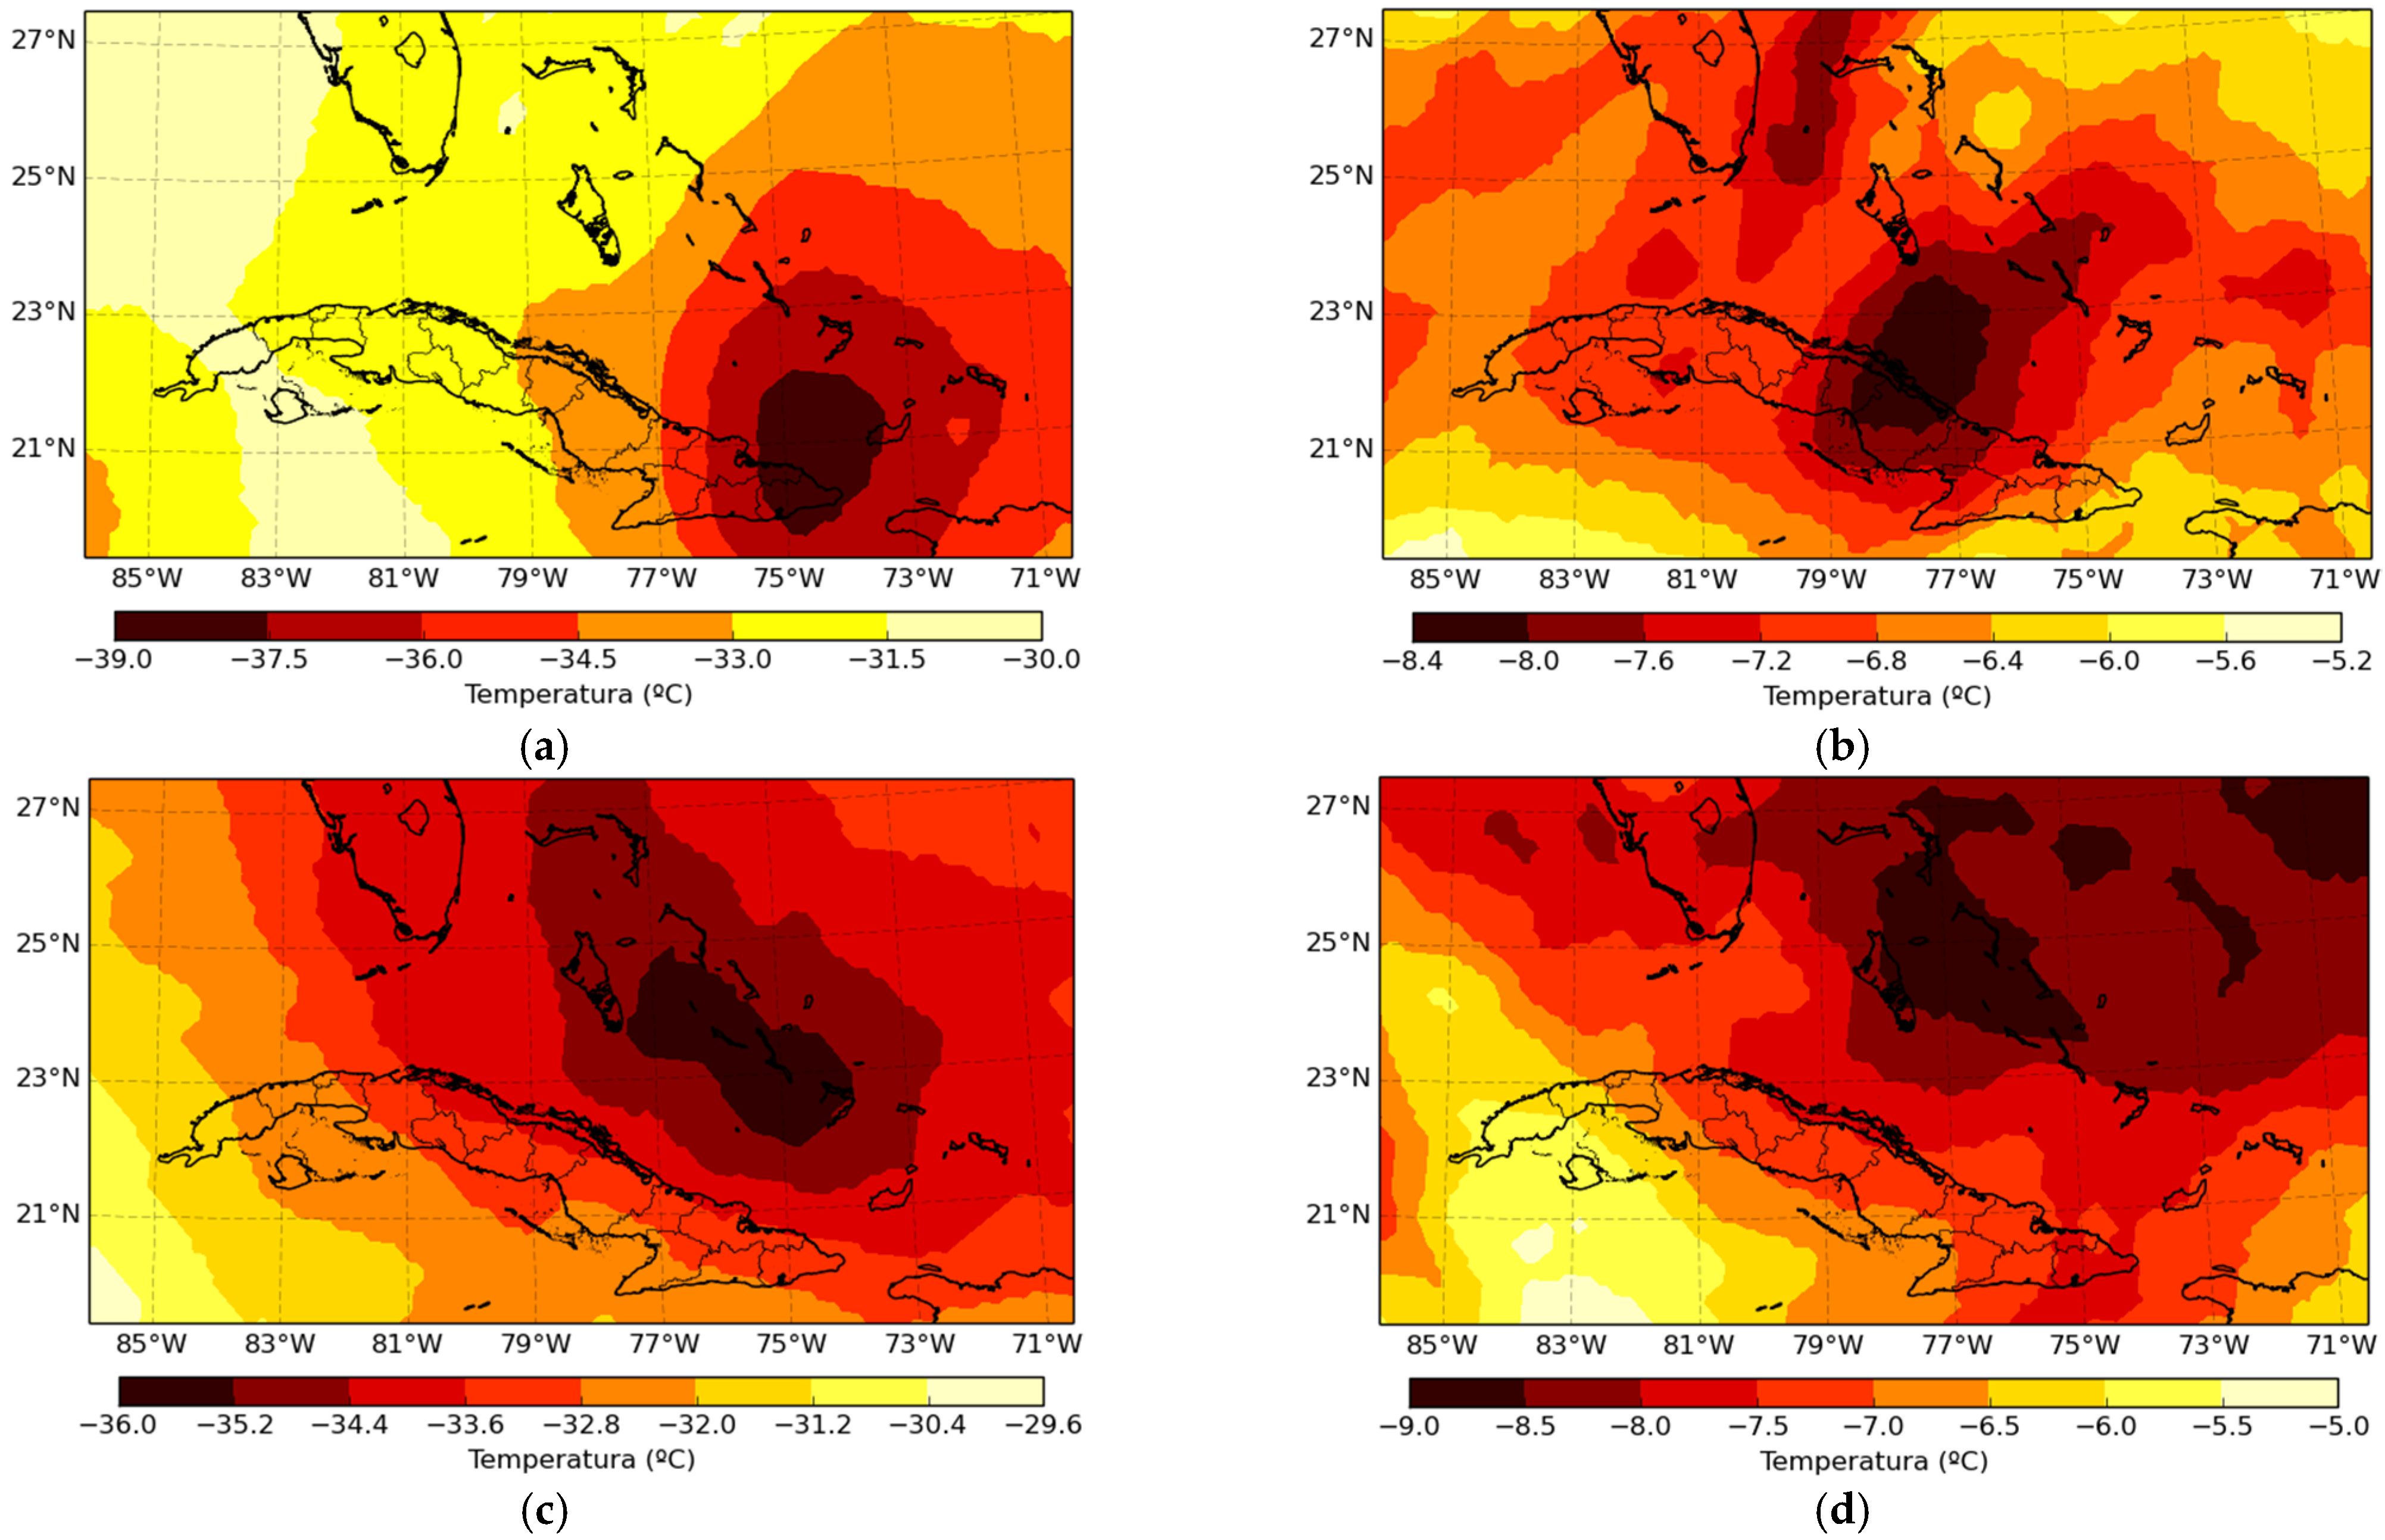
Figure 3.
Temperature at the level at the 150 hPa level, corresponding to (a) 2 July at 1400 UTC and (b) 16 August, at 1300 UTC.
Figure 3.
Temperature at the level at the 150 hPa level, corresponding to (a) 2 July at 1400 UTC and (b) 16 August, at 1300 UTC.
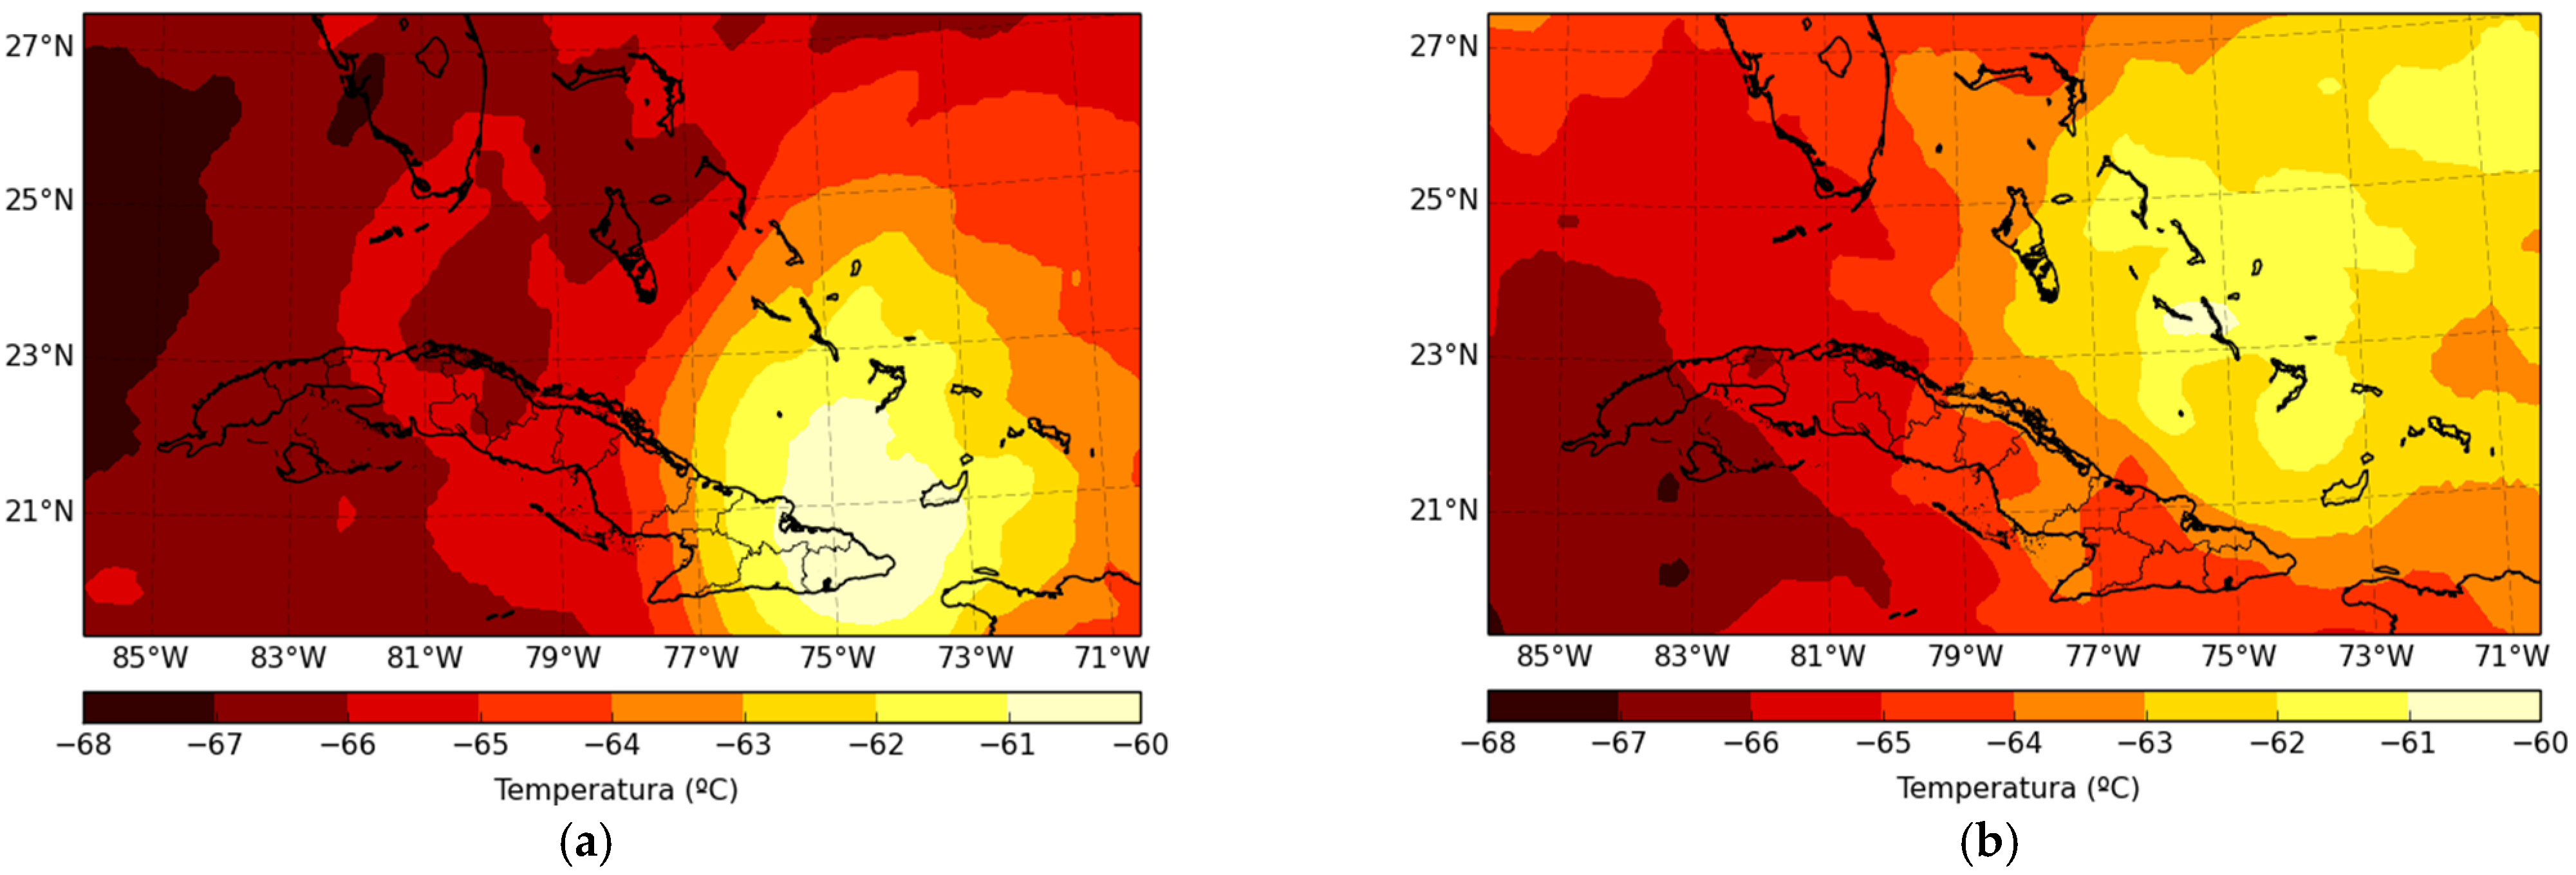
Figure 4.
Geopotential height at the 200 hPa level corresponding to (a) 2 July at 1400 UTC and (b) 16 August at 1300 UTC.
Figure 4.
Geopotential height at the 200 hPa level corresponding to (a) 2 July at 1400 UTC and (b) 16 August at 1300 UTC.
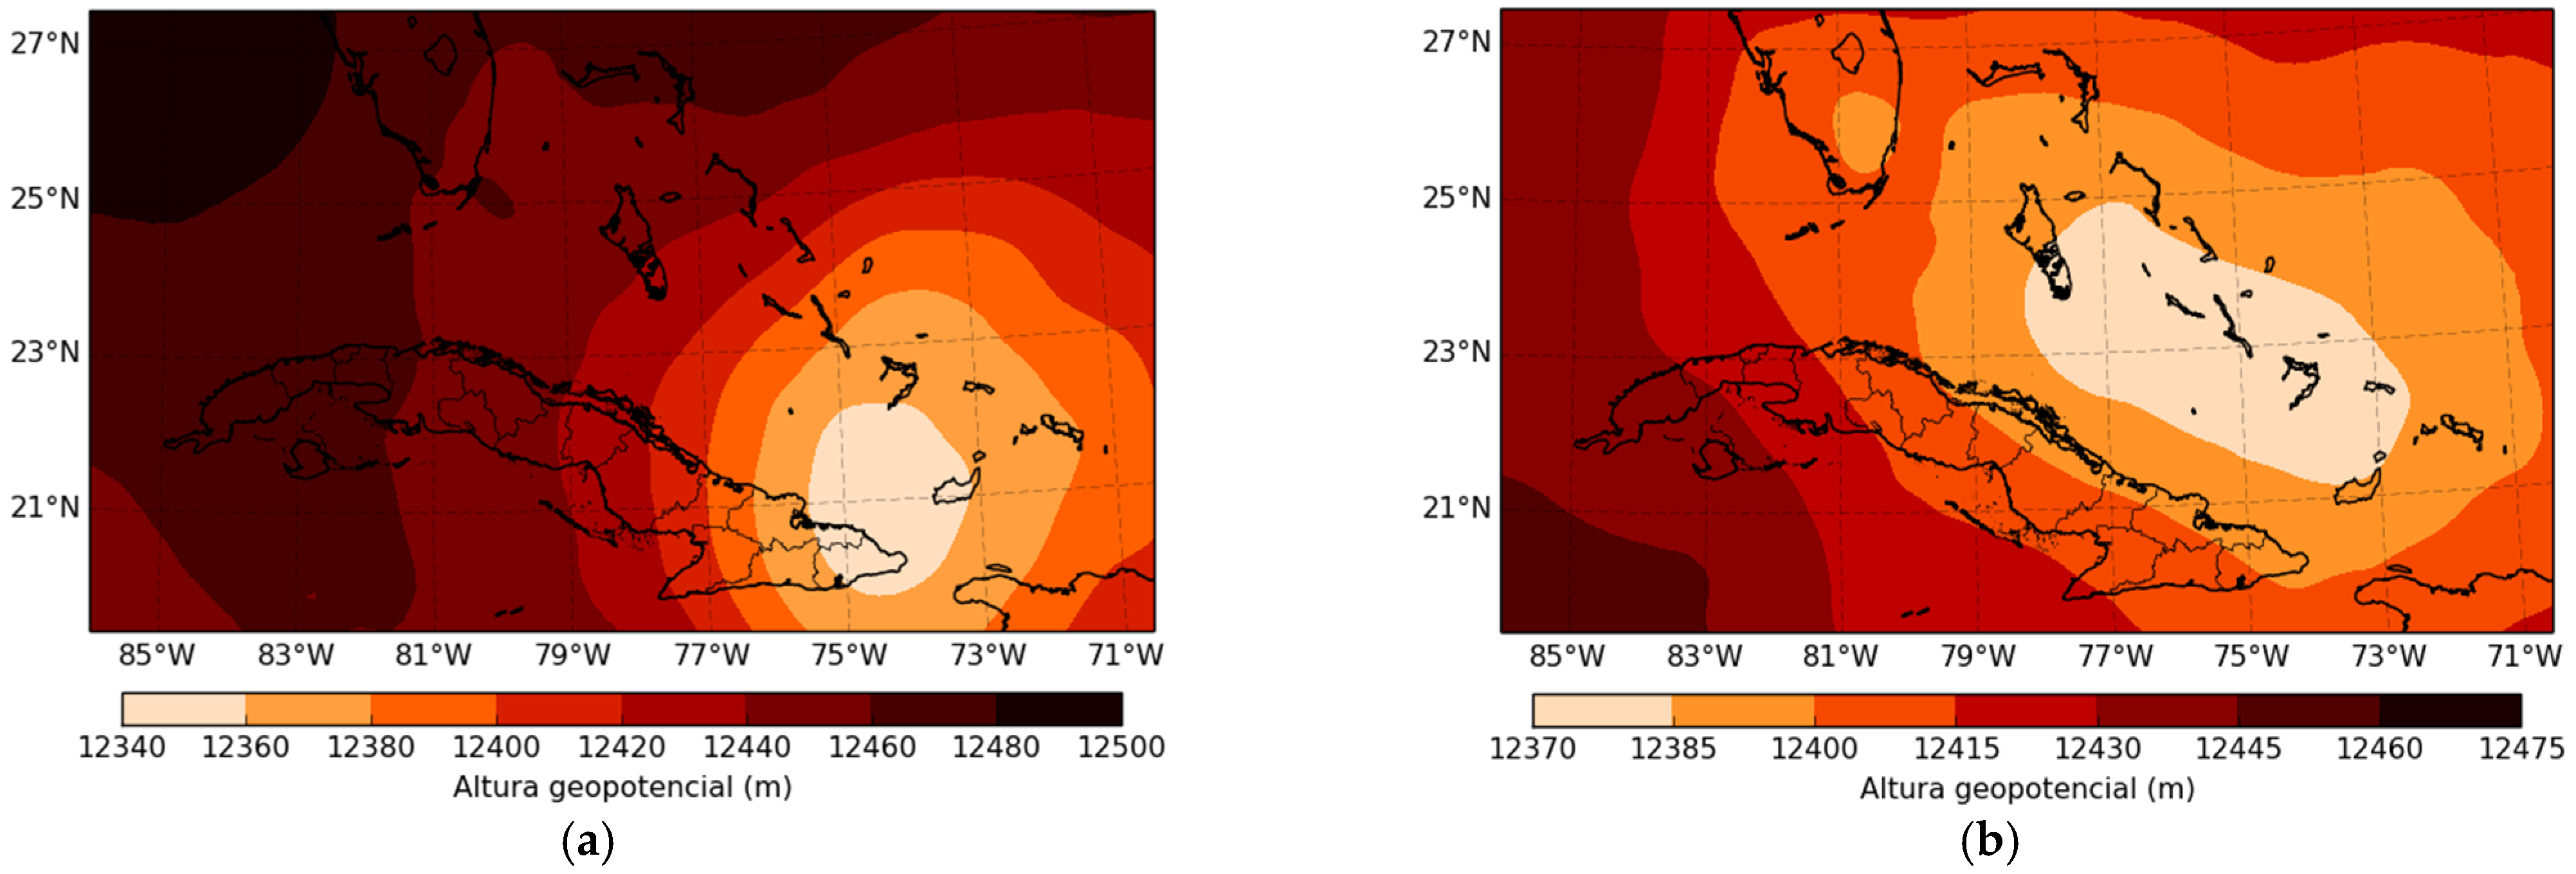
Figure 5.
Temperature fields and geopotential height at the levels (a) 150 hPa, (b) 400 hPa, (c) 100 hPa and (d) 400 hPa, respectively, for 2 July 2016, at 1400 UTC.
Figure 5.
Temperature fields and geopotential height at the levels (a) 150 hPa, (b) 400 hPa, (c) 100 hPa and (d) 400 hPa, respectively, for 2 July 2016, at 1400 UTC.
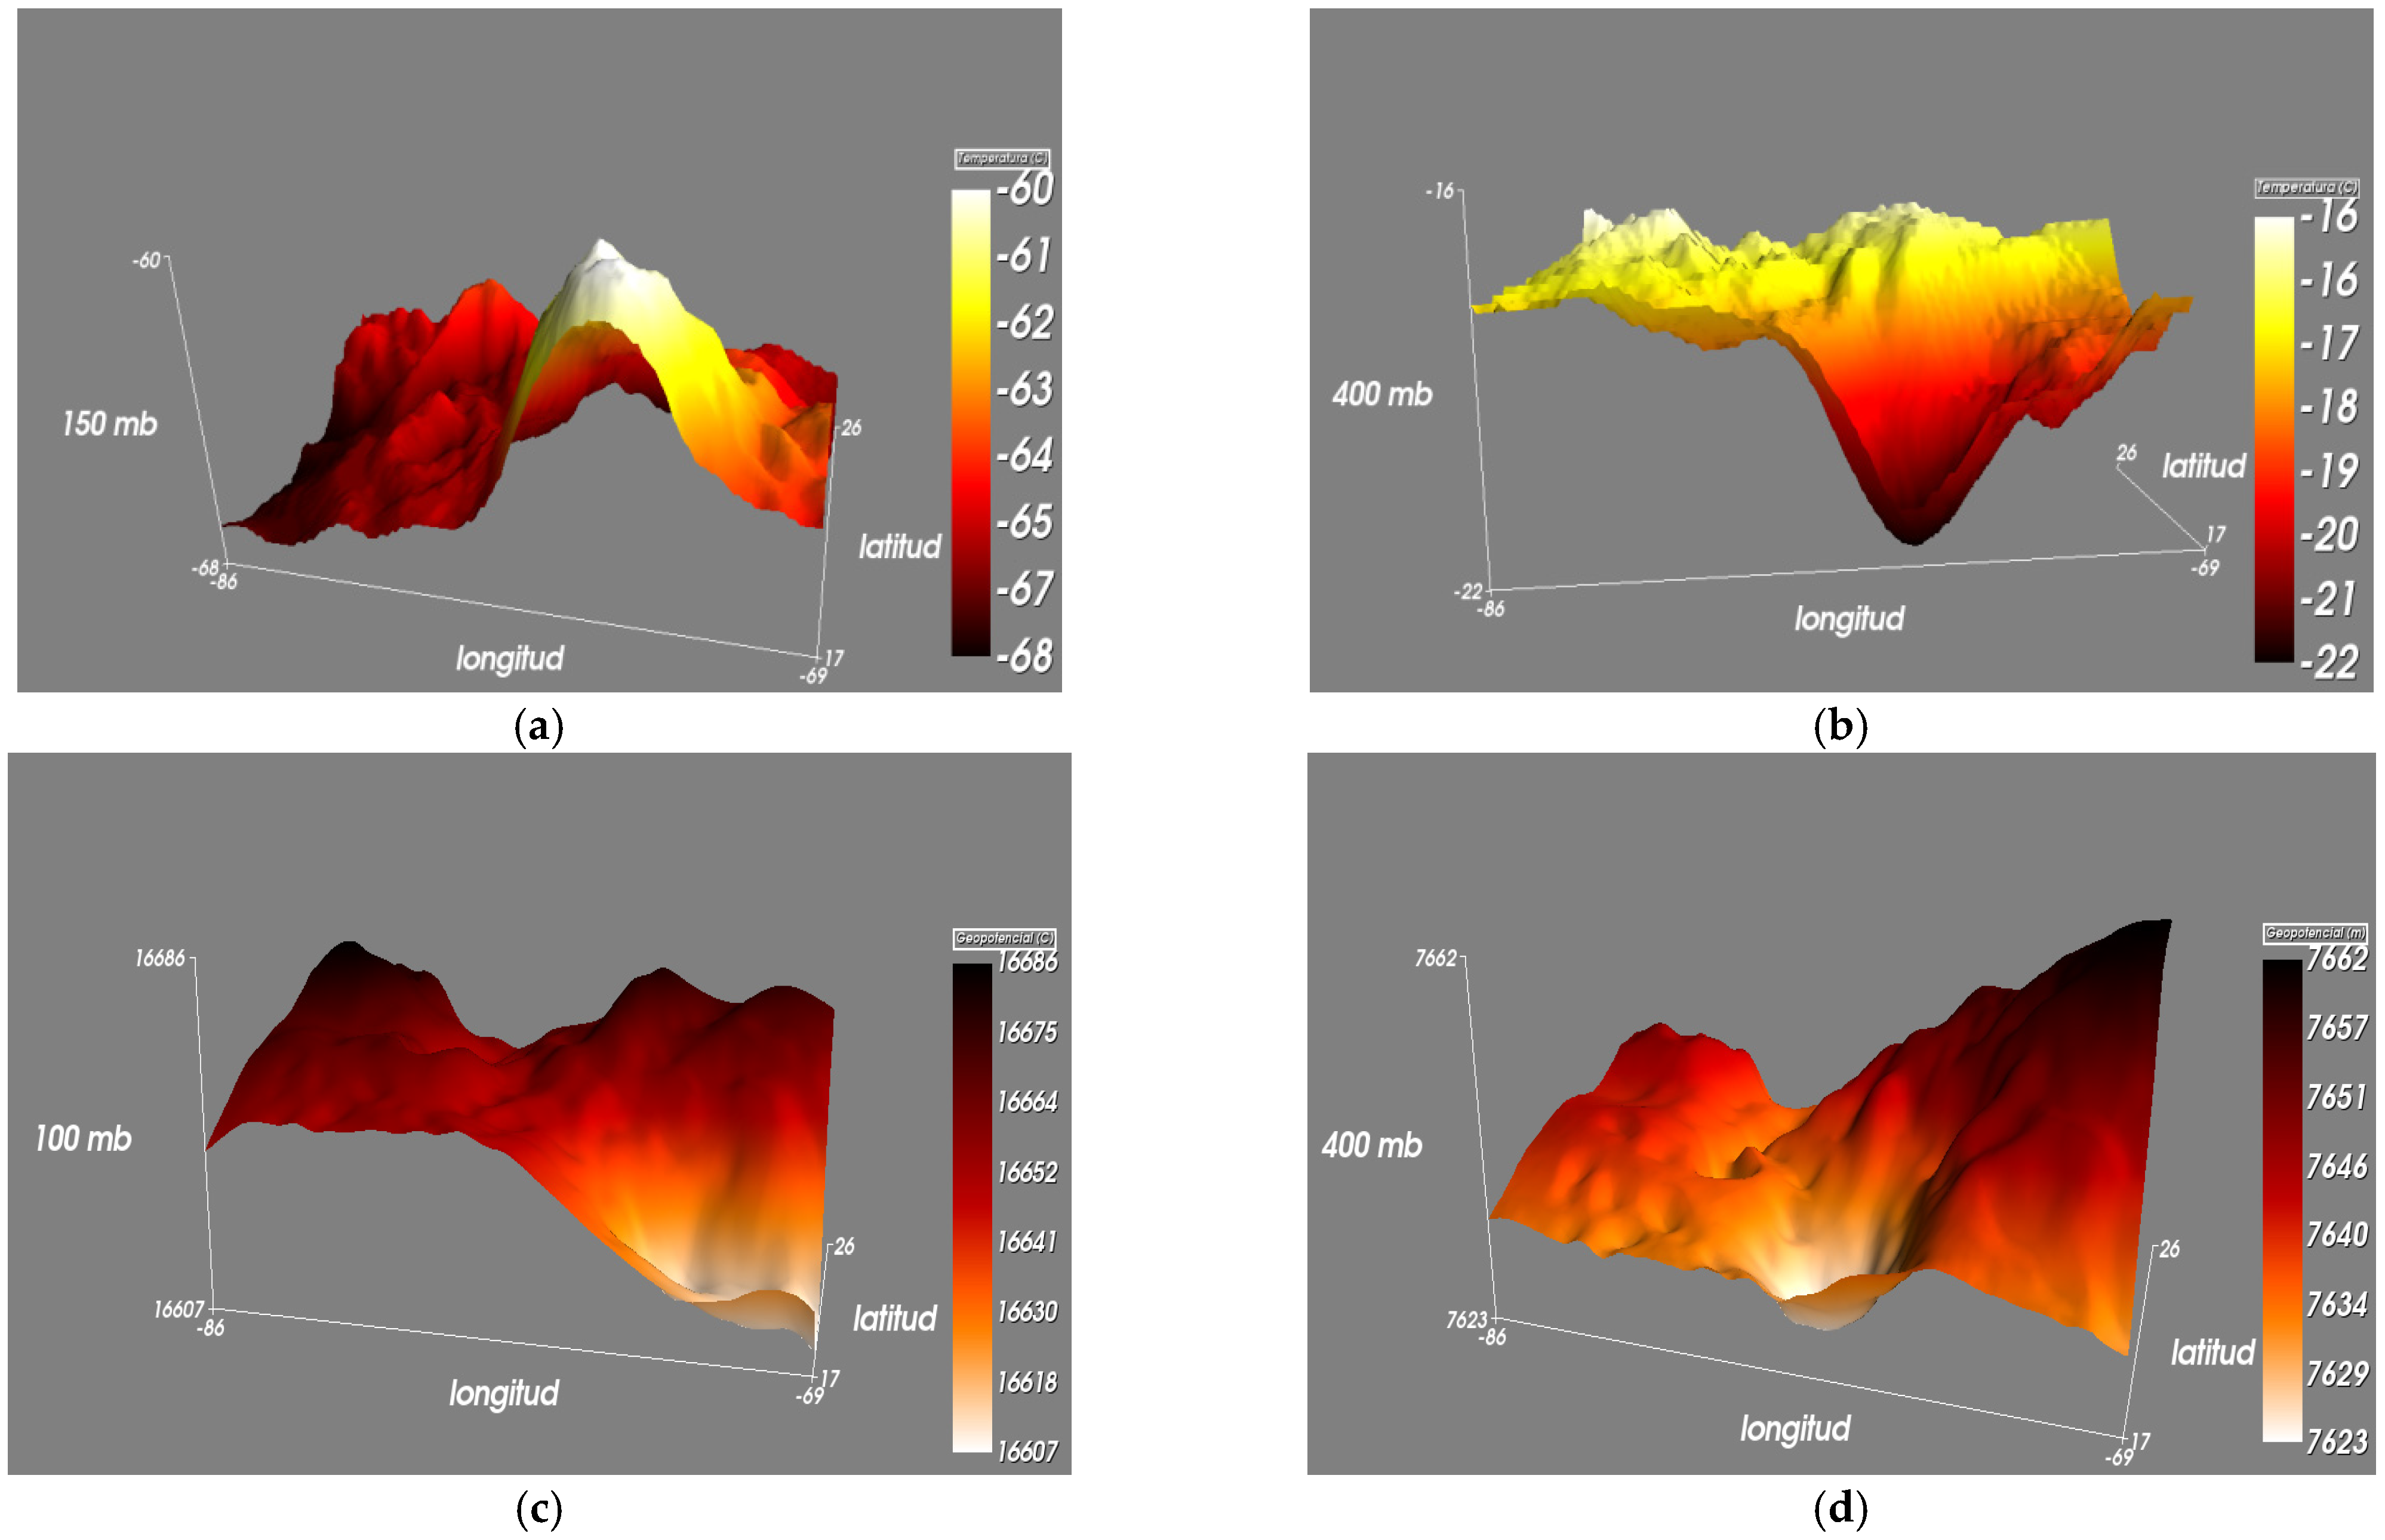
Figure 6.
Wind speed and direction at the 200 hPa level, corresponding to (a) 2 July at 1400 UTC and (b) 16 August at 1300 UTC.
Figure 6.
Wind speed and direction at the 200 hPa level, corresponding to (a) 2 July at 1400 UTC and (b) 16 August at 1300 UTC.
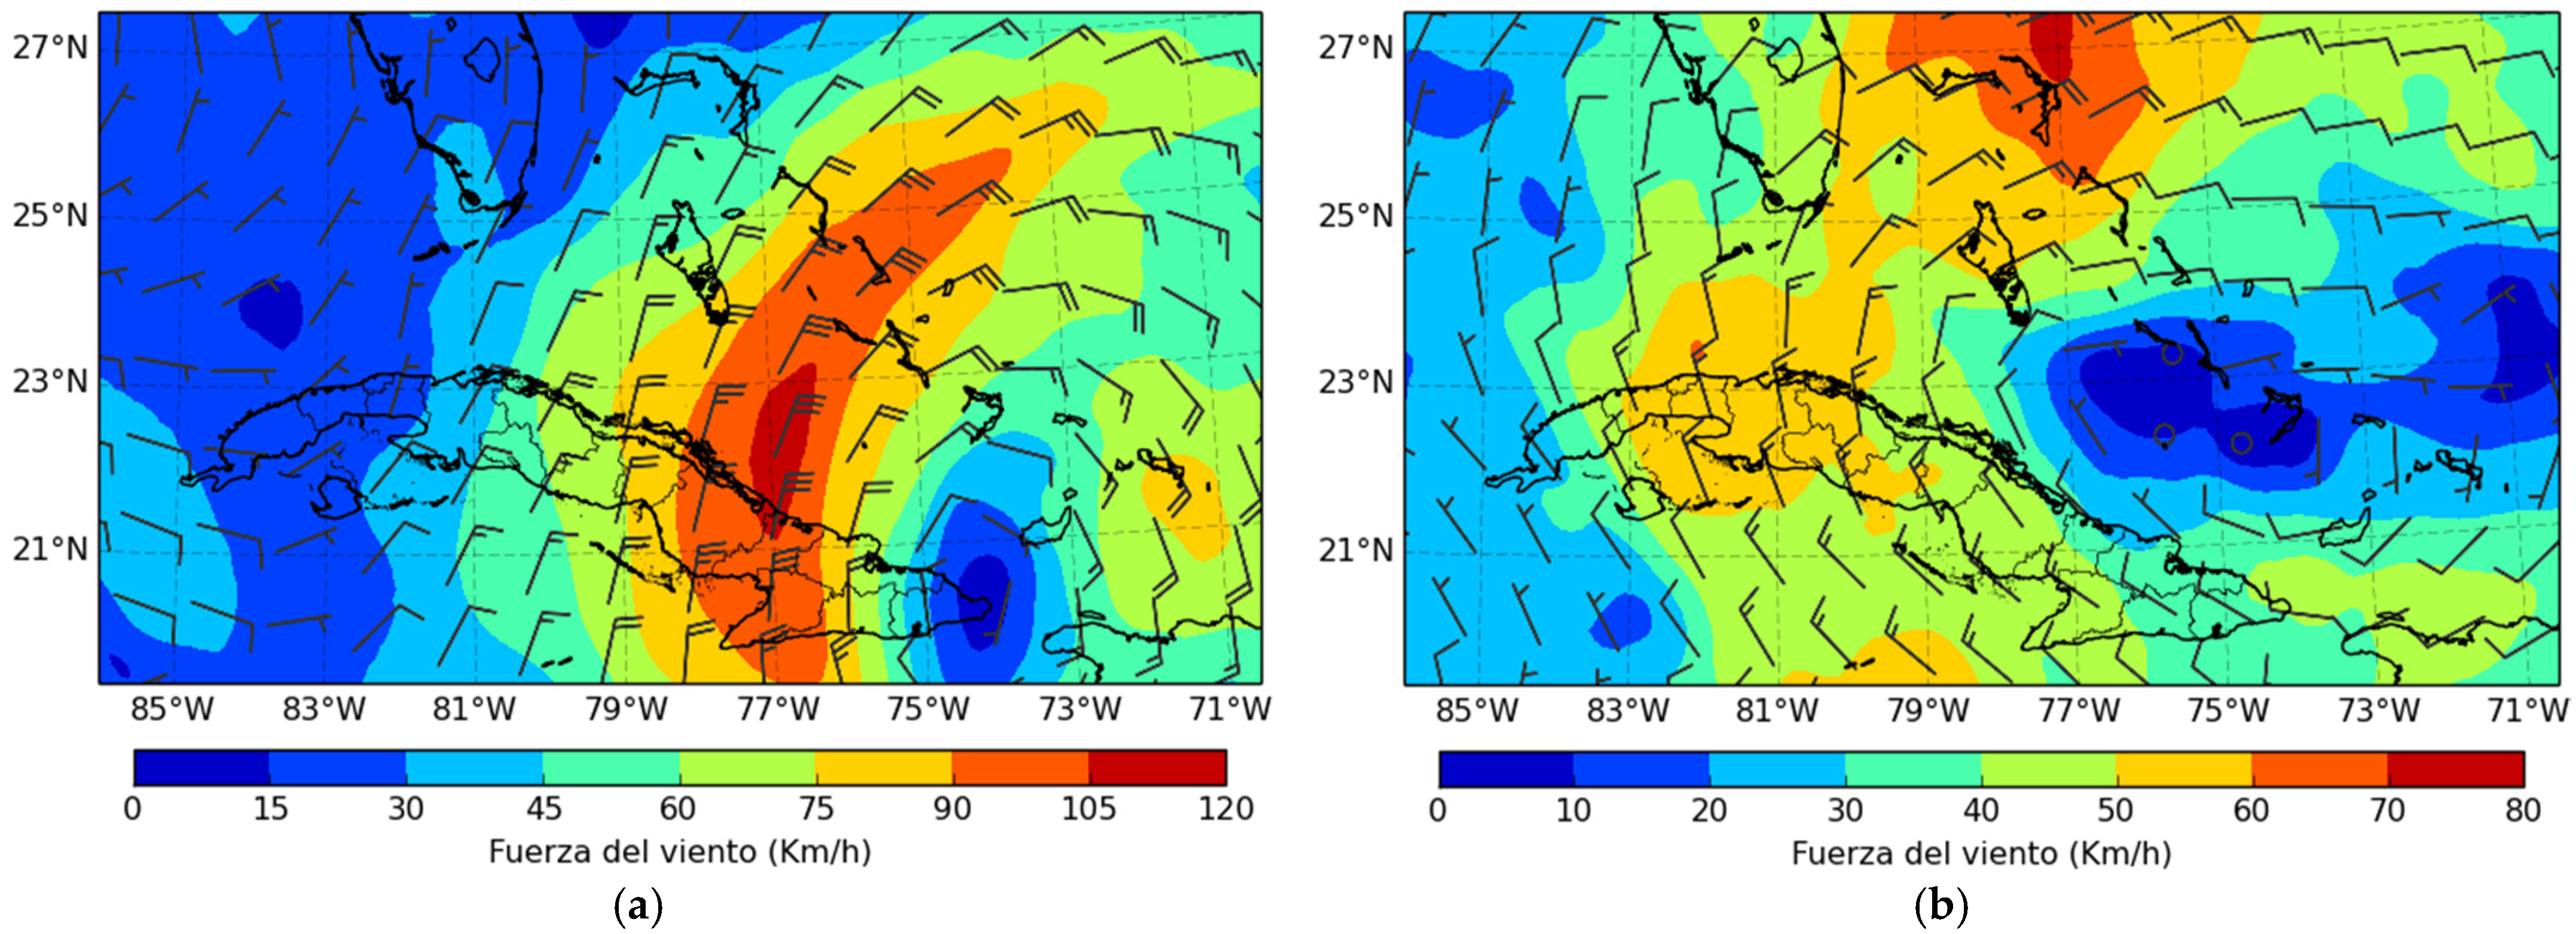
Figure 7.
Vorticity at the 200 hPa level corresponding to (a) 2 July at 1400 UTC and (b) 16 August at 1300 UTC.
Figure 7.
Vorticity at the 200 hPa level corresponding to (a) 2 July at 1400 UTC and (b) 16 August at 1300 UTC.
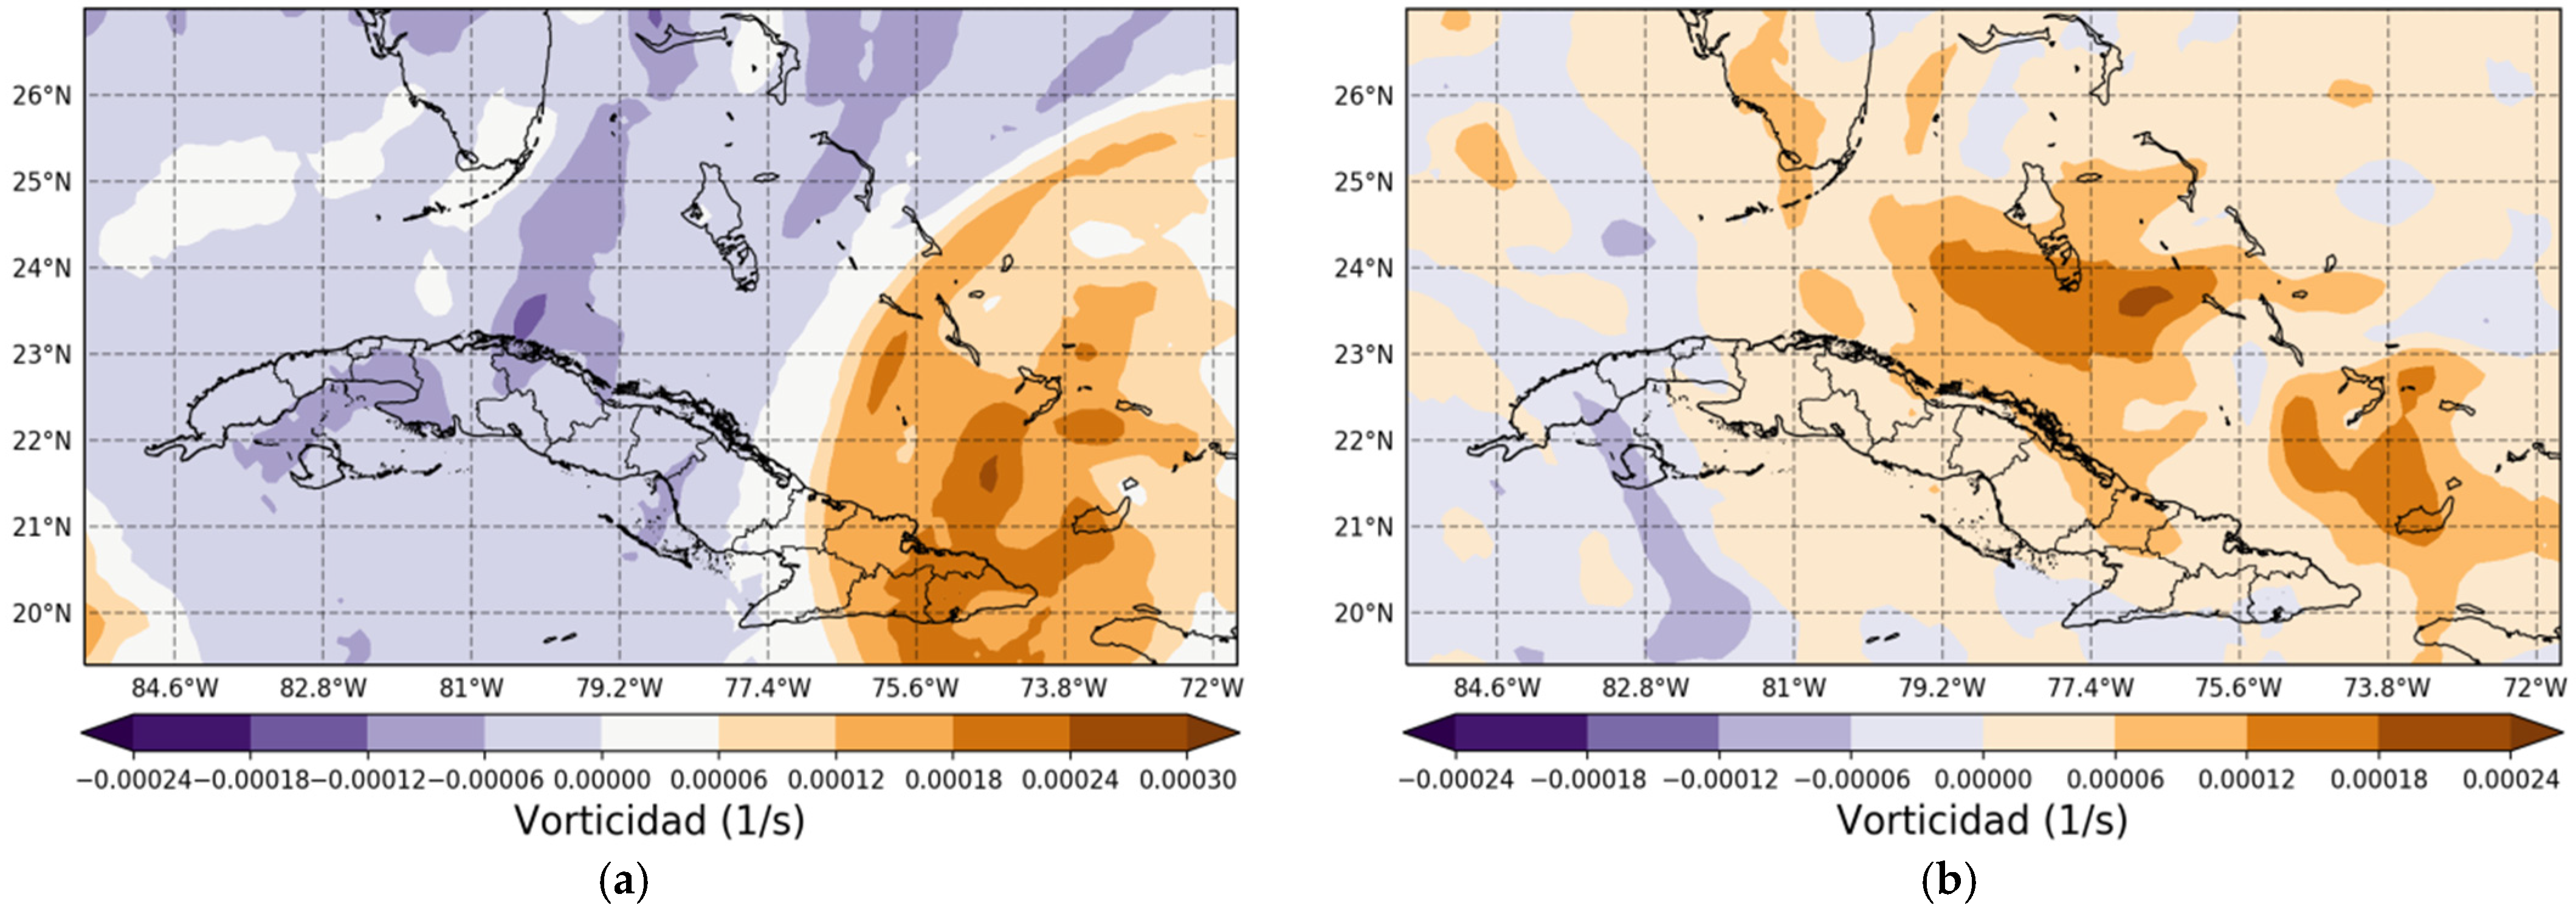
Figure 8.
Accumulated precipitation for 3 July 2016.
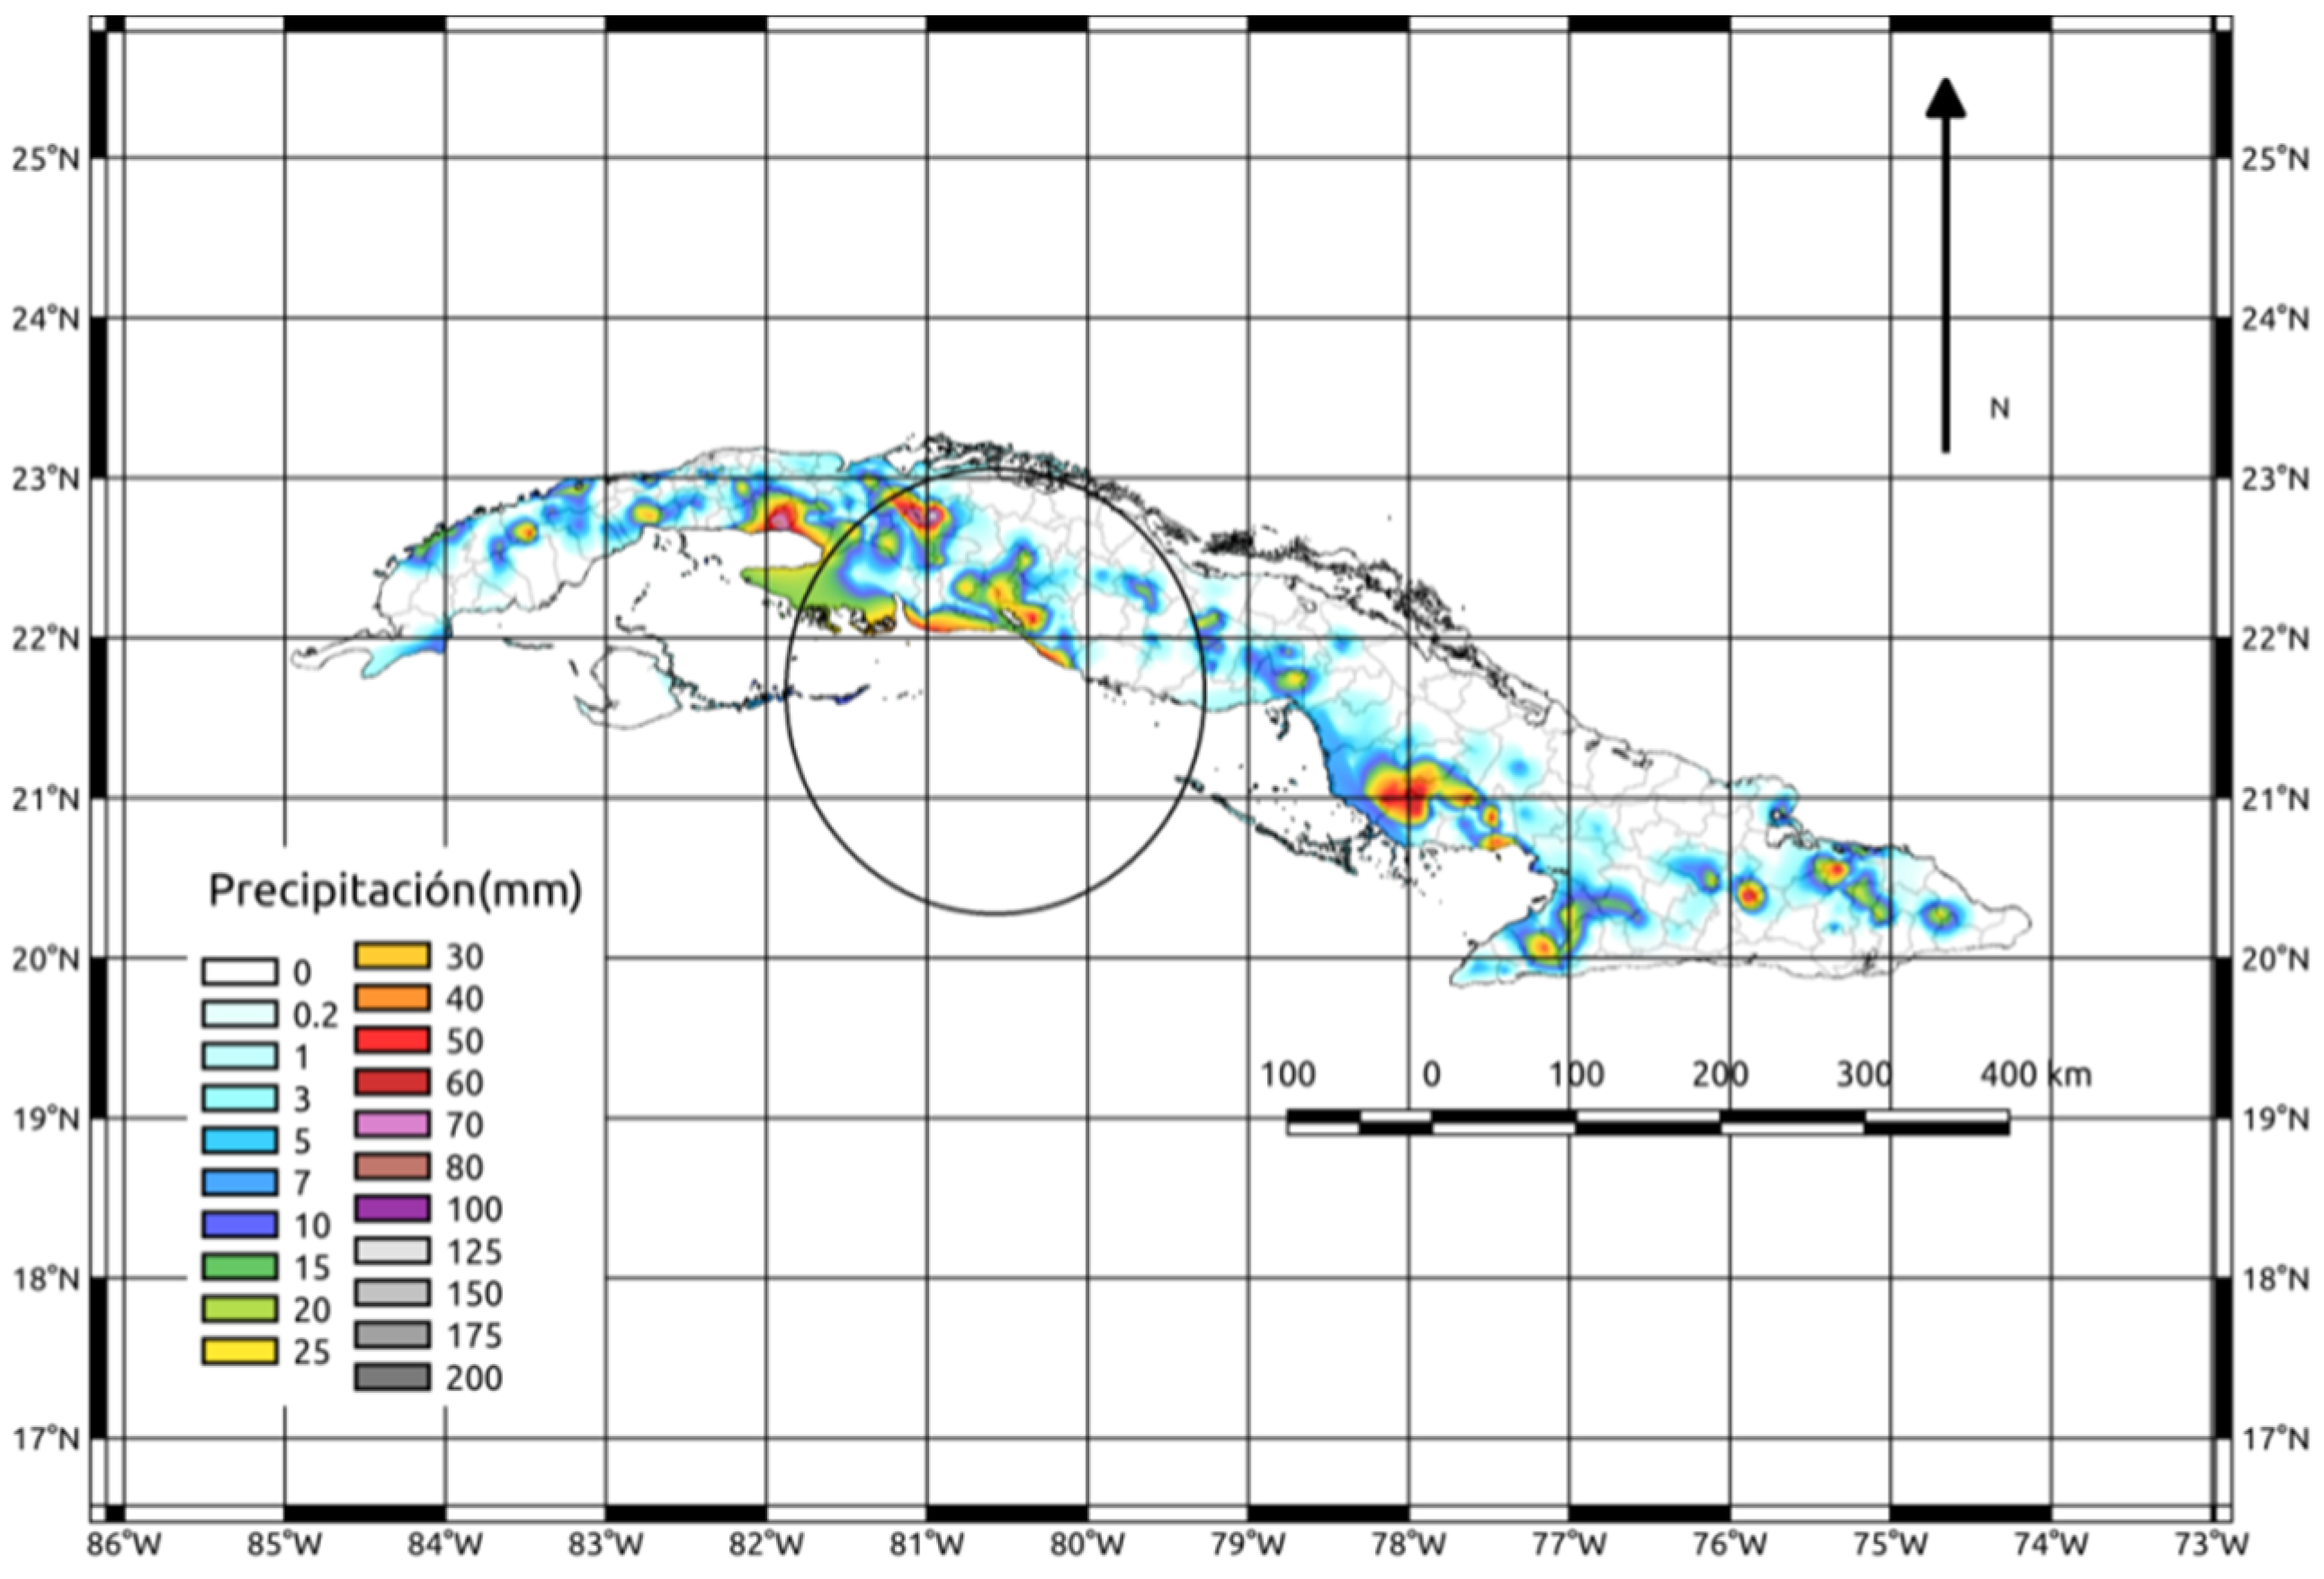
Figure 9.
CAPE and LI values at the 200 hPa level corresponding to (a,b) 2 July at 2200 UTC and (c,d) 16 August at 1400 UTC.
Figure 9.
CAPE and LI values at the 200 hPa level corresponding to (a,b) 2 July at 2200 UTC and (c,d) 16 August at 1400 UTC.
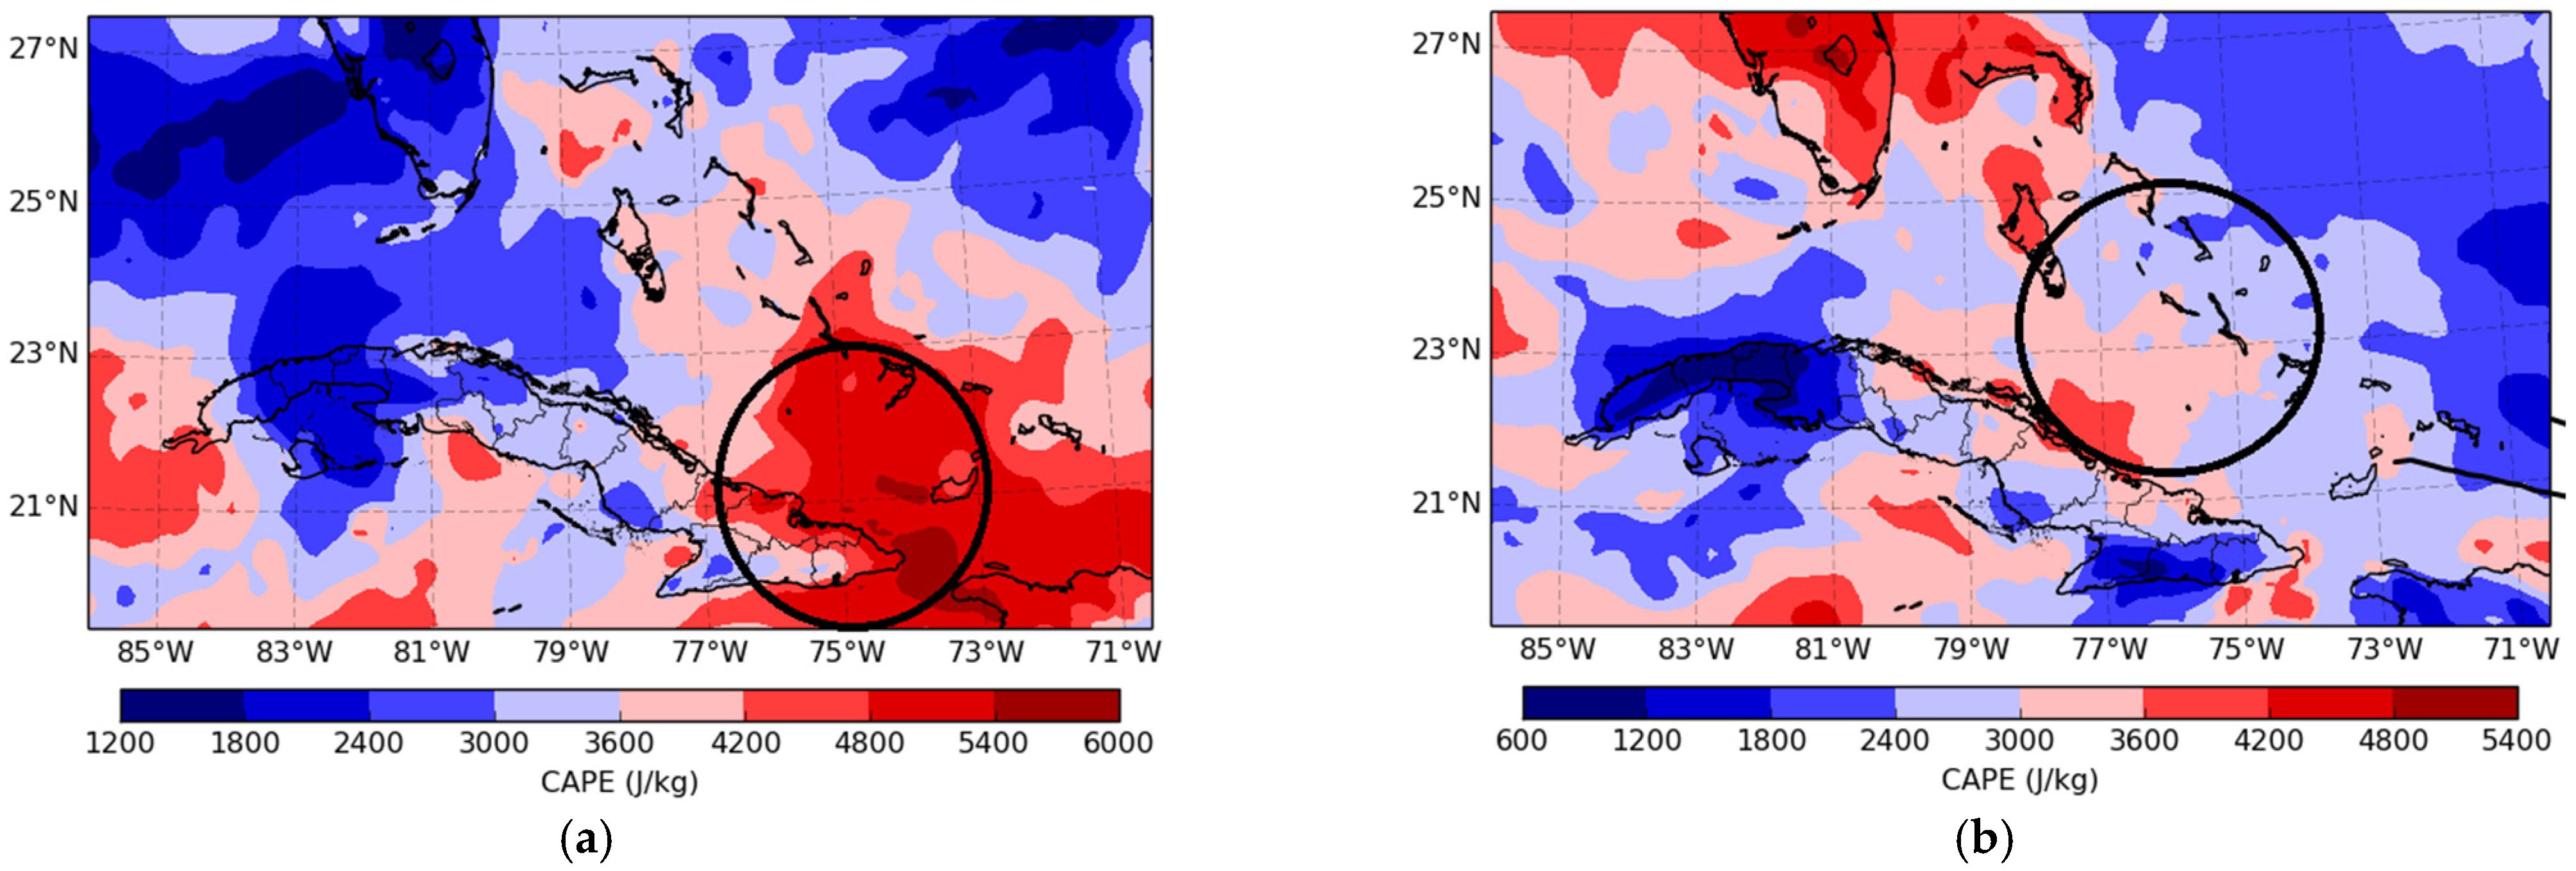
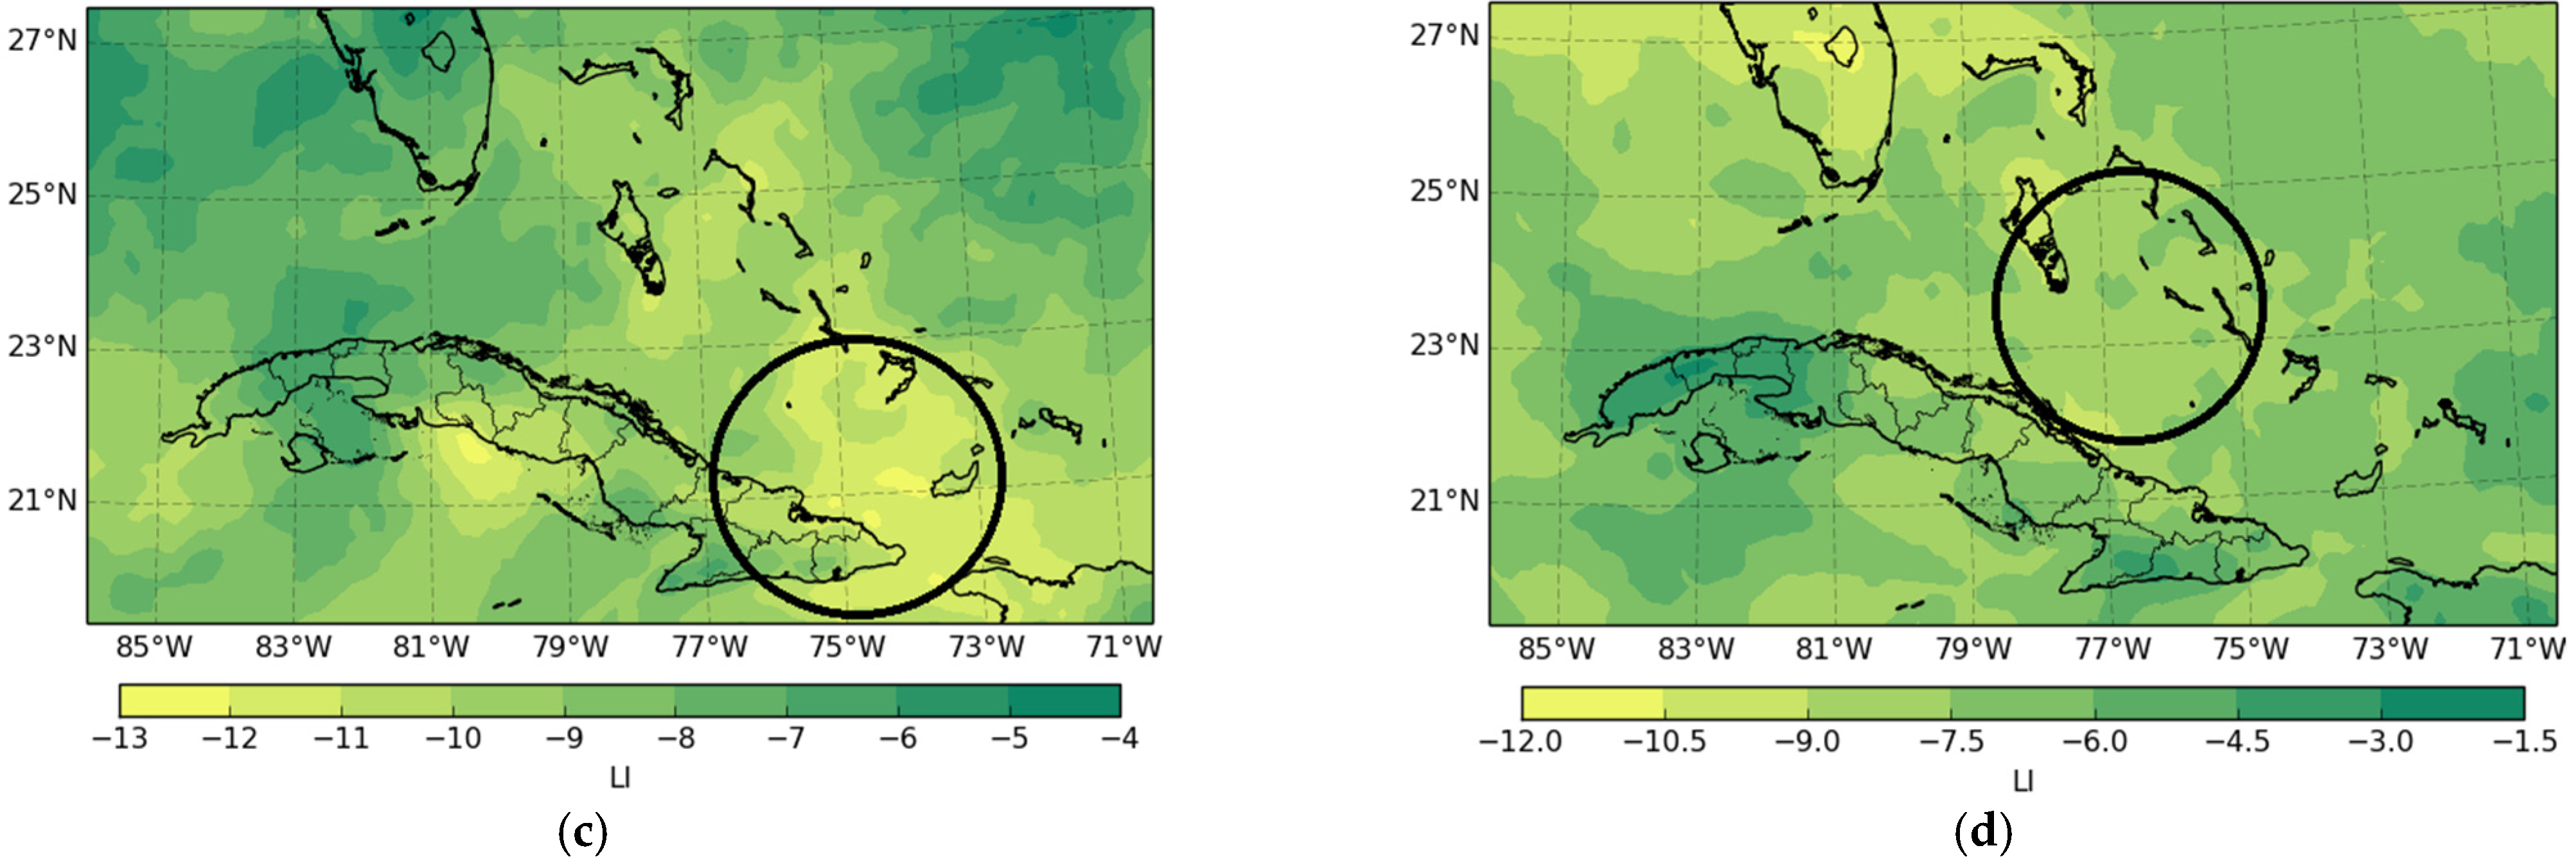
Figure 10.
Precipitable water corresponding to (a) 2 July, 1900 UTC; and (b) 16 August, 1300 UTC.
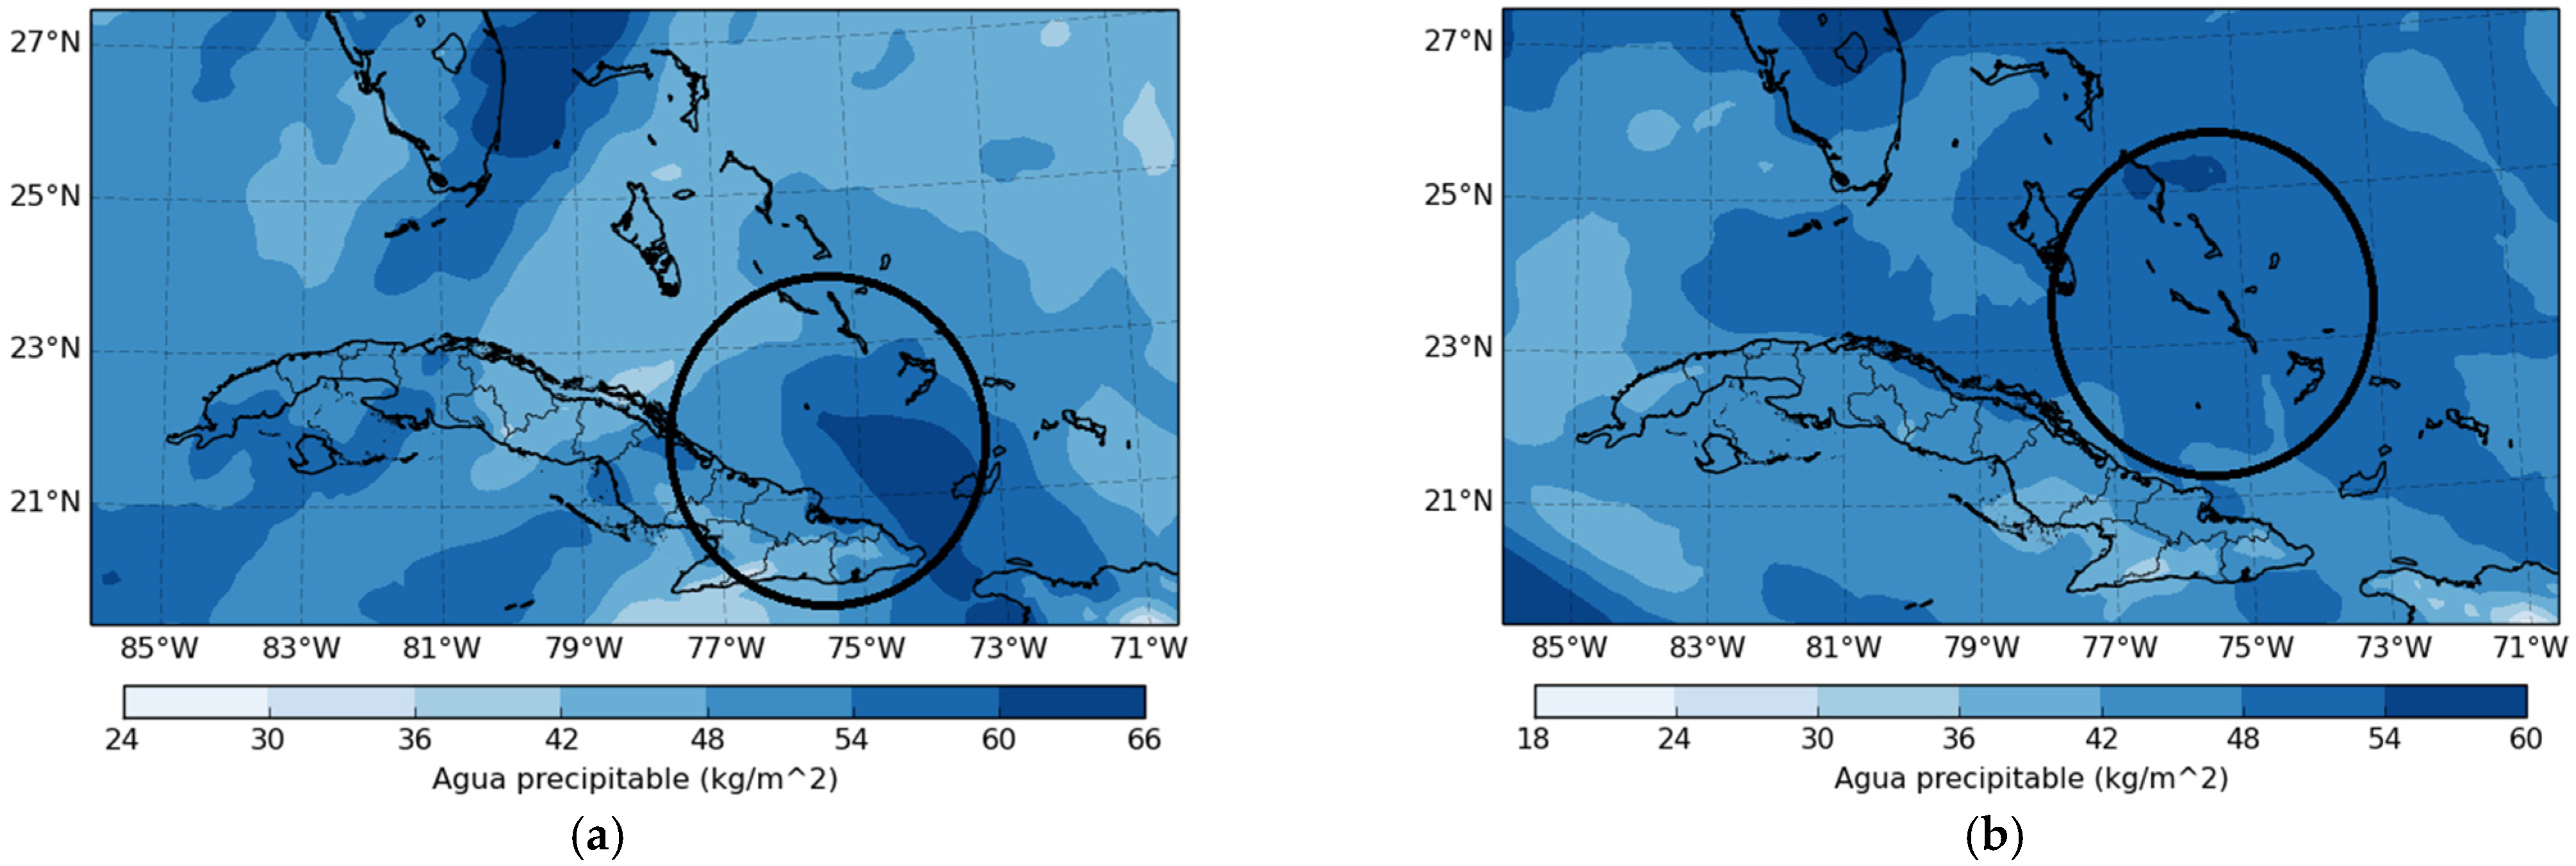
Figure 11.
Southern vertical slice of relative humidity from the WRF for (a) 2 July 2016 at 2300 UTC and (b) 3 July 2016 at 2100 UTC (b). Vertical line represents the latitude at which the storms occurred.
Figure 11.
Southern vertical slice of relative humidity from the WRF for (a) 2 July 2016 at 2300 UTC and (b) 3 July 2016 at 2100 UTC (b). Vertical line represents the latitude at which the storms occurred.
Figure 12.
(a) Radar observation, (b) southern vertical section of the mixing ratio (kg/kg) with the wind direction from the WRF and (c) satellite image (visible channel), corresponding to 3 July 2016 at 2200 UTC.
Figure 12.
(a) Radar observation, (b) southern vertical section of the mixing ratio (kg/kg) with the wind direction from the WRF and (c) satellite image (visible channel), corresponding to 3 July 2016 at 2200 UTC.
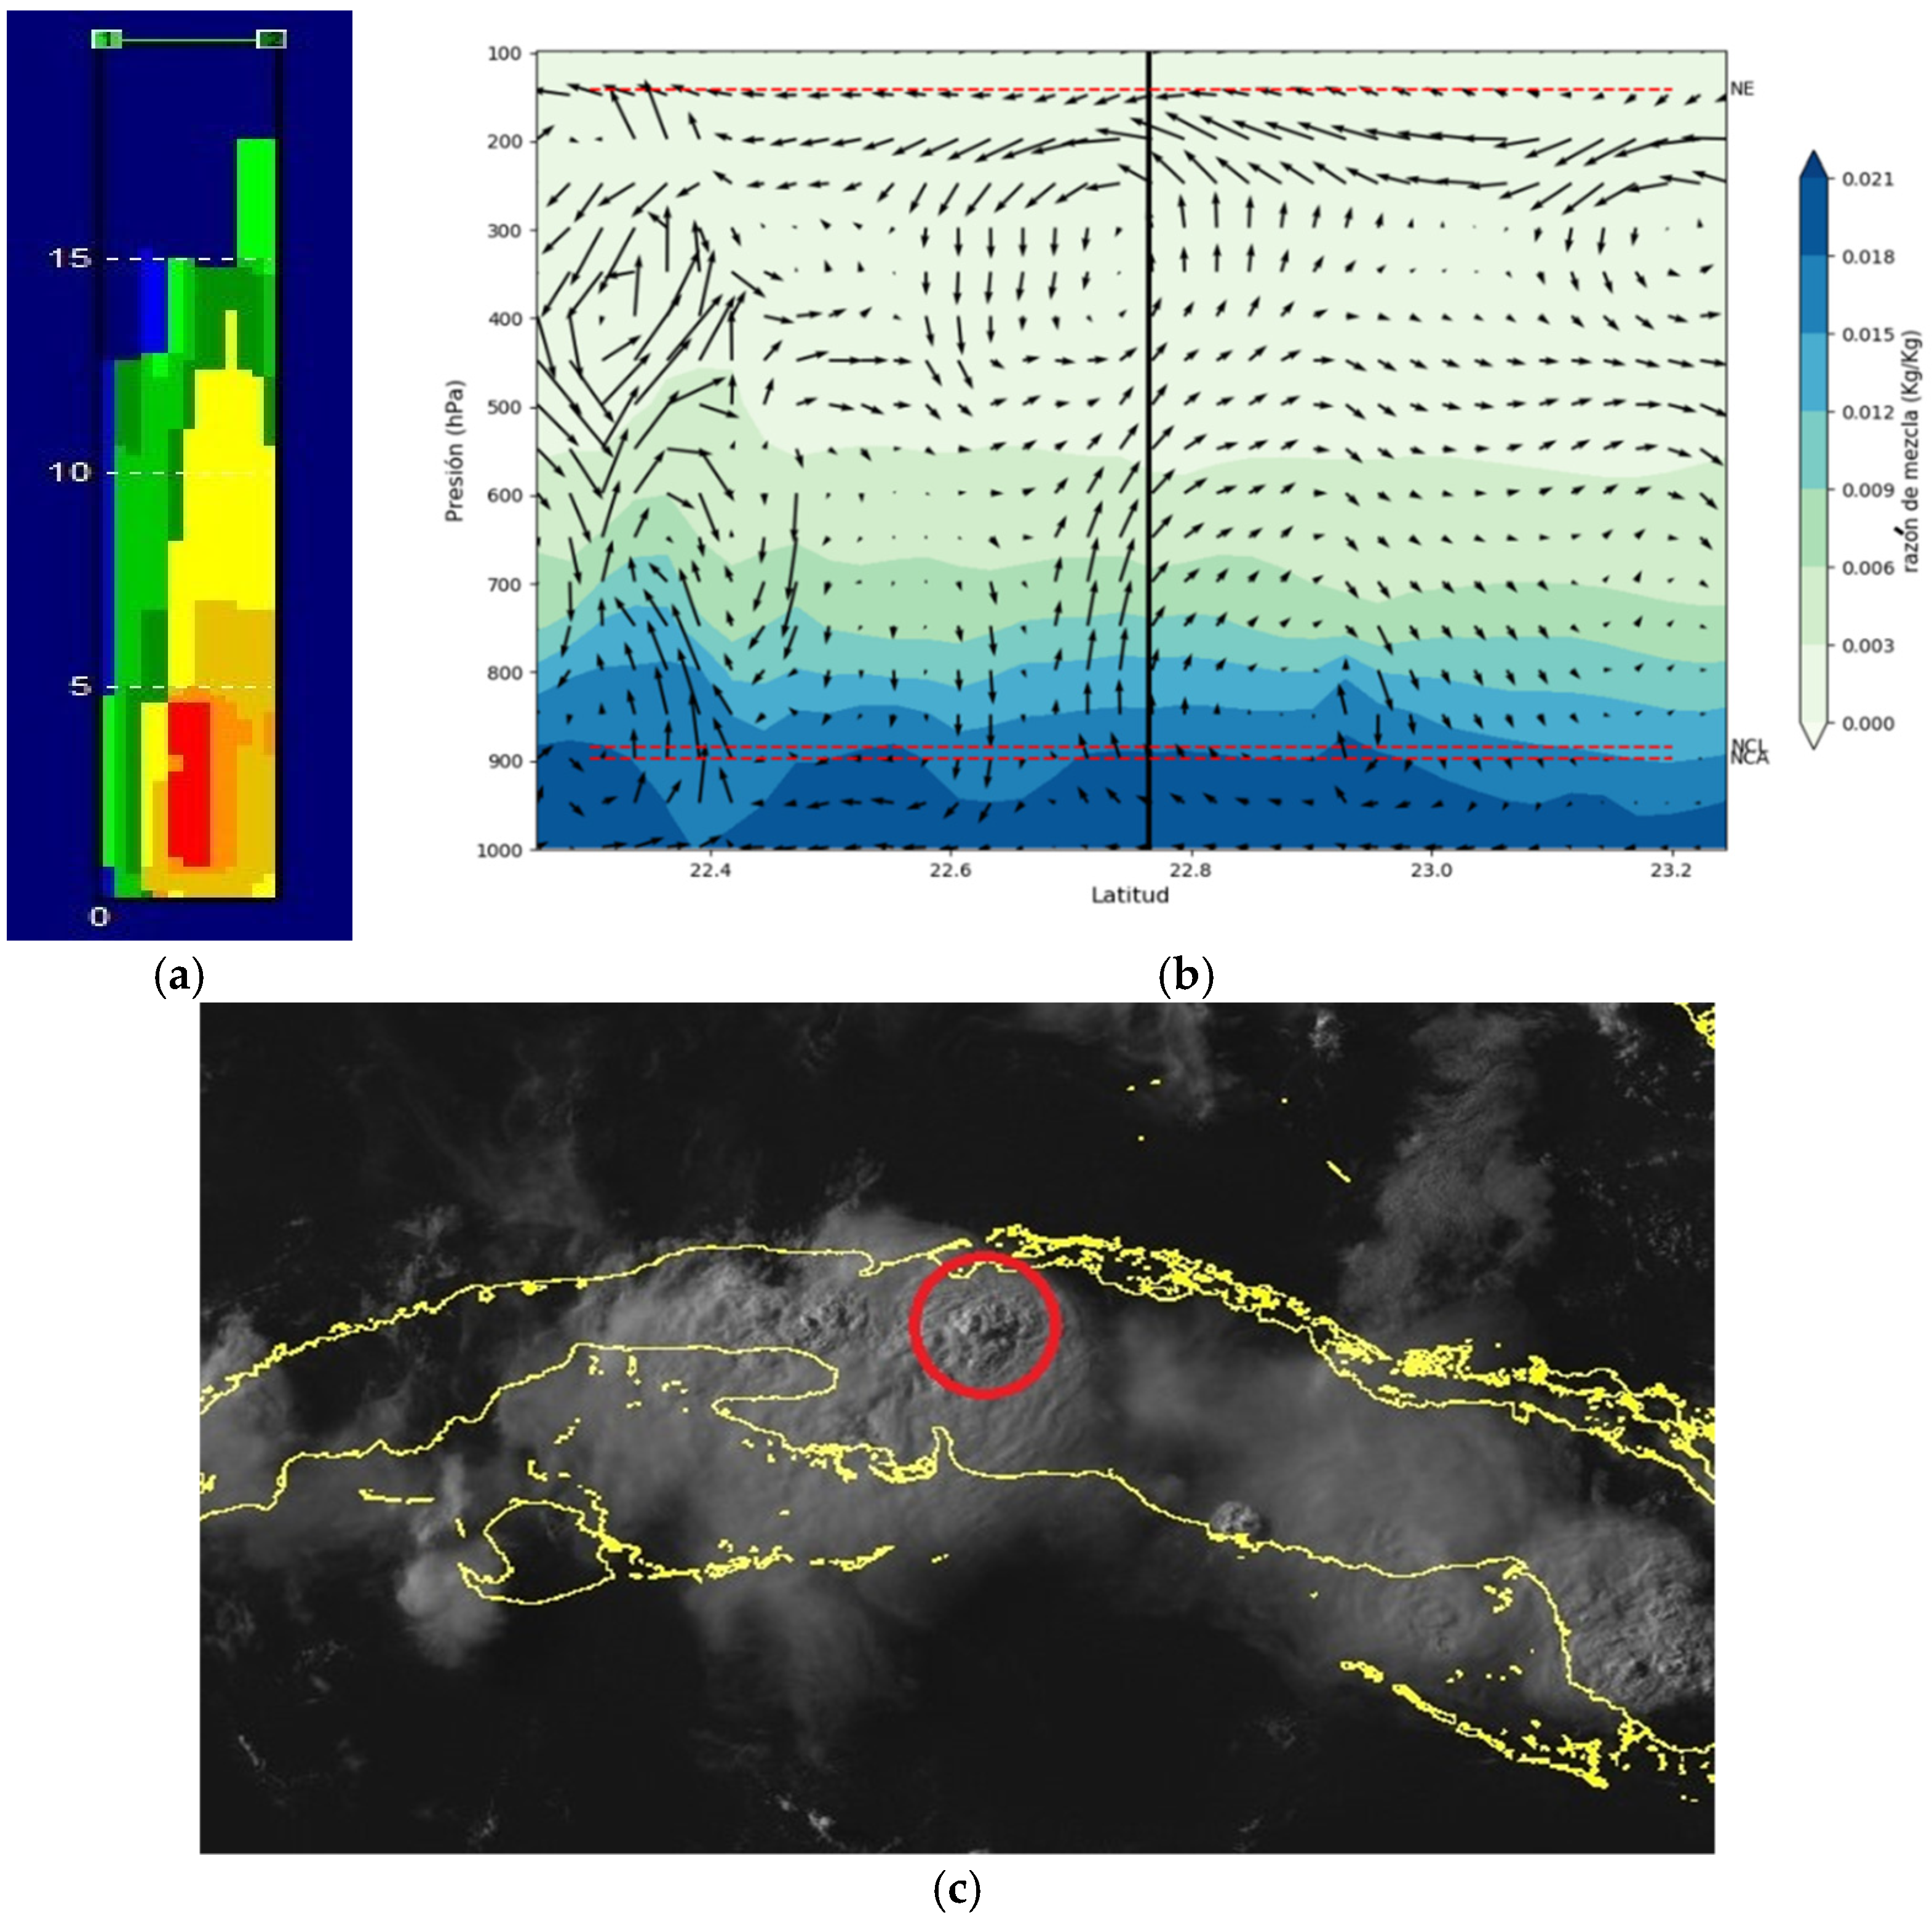
Figure 13.
Vertical wind shear in the 200–850 hPa layer from the WRF corresponding to 16 August at (a) 0100 UTC and (b) 1600 UTC. Black point represents the position where the storms occurred.
Figure 13.
Vertical wind shear in the 200–850 hPa layer from the WRF corresponding to 16 August at (a) 0100 UTC and (b) 1600 UTC. Black point represents the position where the storms occurred.
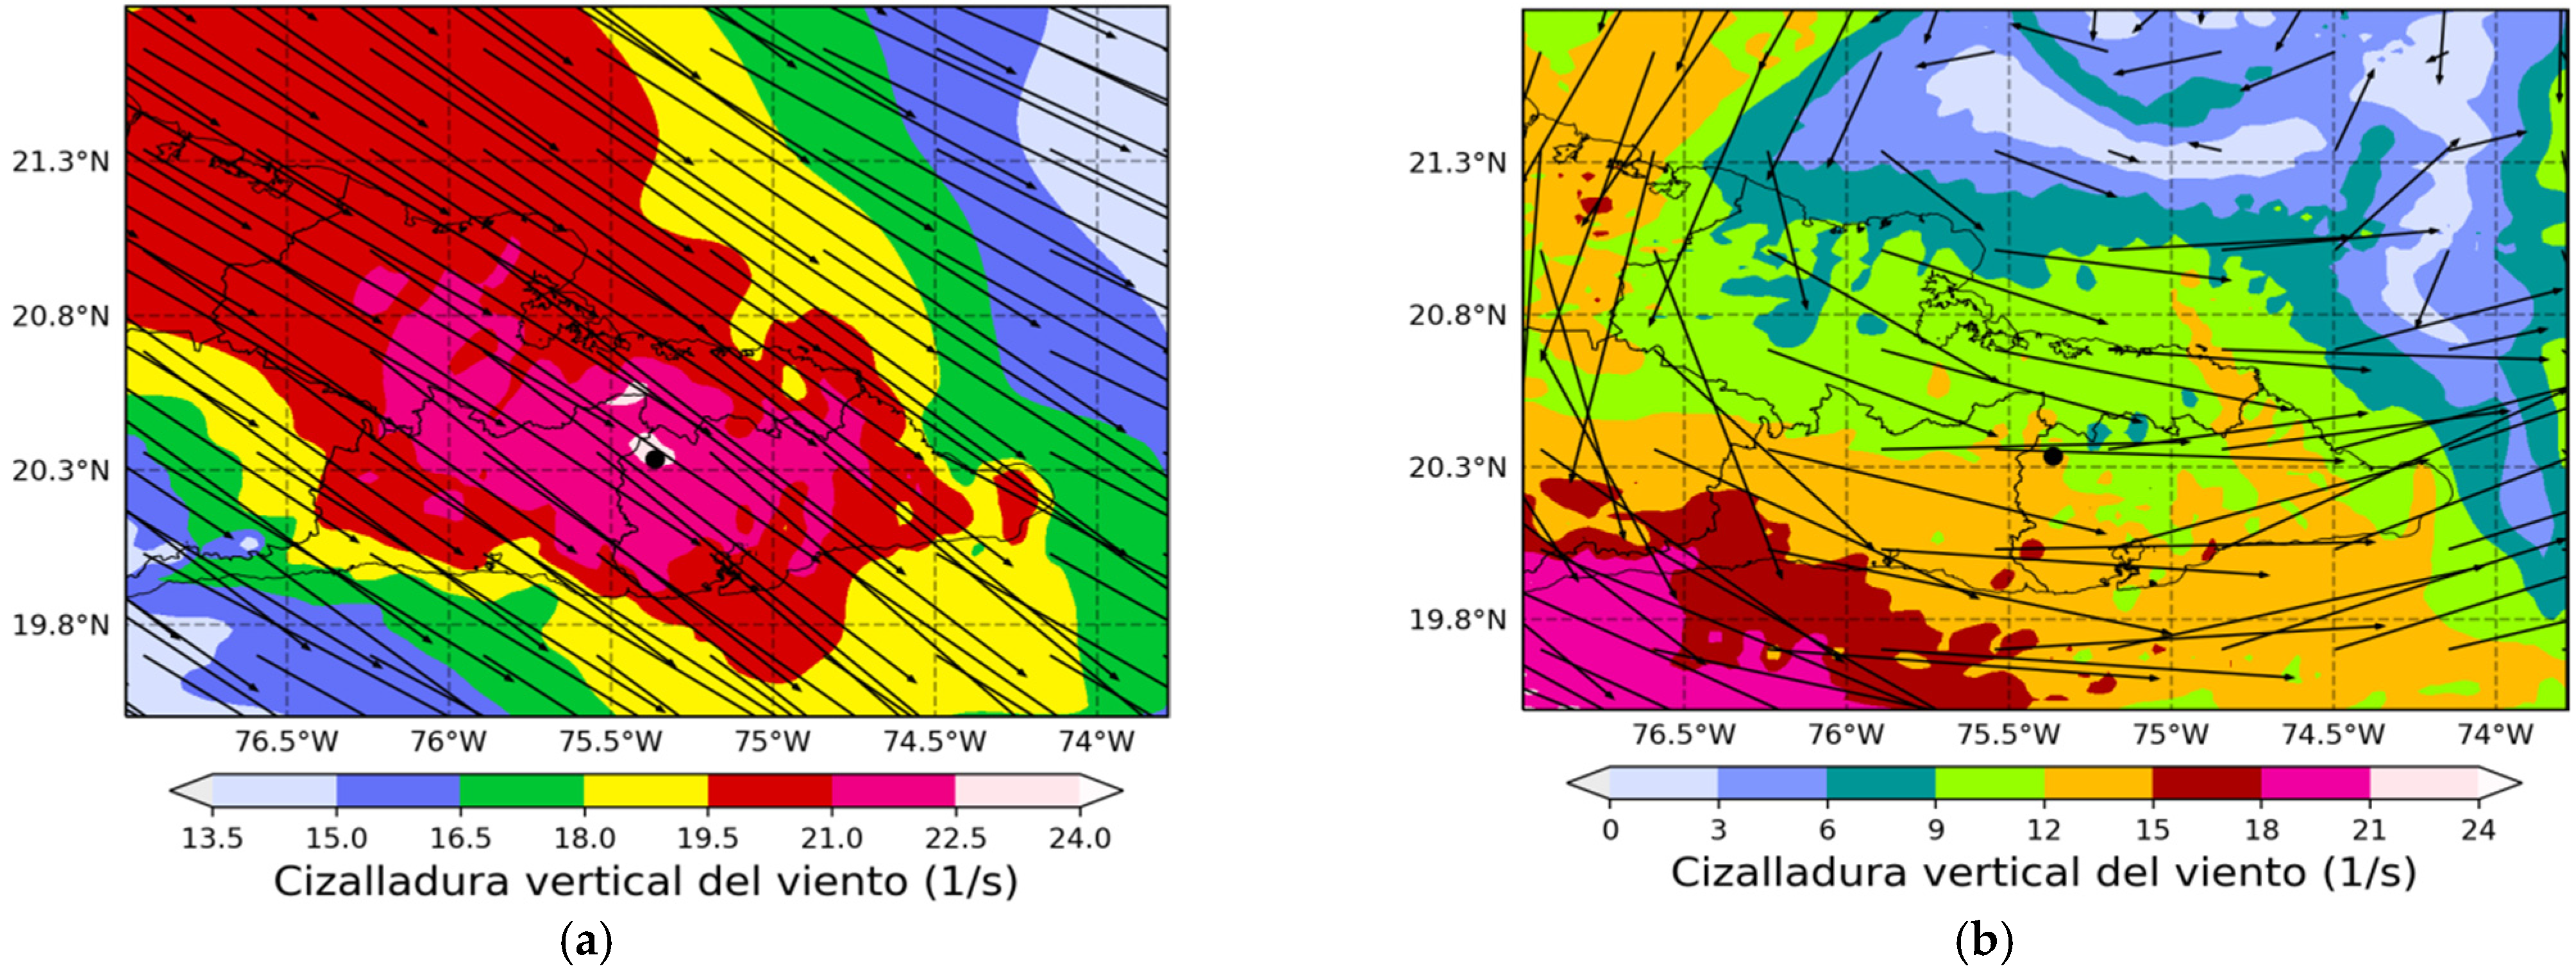
Figure 14.
(a) Relative surface vorticity from the WRF corresponding to 3 July 2016 at 2130 UTC. Black dot represents the latitude and longitude at which the storm occurred. (b) Zonal vertical section of the vorticity relative to 2200 UTC. Vertical line represents the latitude and longitude at which the storms occurred.
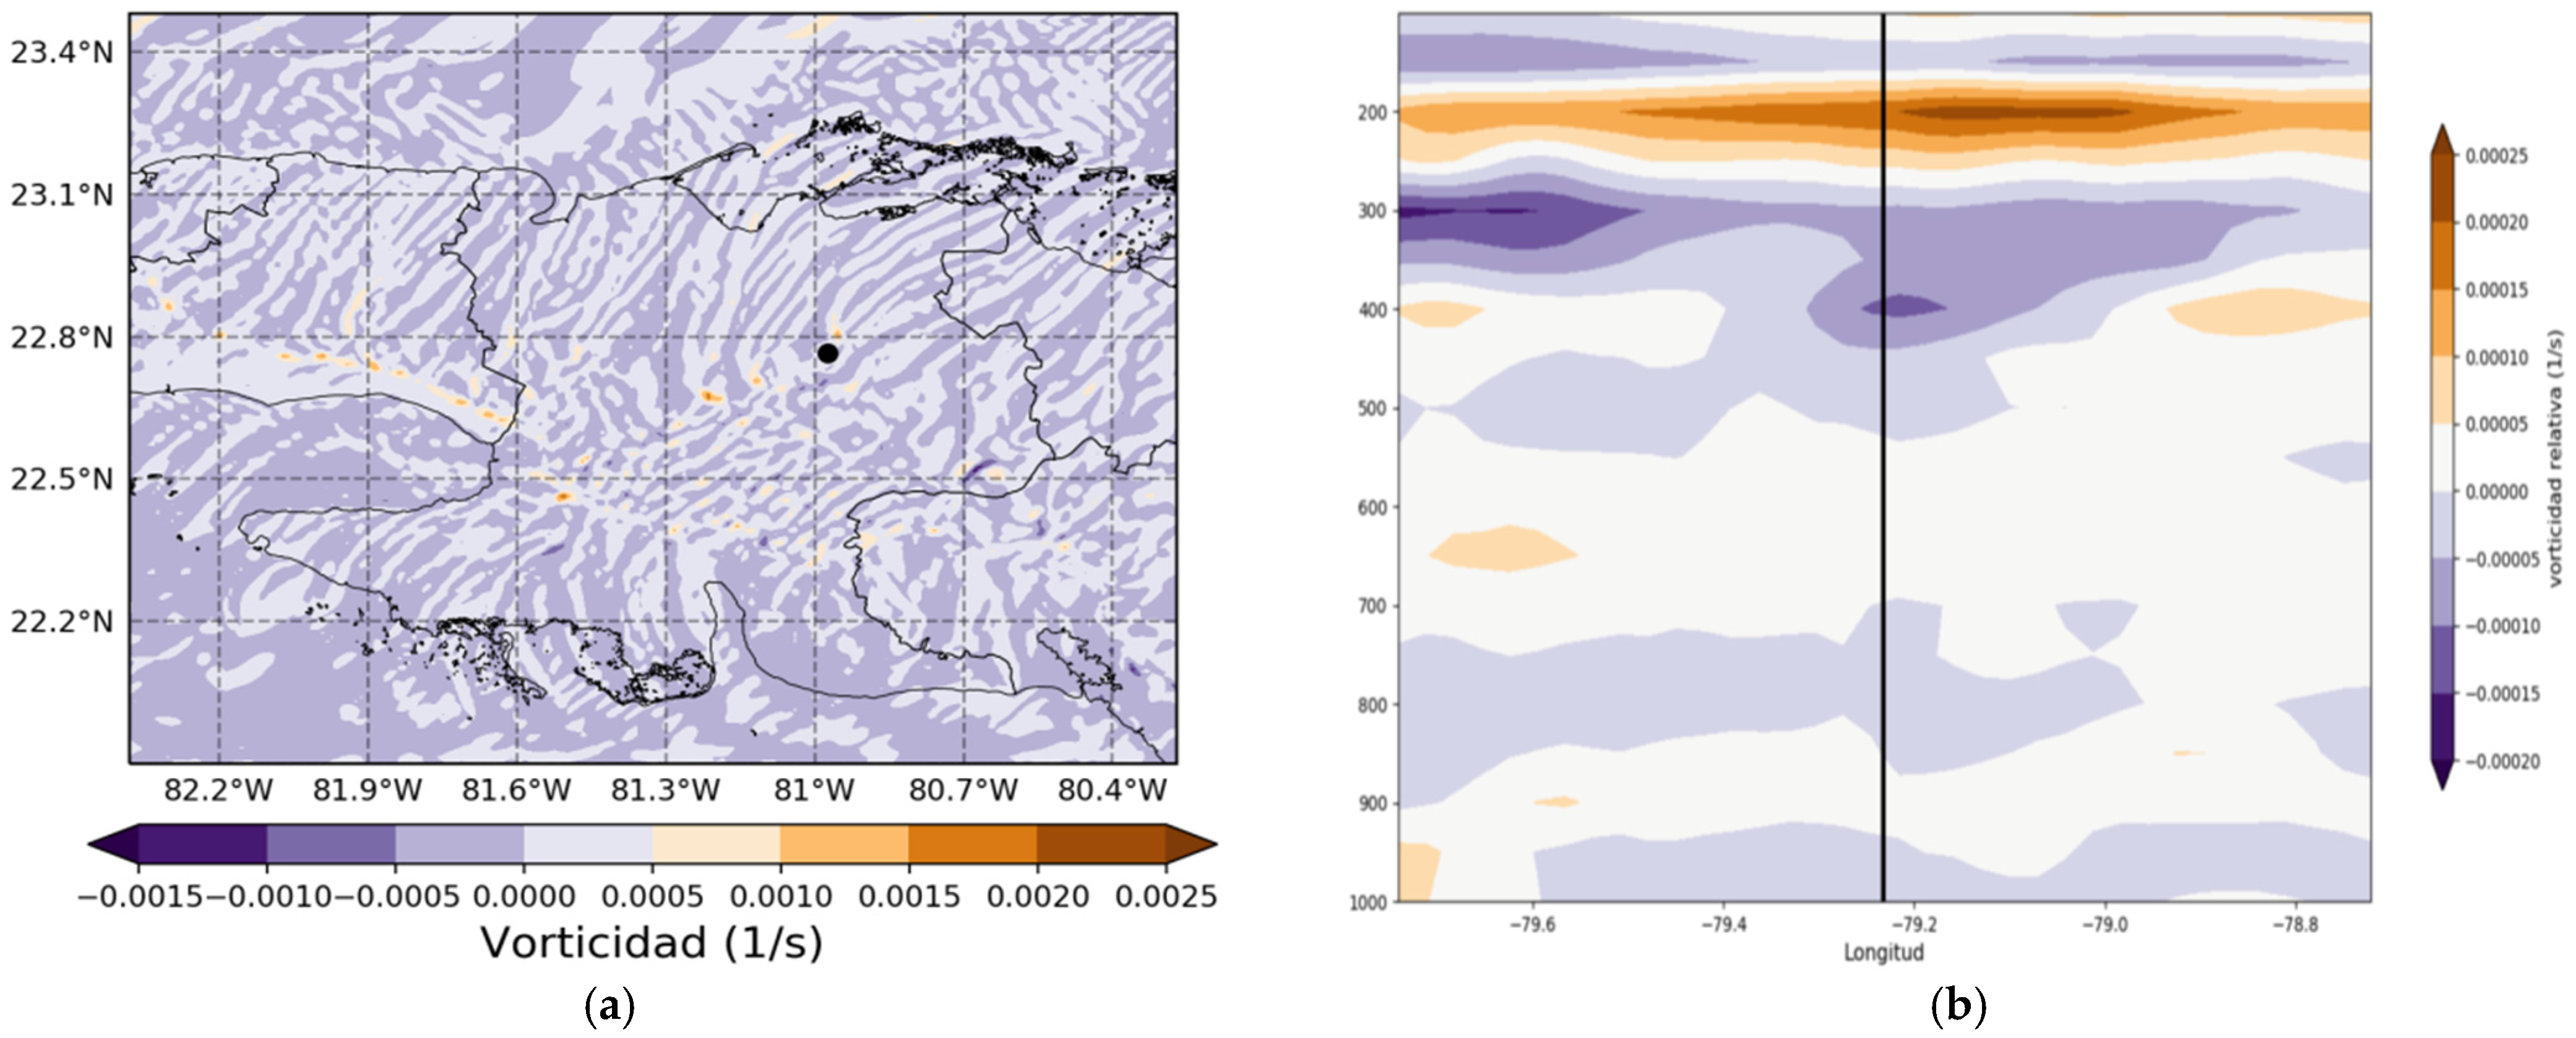
Figure 15.
(a) Surface divergence from the WRF and (b) radar image corresponding to 3 July 2016, at 2200 UTC. Black dot represents the latitude and longitude at which the storms occurred.
Figure 15.
(a) Surface divergence from the WRF and (b) radar image corresponding to 3 July 2016, at 2200 UTC. Black dot represents the latitude and longitude at which the storms occurred.
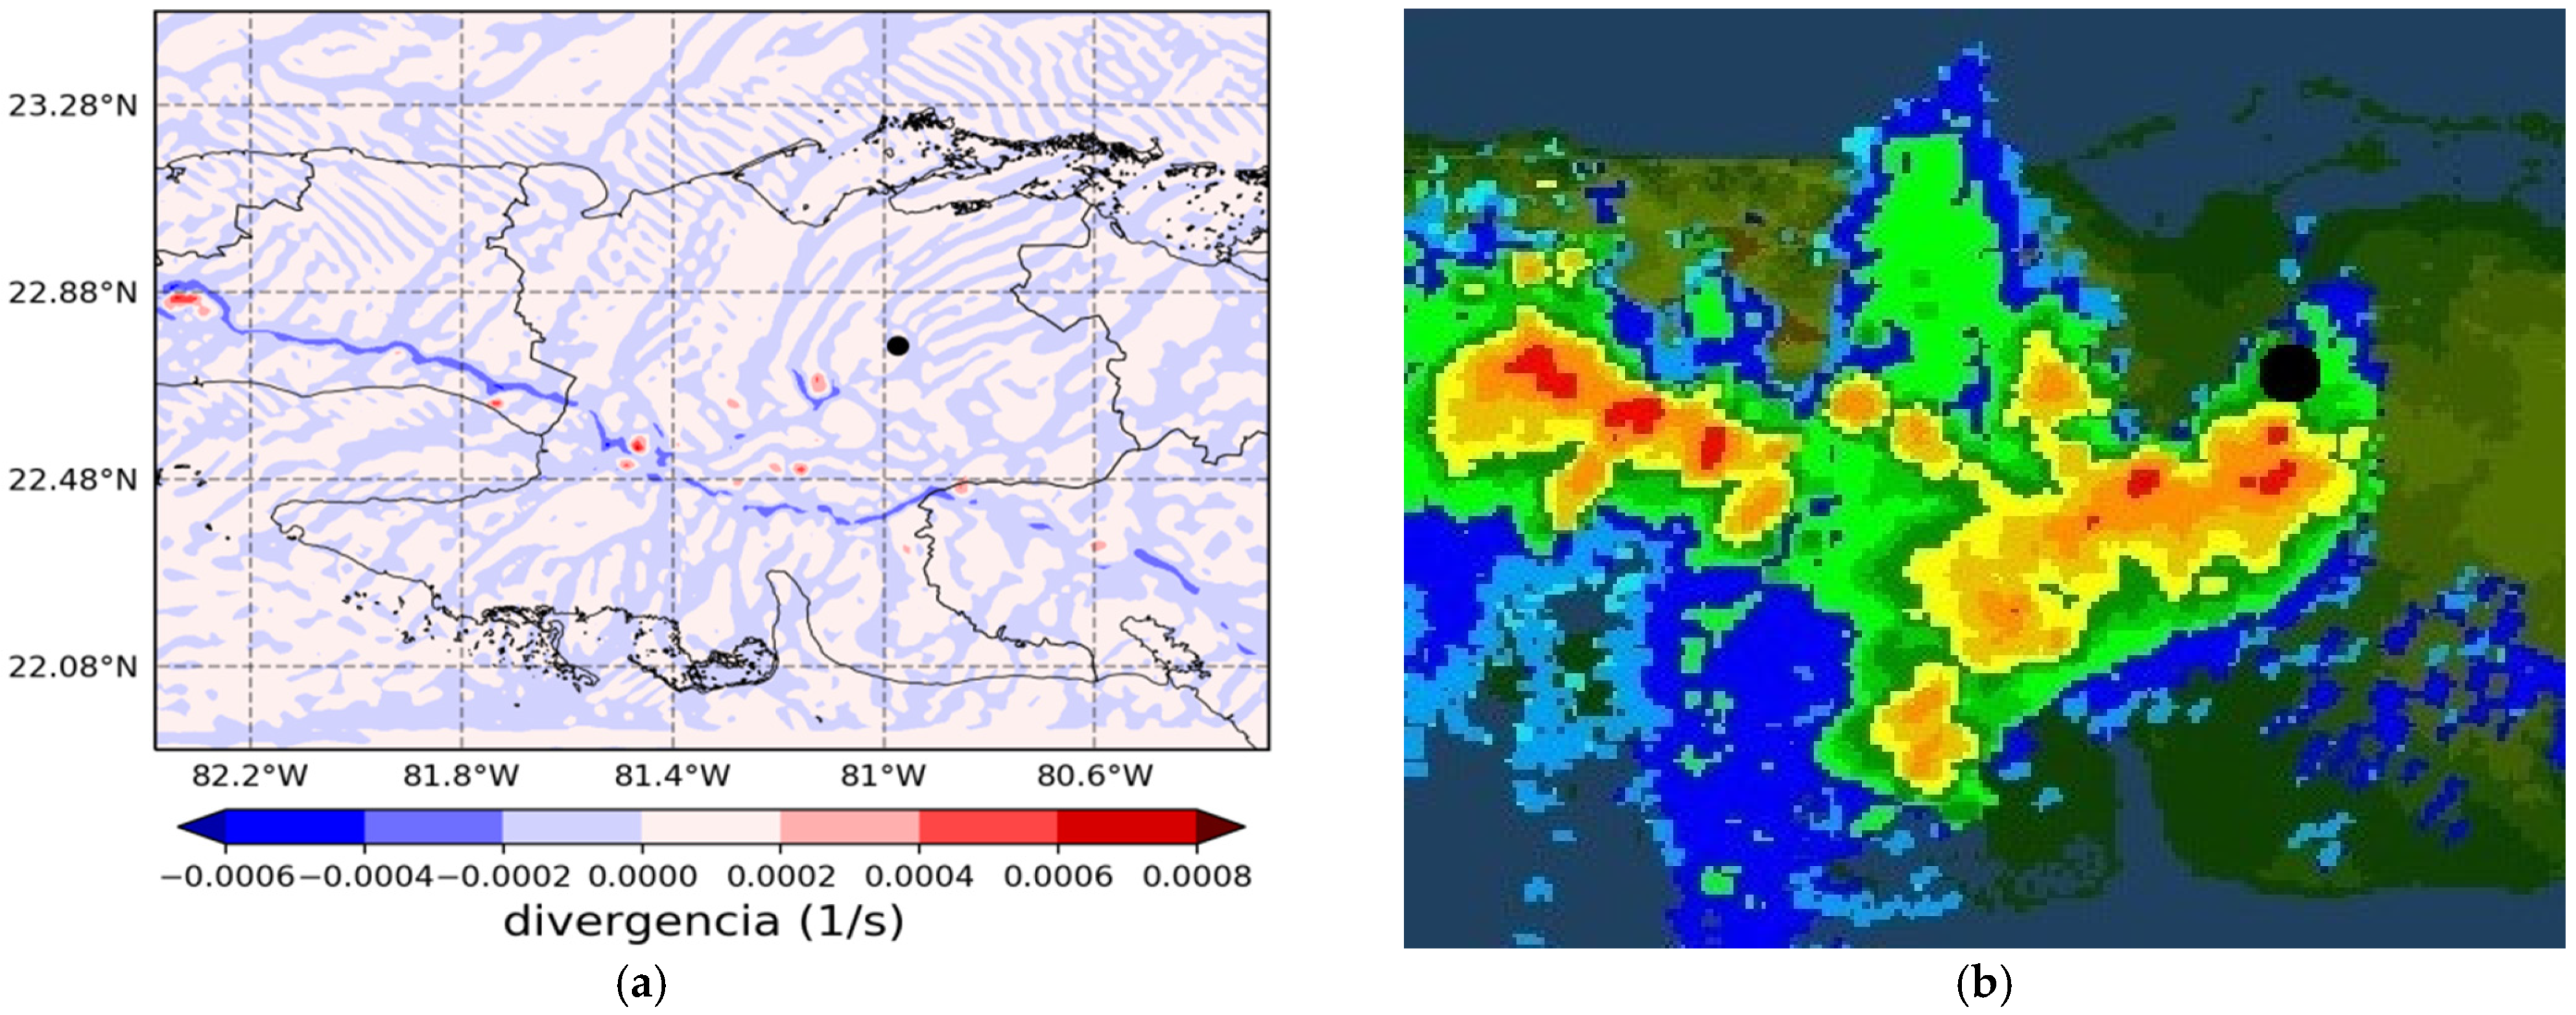
Figure 16.
Numerical probe from WRF, 3 July 2016, at 2200 UTC.

Table 1.
Spatial and temporal location of the cases of locally intense rain with their respective accumulations.
Table 1.
Spatial and temporal location of the cases of locally intense rain with their respective accumulations.
| Day | Month | Year | Location | Province | Latitude | Length | Precipitation Value (mm) | Time (h) |
|---|---|---|---|---|---|---|---|---|
| 2 | 7 | 2016 | La Sierpe | Sancti Spíritus | 21.81° | −79.23° | 101 | 24 |
| 3 | 7 | 2016 | Colón | Matanzas | 22.76° | −80.97° | 177 | 24 |
| 16 | 8 | 2016 | El Salvador | Guantánamo | 20.33° | −75.36° | 106 | 24 |
| 17 | 8 | 2016 | Batabanó | Mayabeque | 22.73° | −82.28° | 61 | 12 |
Publisher’s Note: MDPI stays neutral with regard to jurisdictional claims in published maps and institutional affiliations. |
© 2021 by the author. Licensee MDPI, Basel, Switzerland. This article is an open access article distributed under the terms and conditions of the Creative Commons Attribution (CC BY) license (https://creativecommons.org/licenses/by/4.0/).
Share and Cite
MDPI and ACS Style
Amaro, O.L. Study of Two Upper Cold Lows and Their Relationship with Locally Intense Rain. Environ. Sci. Proc. 2021, 8, 42. https://doi.org/10.3390/ecas2021-10323
AMA Style
Amaro OL. Study of Two Upper Cold Lows and Their Relationship with Locally Intense Rain. Environmental Sciences Proceedings. 2021; 8(1):42. https://doi.org/10.3390/ecas2021-10323
Chicago/Turabian StyleAmaro, Osmany Lorenzo. 2021. "Study of Two Upper Cold Lows and Their Relationship with Locally Intense Rain" Environmental Sciences Proceedings 8, no. 1: 42. https://doi.org/10.3390/ecas2021-10323